SPECTRAL CLUSTERING AND VISUALIZATION: A ... - Carl Meyer
SPECTRAL CLUSTERING AND VISUALIZATION: A ... - Carl Meyer
SPECTRAL CLUSTERING AND VISUALIZATION: A ... - Carl Meyer

Create successful ePaper yourself
Turn your PDF publications into a flip-book with our unique Google optimized e-Paper software.
CLUSTER <strong>AND</strong> DATA ANALYSIS<br />
Finding the minimum ratio cut of a graph by checking every possible collection<br />
of clusters is computationally prohibitive, but an approximation of the minimum can<br />
be found using linear algebra. Given a choice of k clusters in a graph with n vertices,<br />
let H be the n × k matrix with entries h ij = 1 if the ith vertex is in the jth<br />
√<br />
|Xj|<br />
cluster, and 0 otherwise. Minimizing the ratio cut is then equivalent to minimizing<br />
T r(H T LH) over the set of matrices H whose columns form an orthonormal basis [12],<br />
where L is the Laplacian matrix defined in equation (3.1) and T r indicates the trace<br />
of a matrix.<br />
The conditions on H being constructed with entries based on the clusters can be<br />
relaxed to be H T H = I, i.e. the columns of H form an orthonormal set of vectors<br />
(see [13]). With this new condition, it is known that the minimum of T r(H T LH)<br />
over the set of matrices H whose columns form an orthonormal basis occurs when the<br />
columns of H are the eigenvectors of L corresponding to the k smallest eigenvalues<br />
[12].<br />
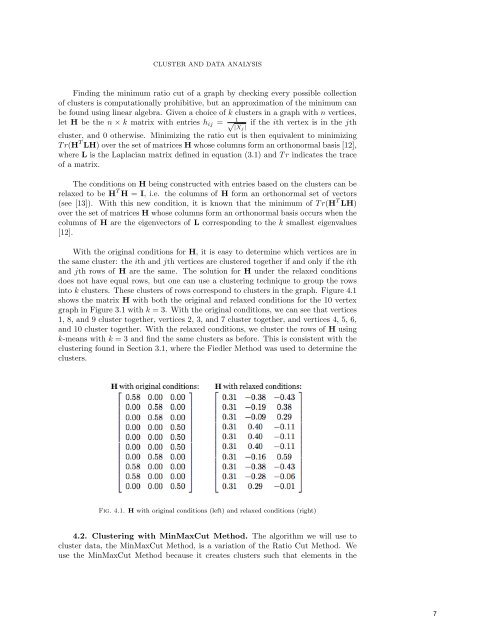
With the original conditions for H, it is easy to determine which vertices are in<br />
the same cluster: the ith and jth vertices are clustered together if and only if the ith<br />
and jth rows of H are the same. The solution for H under the relaxed conditions<br />
does not have equal rows, but one can use a clustering technique to group the rows<br />
into k clusters. These clusters of rows correspond to clusters in the graph. Figure 4.1<br />
shows the matrix H with both the original and relaxed conditions for the 10 vertex<br />
graph in Figure 3.1 with k = 3. With the original conditions, we can see that vertices<br />
1, 8, and 9 cluster together, vertices 2, 3, and 7 cluster together, and vertices 4, 5, 6,<br />
and 10 cluster together. With the relaxed conditions, we cluster the rows of H using<br />
k-means with k = 3 and find the same clusters as before. This is consistent with the<br />
clustering found in Section 3.1, where the Fiedler Method was used to determine the<br />
clusters.<br />
Fig. 4.1. H with original conditions (left) and relaxed conditions (right)<br />
4.2. Clustering with MinMaxCut Method. The algorithm we will use to<br />
cluster data, the MinMaxCut Method, is a variation of the Ratio Cut Method. We<br />
use the MinMaxCut Method because it creates clusters such that elements in the<br />
7