SPECTRAL CLUSTERING AND VISUALIZATION: A ... - Carl Meyer
SPECTRAL CLUSTERING AND VISUALIZATION: A ... - Carl Meyer
SPECTRAL CLUSTERING AND VISUALIZATION: A ... - Carl Meyer

Create successful ePaper yourself
Turn your PDF publications into a flip-book with our unique Google optimized e-Paper software.
BENSON-PUTNINS, BONFARDIN, MAGNONI, <strong>AND</strong> MARTIN<br />
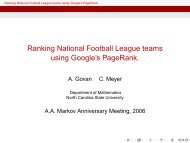
Fig. 2.1. Graph corresponding to consensus matrix from Section 2.2<br />
origins of spectral graph partitioning methods; methods that use the spectral, or<br />
eigen, properties of a matrix to identify clusters.<br />
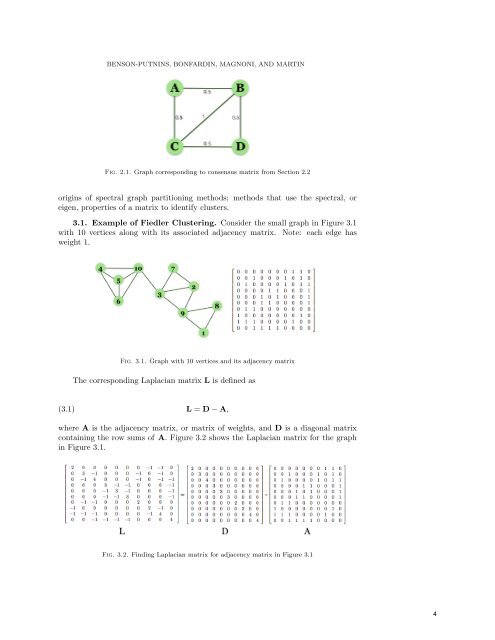
3.1. Example of Fiedler Clustering. Consider the small graph in Figure 3.1<br />
with 10 vertices along with its associated adjacency matrix. Note: each edge has<br />
weight 1.<br />
Fig. 3.1. Graph with 10 vertices and its adjacency matrix<br />
The corresponding Laplacian matrix L is defined as<br />
(3.1)<br />
L = D − A,<br />
where A is the adjacency matrix, or matrix of weights, and D is a diagonal matrix<br />
containing the row sums of A. Figure 3.2 shows the Laplacian matrix for the graph<br />
in Figure 3.1.<br />
Fig. 3.2. Finding Laplacian matrix for adjacency matrix in Figure 3.1<br />
4