Uncertainty in hydrological models - IMAGe
Uncertainty in hydrological models - IMAGe
Uncertainty in hydrological models - IMAGe

You also want an ePaper? Increase the reach of your titles
YUMPU automatically turns print PDFs into web optimized ePapers that Google loves.
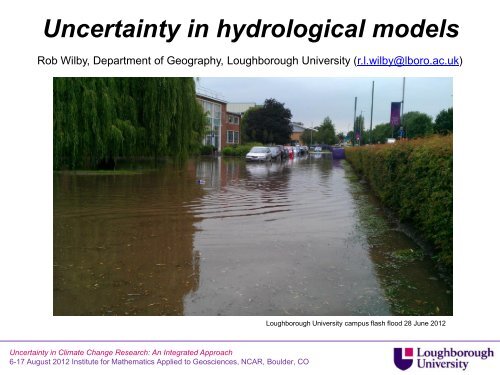
<strong>Uncerta<strong>in</strong>ty</strong> <strong>in</strong> <strong>hydrological</strong> <strong>models</strong><br />
Rob Wilby, Department of Geography, Loughborough University (r.l.wilby@lboro.ac.uk)<br />
Loughborough University campus flash flood 28 June 2012<br />
<strong>Uncerta<strong>in</strong>ty</strong> <strong>in</strong> Climate Change Research: An Integrated Approach<br />
6-17 August 2012 Institute for Mathematics Applied to Geosciences, NCAR, Boulder, CO
Certa<strong>in</strong>ty (flood risk)<br />
Lecture theatre<br />
Source: Environment Agency<br />
<strong>Uncerta<strong>in</strong>ty</strong> <strong>in</strong> Climate Change Research: An Integrated Approach<br />
6-17 August 2012 Institute for Mathematics Applied to Geosciences, NCAR, Boulder, CO
Certa<strong>in</strong>ty (flood risk)<br />
Source: Adaptation Sub Committee (2011)<br />
<strong>Uncerta<strong>in</strong>ty</strong> <strong>in</strong> Climate Change Research: An Integrated Approach<br />
6-17 August 2012 Institute for Mathematics Applied to Geosciences, NCAR, Boulder, CO
Certa<strong>in</strong>ty<br />
(atmospheric rivers)<br />
The 900 hPa specific humidity fields at 0600 UTC for the top 10<br />
w<strong>in</strong>ter flood events on the River Eden at Temple Sowerby (left)<br />
and AR location for top 10 w<strong>in</strong>ter floods <strong>in</strong> selected catchments.<br />
Source: Lavers et al. (2011)<br />
<strong>Uncerta<strong>in</strong>ty</strong> <strong>in</strong> Climate Change Research: An Integrated Approach<br />
6-17 August 2012 Institute for Mathematics Applied to Geosciences, NCAR, Boulder, CO
<strong>Uncerta<strong>in</strong>ty</strong> “hierarchy” (future risks)<br />
First order forc<strong>in</strong>gs<br />
Climate <strong>models</strong><br />
Regional consequences<br />
Downscal<strong>in</strong>g<br />
•Empirical<br />
•Dynamical<br />
Feedbacks<br />
•Land use<br />
•Adaptations<br />
Impact model<br />
•Structure<br />
•Parameters<br />
<strong>Uncerta<strong>in</strong>ty</strong> <strong>in</strong> Climate Change Research: An Integrated Approach<br />
6-17 August 2012 Institute for Mathematics Applied to Geosciences, NCAR, Boulder, CO
Typical f<strong>in</strong>d<strong>in</strong>g of assessments:<br />
“much greater tendency for <strong>in</strong>creas<strong>in</strong>g flood risk”<br />
GCMs under two emissions scenarios (A1B and A1B-2016-5-L), at four time horizons.<br />
The plots show the 25th, 50th, and 75th percentiles (represented by the boxes), and the<br />
maximum and m<strong>in</strong>imum values (shown by the extent of the whiskers).<br />
Source: Warren et al. (2010) from AVOID programme<br />
<strong>Uncerta<strong>in</strong>ty</strong> <strong>in</strong> Climate Change Research: An Integrated Approach<br />
6-17 August 2012 Institute for Mathematics Applied to Geosciences, NCAR, Boulder, CO
National CCRA headl<strong>in</strong>e threats<br />
<strong>Uncerta<strong>in</strong>ty</strong> <strong>in</strong> Climate Change Research: An Integrated Approach<br />
6-17 August 2012 Institute for Mathematics Applied to Geosciences, NCAR, Boulder, CO
Hydrological model uncerta<strong>in</strong>ty <strong>in</strong> perspective<br />
<strong>Uncerta<strong>in</strong>ty</strong> <strong>in</strong> Climate Change Research: An Integrated Approach<br />
6-17 August 2012 Institute for Mathematics Applied to Geosciences, NCAR, Boulder, CO
Global water balance (Sv)<br />
BCCR-BCM2.0<br />
CCSM3<br />
CGCM3.1<br />
CNRM-CM3<br />
CSIRO-MK3.0<br />
ECHAM5-MPI-OM<br />
ECHO-G<br />
FGOALS-g1.0<br />
GFDL-CM2.0<br />
GISS-EH<br />
GISS-ER<br />
INM-CM3.0<br />
IPSL-CM4<br />
MIROC3.2<br />
MRI-CGCM2.3.2<br />
PCM-NCAR<br />
HadCM3<br />
HadGEM1<br />
Input uncerta<strong>in</strong>ty (GCMs)<br />
0.1<br />
0.08<br />
0.06<br />
0.04<br />
0.02<br />
0<br />
-0.02<br />
-0.04<br />
-0.06<br />
-0.08<br />
-0.1<br />
E > P<br />
P > E<br />
„Ghost‟ moisture sources: Global annual mean residual of the atmospheric water balance (E – P – dw/dt)<br />
for CMIP3 climate <strong>models</strong>. One Sverdrup (Sv) is 10 6 m 3 s -1 or 31,600 km 3 yr -1 . Note that four climate<br />
<strong>models</strong> have residuals > 0.1 Sv. For comparison, observed atmospheric moisture transport from ocean to<br />
land is estimated to be 1.2 Sv. Data from Liepert and Previdi (2012).<br />
<strong>Uncerta<strong>in</strong>ty</strong> <strong>in</strong> Climate Change Research: An Integrated Approach<br />
6-17 August 2012 Institute for Mathematics Applied to Geosciences, NCAR, Boulder, CO
Evaluat<strong>in</strong>g „fitness‟ for <strong>hydrological</strong> tasks<br />
Pr<strong>in</strong>ciples for climate model evaluation<br />
1. Quantify the uncerta<strong>in</strong>ty <strong>in</strong> the observed data used for model<br />
evaluation (homogeneity, confidence <strong>in</strong>tervals, outliers)<br />
2. Compare like with like (grid to grid, scale to scale)<br />
3. Select <strong>in</strong>dicators of performance relevant to the <strong>in</strong>tended<br />
<strong>hydrological</strong> applications (extremes, low-frequency variability)<br />
4. Evaluate climate <strong>models</strong> relative to other components of<br />
<strong>hydrological</strong> uncerta<strong>in</strong>ty (impact model, weight<strong>in</strong>g)<br />
5. Test comb<strong>in</strong>ed climate, downscal<strong>in</strong>g and <strong>hydrological</strong> model<br />
skill us<strong>in</strong>g near-term applications (seasonal forecasts)<br />
Indicators for evaluation of climate model outputs from the perspective<br />
of <strong>hydrological</strong> applications. Source: Wilby (2010)<br />
<strong>Uncerta<strong>in</strong>ty</strong> <strong>in</strong> Climate Change Research: An Integrated Approach<br />
6-17 August 2012 Institute for Mathematics Applied to Geosciences, NCAR, Boulder, CO
Z-score<br />
Trends consistent with GCMs?<br />
4<br />
3<br />
2<br />
1<br />
0<br />
-1<br />
-2<br />
-3<br />
-4<br />
1861 1871 1881 1891 1901 1911 1921 1931 1941 1951 1961 1971<br />
Dee<br />
Derwent<br />
Eden1<br />
Eden2<br />
Exe<br />
Itchen<br />
Medway<br />
Ouse<br />
Tee<br />
Teifi<br />
Thames<br />
Tyne<br />
Wensum<br />
Wharfe<br />
Wye<br />
Average<br />
Mann-Kendall test for significant trends (Z s ) <strong>in</strong> area-average w<strong>in</strong>ter ra<strong>in</strong>fall<br />
for 15 river bas<strong>in</strong>s <strong>in</strong> England and Wales. Source: Wilby (2006)<br />
<strong>Uncerta<strong>in</strong>ty</strong> <strong>in</strong> Climate Change Research: An Integrated Approach<br />
6-17 August 2012 Institute for Mathematics Applied to Geosciences, NCAR, Boulder, CO
Time of day<br />
Time of day<br />
1988<br />
1989<br />
1990<br />
1991<br />
1992<br />
1993<br />
1994<br />
1995<br />
1996<br />
1997<br />
1998<br />
1999<br />
2000<br />
2001<br />
2002<br />
2003<br />
2004<br />
2005<br />
2006<br />
2007<br />
2008<br />
2009<br />
2010<br />
Confound<strong>in</strong>g factors Glutton (observer practices)<br />
1800<br />
1600<br />
1400<br />
1200<br />
1000<br />
800<br />
Environment Agency water temperature measurement times at Glutton on the River Dove.<br />
The black l<strong>in</strong>e shows the mov<strong>in</strong>g average of 12 samples. A shift <strong>in</strong> sampl<strong>in</strong>g time of 2 hours<br />
between 1990s and 2000s equates to a warm<strong>in</strong>g of ~0.7°C. Source: Toone et al. (2011)<br />
<strong>Uncerta<strong>in</strong>ty</strong> <strong>in</strong> Climate Change Research: An Integrated Approach<br />
6-17 August 2012 Institute for Mathematics Applied to Geosciences, NCAR, Boulder, CO
Confound<strong>in</strong>g factors (river regulation)<br />
<strong>Uncerta<strong>in</strong>ty</strong> <strong>in</strong> Climate Change Research: An Integrated Approach<br />
6-17 August 2012 Institute for Mathematics Applied to Geosciences, NCAR, Boulder, CO
Cumulative discharge (km3)<br />
Cumulative discharge (km3)<br />
Confound<strong>in</strong>g factors (known unknowns)<br />
Q = (A.P.k) + (G.ΔT) – (A.E) ± S ± D<br />
Observed<br />
Modelled<br />
Q is the discharge (km 3 ),<br />
A is the bas<strong>in</strong> area (km 2 ),<br />
P is the annual precipitation (km),<br />
k is a scal<strong>in</strong>g factor,<br />
G is the total snow and glacier melt per year<br />
ΔT degree temperature change (km 3 /yr/°C),<br />
E is the annual evaporation total (km),<br />
S is upstream storage change (km 3 ),<br />
D is diversions for irrigation or effluent (km 3 ).<br />
1200<br />
1000<br />
800<br />
600<br />
400<br />
200<br />
0<br />
1200<br />
1000<br />
800<br />
600<br />
400<br />
200<br />
0<br />
Syr Darya to Aqjar<br />
1960 1970 1980 1990 2000 2010<br />
Observed Modelled<br />
Vakhsh to Darband<br />
1960 1970 1980 1990 2000 2010<br />
<strong>Uncerta<strong>in</strong>ty</strong> <strong>in</strong> Climate Change Research: An Integrated Approach<br />
6-17 August 2012 Institute for Mathematics Applied to Geosciences, NCAR, Boulder, CO
Confound<strong>in</strong>g factors (known unknowns)<br />
<strong>Uncerta<strong>in</strong>ty</strong> <strong>in</strong> Climate Change Research: An Integrated Approach<br />
6-17 August 2012 Institute for Mathematics Applied to Geosciences, NCAR, Boulder, CO
Hydrological <strong>models</strong><br />
Input uncerta<strong>in</strong>ty<br />
Structure uncerta<strong>in</strong>ty<br />
1. Empirical/statistical<br />
2. Water balance<br />
3. Conceptual<br />
4. Physically based<br />
Parameter uncerta<strong>in</strong>ty<br />
<strong>Uncerta<strong>in</strong>ty</strong> <strong>in</strong> Climate Change Research: An Integrated Approach<br />
6-17 August 2012 Institute for Mathematics Applied to Geosciences, NCAR, Boulder, CO
Input uncerta<strong>in</strong>ty<br />
<strong>Uncerta<strong>in</strong>ty</strong> <strong>in</strong> Climate Change Research: An Integrated Approach<br />
6-17 August 2012 Institute for Mathematics Applied to Geosciences, NCAR, Boulder, CO
Mean daily discharge (m3/s)<br />
Snowmelt Runoff Model (SRM)<br />
Q n+1 = [C Sn · α n (T n + ΔT n ) S n + C R · P n ] A · v (1 – k n-1 ) + [Q n · r n+1 ]<br />
LapseRate<br />
Tcrit<br />
0.8<br />
3<br />
0.6<br />
0.4<br />
0.2<br />
0<br />
01 02 03 04 05 06 07 08 09 10 11 12<br />
2<br />
1<br />
0<br />
01 02 03 04 05 06 07 08 09 10 11 12<br />
1200<br />
1000<br />
800<br />
Observed<br />
SRM<br />
DDF<br />
0.8<br />
0.6<br />
0.4<br />
0.2<br />
0<br />
01 02 03 04 05 06 07 08 09 10 11 12<br />
Cr<br />
0.6<br />
0.4<br />
0.2<br />
0<br />
01 02 03 04 05 06 07 08 09 10 11 12<br />
Cs<br />
1<br />
0.8<br />
0.6<br />
0.4<br />
0.2<br />
0<br />
01 02 03 04 05 06 07 08 09 10 11 12<br />
RCA<br />
1.5<br />
1<br />
0.5<br />
0<br />
01 02 03 04 05 06 07 08 09 10 11 12<br />
600<br />
400<br />
200<br />
0<br />
Jan Feb Mar Apr May Jun Jul Aug Sep Oct Nov Dec<br />
Daily mean composite of observed<br />
and SRM discharges at Darband<br />
2001-2010<br />
<strong>Uncerta<strong>in</strong>ty</strong> <strong>in</strong> Climate Change Research: An Integrated Approach<br />
6-17 August 2012 Institute for Mathematics Applied to Geosciences, NCAR, Boulder, CO
Fraction of zone that is snow covered<br />
Input uncerta<strong>in</strong>ty (snow cover)<br />
1.0<br />
Zone 1<br />
0.8<br />
0.6<br />
0.4<br />
0.2<br />
Zone 2<br />
Zone 3<br />
Zone 4<br />
Zone 5<br />
Zone 6<br />
Zone 7<br />
Zone 8<br />
0.0<br />
16-Mar 16-Apr 16-May 16-Jun 16-Jul 16-Aug 16-Sep<br />
Snow-cover duration curves (CDCs) for the upper Vakhsh bas<strong>in</strong> <strong>in</strong> 2010<br />
<strong>Uncerta<strong>in</strong>ty</strong> <strong>in</strong> Climate Change Research: An Integrated Approach<br />
6-17 August 2012 Institute for Mathematics Applied to Geosciences, NCAR, Boulder, CO
Daily Q (m3/s)<br />
Jan<br />
Feb<br />
Mar<br />
Apr<br />
May<br />
Jun<br />
Daily Q (m3/s)<br />
Jul<br />
Jan<br />
Aug<br />
Feb<br />
Sep<br />
Mar<br />
Oct<br />
Apr<br />
Nov<br />
May<br />
Dec<br />
Jun<br />
Jul<br />
Aug<br />
Sep<br />
Oct<br />
Nov<br />
Dec<br />
Input uncerta<strong>in</strong>ty (outcome)<br />
3500<br />
3000<br />
2500<br />
2000<br />
1500<br />
Nasty (2001)<br />
Observed<br />
SRM<br />
Hot-dry<br />
Central<br />
Warm-wet<br />
1000<br />
500<br />
0<br />
3500<br />
Nicer (2003)<br />
3000<br />
Observed<br />
Observed and SRM<br />
estimates of daily discharge<br />
<strong>in</strong> the Naryn under present<br />
and changed climate for the<br />
2050s (hot-dry, central, and<br />
warm-wet).<br />
2500<br />
2000<br />
1500<br />
1000<br />
500<br />
0<br />
SRM<br />
Hot-dry<br />
Central<br />
Warm-wet<br />
Source: EBRD (2011)<br />
<strong>Uncerta<strong>in</strong>ty</strong> <strong>in</strong> Climate Change Research: An Integrated Approach<br />
6-17 August 2012 Institute for Mathematics Applied to Geosciences, NCAR, Boulder, CO
Source: Clark et l. (2008)<br />
Source: Freer et al. (2012)<br />
Framework for Understand<strong>in</strong>g<br />
Structural Errors (FUSE)<br />
<strong>Uncerta<strong>in</strong>ty</strong> <strong>in</strong> Climate Change Research: An Integrated Approach<br />
6-17 August 2012 Institute for Mathematics Applied to Geosciences, NCAR, Boulder, CO
PE (mm/day<br />
PE (mm/day<br />
PE (mm/day<br />
PE (mm/day<br />
Structural uncerta<strong>in</strong>ty (PE)<br />
14<br />
(A) Potential Evaporation 1961-1990<br />
14<br />
(B) Potential Evaporation 2020s<br />
12<br />
10<br />
8<br />
6<br />
Thornthwaite<br />
Blarney-Criddle<br />
Hamon<br />
Mass balance<br />
12<br />
10<br />
8<br />
6<br />
m<strong>in</strong><br />
q1<br />
median<br />
q3<br />
max<br />
4<br />
4<br />
2<br />
2<br />
0<br />
0<br />
Jan Feb Mar Apr May Jun Jul Aug Sep Oct Nov Dec<br />
Jan Feb Mar Apr May Jun Jul Aug Sep Oct Nov Dec<br />
Month<br />
Month<br />
14<br />
(C) Potential Evaporation 2050s<br />
14<br />
(D) Potential Evaporation 2080s<br />
12<br />
12<br />
10<br />
10<br />
8<br />
6<br />
4<br />
2<br />
8<br />
6<br />
4<br />
2<br />
0<br />
Jan Feb Mar Apr May Jun Jul Aug Sep Oct Nov Dec<br />
Month<br />
0<br />
Jan Feb Mar Apr May Jun Jul Aug Sep Oct Nov Dec<br />
Estimated PE for 1961-1990 based on the Thornthwaite, Blaney-Criddle and Hamon<br />
methods and observed temperatures. Mass balance estimates were calculated from<br />
reservoir (Kairakkum) <strong>in</strong>flows and outflows. Source: EBRD (2012)<br />
Month<br />
<strong>Uncerta<strong>in</strong>ty</strong> <strong>in</strong> Climate Change Research: An Integrated Approach<br />
6-17 August 2012 Institute for Mathematics Applied to Geosciences, NCAR, Boulder, CO
Cumulative likelihood<br />
Structural uncerta<strong>in</strong>ty (PE, GCM, emissions)<br />
1<br />
2020s 2050s 2080s<br />
0.8<br />
0.6<br />
0.4<br />
0.2<br />
0<br />
0 10 20 30 40 50 60 70<br />
Annual PE change (%)<br />
Cumulative likelihood distributions of annual PE <strong>in</strong>creases (% change with respect to the<br />
1961-1990 basel<strong>in</strong>e) projected by ensembles of PE estimation method, emission scenario,<br />
and GCM output (for the closest grid-po<strong>in</strong>ts to the Kairakkum reservoir).<br />
<strong>Uncerta<strong>in</strong>ty</strong> <strong>in</strong> Climate Change Research: An Integrated Approach<br />
6-17 August 2012 Institute for Mathematics Applied to Geosciences, NCAR, Boulder, CO
surface<br />
evaporation<br />
soil moisture<br />
precipitation evaporation<br />
Parameter uncerta<strong>in</strong>ty<br />
soil moisture store<br />
reduced<br />
evaporation rate<br />
direct<br />
percolation<br />
total<br />
percolation<br />
saturation<br />
percolation<br />
abstraction<br />
effluent<br />
return<br />
unsaturated<br />
zone<br />
abstraction<br />
recharge<br />
saturated zone<br />
outflow<br />
channel flow<br />
<strong>Uncerta<strong>in</strong>ty</strong> <strong>in</strong> Climate Change Research: An Integrated Approach<br />
6-17 August 2012 Institute for Mathematics Applied to Geosciences, NCAR, Boulder, CO<br />
CATCHMOD lumped conceptual model
Parameter uncerta<strong>in</strong>ty (high identifiability)<br />
All data (1961-1990)<br />
Wettest year (1967/68)<br />
Driest year (1975/76)<br />
CATCHMOD direct percolation (DP) parameter<br />
for Thames bas<strong>in</strong>. Source: Wilby (2005)<br />
<strong>Uncerta<strong>in</strong>ty</strong> <strong>in</strong> Climate Change Research: An Integrated Approach<br />
6-17 August 2012 Institute for Mathematics Applied to Geosciences, NCAR, Boulder, CO
Parameter uncerta<strong>in</strong>ty (low identifiability)<br />
All data (1961-1990)<br />
Wettest year (1967/68)<br />
Driest year (1975/76)<br />
CATCHMOD potential dry<strong>in</strong>g constant (PDC)<br />
parameter for Thames bas<strong>in</strong>. Source: Wilby (2005)<br />
<strong>Uncerta<strong>in</strong>ty</strong> <strong>in</strong> Climate Change Research: An Integrated Approach<br />
6-17 August 2012 Institute for Mathematics Applied to Geosciences, NCAR, Boulder, CO
Parameter uncerta<strong>in</strong>ty (outcome)<br />
Observed and simulated runoff <strong>in</strong> the Lech bas<strong>in</strong>, Austria for the year 1975. Blue shad<strong>in</strong>g<br />
<strong>in</strong>dicates the range obta<strong>in</strong>ed from 20 different parameter sets. Source: Dobler et al. (submitted).<br />
<strong>Uncerta<strong>in</strong>ty</strong> <strong>in</strong> Climate Change Research: An Integrated Approach<br />
6-17 August 2012 Institute for Mathematics Applied to Geosciences, NCAR, Boulder, CO
Overview: Hydrological uncerta<strong>in</strong>ties<br />
<strong>in</strong> perspective (hydropower)<br />
Climate change<br />
scenarios<br />
Hydrological <strong>models</strong><br />
(REG WBM SRM)<br />
Upstream river<br />
regulation<br />
Hazards<br />
analysis<br />
Monthly/annual<br />
evaporation<br />
Monthly/annual<br />
flow factors<br />
Sedimentation<br />
data<br />
Reservoir<br />
safety<br />
Reservoir<br />
water balance<br />
Operat<strong>in</strong>g<br />
rule scenario<br />
Energy<br />
production<br />
model<br />
Refurbishment and<br />
upgrade scenarios<br />
Source: EBRD (2012)<br />
<strong>Uncerta<strong>in</strong>ty</strong> <strong>in</strong> Climate Change Research: An Integrated Approach<br />
6-17 August 2012 Institute for Mathematics Applied to Geosciences, NCAR, Boulder, CO
Hydrological hazard forecast<strong>in</strong>g<br />
(scientifically tractable risk reduction measure)<br />
Panjakent<br />
Fayzabad<br />
Somoniyon<br />
Rushan<br />
Locations of mudflows and reported flood<strong>in</strong>g 5 to 11 May 2011 compared with TRMM ra<strong>in</strong>fall<br />
<strong>Uncerta<strong>in</strong>ty</strong> <strong>in</strong> Climate Change Research: An Integrated Approach<br />
6-17 August 2012 Institute for Mathematics Applied to Geosciences, NCAR, Boulder, CO
Where the need is greatest<br />
<strong>Uncerta<strong>in</strong>ty</strong> <strong>in</strong> Climate Change Research: An Integrated Approach<br />
6-17 August 2012 Institute for Mathematics Applied to Geosciences, NCAR, Boulder, CO