Socio Economic Profile 2008 - Navotas City
Socio Economic Profile 2008 - Navotas City
Socio Economic Profile 2008 - Navotas City

Create successful ePaper yourself
Turn your PDF publications into a flip-book with our unique Google optimized e-Paper software.
a. Literacy<br />
From 1990 to 1995, the total literacy of household population of <strong>Navotas</strong> 10 years old and<br />
over rose by 22.88% compared to NCR’s 19.29% rise. The 1995 census data shows that the literacy of<br />
the population of <strong>Navotas</strong> have slightly improved since the 1990 census data.<br />
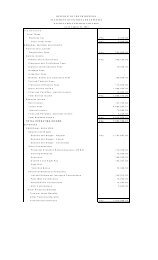
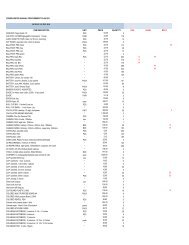
Literacy of Household Population 10 Years Old and Over by Sex in NCR and <strong>Navotas</strong><br />
Total household<br />
% Share of Literate<br />
Population 10 Years Old<br />
Item<br />
Population<br />
and above<br />
% Share of Illiterate<br />
Population<br />
1990 1995 1990 1995 1990 1995<br />
NCR 6,046,049 7,211,973 99.09% 99.22% 0.91% 0.78%<br />
Male 2,878,319 3,453,857 99.24% 99.34% 0.76% 0.66%<br />
Female 3,167,730 3,758,116 98.95% 99.12% 1.05% 0.88%<br />
<strong>Navotas</strong> 138,412 170,075 98.73% 98.92% 1.27% 1.08%<br />
Male 69,179 84,906 98.89% 99.07% 1.11% 0.93%<br />
Female 69,233 85,169 98.56% 98.78% 1.44% 1.22%<br />
Source: National Statistics Office<br />
b. Educational Attainment<br />
<strong>Navotas</strong> fairs slightly better than NCR in terms of the total household population 7 years old<br />
and over having enrolled in secondary or high school education. High school graduates have also<br />
increased from 1990 to 1995 by 2.81%. However, in terms of elementary or primary education there<br />
was a marked decrease of 5.85%. 15.16% reached tertiary education, a 1.67% increase from 1990’s<br />
13.49%, but much lower than NCR’s 27.83% in 1995. Academic degree holders in <strong>Navotas</strong> amount to<br />
6.60% in 1995, definitely lower than NCR’s 15%. The table shows increase in the number of students<br />
reaching pre-school and high school, showing that <strong>Navotas</strong> fairs better in terms of students reaching<br />
primary education (pre-school and elementary levels) and secondary education (high school level).<br />
However in terms of post secondary and tertiary education, <strong>Navotas</strong> still has to improve.<br />
NCR’s and <strong>Navotas</strong>’ Percentage Share of Highest Educational Attainment<br />
Household Population 7 Years Old and Over<br />
Highest Educational<br />
1990 % Share 1995 % Share<br />
Attainment<br />
NCR <strong>Navotas</strong> NCR <strong>Navotas</strong><br />
No Grade Completed 1.16% 2.02% 1.01% 1.39%<br />
Pre-School 0.72% 0.49% 1.16% 1.18%<br />
Elementary 30.42% 45.94% 26.62% 40.11%<br />
1 st - 4 th Grade 13.21% 18.87% 11.62% 15.67%<br />
5 th - 7 th Grade 17.22% 27.08% 15.00% 24.43%<br />
High School 35.10% 34.23% 37.94% 38.05%<br />
Undergraduate 13.96% 17.34% 14.50% 18.35%<br />
Graduate 21.13% 16.89% 23.44% 19.70%<br />
Post Secondary 3.70% 3.01% 3.40% 2.42%<br />
14