Analysis for European Neighbourhood Policy (ENP ... - SWIM-SM
Analysis for European Neighbourhood Policy (ENP ... - SWIM-SM
Analysis for European Neighbourhood Policy (ENP ... - SWIM-SM

Create successful ePaper yourself
Turn your PDF publications into a flip-book with our unique Google optimized e-Paper software.
Sustainable Water Integrated Management (<strong>SWIM</strong>) - Support Mechanism<br />
Project funded by the <strong>European</strong> Union<br />
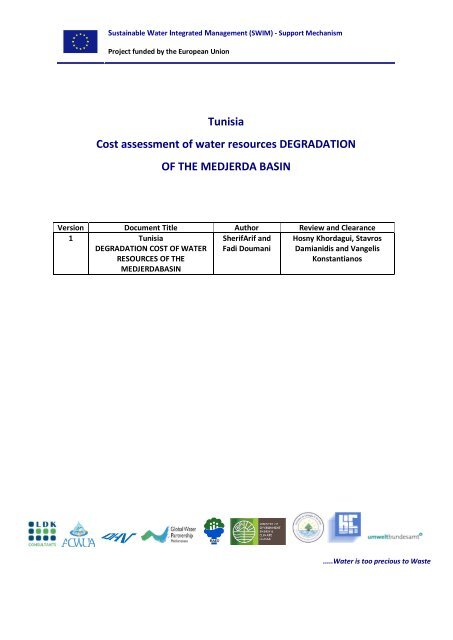
Tunisia<br />
Cost assessment of water resources DEGRADATION<br />
OF THE MEDJERDA BASIN<br />
Version Document Title Author Review and Clearance<br />
1 Tunisia<br />
DEGRADATION COST OF WATER<br />
RESOURCES OF THE<br />
MEDJERDABASIN<br />
SherifArif and<br />
Fadi Doumani<br />
Hosny Khordagui, Stavros<br />
Damianidis and Vangelis<br />
Konstantianos<br />
.....Water is too precious to Waste
Sustainable Water Integrated Management (<strong>SWIM</strong>) - Support Mechanism<br />
Project funded by the <strong>European</strong> Union<br />
ACKNOWLEDGEMENTS AND QUOTES<br />
Acknowledgements:<br />
We would like to thank Ms SondesKamoun, General Director of the Office of Planning and Water<br />
Equilibrium of the Ministry of Agriculture and <strong>SWIM</strong>-<strong>SM</strong> Focal point in Tunisia, Ms Sabria Bnouni,<br />
Director of the International Cooperation Department of the Ministry <strong>for</strong> the Environment, Liaison<br />
Agent of the <strong>SWIM</strong>-<strong>SM</strong> programme and Focal Point <strong>for</strong> the H2020 programme as well as everyone<br />
met during the missions from July 29 to August 4 2012 (the mission agenda is listed in Annex I), and<br />
especially Mr BouzidNasraoui, Mr FethiSakli, M. AbdelbakiLabidi, Mr Mohamed Beji, Mr<br />
ChaabaneMoussa, Mr Adel Jemmazi, Ms FatmaChiha, Mr KacemChammkhi, Mr TawfikAbdelhedi, Mr<br />
Hassen Ben Ali, Mr Mellouli Mohamed, Mr MoncefRekaya, Mr NejibAbid, Mr Omrani, Mr Adel<br />
Boughanmi, Ms NesrineGdiri, Ms AwatefMessai, Mr Samir Kaabi, Ms MounaSfaxi, Mr MabroukNedhif,<br />
Ms MyriamJenaih, Mr BechirBéjaoui, Mr NoureddineZaaboul, Mr Denis Pommier, Mr RafikAini, Ms<br />
JamilaTarhouni, Ms SalmBettaeib, Mr Mohame Salah Ben Romdhane, Mr MosbahHellali, Mr<br />
AbdellahCherid, Ms LamiaJemmali and Mr Mohamed Rabhi. We would also like to extend our thanks<br />
to the Tunisian authorities <strong>for</strong> facilitating our work and providing essential data after the departure of<br />
the mission. Annex I includes a list of the people involved and their respective roles.<br />
A consultation workshop was organised on December 7, 2012 at the Golden Tulip Hotel El Mechtel de<br />
Tunis, which was launched by Ms SondesKamoun, General Director of the Office of Planning and<br />
Water Equilibrium, Ministry of Agriculture, and Mr Denis Pommier, Rural and Agricultural<br />
Development Expert of the <strong>European</strong> Union Delegation in Tunisia. Annex I includes a list of the<br />
participants and their respective roles.<br />
We would also like to thank Dr. Sarra Touzi, local expert of the <strong>SWIM</strong>-<strong>SM</strong> Programme, <strong>for</strong> her<br />
assistance, valuable help and comments during the drafting of the report.<br />
This report should be quoted as follows:<br />
SherifArif and Fadi Doumani. 2012.Tunisia, Cost of the Degradation of Water Resources in the<br />
MedjerdaBasin. Sustainable Water Integrated Management (<strong>SWIM</strong>-<strong>SM</strong>) Programme, funded by the<br />
<strong>European</strong> Commission and implemented by the consortium comprising of: LDK Consultants Engineers<br />
& Planners SA (Leader); Arab Countries Water Utilities Association (ACWUA); Arab Network <strong>for</strong><br />
Environment and Development (RAED); DHV B.V., the Global Water Partnership - Mediterranean<br />
(GWP-Med); Greek Ministry of Environment, Energy & Climate Change/Department of International<br />
Relations & EU Affairs; Lebanese Ministry <strong>for</strong> Energy and Water/General Directorate of Water and<br />
Electrical Resources; Tunisian Ministry <strong>for</strong> Agriculture, Water Resources and Fishing/General<br />
Directorate of Water Resources; as well as the Austrian Environment Agency (Umweltbundesamt<br />
GmbH),Brussels.<br />
TUNISIA - DEGRADATION COST OF WATER RESOURCES OF THE MEDJERDABASIN 2
Sustainable Water Integrated Management (<strong>SWIM</strong>) - Support Mechanism<br />
Project funded by the <strong>European</strong> Union<br />
Table of Contents<br />
1. INTRODUCTION ........................................................................................................................ 15<br />
2. SUSTAINABLE WATER INTEGRATED MANAGEMENT – SUPPORT MECHANI<strong>SM</strong> (<strong>SWIM</strong>-<strong>SM</strong>) ........ 17<br />
2.1 General overview ........................................................................................................... 17<br />
2.2 Objective of the Study .................................................................................................... 18<br />
3. THE MEDJERDA BASIN .............................................................................................................. 20<br />
3.1. GENERAL DATA ON THE MEDJERDA BASIN ...................................................................... 20<br />
3.2. POLLUTION OF THE MEDJERDA BASIN ............................................................................ 23<br />
3.3. ORGANISATIONAL AND INSTITUTIONAL FRAMEWORK IN THE MEDJERDA BASIN ............. 26<br />
3.3.1. Ministry <strong>for</strong> Agriculture .............................................................................................. 26<br />
3.3.2. Ministry <strong>for</strong> the Environment ..................................................................................... 28<br />
3.3.3. Ministry <strong>for</strong> Public Health........................................................................................... 30<br />
3.3.4. Conclusions................................................................................................................ 30<br />
4. REVIEW OF ENVIRONMENTAL DEGRADATION COSTS IN TUNISIA .............................................. 31<br />
5. METHODOLOGY, ASSES<strong>SM</strong>ENT CALIBRATION AND LIMITS, AND CATEGORY .............................. 34<br />
5.1 METHODOLOGY ............................................................................................................. 34<br />
5.2 ASSES<strong>SM</strong>ENT CALIBRATION AND LIMITS ......................................................................... 36<br />
5.3 EVALUATED CATEGORIES ................................................................................................ 36<br />
6. DEGRADATION COST OF THE MEDJERDA BASIN ........................................................................ 40<br />
6.1 GENERAL OVERVIEW OF DEGRADATION COSTS .............................................................. 40<br />
6.2 WATER CATEGORY AND SUB-CATEGORIES ...................................................................... 42<br />
6.2.1 Drinking water quality and treatment ........................................................................ 42<br />
6.2.2 Quality of Water and Sanitation Services .................................................................... 43<br />
6.2.3 Quality of water resources ......................................................................................... 44<br />
6.2.4 Salinity ....................................................................................................................... 45<br />
6.2.5 Quantity .................................................................................................................... 46<br />
TUNISIA - DEGRADATION COST OF WATER RESOURCES OF THE MEDJERDABASIN 3
Sustainable Water Integrated Management (<strong>SWIM</strong>) - Support Mechanism<br />
Project funded by the <strong>European</strong> Union<br />
6.2.6 Erosion and Storage: .................................................................................................. 47<br />
6.2.7 Hydro-electric power: ................................................................................................ 48<br />
6.3 SOLID WASTE CATEGORY ................................................................................................ 49<br />
6.4 BIODIVERSITY CATEGORY................................................................................................ 50<br />
6.5 NATURAL DISASTERS AND GENERAL ENVIRONMENT CATEGORY ..................................... 51<br />
6.5.1 Natural disasters ........................................................................................................ 51<br />
6.5.2 Overall Environment .................................................................................................. 51<br />
6.6 CONCLUSIONS ................................................................................................................ 51<br />
7. COST OF RESTORATION OF THE MEDJERDA BASIN .................................................................... 53<br />
7.1 GENERAL OVERVIEW OF RESTORATION COSTS................................................................ 53<br />
7.2 DRINKING WATER QUALITY ............................................................................................ 54<br />
7.3 WATER AND SANITATION IN RURAL AREAS ..................................................................... 56<br />
7.4 IMPROVEMENT OF WASTE MANAGEMENT ..................................................................... 58<br />
7.5 REDUCTION OF EROSION UPSTREAM TO REDUCE DAM SILTATION .................................. 59<br />
8. RECOMMENDATIONS ............................................................................................................... 61<br />
9. REFERENCES ............................................................................................................................. 63<br />
10. ANNEX I IDENTIFICATION MISSION ....................................................................................... 65<br />
11. ANNEX II GENERAL METHODOLOGY FOR THE EVALUATION OF THE COSTS OF DEGRADATION<br />
72<br />
12. ANNEX III SPECIFIC METHODS FOR THE EVALUATION OF THE COSTS OF DEGRADATION FOR<br />
THE WATER CATEGORY ..................................................................................................................... 77<br />
13. ANNEX IV SPECIFIC METHODS FOR THE EVALUATION OF THE COSTS OF DEGRADATION FOR<br />
THE WASTE CATEGORY ..................................................................................................................... 80<br />
14. ANNEX V RESTORATION RESULTS ......................................................................................... 86<br />
15. ANNEX VI DISAGGREGATED RESULTS OF DEGRADATION AND RESTORATION COSTS ............. 88<br />
TUNISIA - DEGRADATION COST OF WATER RESOURCES OF THE MEDJERDABASIN 4
Sustainable Water Integrated Management (<strong>SWIM</strong>) - Support Mechanism<br />
Project funded by the <strong>European</strong> Union<br />
Exchange rate:<br />
€ 1 = Tunisian Dinar (DT) 1.891 (December 2010)<br />
€ 1 = Tunisian Dinar (DT) 2.022 (September 2012)<br />
$EU 1 = Tunisian Dinar (DT) 1.427 (December 2010)<br />
$EU 1 = Tunisian Dinar (DT) 1.573 (September 2012)<br />
Source: <br />
The sole responsibility <strong>for</strong> the contents of this document lies with the authors and does<br />
not necessarily represent the views of the <strong>European</strong> Commission or the Tunisian State..<br />
TUNISIA - DEGRADATION COST OF WATER RESOURCES OF THE MEDJERDABASIN 5
Sustainable Water Integrated Management (<strong>SWIM</strong>) - Support Mechanism<br />
Project funded by the <strong>European</strong> Union<br />
ACRONYMS<br />
B/C ........................... Benefit/Cost Ratio<br />
ANGed…………..............National Agency <strong>for</strong> Waste Management<br />
ANPE…………………………National Agency <strong>for</strong> Environmental Protection<br />
BA ............................ Benefit Assessment<br />
C/P ........................... Costs/profits<br />
CE ............................. <strong>European</strong> Community<br />
CH 4 ........................... Methane<br />
CO 2 ........................... Carbon dioxide<br />
COPEAU……………………Water Pollution Control Network<br />
CRDA………………………..Regional Committees <strong>for</strong> Agricultural Development<br />
DBO 5 ......................... Biological Oxygen Demand<br />
DCO .......................... Chemical Oxygen Demand<br />
DGACTA………..............Directorate General <strong>for</strong> Development and Conservation of Agricultural Land<br />
DGBGTH………..............Directorate General <strong>for</strong> Dams and Hydraulic Works<br />
DGF…………………………..Directorate General <strong>for</strong> Forests<br />
DGGREE…………………… Directorate General <strong>for</strong> Rural Engineering and Water Exploitation<br />
DGPA………………………..Directorate General <strong>for</strong> Agricultural Pesticides<br />
DGQEV……………………..Directorate General <strong>for</strong> the Environment and Quality of Life<br />
DGRE………………………..Directorate General <strong>for</strong> Water Resources<br />
dS/m......................... deciSiemens per metre<br />
EPA ........................... USA Environmental Protection Agency<br />
EUT ........................... Treated wastewater<br />
FAO .......................... Food and Agriculture Organisation<br />
g ............................... gram<br />
GEG .......................... Ghdir El Golla complex<br />
GES ........................... Greenhouse gas emissions<br />
GIZ ............................ Gesellschaft für Internationale Zusammenarbeit (previously GTZ)<br />
ha ............................. Hectare<br />
INAT………………………….National Agronomic Institute of Tunisia<br />
KfW .......................... Kreditanstalt für Wiederaufbau<br />
kg ............................. Kilogram<br />
km ............................ Kilometre<br />
km 2 ........................... Square kilometre<br />
m .............................. Metre<br />
m 2 ............................ Square metre<br />
m 3 ............................ Cubic metre<br />
MdA ......................... Ministry <strong>for</strong> Agriculture<br />
MdE .......................... Ministry <strong>for</strong> the Environment<br />
MdSP ........................ Ministry <strong>for</strong> Public Health<br />
ODESYPANO...............Office <strong>for</strong> Sylvo-Pastoral Development of the North-West<br />
ONAS……………………….National Office of Sanitation<br />
OMS ......................... World Health Organisation (WHO)<br />
GDP .......................... Gross Domestic Product<br />
PISEAU………………………Investment project in the Water Sector<br />
SIG ............................ Geographic In<strong>for</strong>mation System<br />
SECADENORD……………Association <strong>for</strong> the Exploitation of Canal and Water Supply Systems of the North<br />
TUNISIA - DEGRADATION COST OF WATER RESOURCES OF THE MEDJERDABASIN 7
Sustainable Water Integrated Management (<strong>SWIM</strong>) - Support Mechanism<br />
Project funded by the <strong>European</strong> Union<br />
SONEDE .................... National Association <strong>for</strong> Water Exploitation and Distribution<br />
STEP ......................... Wastewater Treatment Plant<br />
TEEB ......................... The Economics of Ecosystems and Biodiversity<br />
IRR ............................ Internal Rate of Return<br />
UE ............................ <strong>European</strong> Union<br />
NPV .......................... Net Present Value<br />
VET ........................... Total Economic Value<br />
VVL ........................... Value of a statistical life<br />
WFD ......................... EC Water Framework Directive<br />
TUNISIA - DEGRADATION COST OF WATER RESOURCES OF THE MEDJERDABASIN 8
Sustainable Water Integrated Management (<strong>SWIM</strong>) - Support Mechanism<br />
Project funded by the <strong>European</strong> Union<br />
Executive SUMMARY<br />
With a population of 10.6 million (2011) and a Gross Domestic Product (GDP) of 63.4 billion DT in 2010,<br />
Tunisia’s water allocation is estimated at 472 m 3 /inhabitant, which will drop to 315 m 3 /inhabitant in 20 years’<br />
time, thus being among the 17 countries most stressed <strong>for</strong> water. The Tunisian natural resources are limited<br />
inquantity and, partly, in quality and in actual potential <strong>for</strong> exploitation. However, since the late 80s, Tunisia<br />
has accomplished important results in the area of water resource mobilisation, water and soil conservation, the<br />
fight against erosion, and full access to drinking water reaching almost 100% in urban regions and 94% in rural<br />
regions, while access to urban sanitation is 99% with rural areas, showing a mere 5% of effective access to<br />
sanitation.<br />
Since 1999, Tunisia has adopted a water resource strategy primarily addressing the mobilization of supply and<br />
demand management. The State has implemented this strategy through a ten-year programme (2001-2011),<br />
built around three specific pillars: (i) integrated management and conservation of water resources; (ii)<br />
economic efficiency of water use in agriculture; and (iii) institutional restructuring and capacity building in the<br />
water sector. Since the Revolution in January 2011, through the Ministry <strong>for</strong> Agriculture, the new Government<br />
has focused on issues of employment, development and directing its interventions to the less privileged and<br />
disadvantaged regions, and on the other hand participatory management of the natural resources of the<br />
watersheds in these areas. In the latter, more specific prioritisation may be identified based on the cost and<br />
profit of interventions whereby sustainable water management is a critical component in reducing poverty,<br />
especially in rural areas.<br />
As part of this general context, this regional study refers to the degradation cost of water resources at the<br />
watershed level, being supported by the <strong>SWIM</strong>-<strong>SM</strong> regional program, funded by a <strong>European</strong> Union financing<br />
totalling 7.0 million Euros.One of five components of this project is the improvement of water governance and<br />
integration of water issues in sectoral policies such as policies in agriculture, industry, tourism, etc. This aims at<br />
making water an important element in policies and national development strategies. While water problems<br />
and their economic effects have been assessed at the national level, much less is known at a more detailed<br />
watershed level as no accurate identification of problems and valuation of the associated costs of degradation<br />
have been undertaken so far. However, it is at the basin level that decisions have to be taken as to water<br />
resource management and protection. This would enable local institutions to have the required tools and being<br />
able to discuss on national and regional level based on costed policies required to reduce such costs.<br />
Though its national focal point, Tunisia has asked <strong>for</strong> the <strong>SWIM</strong>-<strong>SM</strong> assistance in estimating the cost of water<br />
resource degradation in the Medjerda watershed. This basin was selected as a result of the following: (a)<br />
Medjerda is the longest river in Tunisia, considered to be the country's water tower, providing drinking water<br />
to more than 2.5 million inhabitants of the Greater Tunis and its Surrounds; (b) Medjerda crosses the six<br />
governorates of Beja, Jandouba, Le Kef, Siliana (all 4 are part of the North-West District) and Manouba as well<br />
as Ariana (these last 2 being part of the district of Tunis) whose character is rural and agricultural. These<br />
governorates are rich in natural resources, hold 75% of water reserves and include more than half of the<br />
country's <strong>for</strong>est areas; (c) The basin is facing a number of natural resource problems related to erosion, salinity,<br />
droughts, floods and siltation of dams as well as problems of agricultural, municipal and industrial pollution. It<br />
is thought to be a representative basin <strong>for</strong> a thorough analysis of costs and benefits related to the degradation<br />
and restoration of water resources in Tunisia.<br />
The main objective of this study is to assess the cost of water resource degradation in the watershed of<br />
Medjerda. The expected results are: (a) an overview of the economic aspects of the Medjerda watershed<br />
TUNISIA - DEGRADATION COST OF WATER RESOURCES OF THE MEDJERDABASIN 9
Sustainable Water Integrated Management (<strong>SWIM</strong>) - Support Mechanism<br />
Project funded by the <strong>European</strong> Union<br />
management problems; (b) a cost assessment of water resources degradation; (c) an economic analysis of<br />
certain alternatives; and (d) specific recommendations in order to integrate the benefits <strong>for</strong> the environment<br />
and improve the management of this basin.<br />
The results of the Medjerda degradation cost are shown in Table 1 and Figure 1. Note that the total cost <strong>for</strong><br />
Medjerda and Grand Tunis is compared to the Tunisian GDP (63.4 billion DT in 2010) while the Medjerda Basin<br />
cost (intra-muros) is compared to the Medjerda GDP (5.8 billion DT in 2010) extrapolated using the GDP per<br />
inhabitant of the Medjerda basin (4,058 DT/inhabitant in 2010) and then multiplying with the number of<br />
inhabitants. The disaggregated results are available in Annex VI.<br />
For Medjerda and The Greater Tunis, this cost reaches 214 million DT in 2010 ranging from 149 to 324 million<br />
DT on average equivalent to around 0.34% of the current GDP but 0.85% of the constant GDP (as compared to<br />
2000) of Tunisia in 2010. As concerns Medjerda, the degradation costs are 192 million dinars in 2010 ranging<br />
from 132 to 296 million DT on average, equivalent to around 3.3% of the Basin region GDP. The cost<br />
attributable to human health is 81 million DT in 2010 or 42.5% of the degradation cost of Medjerda and 63%<br />
<strong>for</strong> the water category (Table 1 and Figure 1).<br />
Table 1: Degradation cost <strong>for</strong> Medjerda and Greater Tunis, 2010 in million DT<br />
Categories Medjerda % Minimu<br />
m<br />
Maximu<br />
m<br />
Greater<br />
Tunis<br />
Minimu<br />
m<br />
Maximu<br />
m<br />
Total<br />
Medjerda<br />
and<br />
Greater<br />
Tunis<br />
% Minimu<br />
m<br />
Maximu<br />
m<br />
Water 129.5 68% 99.1 164.5 22.3 17.5 28.1 151.8 71% 116.6 192.6<br />
Waste 60.5 32% 32.1 131.3 - - - 60.5 28% 33.7 130.9<br />
Biodiversity 0.5 0% 0.4 - - - - 0.5 0% 0.4 -<br />
Natural disasters and<br />
1.1 1% - - - - - 1.1 1% - -<br />
General environment<br />
Total 191.5 100% 131.6 295.8 22.3 17.5 28.1 213.9 100% 149.1 323.9<br />
% GDP Medjerda 3.3% 2.3% 5.1%<br />
% GDP Tunisia 0.34% 0.24% 0.51%<br />
Source: Authors.<br />
Broken down by category, water degradation is the highest in Greater Tunis and Medjerda in relative values,<br />
with 68% of the total in 2010. Waste, which is simply covered in Medjerda, come in second place with 32%<br />
relatively, biodiversity with 0.01% and overall environment with 1%. There were no natural disasters in the<br />
Medjerda basin in 2010 and there<strong>for</strong>e they have not been taken into account in this assessment.<br />
Broken down by the water subcategory (130 million DT in 2010), waterborne diseases account <strong>for</strong> the majority<br />
of costs in the Medjerda Basin (81 million DT) followed by water quality (27 million DT), the water quantity (21<br />
million DT, relatively low because 2010 was a favourable season) and finally the overall environment (1 million<br />
DT).<br />
Broken down by the waste sub-category (61 million DT in 2010), collection represents the majority of costs in<br />
the Medjerda Basin (38 million DT), followed by waste processing (13 million DT), landfills (10 million DT) and<br />
finally the overall environment (1 million DT).<br />
Figure 1: Degradation cost <strong>for</strong> Medjerda and Greater Tunis, 2010 in million DT<br />
TUNISIA - DEGRADATION COST OF WATER RESOURCES OF THE MEDJERDABASIN 10
Millions de DT<br />
Millions de DT<br />
Millions de DT<br />
% du PIB<br />
% du PIB<br />
% du PIB<br />
Sustainable Water Integrated Management (<strong>SWIM</strong>) - Support Mechanism<br />
Project funded by the <strong>European</strong> Union<br />
200<br />
180<br />
160<br />
140<br />
120<br />
100<br />
80<br />
60<br />
40<br />
20<br />
0<br />
Coût de la Dégradation Totale<br />
1.1<br />
0<br />
61<br />
129<br />
Millions de DT en 2010<br />
Environnement Global<br />
Biodiversité<br />
Déchets<br />
Eau<br />
Medjerda<br />
Grand Tunis et Alentours<br />
Région affectée par les ressources en eau<br />
22<br />
4%<br />
3%<br />
2%<br />
1%<br />
0%<br />
Coût de la Dégradation Totale<br />
% du PIB 2010<br />
Environnement Global<br />
Biodiversité<br />
Déchets<br />
Eau<br />
PIB Medjerda<br />
PIB Tunisie<br />
Région affectee par les ressources en eau<br />
140<br />
120<br />
100<br />
80<br />
60<br />
40<br />
Coût de la Dégradation: Eau<br />
0.1<br />
21<br />
27<br />
81<br />
Millions de DT en 2010<br />
Environnement Global<br />
Quantité de l'eau<br />
Qualité de l'eau<br />
Maladies Hydriques<br />
3%<br />
2%<br />
1%<br />
Coût de la Dégradation: Eau<br />
% du PIB<br />
Environnement Global<br />
Quantité de l'eau<br />
Qualité de l'eau<br />
Maladies Hydriques<br />
20<br />
0<br />
6<br />
16<br />
-<br />
Medjerda<br />
Grand Tunis et Alentours<br />
Région affectée par les ressources en eau<br />
0%<br />
PIB Medjerda<br />
PIB Tunisie<br />
Région affectee par les ressources en eau<br />
140<br />
120<br />
100<br />
80<br />
60<br />
40<br />
Coût de la Dégradation: Déchets<br />
1<br />
10<br />
13<br />
Millions de DT en 2010<br />
Environnement Global<br />
Enfouissement<br />
Trans<strong>for</strong>mation<br />
Collecte<br />
3%<br />
2%<br />
1%<br />
Coût de la Dégradation: Déchets<br />
% du PIB<br />
Environnement Global<br />
Enfouissement<br />
Trans<strong>for</strong>mation<br />
Collecte<br />
20<br />
38<br />
0<br />
Medjerda<br />
Région affectée par les déchets<br />
Source: Authors.<br />
0%<br />
PIB Medjerda<br />
Région affectée par les déchets<br />
The cost estimate of water resource degradation has resulted in the following conclusions:<br />
a) The cost of water salinity (11 million DT) within and beyond the Medjerda basin is almost equal to the<br />
salinity cost in agricultural production (12.3 million DT) within the same basin.<br />
b) Damage due to lack of access to drinking water and rural sanitation (81 million DT) in the Medjerda<br />
basin is significantly higher than damage due to drinking water salinity.<br />
c) Poor collection and lack of solidwaste treatment result in less important damages (61 million DT) than<br />
those due to lack of access to safe drinking water and sanitation in rural areas (81 million DT).<br />
d) Damages affecting the River Medjerda water quality are less pronounced (17 million DT), which<br />
suggests that land-based pollution is not fully discharged into the river.<br />
e) Damage created by erosion in dam siltation of dams are around 7.1 million DT, which may mean that<br />
dam silting may be the result of sediments in watersheds and not necessarily erosion of land sediments<br />
TUNISIA - DEGRADATION COST OF WATER RESOURCES OF THE MEDJERDABASIN 11
Sustainable Water Integrated Management (<strong>SWIM</strong>) - Support Mechanism<br />
Project funded by the <strong>European</strong> Union<br />
which do not always reach dam reservoirs. These damages are almost equivalent to soil nutrient losses<br />
due to erosion (7.4 million DT).<br />
Based on these findings, four priorities emerge <strong>for</strong> the short- and the medium-term:<br />
a) Treatment of drinking water salinity;<br />
b) Sanitation in rural areas;<br />
c) Solid Waste collection and treatment; and<br />
d) Effectiveness of planning <strong>for</strong> dam siltation reduction.<br />
Based on the priorities identified in the previous section, four intervention scenarios were considered but only<br />
three were implemented. Only drinking water salinity, water and sanitation in rural areas and waste<br />
management have been evaluated as categories. Interventions related to land use <strong>for</strong> erosion reduction and,<br />
thus, dam siltation have not been considered due to lack of studies establishing a causal link between land use<br />
and siltation reduction in order to per<strong>for</strong>m economic assessment.<br />
The most efficient scenarios were selected and shown in Table 2 and Figure 2. Concerning water and sanitation<br />
in rural areas, the combination of the sanitation scenario and the drinking water and sanitation scenario allows<br />
making the latter profitable. Concerning drinking water in Greater Tunis, desalination of part of the water<br />
resources in order to dilute the drinking water salinity is profitable. However, this alternative has not been<br />
compared to the cost of transporting water from the Barbara Basin dams, and it would become unprofitable if<br />
the threshold of 30,000 m 3 /day over three months of desalination three months is exceeded. The strategic<br />
reserve of the Barbara Basin can ensure not only the safety of the resource, but also achieve water dilution<br />
when the salt content is high in summer, especially during dry seasons. For waste alone, any alternative to<br />
landfill with electricity generation in cells is profitable. The segregation and recycling alternatives are not<br />
profitable because they are too costly. Thus, to overcome this shortcoming, a multicriteria analysis could be<br />
considered <strong>for</strong> decision making with the focus not only on the C/A analysis but also on employment creation,<br />
poverty reduction, etc.<br />
Table 2: Restoration cost <strong>for</strong> Medjerda and Greater Tunis, 2010 in million DT<br />
Medjerda and Greater Tunis<br />
Degradation<br />
2010<br />
Reduction<br />
2011<br />
Investment NPV Restoration NPV C/P analysis NPV<br />
Million DT Million DT Million DT Million DT Million DT<br />
Planning 0 0 0 0 940-5,050 DT/ha<br />
1,100-5,400 DT/ha<br />
Waste 28.6 5.7 83 84 0.9<br />
Water and Sanitation in<br />
rural areas<br />
Drinking water in Greater<br />
Tunis<br />
Source: Authors.<br />
81.3 13.7 133.7 150.7 17.1<br />
10.6 4.4 19 35 8.0<br />
Figure 2: Restoration cost <strong>for</strong> Medjerda and Greater Tunis, 2010 in million DT<br />
TUNISIA - DEGRADATION COST OF WATER RESOURCES OF THE MEDJERDABASIN 12
Millions de DT<br />
Sustainable Water Integrated Management (<strong>SWIM</strong>) - Support Mechanism<br />
Project funded by the <strong>European</strong> Union<br />
150<br />
130<br />
110<br />
90<br />
70<br />
50<br />
30<br />
10<br />
-10<br />
Dégradation et Restauration<br />
Millions de DT<br />
Dégradation 2010<br />
Réduction 2011<br />
VAN de l'Investissement<br />
VAN de la Restauration<br />
Aménagement Déchets Eau et Assain.<br />
milieu rural<br />
Source: Authors.<br />
Eau potable<br />
Grand Tunis<br />
20<br />
18<br />
16<br />
14<br />
12<br />
10<br />
8<br />
6<br />
4<br />
2<br />
0<br />
VAN C/A et Ratio A/C des Interventions<br />
VAN C/A: Millions de DT<br />
Ratio A/C<br />
Aménagement Déchets Eau et Assain.<br />
milieu rural<br />
Eau potable<br />
Grand Tunis<br />
The mitigation cost analysis of three categories analyzed based on the net present value (NPV) of the<br />
investment over 20 years (24 years <strong>for</strong> waste) with a rate of 10% discount and internal rate of return (IRR), has<br />
identified the most efficient investments as follows:<br />
a) For drinking water, desalination of 20,000 m 3 /day over three months will have an NPV of DT 8 million<br />
and an IRR of 32% with an B/C ratio greater than 1.<br />
b) Sanitation is profitable with or without drinking water and will create an NPV of 32 million DT with IRR<br />
22%.However, the water and sanitation combined matching investments are more profitable with an<br />
NPV of 17 million DT, an IRR of over 10% and a B/C ratio greater than 1.<br />
c) Transfer and disposal of municipal waste are only profitable if a transfer station and a landfill are<br />
established with power production from methane emissions in each governorate.These investments will<br />
have an NPV of 0.9 million DT, an IRR of 10% and a B/C ratio greater than 1.<br />
Five intervention areas are proposed <strong>for</strong> the integrated and sustainable management of the Medjerda water<br />
resources underlying the recommendations of this study:<br />
a) The gradual shift in the policy of intensifying natural resources exploitation, especially through<br />
mobilization of water resources. This shift can be achieved based on criteria that explicitly include<br />
economic per<strong>for</strong>mance and degradation as well as the scarcity of the Medjerda Basin resources.<br />
b) Focusing primarily on efficient investment <strong>for</strong> domestic pollution control in rural and peri-urban<br />
areasthat have been neglected in the past. The first priority would be <strong>for</strong> the State to invest in the<br />
expansion of drinking water and sanitation in rural areas of the basin where poverty is predominant, and<br />
<strong>for</strong> waste management to include not only a waste collection centre <strong>for</strong> each governorate, but also<br />
closure of illegal dumps.<br />
c) Planning of upstream interventions that reduce dam siltation in order to conclude upon the<br />
determinants of siltation and assess with precision the impact of anti-erosion measures in relation to<br />
control and mobilization of surface water as well as adapt erosion control methods based on their<br />
effective use by farmers.<br />
d) In partnership with water and environmental institutions, reorientation of a decentralized<br />
in<strong>for</strong>mation network <strong>for</strong> continuous observation, tracking, monitoring of the environment and natural<br />
resources in the Medjerda basin aiming at understanding and assessment of the environment and its<br />
impact on health and degradation of the natural capital to contribute to decision-making based on<br />
accurate, regular data and in<strong>for</strong>mation.<br />
e) The establishment of horizontal action <strong>for</strong> overall, integrated water management in the Medjerda<br />
watershed. This group will aim firstly to develop expertise in the assessment of benefits and damages<br />
and water conservation, and secondly to provide advice regarding ways and means of integrating this<br />
aspect into sectoral development programs and strategies, and finally to implement a system of<br />
monitoring and evaluation <strong>for</strong> investments and activities in the Medjerda basin.<br />
TUNISIA - DEGRADATION COST OF WATER RESOURCES OF THE MEDJERDABASIN 13
Sustainable Water Integrated Management (<strong>SWIM</strong>) - Support Mechanism<br />
Project funded by the <strong>European</strong> Union<br />
TUNISIA - DEGRADATION COST OF WATER RESOURCES OF THE MEDJERDABASIN 14
Sustainable Water Integrated Management (<strong>SWIM</strong>) - Support Mechanism<br />
Project funded by the <strong>European</strong> Union<br />
DEGRADATION AND mitigationCOSTS FOR WATER RESOURCES IN<br />
TUNISIA: MEDJERDA BASIN<br />
1. INTRODUCTION<br />
1. With a population of 10.6 million (2011) and a Gross Domestic Product (GDP) of 63.4 billion dinars in<br />
2010, 1 Tunisia still faces awatr allocation of estimated at 472 m 3 /habitant which will decrease to 315<br />
m 3 /habitant in 20 years 2 ranking among the 17 countries most hydraulically stressed compared to a regional<br />
average of 1,100 m 3 in 2011 and a global average of 6,600 m 3 .In addition, 4.5 million m 3 represent the<br />
Tunisian annual use of water resources, of which 2.7 million are surface water and 1.8 3 are groundwater<br />
resources.In addition, 75.63% 4 of water resources are allocated to agriculture and irrigation, to 12.81% water<br />
and 3.86% <strong>for</strong> the industry.The agricultural sector contributes about 10% of GDP and provides employment <strong>for</strong><br />
16% of the work<strong>for</strong>ce and 27% of the rural labour. It is expected that demand will exceed supply in the coming<br />
decades while a reduction of about 6% of the rainfall nationally is <strong>for</strong>ecasted during the same period due to<br />
climate change. These changes are already affecting the agricultural sector with consequences related to<br />
drought, necessitating rationing of water, flood or flash floods that have ravaged several villages.<br />
2. The Tunisian natural resources are limited in quantity and, partly, in quality and in actual potential <strong>for</strong><br />
exploitation. However, since the late 80s, Tunisia has achieved significant results in the mobilization of water<br />
resources, the conservation of water and soil, the fight against erosion, a full access of drinking water reaching<br />
almost 100% in urban areas and 94% in rural while urban access to sanitation is 99% albeit only 5% in rural<br />
areas.<br />
3. The surface area of arable land per capita (less than 0.3 hectare) is among the lowest in the<br />
Mediterranean region - an estimated 4.2 million hectares of land are more or less affected by wind and water<br />
erosion, out of which 2.5 million ha have already been managed by water and soil conservation works, while<br />
between 0.12 and 0.14 million ha of irrigable land have been affected by more or less high salinization. Land at<br />
risk of erosion (3.54 million hectares) are mainly concentrated in the centre of the country (48%) and in the<br />
South (36%). Soil management is also connected to water resources and largely influenced by policies related<br />
to rural employment and food security. Over 4.7 million hectares of arable land - including from 0.38 to 0.40<br />
million irrigable areas.Tunisia is subject to high land erosion and degradation, which is among the main causes<br />
of dam sedimentation estimated at 16-19 million m 3 annually 5 reducing their capacity by 0.8%<br />
annually.Mineral resources are also limited to only phosphates with a stagnant production volume around 6<br />
million tons.<br />
1 World Bank website: .<br />
2 World Bank. 2007. Making the most of scarcity. Accountability <strong>for</strong> better water management results in the Middle East and<br />
North Africa. MENA Development report.World Bank, Washington D.C.<br />
3 ANPE Report on the Network of Pollution Control in Tunisia 2010.<br />
4 World Bank website: .<br />
5 DGBTH. 2003. Management of siltationin the reservoirs of the large Tunisian dams, prepared by Ms M. Abid, 22p, and personal<br />
communication withDGACTA, July 2012.<br />
TUNISIA - DEGRADATION COST OF WATER RESOURCES OF THE MEDJERDABASIN 15
Sustainable Water Integrated Management (<strong>SWIM</strong>) - Support Mechanism<br />
Project funded by the <strong>European</strong> Union<br />
4. Since 1999, Tunisia has adopted a water resource strategy primarily addressing the mobilization of supply<br />
and demand management. The State has implemented this strategy through a ten year programme (2001-<br />
2011), built around three specific pillars: (i) integrated management and conservation of water resources; (ii)<br />
economic efficiency of water use in agriculture; and (iii) institutional restructuring and capacity building in the<br />
water sector.The Ministry of Agriculture (MoA) has initiated the preparation of the water strategy until 2050.<br />
Moreover, public investment <strong>for</strong> the 11th Plan (2006-2011) has been estimated at 2.2 billion DT, most of<br />
which are devoted to the management of natural resources, with 56% of the value allocated to activities<br />
related to water, 15% to <strong>for</strong>estry activities, and 10% at CES. 6 These investments were mainly based on<br />
technical solutions implemented by the services of the MoA.However, environmental and general benefits<br />
have not been estimated to reach optimal policies <strong>for</strong> sustainable management of natural resources, mainly<br />
water resources.<br />
5. Since the Revolution in January 2011, Tunisia has experienced a total upheaval in its socio-economic<br />
fabric.The new Government has focused on issues of employment, rural development and poverty reduction,<br />
especially in the Central West region where poverty has reached 29% compared to the Greater Tunis where<br />
poverty is 5-7%. 7 There<strong>for</strong>e, the MoA has highlighted the need to focus interventions, on the one hand, on the<br />
less privileged and disadvantaged, and, on the other, to manage natural resources in a participatory manner at<br />
the watershed level of these regions. In the latter, more specific prioritisation may be identified based on the<br />
cost and profit of interventions whereby sustainable water management is a critical component in reducing<br />
poverty, especially in rural areas.<br />
6 MARH. 2007. The 11th plan of economic and social development. Agriculture and Fishing Sector, 67p.ONAGRI website.<br />
7 World Bank website: .<br />
TUNISIA - DEGRADATION COST OF WATER RESOURCES OF THE MEDJERDABASIN 16
Sustainable Water Integrated Management (<strong>SWIM</strong>) - Support Mechanism<br />
Project funded by the <strong>European</strong> Union<br />
2. SUSTAINABLE WATER INTEGRATED MANAGEMENT – SUPPORT<br />
MECHANI<strong>SM</strong> (<strong>SWIM</strong>-<strong>SM</strong>)<br />
2.1 General overview<br />
Within this context, this regional study refers to the degradation cost of water resources at the<br />
watershed level, being supported by the <strong>SWIM</strong>-<strong>SM</strong> regional program.8 This is a regional programme <strong>for</strong><br />
technical support whose objective is to promote actively the extensive dissemination of sustainable<br />
water management policies and practices in the region given the context of increasing water scarcity,<br />
combined pressure on water resources from a wide range of users and desertification processes, in<br />
connection with climate change. Regional in scope and in order to add value and complement other<br />
regional processes through regional and national reproducible, the <strong>SWIM</strong>-<strong>SM</strong> program aims to:<br />
Provide strategic support to nine9southern Mediterranean countries partners of the<br />
<strong>European</strong> Union <strong>for</strong> the development and implementation of policies and plans <strong>for</strong><br />
sustainable management of water, involving a cross-sectoral dialogue and consultation of the<br />
institutions concerned.<br />
Contribute to the strengthening of institutions and the development of management<br />
and planning skills necessary as well as facilitating the transfer of expertise.<br />
6. One of five components of this project is the improvement of water governance and integration of water<br />
issues in sectoral policies such as policies in agriculture, industry, tourism, etc. This aims at making water an<br />
important element in policies and national development strategies.<br />
7. Although water issues and their impact on the economy have been assessed nationally, the situation is<br />
different at the watershed level because no clear identification of problems and costing associated with<br />
degradation have been completed yet. However, decisions must be made at the basin level regarding the<br />
management and protection of water resources, in close collaboration with local authorities, and in particular<br />
concerning systems of water and soil conservation and wastewater treatment on the regional/local level. The<br />
cost of water resources degradation (Cost of Water Resources Degradation or CWRD) would allow local<br />
institutions to have the necessary tools to discuss based on cost figures with the central authorities, the<br />
national ministries, and in particular with the Ministries of Finance, other competent authorities and the<br />
public, everything about the different types of costs of degradation and the policies needed to reduce these<br />
costs.<br />
8. Tunisia, through its national Focal Point, has requested assistance from <strong>SWIM</strong>-<strong>SM</strong> to estimate the<br />
degradation cost of water resources in the Medjerda watershed.This basin was selected based on the<br />
following reasons:<br />
8Website:
Sustainable Water Integrated Management (<strong>SWIM</strong>) - Support Mechanism<br />
Project funded by the <strong>European</strong> Union<br />
a) • The Medjerda is the longest river of Tunisia. Its source is from the north-eastern<br />
Algeria, it flows east towards Tunisia over a distance of 450 km, including 350 km in<br />
Tunisia and flows into the Mediterranean Sea.Medjerda is considered the country's water<br />
tower providing drinking water to more than 2.5 million people including the Greater Tunis area<br />
and its surroundings such as Cap Bon, Sahel and Sfax.<br />
b) The Medjerda crosses the six governorates of Beja, Jandouba, Le Kef, Siliana, Ariana and<br />
Manouba, which are mostly of rural and agricultural character.These governorates are rich in<br />
natural resources, contain 75% of water reserves and include more than half of the country's<br />
<strong>for</strong>est area (535,000 ha). However, socio-economic development of these governorates is limited<br />
due to low agricultural productivityand lack of services and opportunity <strong>for</strong> job creation.<br />
c) The Medjerda basin is crossed or affected by 9 storage dams, out of which two dams,<br />
the Sidi Salem dam (capacity of 814 million m 3 ) and the Nebeur-Mellegue dam (182 million m 3 ),<br />
are built on the river and are subject to significant siltation.<br />
d) The basin is experiencing a number of problems relating to natural resources and linked<br />
to erosion, salinity, drought and floods and dam siltation as well as problems linked to<br />
agricultural, municipal and industrial pollution.It is thought to be a representative basin <strong>for</strong> a<br />
thorough analysis of costs and benefits related to the degradation and restoration of water<br />
resources in Tunisia.<br />
e) The Medjerda basin has been the object of numerous reports and scientific and<br />
technical in<strong>for</strong>mation (which, when available, will be used in this study); however, none of these<br />
studies have addressed the economic dimension of the degradation of this basin and the cost <strong>for</strong><br />
its rehabilitation.<br />
2.2 Objective of the Study<br />
9. The main objective is to evaluate the cost of water resource degradation in the Medjerda watershed to<br />
help decision-makers at national and local levels to identify and prioritize specific actions to improve the<br />
management of this basin through potential funding of projects related to environmental benefits and the<br />
reduction of externalities.<br />
10. The expected results are:<br />
a) an overview of the economic aspects of the Medjerda watershed management<br />
problems;<br />
b) a cost assessment of water resources degradation in the Medjerda basin including<br />
ecological degradation and environmental health;<br />
c) an economic analysis of priority alternatives;<br />
d) specific recommendations in order to incorporate the advantages <strong>for</strong> the benefit of the<br />
environment and improve the management of this basin.<br />
11. The cost of the degradation of water resources can be considered as a measure of well-being loss due to<br />
the degradation of water resources. A well-being loss includes, but is not limited to:<br />
a) Loss of healthy life and well-being of the population (e.g., burden of disease);<br />
b) economic losses (e.g., income which some economic agents had to give up on); and<br />
c) loss of environmental and water opportunities (e.g., loss of tourism, fishing resources<br />
and biodiversity).<br />
TUNISIA - DEGRADATION COST OF WATER RESOURCES OF THE MEDJERDABASIN 18
Sustainable Water Integrated Management (<strong>SWIM</strong>) - Support Mechanism<br />
Project funded by the <strong>European</strong> Union<br />
TUNISIA - DEGRADATION COST OF WATER RESOURCES OF THE MEDJERDABASIN 19
Sustainable Water Integrated Management (<strong>SWIM</strong>) - Support Mechanism<br />
Project funded by the <strong>European</strong> Union<br />
3. THE MEDJERDA BASIN<br />
3.1. GENERAL DATA ON THE MEDJERDA BASIN<br />
12. The Medjerda Basin covers an area of 23,700 km 2 divided into three distinct parts. The first, called Higher<br />
Medjerda, spans from Algeria to Ghardimaou (7,870 km 2 ). The second, Middle Medjerda, includes all<br />
tributaries and extends to Medjez el Bab. Finally, Lower Medjerda, ends at the mouth of KalaatLandalous. The<br />
Medjerda Tunisian section covers an area of 15,930 km 2 , or 9.7% of the total area of the country, but reaches<br />
20,243 km 2 when all the structures built to bring water to the Greater Tunis, including Tunis and Ben Arous<br />
(other neighboring regions benefit from water transfer but are not included in the analysis), are considered.<br />
The basin displays semi-arid Mediterranean climate with an average rainfall ranging from 400-600 mm. In<br />
2010, the total population was estimated to be 2.2 million, or approximately 21.2% of the Tunisian population,<br />
with a population density of 110 inhabitants per km 2 , which is higher than the national average of 68<br />
inhabitants per km 2 .10 In addition, 37% of the population is either urban or municipal and 63% of the<br />
population is rural.The most populous areas are located in the plains along the river and itstributaries. 6<br />
governorates Jandouba, Beja, Kef, Siliana, Ariana and Manouba are mainly rural and hold one third of the<br />
<strong>for</strong>est area, a quarter of the best agricultural land and 2/3 water mobilized the country. 11 With a large<br />
agricultural area, the pillar industry of the basin is agriculture, which employs more than 87,500 people and<br />
contributes 50% of food production in the country. Moreover, it is also an important center of agricultural<br />
farming. Thus, a large part of the water resources of the basin is allocated to irrigation and livestock.<br />
13. The Available Gross National Income per capita was about 6,054 DT in Tunisia in 2010 with a lower per<br />
capita income, which could reach 50% in some areas of the Medjerda basin. The area of the Northwest is the<br />
most affected by illiteracy, especially among women, reaching 43% in 2004. The area of the Northwest also<br />
recorded a high level of unemployment at 19.6% in 2007. 12<br />
Box 3.1: Main Features of the Medjerda Basin<br />
River length: 450 km in Algeria and Tunisia, 350 km of which in Tunisia.<br />
Surface area of the watershed: 15,930 km 2 or 9.7% of the surface area of Tunisia.<br />
Population: 2.2 million inhabitants (21.2% of the total population), of which 1.6 million people in rural areas.<br />
Structures: 9 dams.<br />
Agriculture: 25% of the agricultural sector and the most fertile region of Tunisia.<br />
Drinking Water: Main source <strong>for</strong> more than 3.8 million inhabitants including the inhabitants of Medjerda and<br />
Greater Tunis (Tunis and Ben Arous) and other neighbouring regions. They depend more or less locally on the<br />
Medjerda water resources but are not included in the analysis.<br />
14. The Medjerda Basin (Box 3.1 and Figure 3.1) is supplied by 4 tributaries or wadis on the left bank and five<br />
wadis on the right bank of the river. The river is perennial and has a mean annual flow of 29 m 3 /s with large<br />
seasonal variations. However, the basin is subject to deep waterlogging and salinization due to stagnation of<br />
10 The study of the Integrated Management of the Basin.Final Report on the Regulation of Flooding in the Basin of Medjerda,<br />
Summary, (January 2009 Nippon Koei Co. Ltd.)<br />
11 Feasibility study: Management of municipal waste of the Valley of the MedjerdaANGed 2010.<br />
12 Ibid.<br />
TUNISIA - DEGRADATION COST OF WATER RESOURCES OF THE MEDJERDABASIN 20
Sustainable Water Integrated Management (<strong>SWIM</strong>) - Support Mechanism<br />
Project funded by the <strong>European</strong> Union<br />
saline runoff water. Waterlogging and salinity are the cause of land degradation, which can reach up to 60% of<br />
the land in the region thus contributing to dam reservoir sedimentation and to their reduced capacity.<br />
There<strong>for</strong>e, usually, runoff and drainage waters, enriched with soluble elements, flow towards the lower parts<br />
of watersheds and, in the case of Medjerda, the watershed becomes an outlet and salts migrate downstream<br />
to the basin to the particular detriment of drinking water quality and agricultural productivity.<br />
15. Similarly, the construction of nine dams on the river and its tributaries has changed its flow regime. These<br />
dams are primarily used <strong>for</strong> storing water during water rise, to regularize their disposal <strong>for</strong> the purposes of<br />
agriculture and irrigation and <strong>for</strong> water use during drought periods (Table 3.1). Due to severe erosion of the<br />
alluvia because of the river flow and a considerable loss of the <strong>for</strong>est regime, these dams have been subject to<br />
siltation, which has reduced their storage capacity, and it is expected that due to climate change, such storage<br />
capacity will decrease from 30% to 40% by 2030.<br />
Table 3.1: Dam siltation in the Medjerda, 1950-2010<br />
Dam Watershe<br />
d<br />
Initial<br />
capacity<br />
Commis<br />
sioned<br />
Installed<br />
HE power<br />
Siltation<br />
since<br />
commission<br />
Siltation in<br />
2010<br />
Percentage of siltation<br />
since commission<br />
km 2 Million m 3 Year MW Million m 3 Million m 3 %<br />
Nebeur-<br />
10,300 182 1954 13.0 122 2.5 67<br />
Mellegue<br />
Ben Metir 103 62 1954 9.0<br />
Kasseb 101 82 1968 0.7 3 0.2 3<br />
BouHertma 390 178 1976 6 0.2 5<br />
Sidi Salem 7,950 814 1981 36.0 171 6.8 21<br />
Siliana 1,040 70 1987 17 1.1 24<br />
Lakhmess 127 8 1966 1 0.0 12<br />
Rmel 232 4 2002<br />
Laaroussia 1950<br />
Total 20,243 1,399 58.7 319 10.8 0.8%<br />
Source: Data provided by the MoA, Dams and Large Hydraulic Works, Directorate of Dam Operations and Hydraulic<br />
Structures Maintenance (2010).<br />
16. The largest dam in Tunisia is the one of Sidi Salem on Medjerda, which covers more than 7,950 km 2 .At a<br />
height of 54 meters and a capacity of up to 750 million m 3 reservoir with a surface of 4,300 hectares, it has a<br />
20 MW hydroelectric plant and spillway. 13 Several other dams reservoirs help control the waters of the basin<br />
including the two commissioned in 1954 Nebeur on the Melleguewadi, which covers 10,300 km 2 and is<br />
currently silted now with 122 million m 3 of capacity lost since 1954 as compared to 182 million m 3 at baseline<br />
(but 188 against 306 of small scale hydroelectric plants) and Ben Mandir, controlling 103 km 2 of the watershed<br />
in an area of high rainfall with water of very good quality. The Sidi Salem, Nebeur, BouHertma and Siliana<br />
dams have an important role in water rise management and the fight against floods and provide regular water<br />
to downstream users. The Kasseb, Lakhmess and Rmel dams produce some electricity and are mainly intended<br />
<strong>for</strong> irrigation. However, small-scale hydroelectric works increase sedimentation of riverbeds downstream and<br />
affect biodiversity. Finally, the Laaroussia Dam is used <strong>for</strong> irrigation and drinking water through: the Canal of<br />
Taulierville (or Great Canal) built in 1956 with a length of 56 km, a capacity of 13 m 3 /s, which is used <strong>for</strong> the<br />
irrigation across the old areas of the Medjerda Lower Valley of 31,000 ha; the subnet of the Medjerda Lower<br />
Valley is used to irrigate 6,000 ha of new areas; and the Medjerda - Cap Bon Canal subnet, which has operated<br />
13 Wikipedia website: .<br />
TUNISIA - DEGRADATION COST OF WATER RESOURCES OF THE MEDJERDABASIN 21
Sustainable Water Integrated Management (<strong>SWIM</strong>) - Support Mechanism<br />
Project funded by the <strong>European</strong> Union<br />
since 1984 with a length of 120 km, flow starting at 16 m 3 /s and ending at 8.8 m 3 /s, while finishing at the Belli<br />
treatment plant (see SONEDE below).<br />
17. Hydroelectric (HE) production, which is concentrated in the north of Tunisia, strongly correlated with<br />
rainfall in the north-east and north-west of Tunisia between 2000 and 2010 (correlation coefficient 0.85). The<br />
annual average over the period was 89 million kW/h with an average of 0.7% of the total electricity<br />
production.<br />
Figure 3.1: Medjerda Basin<br />
Note: 6 of 9 dams are simply indicated.<br />
Source: ANPE Cooperation Committee Marseille Provence Mediterranean September 2011.<br />
18. Since 1973, the Medjerdawadi 14 has been subject to intensive flood periods that have been devastating<br />
on both sides of the river, submerging villages including Boussalem area in the governorate of Jendouba and<br />
many other areas surrounding the Medjerdawadi such as Jdaida and El Battan in the governorate of Manouba.<br />
Given the high, acute rates, dams such as the Sidi Salem and Mellegue have required releases of flood<br />
volumes up to 750 m 3 per second causing an overflow of the river bed which was accompanied by the<br />
transport of large volumes of sediment along the riverbed, thus contributing to increased flooding, increased<br />
the "delta-ization" of the river mouth 15 (an increase equivalent to 6.2 km 2 in the 20th century) and thus<br />
affecting biodiversity.<br />
14 The study of the Integrated Management of the Basin.Final Report on the Regulation of Flooding in the Basin of Medjerda,<br />
Summary, (January 2009 Nippon Koei Co. Ltd.)<br />
15 Jebari et al. (2012).<br />
TUNISIA - DEGRADATION COST OF WATER RESOURCES OF THE MEDJERDABASIN 22
Sustainable Water Integrated Management (<strong>SWIM</strong>) - Support Mechanism<br />
Project funded by the <strong>European</strong> Union<br />
3.2. POLLUTION OF THE MEDJERDA BASIN<br />
19. Pollution at the Medjerda is characterised by agricultural, industrial and urban pollution.16 Agricultural<br />
pollution is due to concentrations of phosphates, nitrates and fertilizers because of the production of<br />
vegetables, fruits and grains and cattle raising. Similarly, land irrigation generates salinity that exceeds the<br />
threshold of 0.2 g/liter stipulated by <strong>European</strong> regulations <strong>for</strong> drinking water as compared to 1% to 1.5% <strong>for</strong><br />
the Tunisian regulations. This salinity is due to the groundwater salinity, which ranges from 1.5 to 2 g/liter and<br />
can reach up to 5-7 g/liter, and also to the intrusion of seawater. In view of salinization in some areas of the<br />
Cap Bon region, farmers are <strong>for</strong>ced to mix groundwater with water from the public network, to improve<br />
quality, but at a higher cost. Drainage containing nitrates and pesticides used <strong>for</strong> agricultural activities was<br />
estimated at 2.213m 3 /day.<br />
20. Industrial pollution is mainly due to the food industry, such as the manufacture of dairy products and<br />
cheeses, olive (oil) and tomato processing (oil) and sugar production.Industrial discharges not connected to<br />
the ONAS network are estimated at 221 m 3 /day.This industry accounts <strong>for</strong> 90% of industrial discharges and 5%<br />
of discharges into the Medjerda watercourses.Other industries, such as the textile, plastics and automobile<br />
industries, generate releases of 0.44% in the watercourses.Such liquid waste, estimated at 221 m 3 /day,<br />
contributes to a high level of Chemical Oxygen Demand (COD).<br />
21. Urban domestic pollution is mainly due to domestic wastewater discharges of untreated urban water<br />
estimated at 1.27 million m 3 /year and to water discharges of treated sewage from 19 ONAS wastewater<br />
treatment plants estimated at 12 million m 3 /year.Pollutant loads discharged into water courses are 886<br />
kg/day of Biological Oxygen Demand (BOD5) or 2,142 kg/day of nitrogen and 315 kg/day of phosphorus. These<br />
loads are responsible <strong>for</strong> eutrophication observed in the reservoirs of the Sidi Salem and Siliana dams.In<br />
addition, wastewater from villages is not treated.Bacteriological analyses have shown amounts of faecal germs<br />
exceeding 11,000 total coli<strong>for</strong>ms/100 ml in water points in Jandouba, BouSalemm the Polluted Water<br />
Treatment Station (STEP) in Beja and at the West of Siliana.<br />
22. Urban pollution is also due to part of the solid waste estimated at 149,000 tons per year <strong>for</strong> the four<br />
Northwest governorates of Medjerda. 17 This figure is tripled when all 6 governorates of Medjerda are taken<br />
into account. Waste collection, representing 0.71 kg/day/inhabitant on average, has a rate of almost total<br />
coverage in urban, suburban centres and some municipalities (covering approximately 30% of the population<br />
of the basin). However, the problem lies with after-collection management.Thus, waste collected in the four<br />
Northwest governorates is buried in 38 landfills listed by GIZ (2011): 7 landfills (including Beja, Mejez el Bab,<br />
Jandouba and Ain Drahem commissioned in 1999) are considered semi-controlled but they are effectively<br />
unregulated dumps as concerns their impact on the environment with mismanagement of waste burial,<br />
leachate (basin overflow and rare treatment by ONAS) and degassing (methane); 24 municipal landfills are<br />
considered unregulated and are located on the banks of the Medjerda and its tributaries; and 7 landfills, which<br />
are apparently not under any institution, are also considered unregulated. Waste from these landfills<br />
generates a significant amount of leachate flowing into outlying areas and neighboringwadis. To this, the<br />
sludge from the 19 STEPs of ONAS may be added (5,580 tons of dry stabilized sludge whose quality meets the<br />
16Characterisation of types of pollution in the Medjerda wadi in Tunisia, Cooperation Committee Provence Mediterranean,<br />
Water Agency, COPEAU, ANPE, September 2011.<br />
17 Feasibility Study: Management of Municipal Waste of the Valley of the MedjerdaANGed 2010.<br />
TUNISIA - DEGRADATION COST OF WATER RESOURCES OF THE MEDJERDABASIN 23
Sustainable Water Integrated Management (<strong>SWIM</strong>) - Support Mechanism<br />
Project funded by the <strong>European</strong> Union<br />
country standards, part of which is used as fertilizer); this is either stored in the enclosure the STEPs or<br />
discharged into wadis and sometimes mixed with leachate. In addition, debris from the<br />
destruction/construction (49,000 tons) are also discharged in part with these discharges while the rest ends up<br />
in the wasteland, wilderness or in the wadis. Finally, agricultural residues and agro-industrial wastes present<br />
an opportunity to generate electricity but are mostly already recycled. ECO-lef has initiated a recycling project<br />
<strong>for</strong> plastics with a little less than 600 tons recycled in 2010. As part of the National Programme <strong>for</strong> Integrated<br />
Sustainable Solid Waste Management, a study by GIZ has taken up the conclusions of a feasibility study<br />
conducted in 2005 to set up a centralized waste management system including at least two landfills and<br />
transfer centres, in order to enable the management of waste generated in 38 municipalities.<br />
23. Rural pollution from solid and liquid waste remains a problem in the Medjerda Basin. Also, the rate of<br />
coverage <strong>for</strong> improved sanitation does not exceed 5%, while solid waste is not collected thus increasing the<br />
risk of the drainage affecting the basin. In addition, agricultural residues and agro-industrial wastes present an<br />
opportunity to generate electricity but are mostly already recycled.<br />
24. Regarding the parameters related to the quality of the resource, 18 the basin water quality varies<br />
depending on the particular wadi and the climate in 2010, but it is generally regarded as fair.The salinity of the<br />
wadi waters demonstrates great fluctuations and tends to drop after floods while increasing in times of<br />
drought (see here below and Figure 3.2). Dissolved oxygen findings comply with standards except <strong>for</strong> the<br />
Kassebwadi because of releases of organic matter content from the food industries. COD values are usually<br />
below the standard with the exception of the Kasseb and Jdaidawadis. Suspended solids are generally all<br />
above the norm, especially <strong>for</strong> the Battan, Jdaida, and Gantaret Bizerte wadis. However, COD pollution caused<br />
by suspended solids is not organic <strong>for</strong> these three wadis. Regarding nitrates, the whole basin is of fair quality,<br />
with peaks in the Kasseb, Beja, Siliana, Kalled and Zargawadis, especially in December which may promote<br />
eutrophication. Concentrations of phosphate content exceed the standards and the waters are mostly poor to<br />
very poor quality due to the effects of agricultural runoff loaded with fertilizers after flooding. Bacteriological<br />
analysis indicates fair water quality with Jendouba, Bou Salem, Beja STEP, and Siliana being particularly<br />
affected by the presence of faecal germs in large quantities. This concerns the total number of coli<strong>for</strong>ms and<br />
enterococci indicating possible contamination by raw sewage. However, the presence of enterococci in high<br />
enough numbers shows that there is a fairly old water contamination. 19<br />
25. Concerning surface sediments along the Medjerda, tests have confirmed fluctuating prevalence especially<br />
of heavy metals and PCBs in sediments.For example, OuedKasseb exhibits very strong contamination by PCBs<br />
and heavy metals, primarily arsenic, cadmium, lead and zinc, 20 but also copper, antimony and barium. 21 These<br />
heavy metals from industrial activities or outside food processing, fertilizers used in agriculture such as arsenic<br />
and copper in waste dumps and the 12 old mines of lead, zinc, iron and cadmium.<br />
26. Indeed, almost all of these mines, whose operation began in the late nineteenth century, have been<br />
abandoned in the area of Medjerda over recent decades. Remains: the production of iron ore to Jerrissa in the<br />
governorate of Kef (107,000 tonnes in 2010), the production of iron ore (363,690 tons), zinc (76 560 tonnes)<br />
and lead (9,890 tonnes) of Bougrine always Kef, and the imminent reopening of the phosphate mines of Sra<br />
Ouertane in the governorate of Kef. 22 However, various studies highlight the persistent risk of transfer of<br />
18 Pollution characterisation in the MedjerdaWadi (2011).<br />
19 Ibid.<br />
20 Hélali M.A. et al. 2009. Mediterranean Review of the Environment 3 (2009) 485-497 496.<br />
21 Ibid.<br />
22 USDI (2012).<br />
TUNISIA - DEGRADATION COST OF WATER RESOURCES OF THE MEDJERDABASIN 24
Sustainable Water Integrated Management (<strong>SWIM</strong>) - Support Mechanism<br />
Project funded by the <strong>European</strong> Union<br />
heavy metals in the food chain downstream of the old mines such as the levels of lead, zinc and cadmium very<br />
high downstream of the old mine in the governorate AkhouetSiliana. 23<br />
27. Concerning surface water resources, the salinity of the main river course is generally high (Figure 3.2).<br />
This is mainly due to water inflow from tributaries of the right bank (Siliana and Tessa wadis) whose salinity is<br />
high, but also the absence of flooding during this period and the drop of the Medjerda water level by<br />
evaporation resulting in salt concentration. On the other hand, it is at the Kassebwadi (left bank) that we find<br />
the lowest salinity levels. In addition, the salinity increases significantly in December as compared to the<br />
month of March. 24 Still, Tunisia has implemented several enhancement works <strong>for</strong> the salt-affected soils,<br />
especially in the central and southern regions, thus acquiring a unique experience.<br />
Figure 3.2: Soil and water salinity in the Medjerda Basin<br />
Source: Hachicha (2007), and Copeau Bulletin No. 2 (2008). 2 (2008).<br />
28. Concerning soil salinity, scarcity and variability of rainfall as well as high evaporation affect the water and<br />
salt balance in the soil, with several areas of the Medjerda basin consisting of soluble salts. Thus, runoff and<br />
drainage enriched soluble elements, which are natural and/or anthropogenic (runoff irrigation water charged<br />
nitrogen) flow to the lower parts of watersheds. 25 According to Figure 3.2, the Jendouba and low Medjerda<br />
have evolved slightly salty soils bit except the hillside on the left bank (Siliana and Tessa) and the mouth of the<br />
river include alkali soils very salty.<br />
29. In summary, the water and agricultural land quality is affected by salinity with an impact on the water<br />
quality of the Greater Tunis (salt levels) and agricultural productivity in some areas of the basin. Depending on<br />
the season (wet or dry, with the intensity and frequency set to be exacerbated by climate change), erosion<br />
along the Medjerda affects the storage capacity of dams, while the management thereof during large floods<br />
requires releases flooding agricultural plains downstream, thus placing sediments along the wadi beds, "deltaising"<br />
the coastal areas and affecting biodiversity. Also, the quality of water resources is largely affected by<br />
water pollution sources of anthropogenic origin and consist of the following:<br />
- Industrial waste water not connected to the ONAS network;<br />
- Discharges of treated wastewater from STEPs;<br />
- Discharges of untreated urban wastewater;<br />
23 INGREF.200-.Studies on the mobility of heavy metals from mining waste of the Akhouat site.<br />
24 Copeau Bulletin No.2 (2008).<br />
25 Hachicha (2007).<br />
TUNISIA - DEGRADATION COST OF WATER RESOURCES OF THE MEDJERDABASIN 25
Sustainable Water Integrated Management (<strong>SWIM</strong>) - Support Mechanism<br />
Project funded by the <strong>European</strong> Union<br />
- Drainage of untreated rural wastewater;<br />
- Drainage of pesticides, phosphates and nitrates used <strong>for</strong> agricultural activities;<br />
- Drainage of wastewater due to stock raising activities;<br />
- Drainage from slaughterhouses;<br />
- The transfer of heavy metals from old mines and one mine still in operation; and<br />
- Drainage from solid waste and leachate, especially during the rainy season.<br />
3.3. ORGANISATIONAL AND INSTITUTIONAL FRAMEWORK IN THE MEDJERDA<br />
BASIN<br />
30. The main public institutions responsible <strong>for</strong> pollution management and/or contributing to pollution<br />
control in the Medjerda basin are:<br />
a) Ministry <strong>for</strong> Agriculture (MoA);<br />
b) Ministry <strong>for</strong> the Environment (MdE); and<br />
c) Ministry <strong>for</strong> Public Health (MdSP).<br />
3.3.1. Ministry <strong>for</strong> Agriculture<br />
31. Pursuant to Article 2 of Decree No. 2001-419, the MoA is responsible <strong>for</strong> water management.It is also<br />
responsible <strong>for</strong> agriculture, natural resources, soil conservation, plant science and <strong>for</strong>estry as well as the<br />
management of large dams.The Ministry carries out its functions at its headquarters through the central<br />
directorates and outside the headquarters through semi-autonomous institutions such as the Regional<br />
Committees <strong>for</strong> Agricultural Development (CRDA), the Office <strong>for</strong> Sylvo-Pastoral Development of the North-<br />
West (ODESYPANO) and public enterprises such as the National Association <strong>for</strong> Water Exploitation and<br />
Distribution (SONEDE).For Medjerda, the following general directorates and institutions are involved at central<br />
level:<br />
a) The General Directorate <strong>for</strong> Dams and Hydraulic Works (DGBGTH) is responsible <strong>for</strong> the<br />
management, regulation and monitoring of dam water quality and infrastructure.The DGBGTH is<br />
responsible <strong>for</strong> the implementation of dam policy and prepares a daily report on the state of dams,<br />
their capacity, their level of siltation that has not been controlled during their construction.With JICA<br />
assistance, the DGBGTH has prepared a study relating to the Integrated Basin Management Focused<br />
on the Regulation of Flooding in the Medjerda Basin.The main objective of this study is to prepare a<br />
blueprint on the integrated management of the basin focusing on flooding the Medjerdawadi.<br />
b) The Directorate General of Water Resources (DGRE) is responsible <strong>for</strong> the Medjerda<br />
hydrometric network and its surface and ground water.The DGRE monitors salinity and nitrates in the<br />
Medjerda <strong>for</strong> agriculture and irrigation.<br />
c) The Directorate General <strong>for</strong> the Development and Conservation of Agricultural Land (DGACTA)<br />
is responsible <strong>for</strong> the assessment of natural resources, soil conservation, preservation of hydrological<br />
and hydrogeological aspects.The DGACTA has begun to prepare inventories of watersheds and soil<br />
TUNISIA - DEGRADATION COST OF WATER RESOURCES OF THE MEDJERDABASIN 26
Sustainable Water Integrated Management (<strong>SWIM</strong>) - Support Mechanism<br />
Project funded by the <strong>European</strong> Union<br />
characterization.The DGACTA keeps track of its activities based on five indicators <strong>for</strong> target budgeting<br />
purposes as a function of: (i) agricultural land surveyed and monitored; (ii) agricultural land irrigated;<br />
(iii) land managed by the CES; (iv) land managed and maintained; and (v) agricultural land whose use<br />
has changed.<br />
d) The General Directorate of Rural Engineering and Water Exploitation (DGGREE) provides<br />
education, management and distribution of agricultural water in irrigated areas including treated<br />
wastewater (EUT) as well as drinking water in rural areas. Irrigation water was more directed towards<br />
large hydraulic works and not enough towards small and medium works which still face basic<br />
problems due to lack of socio-economic studies.<br />
e) The General Directorate of Forestry (DGF) has a mandate to ensure the protection and<br />
management of the <strong>for</strong>est area of the State in accordance with the revised Forestry Code (Law 88-20<br />
of 04/13/1988), as well as decrees and opinions relating thereto.The DGF also has directorates in the<br />
Medjerda governorates.The DFG is the focal point <strong>for</strong> climate change adaptation and responsible <strong>for</strong><br />
the sylvo-pastoral strategy which includes re<strong>for</strong>estation of watershed dams and hill lakes in the<br />
Medjerdawadi.<br />
f) The General Directorate of Agricultural Pesticides (APD) is responsible <strong>for</strong> pesticide importation<br />
and monitoring, pesticide residue analysis in acericulture and arboriculture.<br />
g) SONEDE is a public industrial and commercial enterprise with financial autonomy under the<br />
supervision of the MdA.It is responsible <strong>for</strong> the production and distribution of drinking water and<br />
industrial water management.For the Medjerdawadi, the Ghdir El Golla (GEG) complex, located<br />
northwest of the capital, maintains reserve raw water <strong>for</strong> food security, ensures drinking water<br />
treatment necessary <strong>for</strong> the Greater Tunis (governorates of Tunis, Ariana, Ben Arous and Manouba)<br />
and contributes an amount to Cap Bon (governorate of Nabeul) and the governorates of Bizerte and<br />
Zaghouan as needed.These waters come from two dams on the Sidi Salem at the Medjerdawadi as<br />
well as dams in the Northwest passing through the Medjerda/Cap Bon canal.The production capacity<br />
of the complex is 600,000 m³/day. The GEG complex, which undertakes physico-chemical testing at<br />
the entrance and exit of the complex, produces good quality water with a low detection rate of 1.5%<br />
which is well below the standards of 5% set by the World Health Organization (WHO). Effective,<br />
ingenious management of the GEG complex, based on a mixture of water from the Medjerda Canal<br />
(Medjez El Bab), the Kasseb Dam (Amdoun) and the BeniMetir Dam (Fernana), ensures drinking water<br />
without bacterial contamination after treatment, but problems may arise during water distribution,<br />
as it is sometimes contaminated by seepage, e.g. during network repair works.In addition, two water<br />
treatment stations in Belli, with a total capacity of 80,000 m 3 /day, are located south of the Grombalia<br />
delegation, 42 km from Tunis. Raw water, from the dams of Northern Waters (Joumine, Sidi Salem<br />
and Sejnane) via the Medjerda/Cap Bon canal, is treated at these stations and supplies parts of Cap<br />
Bon, Sahel ( governorates of Sousse, Monastir and Mahdia) and Sfax. Also, the station, located in the<br />
Ain Draham delegation, treats the Ben Metir dam water, produces a daily volume of 110,000 m 3 /day<br />
conveyed to Tunis and allows <strong>for</strong> the supply of drinking water to several cities and villages of<br />
Northwest Tunisia along the way. All this is to say that there is a combination of the water resources<br />
of several watersheds serving the Greater Tunis and the surrounding areas. This combination does<br />
not allow <strong>for</strong> clear distinction as to the origin of the water but it allows, among other things, <strong>for</strong> the<br />
reduction of water salinity, especially in summer, intended <strong>for</strong> the Greater Tunis and its surrounding<br />
areas.<br />
TUNISIA - DEGRADATION COST OF WATER RESOURCES OF THE MEDJERDABASIN 27
Sustainable Water Integrated Management (<strong>SWIM</strong>) - Support Mechanism<br />
Project funded by the <strong>European</strong> Union<br />
h) The Association <strong>for</strong> the Exploitation of Canal and Water Supply Systems of the North<br />
(SECADENORD) operates, manages, and maintains the canal and water transfer pipes from the dams<br />
of Sidi Salem, Lake Ichkeul, and the extreme north of Tunisia up to the point of use.This Association is<br />
responsible <strong>for</strong> the distribution and sale of dam water to various organizations such as SONEDE and<br />
CRDAs (see above).The SECADENORD sells the water at 0.37 DT/m 3 to SONEDE which resells it to the<br />
end user at 1.45 DT/m 3 <strong>for</strong> the first tranche. SONEDE covers the deficit of his own treasury: in essence<br />
the average cost of returns is 7.16 DT while the average cost of sale is DT 5.62 per m 3 .Rates have<br />
been frozen since 2005, but an increase was authorized in 2010.<br />
i) The National Agronomic Institute of Tunisia (INAT) is an institution of Agricultural Education and<br />
Research under the dual supervision of the MdA and the Ministry of Higher Education.The INAT has<br />
conducted physico-chemical testing as well as bioassays <strong>for</strong> nitrates, orthophosphates and nitrites.<br />
The centre is currently undertaking a risk assessment of the Medjerda water quality to be completed<br />
in 2013.<br />
32. The following institutions are involved in the Medjerda basin at regional and local level:<br />
a) The CDRAs are responsible <strong>for</strong> the implementation of agricultural policy at local and regional<br />
levels and are under the supervision of the MdA.The CRDAs per<strong>for</strong>m agricultural projects in<br />
conjunction the governor and in accordance with the laws and regulations in effect.The CRDAs<br />
per<strong>for</strong>m land clearance operations and monitor the agrarian re<strong>for</strong>m operations <strong>for</strong> agricultural<br />
land.They are also responsible <strong>for</strong> managing hydro-agricultural infrastructure and the supply of<br />
different areas.The 4 CRDAs, covering the 4 administrative governorates of the wadi, represent the<br />
central services of the MdA.<br />
b) ODESYPANO is a semi-autonomous agent, under the supervision of the MdA, and a Public<br />
Establishment <strong>for</strong> Non-Administrative Character since 1996. Its mandate is the implementation of<br />
agricultural policy in mountainous areas and <strong>for</strong>ests of the Northwest and the protection of<br />
vulnerable ecosystems and development of rural infrastructure in this region.It is a decentralized<br />
structure with headquarters at Beja and the regional jurisdiction to implement the national<br />
development policies in the six governorates of Beja, Jendouba, Le Kef, Siliana, Ariana and Manouba,<br />
all crossed by the Medjerda.The ODESYPANO and the CRDAs of the 6 governorates of the<br />
Medjerdawadi work closely together; however, activities and investments on mountainous areas are<br />
the responsibility of the ODESYPANO while activities and investments on the plains and grasslands<br />
are managed by the CRDAs.<br />
3.3.2. Ministry <strong>for</strong> the Environment<br />
33. The MoE has a mandate <strong>for</strong> the protection of natural resources, the fight against pollution, the protection<br />
of the quality of life and the fight against the impact of climate change and desertification. This Ministry is also<br />
involved in investment and pollution control through:<br />
a) The Directorate General <strong>for</strong> the Environment and Quality of Life (DGQEV) is one of the key<br />
directorates <strong>for</strong> <strong>for</strong>mulating and implementing national environmental policy.The DGQEV has<br />
undertaken a number of studies that include the Medjerdawadi, including the inventory of potential<br />
major pollution sources and the establishment of a national network <strong>for</strong> monitoring water pollution,<br />
TUNISIA - DEGRADATION COST OF WATER RESOURCES OF THE MEDJERDABASIN 28
Sustainable Water Integrated Management (<strong>SWIM</strong>) - Support Mechanism<br />
Project funded by the <strong>European</strong> Union<br />
which includes 25 monitoring stations along the Medjerda river, a biodiversity strategy and action<br />
plan, management plans <strong>for</strong> national parks, the National Strategy <strong>for</strong> Adaptation of Tunisian<br />
agriculture and ecosystems to climate change (with the assistance of GIZ), health and climate change<br />
as well as studies of olive oil production wastewater and unregulated landfills at the national<br />
level.The DGQEV also participates in the Investment Project in the Water Sector (PISEAU) II, which is<br />
funded by the World Bank, the French Development Agency and the African Development Bank and<br />
includes four of the CRDAs of the northwest.<br />
b) The National Agency <strong>for</strong> Environmental Protection 26 (ANPE) has a mandate to fight against all<br />
sources of pollution and disturbance and control and monitor pollutants and waste treatment<br />
facilities of such discharges.The pollution control and monitoring department is responsible <strong>for</strong> the<br />
supervision and control of air, water and soil pollution.This department within the ANPE, with the<br />
assistance of the University of Liège, has implemented the COPEAU project, a Control Network <strong>for</strong><br />
Water Pollution.The Department has published a comprehensive report concerning the<br />
Characterization of pollution at the Medjerdawadi in September 2011 in collaboration with the<br />
Cooperation Committee Marseille Provence Mediterranean.This report, which was used <strong>for</strong> the study<br />
of the degradation cost of water resources, identified sources of pollution throughout the<br />
Medjerdawadi, measured the quality of surface water in terms of physico-chemical and<br />
bacteriological aspects as well as the physico-chemical quality of the surface sediments.The<br />
department also conducted with the University of Liege-Aquapole a feasibility study 27 of a<br />
methodology <strong>for</strong> modelling watershed Medjerda to use the PEGASE model developed by Aquapole to<br />
establish a relationship pressure/impact loads of pollution and water quality of Medjerda. The report<br />
concluded that the PEGASE model could be applied through model adaptation to the local context of<br />
the basin.<br />
c) The National Office of Sanitation (ONAS) has the prerogative of fighting against water pollution<br />
sources, as well as planning, management, operation and maintenance of sanitation stations in urban<br />
areas.ONAS has a plan <strong>for</strong> implementing sanitation in rural areas and more generally in the towns of<br />
over 4,000 inhabitants in 2021. A pilot study of rural sanitation has shown the extent of the problem:<br />
almost half of the population is not linked to a sewerage network and 20% of the population still uses<br />
septic tanks.Also the problem of industrial waste has not yet been resolved and treatment plants<br />
continue to receive industrial waste mixed with domestic wastewater without pre-treatment.There is<br />
also an institutional vacuum <strong>for</strong> the establishment and management of wastewater treatment plants<br />
in towns of over 4,000 habitats. Such villages do not fall under the mandates of ONAS, DGGREE or<br />
SONEDE.<br />
d) The National Agency <strong>for</strong> Waste Management (ANGed) is a public institution founded in 2005<br />
under the Ministry of Environment and constitutes a legal entity with financial autonomy.Its mission<br />
is to plan, promote and support local communities in the sustainable management of waste, primarily<br />
in landfills and household waste treatment.Be<strong>for</strong>e the establishment of the ANGed, four semicontrolled<br />
landfills were built in the valley of the Medjerda, Beja, Jendouba, Medjez el Bab, and<br />
Siliana with the assistance of the German Technical Cooperation and managed primarily by ONAS.In<br />
2005, the German Government agreed in principle to finance a system <strong>for</strong> the integrated<br />
management of municipal waste in the region of the Medjerda Valley.A prefeasibility study was<br />
completed in 2007 and was followed by a feasibility study 28 , which was completed in July 2010. This<br />
26 Website of the National Agency <strong>for</strong> the Protection of the Environment: .<br />
27 J-F.Deliège, T. Bourouag, C. Blockx, X. Detienne, E. Everbecq, A. Grard, report on the modeling studyon the global scale of the<br />
Medjerda watershed, AquapôleCampus of the University of Liege, September 2009.<br />
28 Feasibility study: Waste Management, Municipalities of the Valley of the Medjerda, Phase 1 – Current Status Diagnostic and<br />
Definition of Objectives, July 2010.<br />
TUNISIA - DEGRADATION COST OF WATER RESOURCES OF THE MEDJERDABASIN 29
Sustainable Water Integrated Management (<strong>SWIM</strong>) - Support Mechanism<br />
Project funded by the <strong>European</strong> Union<br />
study proposes to treat all urban municipal waste (household, plastics, sludge WWTPs, industrial<br />
waste and waste health activities) to an annual average of 224,537 tons.However, the rural<br />
household waste will not be considered.<br />
3.3.3. Ministry <strong>for</strong> Public Health<br />
34. The MdSP 29 mandate includes planning, implementation and control of public health policy in the areas of<br />
prevention, care, medication, drugs and laboratories, as well as rehabilitation.One of the responsibilities in the<br />
area of prevention is to anticipate and prevent impact on the health of the population and in particular, water<br />
consumption.The Ministry conducts systematic tests of drinking water quality from treatment plant outlets to<br />
house tap.The Medjerda waters are waters rich in organic matter and susceptible to germs.This water is<br />
treated at the GEG through pre-chlorination, which may have an adverse effect in terms of health; there<strong>for</strong>e<br />
this treatment must be improved without pre-chlorination.Such improvement is under study with<br />
SONEDE.<br />
3.3.4. Conclusions<br />
35. Diagnoses and testing undertaken by so many institutions point to three conclusions:<br />
The intensification of natural resources (especially water and soil) and dam siltation are more<br />
important than water pollution.<br />
Institutions and agencies each works on programs and technical reports in the Medjerda basin in<br />
well defined areas; however, coordination and exchange of in<strong>for</strong>mation and experience on the basin<br />
are low and horizontal rein<strong>for</strong>cement among these institutions should be considered.<br />
The qualitative and quantitative assessment of impacts on natural resources is generally<br />
understood under a technical point of view; however, the economic evaluation of such impact is<br />
almost nonexistent.<br />
36. This is due to the lack of economic evaluations of impacts that focuses on costing degradation and in<br />
some cases restoration of water resources in the Medjerda basin. This assessment allows us to quantify, even<br />
if by approximation, and establish an order of magnitude of the economic costs associated with environmental<br />
impacts so as to draw a shortfall regionally and nationally. This evaluation also allows decision makers to<br />
prioritize sectors, through the sectoral breakdown of costs and profitability of the alternative cost of<br />
restoration.<br />
29 Website: .<br />
TUNISIA - DEGRADATION COST OF WATER RESOURCES OF THE MEDJERDABASIN 30
Sustainable Water Integrated Management (<strong>SWIM</strong>) - Support Mechanism<br />
Project funded by the <strong>European</strong> Union<br />
4. REVIEW OF ENVIRONMENTAL DEGRADATION COSTS IN TUNISIA<br />
37. Numerous studies on the environmental degradation at national, regional and sectoral level or the<br />
benefits arising from pollution reduction have been conducted in Tunisia over the past twelve years. The<br />
results of these evaluations, usually covering one base year, are shown in Figure 4.1.<br />
38. The project METAP/World Bank, 30 Economic Research Forum, Egypt and the <strong>European</strong> Commission<br />
estimated the cost of environmental degradation at the national level, each using different methodologies.<br />
The results are as follows:<br />
In 2004, the World Bank/METAP published the cost of environmental degradation using 1999<br />
data covering 6 categories: air, water, waste, soil and biodiversity, coastal and cultural heritage and<br />
global environment. 31 These costs have been estimated at between 383 and 662 million dinars in 1999<br />
year, 1.5 to 2.7% of GDP, with an average estimate of 522 million DT or 2.1% of GDP. 32 To this must be<br />
added the cost of damage to the global environment estimated at around 0.6% of GDP. The degradation<br />
cost due to water was estimated at 0.61% of GDP, or 153 million dinars in 1999. In comparison with other<br />
countries in the region, these costs are relatively lower, and are in fact the lowest in terms of GDP<br />
percentage among the seven countries of the Region of Machrek and Maghreb where the degradation cost<br />
has been evaluated. However, these costs are not negligible and indicate that the greatest damage would<br />
be in two areas: (i) public health, especially in regard to water-borne diseases related to poor sanitation in<br />
the rural areas, respiratory diseases related to air pollution, and the impact of the lack of disposal and<br />
treatment of waste, and (ii) the productivity of natural resources, including the loss of agricultural<br />
productivity due to soil degradation and impact on property values due to lack of disposal and treatment of<br />
waste. 33<br />
In 2007, the World Bank assessed the degradation of surface water, groundwater and coastal<br />
nationwide in Tunisia. 34 Costs have been estimated at about 0.5-0.7% of GDP, with an average of 0.6% of<br />
GDP or 203 million dinars in 2004. The report showed that the loss of irrigated agricultural productivity is<br />
the most significant, followed by that due to the overexploitation of groundwater. Agriculture is mainly<br />
affected as shown in Figure 4.1 by salinity (58%), followed by dam sedimentation (39%), but the effects on<br />
agriculture due to untreated wastewater is low (3%).<br />
In 2011, the Economic Research Forum re-estimated the degradation cost covering three<br />
categories: air, water (waterborne diseases), and degradation of agricultural land. 35 Costs have been<br />
estimated at approximately 2.5% of total GDP, the impact on the water was around 0.41% of GDP or 165<br />
million DT waterborne diseases in 2008. Although this estimate was calculated 10 years after the World<br />
Bank, this assessment is of the same order of magnitude as that estimated by the World Bank study that<br />
refers to 1999.<br />
30 World Bank website: .<br />
31 Sarraf et al. (2004).<br />
32 In 1999 the Tunisien GDP was estimated to be around 25 billion DT while it is actually 27.2 billion DT.<br />
33 It isimportant to note thatthe relatively lowcost ofenvironmental degradationdue to the problemofwaste management<br />
ismainlydue to the factthat itwas notpossible to initiatea comprehensive estimateof the impact ofwaste on human healthand<br />
natural resources. Thus, the impactof the lack oftreatment ofhazardousindustrial waste is notincluded in the estimate.<br />
34 World Bank (2007).<br />
35 ERF (2011).<br />
TUNISIA - DEGRADATION COST OF WATER RESOURCES OF THE MEDJERDABASIN 31
% du PIB<br />
Sustainable Water Integrated Management (<strong>SWIM</strong>) - Support Mechanism<br />
Project funded by the <strong>European</strong> Union<br />
In 2011, the <strong>European</strong> Commission estimated the increased benefits to the environment<br />
covering 5 categories: air, water, nature, waste, and global environment. 36 The benefits were estimated<br />
at 4% of GDP from 71.6 billion DT in 2020, estimated if pollution were to be reduced by ± 50% by 2020<br />
compared to 2008. The proportion of water in these benefits has been estimated at 0.7% of GDP in 2020 is<br />
514 million DT including waterborne diseases and degradation of water resources. In other words, in case<br />
pollution could not be reduced by 50% in 2020, the degradation cost considered as a lost benefit could<br />
reach at least the equivalent of 4% of GDP in 2020.<br />
39. Based on the above sectoral study, in which a large part of water deterioration was also a result of<br />
watershed sedimentation such as dam siltation, the World Bank conducted a specific study on the creation of<br />
environmental benefits to improve watershed management in Tunisia 37 and especially in the Barbara<br />
watershed, located at the north of the Medjerda watershed. The study concluded that all land conservation<br />
practices in the basin during the period 1994-2008, such as re<strong>for</strong>estation with species of eucalyptus, acacia<br />
and oak cork, generated an additional net benefit <strong>for</strong> the country ranging between 3.3 and 23.8 million DT. In<br />
addition, dam siltation would be the result of watershed sedimentation and not land erosion whose sediments<br />
are deposited on the slopes and do not necessarily reach the reservoir of the Barbara dam.<br />
Figure 4.1: Review of degradation costs and environmental benefits in Tunisia<br />
Coût de la Dégradation des Ressources en Eau<br />
% du PIB de 2004<br />
Salinité de l'eau<br />
et engorgement<br />
des sols<br />
58%<br />
Sédimentation<br />
des barrages<br />
39%<br />
Insuffisance du<br />
traitement des<br />
eaux usées<br />
3%<br />
Source: Sarraf et al. (2004), World Bank (2007), ERF (2011) and EC <strong>ENP</strong>I (2011).<br />
40. The results of environmental degradation cost showed the same order of magnitude of water degradation<br />
in terms of GDP (0.6-0.7% of GDP) although these studies are not based on the same methodology, do not<br />
cover the same categories or number of categories, and do not have the same base year <strong>for</strong> assessment.<br />
However, in relative terms, the ratio was more or less maintained since the rate of GDP growth in Tunisia may<br />
exceed the growth rate of pollution such as the National Program Anti-Diarrhea, which reduced the cost of<br />
infant mortality by a factor of 10 between 1999 and 2004. 38 In absolute terms, the degradation cost will<br />
increase because actual GDP at current prices 39 has increased from 27.2 billion dinars in 1999 to 38.8 billion<br />
dinars in 2004 to 63.4 billion in 2010 despite the fact that DT rate decreased pollution is supposed, given the<br />
Government's ambitious agenda relating to drinking water, urban sanitation and waste management.<br />
4.5<br />
4.0<br />
3.5<br />
3.0<br />
2.5<br />
2.0<br />
1.5<br />
1.0<br />
0.5<br />
0.0<br />
BM<br />
Coût de la<br />
Dégradation 1999<br />
Dégradations et Avantages<br />
% du PIB<br />
% du PIB National dont Eau<br />
BM<br />
Coût de la<br />
Dégradation 2004<br />
ERF<br />
Coût de la<br />
Dégradation 2008<br />
CE<br />
Evaluation des<br />
Avantages 2020<br />
36 EC <strong>ENP</strong>I (2011).<br />
37 Croitoru et al :Generation ofenvironmental benefitsto improvewatershed managementin Tunisia, World Bank, report No<br />
50192-TN, November 2010.<br />
38 World Bank (2007).<br />
39 World Bank Indicators (2011).<br />
TUNISIA - DEGRADATION COST OF WATER RESOURCES OF THE MEDJERDABASIN 32
Sustainable Water Integrated Management (<strong>SWIM</strong>) - Support Mechanism<br />
Project funded by the <strong>European</strong> Union<br />
41. The study of the water resources degradation cost in the Medjerda basin will take these prior estimates<br />
into account but will focus effectively on the damage caused by water pollution and degradation of natural<br />
resources.<br />
TUNISIA - DEGRADATION COST OF WATER RESOURCES OF THE MEDJERDABASIN 33
Sustainable Water Integrated Management (<strong>SWIM</strong>) - Support Mechanism<br />
Project funded by the <strong>European</strong> Union<br />
5. METHODOLOGY, ASSES<strong>SM</strong>ENT CALIBRATION AND LIMITS, AND<br />
CATEGORY<br />
42. The costs of degradation were evaluated using available data whose source cannot be entirely reliable. In<br />
addition, gaps in the data have made it necessary to make several assumptions. The results are there<strong>for</strong>e<br />
considered as an indication and allow providing an order of magnitude. However, the results are considered<br />
useful to show the potential in relative values and can thus have a comparative use.<br />
43. Moreover, it is difficult to define accurately environmental degradation that is strictly natural and that<br />
which is strictly of anthropogenic origin. In some cases, there is overlap between the two causes of<br />
degradation that occurs in mutual rein<strong>for</strong>cement, <strong>for</strong> example, the natural salinity of soil and water, which is<br />
exacerbated by human practices.<br />
5.1 METHODOLOGY<br />
44. The estimation techniques <strong>for</strong> impact assessment and economic valuation adopted mainly derived from<br />
proven methods and summarized in the Handbook of the World Bank on the Degradation cost, 40 the<br />
<strong>European</strong> Commission's Manual on Benefit Assessment 41 as well as othermanuals and other reference<br />
sources such as publications of The Economics of Ecosystems and Biodiversity (TEEB), also funded by the<br />
<strong>European</strong> Commission in cooperation with the German Government. 42 The main methods <strong>for</strong> estimating<br />
impacts are grouped around three pillars (Figure 5.1):<br />
Change in production.<br />
Change in health condition through dose-response to establish the relationship between pollutant<br />
(inhalation, ingestion, absorption or exposure) and disease.<br />
Change of behaviour with two sub-impacts: revealed preferences, and stated preferences.<br />
45. The economic evaluation methods are grouped under each pillar (Figure 5.1).<br />
46. For the impacts on production, three methods are suggested:<br />
Value of changes in productivity such as reduced agricultural productivity due to salinity and/or loss of<br />
nutrients in the soil;<br />
Opportunity cost approach, such as the shortfall of not re-using and re-sellingrecycled waste;<br />
Replacement cost approach when <strong>for</strong> example the cost of construction of a dam to replace a dam that<br />
was silted.<br />
47. For the impacts on health, two methods are suggested:<br />
40 World Bank website: .<br />
41 EC <strong>ENP</strong>I BA website: .<br />
42 TEEB website: .<br />
TUNISIA - DEGRADATION COST OF WATER RESOURCES OF THE MEDJERDABASIN 34
Sustainable Water Integrated Management (<strong>SWIM</strong>) - Support Mechanism<br />
Project funded by the <strong>European</strong> Union<br />
The value associated with mortality through two methods: the ageshortfall due to premature<br />
death, and the willingness to pay to reduce the risk of premature death. Only the latter method is used in<br />
this study.<br />
The medical cost approach, such as the cost generated when a child of under 5 years is taken to<br />
hospital to be cured of diarrhoea.<br />
48. For behaviour change, two methods are suggested:<br />
Behaviour revealed by deriving the costs associated with behaviour: the hedonic cost, e.g. the<br />
cost of land around a landfill; the method of trying to derive trip travel costs to visit a specific place like<br />
Lake Ichkeul; preventive behaviour as when a household buys a filter <strong>for</strong> drinking water.<br />
Behaviour stated where a contingent valuation is used, through a survey <strong>for</strong> example, to derive<br />
willingness to pay to improve the quality of water resources.<br />
49. In cases where data are not available, a benefit transfer can be made from studies made in other<br />
countries, by adjusting the results <strong>for</strong> differential income, education, preferences, etc.. The original results are<br />
based on one of the methods of economic evaluation of the three pillars mentioned above.<br />
Figure 5.1: Impact estimate and economic evaluation<br />
Source: Adapted from Bolt et al. (2005).<br />
TUNISIA - DEGRADATION COST OF WATER RESOURCES OF THE MEDJERDABASIN 35
Sustainable Water Integrated Management (<strong>SWIM</strong>) - Support Mechanism<br />
Project funded by the <strong>European</strong> Union<br />
50. 2010 was used as the base year <strong>for</strong> the estimation of degradation costs. The evaluation of benefits<br />
(reduced degradation cost over a year) will be used to derive the restoration costs calculated <strong>for</strong> certain<br />
priority sub-categories. Restoration costs are based on a cost/benefit analysis (C/A) estimated on a case-bycase<br />
basis, covering the life of each investment (investment costs and the flow of benefits generated during<br />
restoration) when this is considered in the evaluation. Three indicators are taken into account in the C/A<br />
analysis to determine the profitability of the project with an economic discount rate of 10%:<br />
The net present value (NPV) is the difference between benefits and total discounted costs;<br />
The internal rate of return (IRR) is the discount rate that resets the NPV or the interest rate that<br />
makes the NPV of all cash flows equal to zero, and<br />
The B/C ratio, which is the ratio of the discounted value of benefits to the discounted value of<br />
costs over the life of the project, must be equal or greater than 1.<br />
5.2 ASSES<strong>SM</strong>ENT CALIBRATION AND LIMITS<br />
51. In addition to resource and timeconstraints, the techniques used have their own methodological<br />
limitations. In general, in the process of fact-finding, it was clear that the availability, accessibility and update<br />
of in<strong>for</strong>mation has posed many problems; however, these were overcome by persistence, appropriate key<br />
contacts and experience in dealing with local authorities.<br />
52. The results allow <strong>for</strong> a margin of error due to sensitivity ranges (minimum, maximum) taken into account.<br />
In addition, a marginal analysis has been attempted in some cases to assess the benefits (reduction in the cost<br />
of environmental degradation) and investment costs.<br />
53. Most valuation techniques used have their inherent limitations in terms of bias, hypothetical premise, and<br />
uncertainty, especially when it comes to non-tradables. In addition, the results are of course context-sensitive.<br />
The use of benefit transfer may there<strong>for</strong>e exacerbate the bias of results and uncertainties. There<strong>for</strong>e, some<br />
results are mentioned in the text and should require a more thorough analysis when investments will be<br />
considered.<br />
5.3 EVALUATED CATEGORIES<br />
54. Four main categories were selected <strong>for</strong> evaluation of the watershed: water, waste, biodiversity, and the<br />
effects of of natural disasters and climate change. Sub-categories were also selected to meet the diverse<br />
impacts affecting the watershed shown in Table 5.1. However, air pollution has been selected only when there<br />
are emissions of greenhouse gases (GHG) and when hydropower generation is substituted by fossil fuels in<br />
times of drought and when there are methane emissions from landfills. Effects on coastal areas have been<br />
covered in this study only to the extent of the marine environment pollution (behaviour stated on improving<br />
the quality of water resources).In addition, certain investments considered <strong>for</strong> a given sub-category might as<br />
well have a positive impact on other categories; <strong>for</strong> example, better management of waste (urban and rural<br />
waste subcategory) could have a positive impact on the quality of water resources subcategory and/or the<br />
Biodiversity category.<br />
TUNISIA - DEGRADATION COST OF WATER RESOURCES OF THE MEDJERDABASIN 36
Sustainable Water Integrated Management (<strong>SWIM</strong>) - Support Mechanism<br />
Project funded by the <strong>European</strong> Union<br />
55. , The degradation cost coversthere<strong>for</strong>e all subcategories while the cost of restoration covers only four<br />
subcategories. The selection criterion <strong>for</strong> calculating the restoration costs was based on subcategories<br />
experiencing significant degradation.<br />
56. Categories, sub-categories, impacts and methods to assess the degradation cost and restoration of the<br />
environment are discussed in Table 5.1. The general and specific description of the methods of subcategories<br />
are found in Annexes II to IV.<br />
TUNISIA - DEGRADATION COST OF WATER RESOURCES OF THE MEDJERDABASIN 37
Sustainable Water Integrated Management (<strong>SWIM</strong>) - Support Mechanism<br />
Project funded by the <strong>European</strong> Union<br />
Table 5.1: Sub-categories<br />
Categories, impacts and methods used <strong>for</strong> evaluating the degradation and restoration of<br />
Medjerda<br />
Category Sub-category Impact Degradation cost Restoration cost<br />
Water Quality and treatment: drinking<br />
water in urban and rural areas<br />
Consumer preference (tap water vs. Bottled water); see Quality<br />
of Services <strong>for</strong> waterborne diseases<br />
CR and CC (cost plus<br />
processing)<br />
Desalination of drinking water <strong>for</strong> dilution and<br />
investments upstream (see below)<br />
Quality of services: water<br />
and sanitation in urban and<br />
rural areas, and irrigation<br />
Quality of the resource<br />
(anthropogenic): discharges,<br />
effluents runoff (see Waste)<br />
Salinity (anthropogenic and<br />
natural): surface and ground<br />
water, approx. marine and soil<br />
Quantity (anthropogenic and<br />
natural): reducing the flow of<br />
surface water and lowering of<br />
groundwater levels<br />
Erosion and Storage:<br />
management is affected by<br />
erosion and exacerbated by<br />
climate change<br />
Diseases related to water supply and quality, sanitation and<br />
hygiene; costs of alternative water sources (bottled, tank, wells,<br />
etc.); technical losses; and time loss while carrying water<br />
Surface water quality affecting: water use (domestic, agricultural,<br />
fisheries, industry and mining), basin ecosystem and<br />
(eutrophication, etc.) coastal areas; land, and eco-tourism<br />
Groundwater quality affecting: water use (industrial, agricultural<br />
and drinking); the basin/coastal ecosystem; and eco-tourism<br />
Soil salinity, effects on health (see Quality and treatment),<br />
reduction of agricultural and fishery productivity, and effects on<br />
the ecosystem<br />
Surface: use of wastewater treated or untreated which can cause<br />
contamination of the food chain, and in extreme cases, require<br />
substitution via desalination<br />
Groundwater: deeper pumping, substitution wells or desalination<br />
(rapid lowering or fossil water) to meet domestic needs and/or<br />
maintain agricultural productivity<br />
Loss of land nutrients, sedimentation and siltation of dams,<br />
mountain lakes, river beds and coasts exacerbated by improper<br />
use of soil upstream due to de<strong>for</strong>estation, irresponsible soil<br />
management, water and wind erosion, etc.<br />
CH/VVS and CS<br />
CR<br />
EC (restoration of water<br />
quality)<br />
EC and RC (restoration<br />
of water quality)<br />
CP (agricultural<br />
productivity)<br />
CP (agricultural<br />
productivity and<br />
additional cost of<br />
pumping/substitution)<br />
CP (agricultural<br />
productivity and<br />
additional cost of<br />
pumping/substitution)<br />
CP and RC (dredging,<br />
raising dams or building<br />
new lakes/dams)<br />
Better service, service efficiency and coverage<br />
of drinking water, sanitation and hygiene<br />
awareness<br />
Investments in STEPs, reducing industrial waste<br />
(olive oil production wastewater) and<br />
reduction of use of pesticides and nitrates (see<br />
Waste)<br />
Artificial recharge <strong>for</strong> dilution; substitution<br />
wells or desalination/water transport<br />
Increased fertilizers (short-term measures) and<br />
land management (long-term measures to<br />
reduce salinity)<br />
Opportunity costs of water treated and<br />
reused, and of water desalination/transport<br />
Opportunity costs of pumping/substitution<br />
water<br />
Costs: Land planning to prevent/reduce<br />
erosion<br />
TUNISIE - COÛT DE LA DE DÉGRADATION DES RESSOURCES EN EAU DU BASSIN DE LA MEDJERDA 38
Sustainable Water Integrated Management (<strong>SWIM</strong>) - Support Mechanism<br />
Project funded by the <strong>European</strong> Union<br />
Hydro-electric power: affected<br />
by a longer drought cycle<br />
Reduced production in drought and substitution by fossil fuel<br />
plants (emissions of pollutants and greenhouse gases)<br />
RC, CC (substitution by<br />
fossil fuel plants)<br />
Costs: substitution by renewable energy<br />
plants<br />
Waste<br />
Solid waste chain including<br />
sludge: urban, rural, agroindustrial<br />
and agricultural<br />
Chain of medical and hazardous<br />
waste<br />
Biodiversit<br />
y<br />
Natural Floods, droughts, extreme<br />
disasters and events, etc<br />
general<br />
environment<br />
GHG emissions<br />
Discom<strong>for</strong>t, health, visual, olfactory, auditory pollution, pollution<br />
of air, soil and water (leachate runoff) and impact on the cost of<br />
land/buildings/apartments<br />
Discom<strong>for</strong>t, health, visual, olfactory, auditory pollution, pollution<br />
of air, soil and water (toxic runoff and radioactive contamination)<br />
and impact on the cost of land/buildings/apartments<br />
CP, CR, RC, PH and CC<br />
Not covered<br />
Costs: collection, transfer stations, separation<br />
and recycling stations, sanitary landfills<br />
Not covered<br />
Various encroachments Loss of ecosystems and medicinal plants EC meta-analysis; CR Investments upstream (see above)<br />
Exacerbation of the intensity and frequency with impact on: health<br />
(mortality, injury, drowning, contagious diseases); property;<br />
services, infrastructure, productivity, resources<br />
(failure with resource reduction and effects on the ecosystem); etc.<br />
5 variables of climate change and effects on land use, water,<br />
evapotranspiration, agriculture, etc.<br />
CH/VVS and CS<br />
AR, CP, RC and RC<br />
CP, RC, RC and CC<br />
State of preparation and efficiency of response<br />
Miscellaneous investments <strong>for</strong> adaptation,<br />
mitigation and resilience in progress or planned<br />
Note: CC: behaviour change, CS: cost of care CP: change of production CR: cost of restoration, PH: hedonic price, EC: contingent valuation, CH: human capital, AR: risk analysis, RC: replacement cost; VSL: value of a<br />
statistical life, and CC: carbon credits. Source: Authors.<br />
TUNISIE - COÛT DE LA DE DÉGRADATION DES RESSOURCES EN EAU DU BASSIN DE LA MEDJERDA 39
Millions de DT<br />
Millions de DT<br />
% du PIB<br />
% du PIB<br />
Sustainable Water Integrated Management (<strong>SWIM</strong>) - Support Mechanism<br />
Project funded by the <strong>European</strong> Union<br />
6. DEGRADATION COST OF THE MEDJERDA BASIN<br />
6.1 GENERAL OVERVIEW OF DEGRADATION COSTS<br />
57. The results of the degradation cost of the Medjerda are shown in Table 6.1 and Figure 6.1. It should be<br />
noted that the total costs of the Medjerda and Greater Tunis are compared to Tunisian GDP (63.4 billion<br />
dinars in 2010) while the costs the Medjerda Basin (intramural) are compared to the Medjerda GDP (5.8<br />
billion dinars in 2010) which has been extrapolated using GDP per capita <strong>for</strong> the Medjerda Basin (4,058<br />
DT/capita in 2010) and multiplying by the number of inhabitants. The disaggregated results are available in<br />
Annex VI.<br />
Figure 6.1: Degradation cost <strong>for</strong> Medjerda and Greater Tunis, 2010 in million DT<br />
Coût de la Dégradation Totale<br />
Coût de la Dégradation Totale<br />
% du PIB 2010<br />
200<br />
180<br />
160<br />
140<br />
120<br />
100<br />
80<br />
60<br />
40<br />
20<br />
0<br />
140<br />
120<br />
100<br />
80<br />
60<br />
40<br />
1.1<br />
0<br />
61<br />
129<br />
Millions de DT en 2010<br />
Environnement Global<br />
Biodiversité<br />
Déchets<br />
Eau<br />
Medjerda<br />
Grand Tunis et Alentours<br />
Région affectée par les ressources en eau<br />
Coût de la Dégradation: Eau<br />
0.1<br />
21<br />
27<br />
81<br />
Millions de DT en 2010<br />
22<br />
Environnement Global<br />
Quantité de l'eau<br />
Qualité de l'eau<br />
Maladies Hydriques<br />
4%<br />
3%<br />
2%<br />
1%<br />
0%<br />
3%<br />
2%<br />
1%<br />
Environnement Global<br />
Biodiversité<br />
Déchets<br />
Eau<br />
PIB Medjerda<br />
PIB Tunisie<br />
Région affectee par les ressources en eau<br />
Coût de la Dégradation: Eau<br />
% du PIB<br />
Environnement Global<br />
Quantité de l'eau<br />
Qualité de l'eau<br />
Maladies Hydriques<br />
20<br />
0<br />
6<br />
16<br />
-<br />
Medjerda<br />
Grand Tunis et Alentours<br />
Région affectée par les ressources en eau<br />
0%<br />
PIB Medjerda<br />
PIB Tunisie<br />
Région affectee par les ressources en eau<br />
TUNISIA - DEGRADATION COST OF WATER RESOURCES OF THE MEDJERDA BASIN 40
Millions de DT<br />
% du PIB<br />
Sustainable Water Integrated Management (<strong>SWIM</strong>) - Support Mechanism<br />
Project funded by the <strong>European</strong> Union<br />
140<br />
120<br />
100<br />
80<br />
60<br />
40<br />
Coût de la Dégradation: Déchets<br />
1<br />
10<br />
13<br />
Millions de DT en 2010<br />
Environnement Global<br />
Enfouissement<br />
Trans<strong>for</strong>mation<br />
Collecte<br />
3%<br />
2%<br />
1%<br />
Coût de la Dégradation: Déchets<br />
% du PIB<br />
Environnement Global<br />
Enfouissement<br />
Trans<strong>for</strong>mation<br />
Collecte<br />
20<br />
38<br />
0<br />
Medjerda<br />
Région affectée par les déchets<br />
Source: Authors.<br />
0%<br />
PIB Medjerda<br />
Région affectée par les déchets<br />
58. For Medjerda and Greater Tunis, this cost reaches 214 million DT in 2010,rangingfrom 149 to324<br />
millionDT on average equivalentto around0.34% of the current GDP but0.85%of the constant GDP (as<br />
compared to2000)of Tunisiain 2010.As concerns Medjerda, the degradation costs are 192milliondinars<br />
in2010, rangingfrom 132 to296 millionDT on average equivalentto around3.3% of the Basin region GDP.<br />
The cost attributable to human health is 81 million DT in 2010 or 42.5% of the degradation cost of the<br />
Medjerda and 63% of the water category.(Table 6.1 and Figure 6.1).<br />
Table 6.1: Degradation cost <strong>for</strong> Medjerda and Greater Tunis, 2010 in million DT<br />
Categories Medjerda % Minimu Maximu Greater Minimu Maximu Total<br />
m m Tunis m m Medjerd<br />
a and<br />
Greater<br />
Tunis<br />
% Minim<br />
um<br />
Maximu<br />
m<br />
Water 129.5 68% 99.1 164.5 22.3 17.5 28.1 151.8 71% 116.6 192.6<br />
Waste 60.5 32% 32.1 131.3 - - - 60.5 28% 33.7 130.9<br />
Biodiversity 0.5 0% 0.4 - - - - 0.5 0% 0.4 -<br />
Natural disasters and 1.1 1% - - - - - 1.1 1% - -<br />
General<br />
environment<br />
Total 191.5 100<br />
%<br />
131.6 295.8 22.3 17.5 28.1 213.9 100<br />
%<br />
149.1 323.9<br />
% GDP Medjerda 3.3% 2.3% 5.1%<br />
% GDP Tunisia 0.34% 0.24<br />
%<br />
Source: Authors.<br />
59. Broken down by category, water degradation is the largest in Greater Tunis and Medjerda in relative<br />
value, with 68% of the total in 2010. Wastes come second with 32% relatively, biodiversity with 0.01% and<br />
the overall environment with 1%. There were no natural disasters in the Medjerda basin in 2010 and<br />
there<strong>for</strong>e they have not been taken into account in this assessment.<br />
60. Broken down by the water subcategory (130 million dinars in 2010), waterborne diseases account <strong>for</strong><br />
the majority of costs in the Medjerda Basin (81 million DT), followed by water quality (27 million DT), water<br />
quantity (21 million DT, relatively low amount since 2010 was a wet season) and finally the overall<br />
environment (1 million DT).<br />
0.51<br />
%<br />
TUNISIA - DEGRADATION COST OF WATER RESOURCES OF THE MEDJERDA BASIN 41
Sustainable Water Integrated Management (<strong>SWIM</strong>) - Support Mechanism<br />
Project funded by the <strong>European</strong> Union<br />
61. Broken down by the waste sub-category (61 million DT in 2010), collection represents the majority of<br />
costs in the Medjerda Basin (38 million DT) followed by waste processing (13 million DT), landfills (10<br />
million DT) and finally general environment (1 million DT).<br />
6.2 WATER CATEGORY AND SUB-CATEGORIES<br />
6.2.1 Drinking water quality and treatment<br />
62. The perception of water quality reflects a different picture and varies among consumers in Tunisia<br />
with 66.8% of consumers having confidence in tap water, while 32.2% having no confidence. Still, it is<br />
mainly the salinity of the water problem with an average salinity of the water distributed between 1 and<br />
1.5 g/l according to SONEDE, 43 against a maximum of 0.2 g/l recommended by the <strong>European</strong> Directive<br />
98/83 EC.However, in terms of taste, 95.2% of consumers prefer mineral water and by extension bottled<br />
water. In fact, the consumption of bottled water is increasing with morethan 45 litres of bottled water<br />
consumed per household per year in 2008, but with a reduction of a quarter of the rural consumption. 44<br />
63. The degradation cost was derived from this overuse of bottled water in the basin of theMedjerdaand<br />
Greater Tunis. This excess seems to be partly due to consumer perception of the poor quality of water but<br />
also water taste because of the high salt content of tap water. The degradation cost amounts to 19.3<br />
million DT with a range of between 12.9 and 25.8 million DT (Table 6.2). This amount remains conservative<br />
in view of the annual growth of the use of bottled water by the consumer.<br />
Table 6.2:Degradation cost due to drinking water quality, 2010<br />
Region Population Number<br />
per<br />
Househ<br />
old<br />
Bottled<br />
water<br />
Average<br />
cost of<br />
househol<br />
d<br />
number consumpti<br />
on<br />
bottled<br />
water<br />
million # million l/house<br />
hold<br />
/year<br />
DT/l<br />
Urban Rural Total Equivalent<br />
cost of<br />
unused<br />
water<br />
network<br />
million<br />
DT<br />
milli<br />
on<br />
DT<br />
millio<br />
n DT<br />
million DT<br />
Net<br />
degradation<br />
cost<br />
million DT<br />
Greater Tunis 1.6 4 0.39 45-60 0.4-0,6 10.6 10.6 0.05 10.6<br />
Medjerda 0.6 5 0.13 45-60 0.4-0.6 3.4 3.4 0.02 3.4<br />
Basin: urban<br />
Medjerda 1.6 6 0.27 34-45 0.4-0.6 5.4 5.4 0.03 5.4<br />
Basin: rural<br />
Total in million DT 14.0 5.4 19.4 0.10 19.3<br />
Minimum in million DT 12.9<br />
Maximum in million DT 25.8<br />
Note:77% of the rural population has access to drinking water (Table 7.3).<br />
Source:Authors.<br />
43 SONEDE website: .<br />
44 Quotidien Le Temps website: .<br />
TUNISIA - DEGRADATION COST OF WATER RESOURCES OF THE MEDJERDA BASIN 42
Sustainable Water Integrated Management (<strong>SWIM</strong>) - Support Mechanism<br />
Project funded by the <strong>European</strong> Union<br />
6.2.2 Quality of Water and Sanitation Services<br />
64. The rate of access to drinking water is almost 100% in urban and 94% in rural areas in 2010, 45<br />
according to official sources. Exceptionally, some peripheral suburbs may have access equivalent to 85% as<br />
some neighbourhoods in Greater Tunis. On the other hand, the rate of sanitation coverage reaches 99% 46<br />
in urban areas but rural households connected to the sewage system do not exceed 5%, always according<br />
to official sources. 47 However, it is difficult to have an exact rate of coverage <strong>for</strong> both drinking water and<br />
sanitation, due to the duality of institutional responsibilities (see Section 2); Table 6.3 would reflect a more<br />
realistic coverage <strong>for</strong> drinking water and sanitation in urban and rural areas in Tunisia in 2010.<br />
Table 6.3: Typology of access to drinking water and sanitation,% population considered, 2010<br />
Typology of access in Tunisia Urban Rural Total<br />
Drinking Water<br />
Improved access 94% 39% 76%<br />
Other access improved 5% 45% 18%<br />
Access not improved 1% 16% 6%<br />
Sanitation<br />
Toilet connected to sewer 82% 5% 56%<br />
Other sanitation improved 15% 62% 31%<br />
Sanitation not improved 3% 33% 13%<br />
- Out of which: defecation in nature 0% 14% 5%<br />
Source: adapted from Van Acoleyen and Baouendi (2011).<br />
65. The prevalence of diarrhoea and mortality due to diarrhoea in the basin of rural Medjerda were<br />
derived from national statistics with 1 death on 15.1 newborns per 1,000 inhabitants in 2010. The<br />
prevalence of diarrhoea was 2.5 cases per child under 5 years and 0.5 cases per population equal to or<br />
more than 5 years. 48 The cost of damage amounted to 81 million TD in 2010, with a range of between 68<br />
and 94 million TD (Table 6.4).<br />
Table 6.4: Degradation cost associated with access to drinking water and sanitation, 2010<br />
Rural population 2010 Diarrhoea<br />
coefficient<br />
Mortality<br />
due to<br />
Cases of<br />
diarrhoe<br />
Value<br />
per case<br />
Degradatio<br />
n cost<br />
diarrhoea a<br />
# # Million DT Million DT<br />
Medjerda population (million) 1,564<br />
Birth rate<br />
15.1 1.0 138 378,643 52.4<br />
(Number of newborns per 1,000<br />
inhabitants)<br />
Population < 5 years (million) 0.121 2.5 0.3 45 13.6<br />
Population ≥ 5 years (million) 1,443 0.5 0.7 21 15.3<br />
Total 81.3<br />
Minimum 68.2<br />
45 HédiBelhaj’spresentation: .<br />
46 Khalil Attia’spresentation: < http://www.oecd.org/mena/governance/43316523.pdf>.<br />
47 MdE (2012).<br />
48 Bassi et al. (2011).<br />
TUNISIA - DEGRADATION COST OF WATER RESOURCES OF THE MEDJERDA BASIN 43
Sustainable Water Integrated Management (<strong>SWIM</strong>) - Support Mechanism<br />
Project funded by the <strong>European</strong> Union<br />
Maximum 94.4<br />
Sources: adaptedfrom Bassi et al. (2011); World Development Indicators (2011); Tunisian Annual Statistics<br />
2006-2010 (2011); and authors.<br />
66. The American Water Works Association 49 suggests a reference point (benchmark) of 10% water losses<br />
acceptable <strong>for</strong> service providers. A range of more than 10% to 25% is considered intermediate and should<br />
be a focus <strong>for</strong> reducing losses to less than 10%. Water losses above 25% are considered chronic and<br />
require immediate attention. In fact, the production of drinking water in Tunisia records losses especially in<br />
the network, averaging 26% 50 or 136.4 million m 3 in 2010, equivalent to a loss of 12.8 m 3 per capita. Thus,<br />
16% of the production could be considered a cost borne by taxpayers with no return on investment<br />
equivalent to 7.8 m 3 per capita loss or 37.3 m 3 per household in Greater Tunis. The amount of the loss per<br />
capita has been examined <strong>for</strong> the population in the Medjerda Basin in non-rural areas as well as the<br />
Greater Tunis and its Surroundings. The opportunity cost was considered equal to the third level of the<br />
progressive rate equivalent to 0.315 DT per m 3 which was introduced in 2010. Thus the degradation cost<br />
rises to 1.5 million DT <strong>for</strong> the Medjerda population and 6.1 million DT <strong>for</strong> Greater Tunis with a total of 7.6<br />
million DT and a variation of 6.5 to 8.8 million DT in 2010 (Table 6.5).<br />
Table 6.5: Degradation cost associated with preventable technical losses of distribution, 2010<br />
Services in the<br />
Greater Tunis and<br />
Surroundings<br />
Production Annual<br />
Production<br />
Preventable<br />
technical<br />
losses (16%)<br />
Degradation<br />
cost <strong>for</strong><br />
Greater Tunis<br />
Degradation cost<br />
<strong>for</strong> the Basin in<br />
non rural areas<br />
Total<br />
degradation<br />
cost<br />
m 3 /day million million million DT million DT million DT<br />
m 3 /year m 3 /year<br />
Winter (8 months) 280,000 67.2 10.8 3.4 3.4<br />
Summer (4<br />
450,000 54 8.6 2.7 2.7<br />
months)<br />
Total 6.1 1.5 7.6<br />
Minimum 5.2 1.3 6.5<br />
Maximum 7.0 1.8 8.8<br />
Source: Annual Report SONEDE (2011), Statistical Yearbook of Tunisia 2006-2010 (2011).<br />
67. The cost of irrigation inefficiency in the Medjerda basin and in areas where water is transferred, such<br />
as the Cap Bon, has not been calculated due to lack of reliable data.<br />
6.2.3 Quality of water resources<br />
68. Given the multiplicity of sources of pollution and the number of pollutants along the Medjerda and its<br />
mouth, a method based on stated preferences was used <strong>for</strong> evaluation.In addition, certain investments in<br />
pollution abatement are underway but the estimation of all the investments needed to reduce pollution<br />
and the restoration or maintenance of ecosystem functions and services exceed the scope of this study.<br />
Baker et al. (2007) have recently conducted a survey to estimate the economic value placed by households<br />
in England and Wales to improve water quality at both watersheds and coastal areas in the context of the<br />
implementation of the EC Water Directive (see Annex II). Transfer of benefits is thus considered to derive<br />
49 AWWA website: .<br />
50 Tunisian Annual Statistics 2006-2010 (2011).<br />
TUNISIA - DEGRADATION COST OF WATER RESOURCES OF THE MEDJERDA BASIN 44
Sustainable Water Integrated Management (<strong>SWIM</strong>) - Support Mechanism<br />
Project funded by the <strong>European</strong> Union<br />
the degradation cost of the Medjerda Basin. After the transfer of benefits, the willingness to pay amounts<br />
to 14.3 DT per household per year <strong>for</strong> a tangible improvement after 6 years. Thus, the degradation cost<br />
amounts to 5.6 million DT <strong>for</strong> the population in Medjerda and 5.6 million DT <strong>for</strong> the Greater Tunis and its<br />
Surroundings with a total of 11.3 million and a variation of 10.5 to 13.9 million dinars in 2010 (Table 6.6).<br />
Table 6.6: Degradation cost of water quality in Medjerda, 2010<br />
Area Populatio<br />
n<br />
Number of<br />
inhabitants<br />
per<br />
household<br />
Willingness to pay<br />
DT/year<br />
Degradation cost<br />
Million DT<br />
Million # Minimum Average Maximum Minimum Average Maximum<br />
Greater<br />
1.6 4 13.4 14.3 17.6 5.3 5.6 6.9<br />
Tunis<br />
Medjerda<br />
0.6 5 13.4 14.3 17.6 1.7 1.8 2.2<br />
Urban<br />
Medjerda<br />
1.6 6 13.4 14.3 17.6 3.6 3.8 4.7<br />
Rural<br />
Total 10.5 11.3 13.9<br />
Source: Baker et al. (2007); World Bank (2011); and Authors.<br />
6.2.4 Salinity<br />
69. The average salinity of 3.0 deciSiemens per meter (dS/m) is commonly used in the region of Medjerda<br />
but overall soil salinity is usually positively correlated with that of the irrigation water, which can produce<br />
lower or higher averages in parts of the Medjerda. Only the three main crops in Medjerda have been<br />
considered because of the difficulty in obtaining agricultural production in<strong>for</strong>mation by region: tomatoes,<br />
wheat and olives. However, the opportunity cost of the capital loss associated with the agro-industrial<br />
production of the three crops has not been considered (e.g., olive oil, etc.).<br />
70. Salinity, even at low doses, can affect agricultural production. Thus, salinity levels and reductions in<br />
productivity were developed by Kotuby-Amacher et al. (2003) and Evans (2006) 51 <strong>for</strong> each crop and are<br />
based on the electrical conductivity of saturated soils (CEs) expressed in dS/m. However, other factors<br />
could affect the tolerance level of crops (variety, climate, etc.) and there<strong>for</strong>e the thresholds are merely<br />
suggested as a guide. The reduced productivity due to salinity affecting agricultural production affects only<br />
the production of tomatoes and olives because wheat has a high salt tolerance. Lost productivity amounts<br />
to 37 million DT with a variation from 29.6 to 44.3 million dinars in 2010 (Table 6.7). This amount, which<br />
takes only three cultures into account, is very conservative and this analysis would be worth expanding.<br />
However, the additional use of fertilizers should compensate <strong>for</strong> this loss of productivity while creating a<br />
vicious cycle (runoff), but it is not possible to determine the cost of such preventive behaviour.Thus, we<br />
estimate that despite the use of fertilizers, a third of the productivity loss is due to degradation as a result<br />
of soil salinity. Thus, the degradation cost totals 12.3 million DT with a variation from 9.9 to 14.8 million<br />
dinars in 2010.<br />
Table 6.7: Losses of agricultural productivity due to salinity, 2010<br />
Main crops Medjerda Salinity Reduction in crop yield Gross Productivity losses at -10%<br />
51 Australian Government website: .<br />
TUNISIA - DEGRADATION COST OF WATER RESOURCES OF THE MEDJERDA BASIN 45
Sustainable Water Integrated Management (<strong>SWIM</strong>) - Support Mechanism<br />
Project funded by the <strong>European</strong> Union<br />
level<br />
CEs price Average Minimum Maximum<br />
CEs<br />
Tons dS/m -10% with<br />
dS/m at:<br />
-25% with<br />
dS/m at:<br />
-10%<br />
Tons<br />
-25% Tons DT/ton Million DT Million<br />
DT<br />
Million<br />
DT<br />
Tomatoes 366,667 2.5 3.5 5.0 18,333 91,667 422 7.7 6.2 9.3<br />
Wheat 479,190 4.7 6.0 8.0 0 119,798 550 0 0 0<br />
Olives 584,267 2.6 3.0 3.5 58,427 146,067 500 29.2 23.4 35.1<br />
Total 37.0 29.6 44.3<br />
Degradation cost 12.3 9.9 14.8<br />
Note: the reduction in the yield of tomatoes is estimated at 5% to reach 3 dS/m thus accounting <strong>for</strong> linear<br />
reduction. The production of tomatoes and olives is an estimate and represents more than half of national<br />
production in 2010.<br />
Source: MoA website ; Kotuby-Amacher et al. (2003) ; and Evans (2006).<br />
6.2.5 Quantity<br />
71. For groundwater resources, the amount of water is affected by a drop in the groundwater level and<br />
deep resources by 0.4 m per year requiring additional pumping. Thus, the change in production is taken<br />
into account to derive the additional cost of pumping equivalent to the degradation cost. The degradation<br />
cost thus rises to 0.45 million DT with a variation from 0.38 to 0.52 million DT in 2010 (Table 6.8).<br />
Table 6.8: Additional cost <strong>for</strong> pumping in the Medjerda basin, 2010<br />
Pumping cost Unit Groundwater<br />
resources<br />
Deep resources<br />
Resources affected by the drop Million m 3 252 28<br />
Average use of diesel l/m of depth/m 3 0.004 0.004<br />
Annual average drop of groundwater<br />
m 0.4 0.4<br />
level<br />
Degradation<br />
cost<br />
Market price DT/litre of Diesel 1,010 1,010<br />
Annual cost of diesel-driven pumping DT/year 407,232 45,248 452,480<br />
Minimum 384,608<br />
Maximum 520,352<br />
Source: adapted from the World Bank (2007).<br />
72. For surface resources, the non-replacement of the dam lost capacity due to siltation can lead to the<br />
reduction of water availability <strong>for</strong> users (see Storage below). Since agriculture is a major consumer of<br />
water from dams in Tunisia, the impact of siltation on irrigated agriculture has been assessed following the<br />
change in production. Considering a consumption of 5,000 m 3 /ha <strong>for</strong> intensive irrigation, a shortfall would<br />
be the difference between the value added of agricultural production between intensive and non-intensive<br />
irrigation. All other factors remaining constant, a shortfall of 2,007 DT/ha <strong>for</strong> all crops was selected. 52 The<br />
degradation cost amounted to 4.3 million TD with a variation from 3.9 to 4.8 million dinars in 2010 (Table<br />
6.9).<br />
Table 6.9: Agricultural impairment due to loss of dam storage in the Medjerda, 2010:<br />
Dam Siltation in Allocation <strong>for</strong> intensive Agricultural added Degradation cost<br />
52 World Bank (2007).<br />
TUNISIA - DEGRADATION COST OF WATER RESOURCES OF THE MEDJERDA BASIN 46
Sustainable Water Integrated Management (<strong>SWIM</strong>) - Support Mechanism<br />
Project funded by the <strong>European</strong> Union<br />
2010 irrigation value due to intensive<br />
irrigation<br />
Million m 3 M 3 /ha DT/ha Million DT<br />
Nebeur-Mellegue 2.5 5,000 2,007 1.00<br />
Ben Metir 5,000 2,007 -<br />
Kasseb 0.2 5,000 2,007 0.08<br />
BouHertma 0.2 5,000 2,007 0.08<br />
Sidi Salem 6.8 5,000 2,007 2.73<br />
Siliana 1.1 5,000 2,007 0.43<br />
Lakhmess 0.0 5,000 2,007 0.01<br />
Rmel 5,000 2,007 -<br />
Laaroussia 5,000 2,007 -<br />
Total 10.8 5,000 2,007 4.32<br />
Minimum 3.89<br />
Maximum 4.76<br />
Source: Data provided by the MoA, Large Dams and Hydraulic Works, Operations Directorate of Dams and<br />
Hydraulic Structures Maintenance (2010), World Bank (2007) and World Development Indicators (2011).<br />
6.2.6 Erosion and Storage:<br />
73. In agricultural lands, soil erosion occurs mainly by widespread and pernicious soil stripping and gullies<br />
located on steep slopes. The complex relationship between erosive rainfall events and the annual rate of<br />
soil loss can be explained by two important factors. The first is related to the cycle of soil degradation<br />
which determines the potential of soil erosion in the basin. The second factor is the orientation of the<br />
degradation, which in this case has north-west and south-east direction. Remote detection studies have<br />
identified a loss of 14.5 tons per hectare throughout the Ridge. 53 In fact, this soil erosion results in nutrient<br />
loss which should be compensated by fertilizers. In addition, erosion is also responsible <strong>for</strong> a loss of carbon<br />
sequestration not calculated in this study.<br />
74. In addition, mountainous lakes and dams also undergo this erosion, exacerbated by climate change<br />
and reducing the life of mountainous lakes to 14 years 54 in the Ridge as well as storage capacity of at least<br />
6 out of 9 dams in the Medjerda Basin (see above Quality and Treatment of Drinking Water).<br />
Table 6.10: Soil nutrient loss due to soil erosion in the Medjerda, 2010<br />
Governorate Cultivated<br />
Surface area affected Erosion Cost of Degradation cost<br />
surface area 1/4: 1/8 : 1/2 :<br />
fertilizers Average Minimum Maximum<br />
Average Minimum Maximum<br />
Ha Ha Ha Ha Ton/ha DT/ton Million DT<br />
Ariana 20,830 5,208 2,604 10,415 14.5 27.1 0.1 0.1 0.3<br />
Manouba 80,700 20,175 10,088 40,350 14.5 27.1 0.5 0.3 1.1<br />
Beja 250,210 62,553 31,276 125,105 14.5 27.1 1.7 0.8 3.4<br />
Jandouba 165,780 41,445 20,723 82,890 14.5 27.1 1.1 0.6 2.2<br />
Le Kef 288,470 72,118 36,059 144,235 14.5 27.1 2.0 1.0 3.9<br />
Siliana 284,580 71,145 35,573 142,290 14.5 27.1 1.9 1.0 3.9<br />
Total 1,090,570 2,72,643 136,321 545,285 7.4 3.7 14.8<br />
Source: MoA website ; and Jebari (2009).<br />
53 Jebari (2009).<br />
54 Ibid.<br />
TUNISIA - DEGRADATION COST OF WATER RESOURCES OF THE MEDJERDA BASIN 47
Sustainable Water Integrated Management (<strong>SWIM</strong>) - Support Mechanism<br />
Project funded by the <strong>European</strong> Union<br />
75. The replacement cost <strong>for</strong> calculating the degradation cost of agricultural productivity due to erosion is<br />
the loss of the soil nutritional because of fertilizers. A total of 27.1 DT per ha of fertilizer is based on a mix<br />
of chemical and organic fertilizers. Thus, the degradation cost amounted to 7.4 million DT with a variation<br />
from 3.7 to 14.8 million TD in 2010 (Table 6.10).<br />
76. The replacement cost <strong>for</strong> calculating the degradation cost of dams, which are only considered in this<br />
study, is based on the World Bank (2007) with a lower limit comprising of build-up of dams to replace the<br />
lost storage volumes (based on the cost of the build-up of the Mellegue dam); this amounts to 0.006<br />
DT/m 3 , with a maximum consisting in the construction of new dams and amounting to 1.31 DT/m 3 in 2010.<br />
Thus, the degradation cost amounts to 7.1 million DT with a variation from 0.1 to 14.1 million dinars in<br />
2010 (Table 6.11). It is important to note that the cost of dredging has not been considered given sediment<br />
quality (content of heavy metals from old mines), which could have a negative impact in areas where they<br />
would be discharged.<br />
Table 6.11: Dam siltation in the Medjerda, 2010<br />
Dam<br />
Siltation in Replacement costs<br />
Replacement costs Degradation cost<br />
2010<br />
Minimum<br />
Maximum<br />
Million m 3 DT/m 3 Million DT DT/m 3 Million DT Million DT<br />
Nebeur-Mellegue 2.5 0.006 0.01 1.31 3.26 1.64<br />
Ben Metir 0.006 - 1.31 - -<br />
Kasseb 0.2 0.006 0.00 1.31 0.26 0.13<br />
BouHertma 0.2 0.006 0.00 1.31 0.25 0.13<br />
Sidi Salem 6.8 0.006 0.04 1.31 8.91 4.47<br />
Siliana 1.1 0.006 0.01 1.31 1.39 0.70<br />
Lakhmess 0.0 0.006 0.00 1.31 0.04 0.02<br />
Rmel 0.006 - 1.31 - -<br />
Laaroussia 0.006 - 1.31 - -<br />
Total 10.8 0.06 14.11 7.09<br />
Source: Data provided by the MoA, Large Dams and Hydraulic Works, Operations Directorate of Dams and<br />
Hydraulic Structures Maintenance (2010), World Bank (2007), World Development Indicators (2011), and<br />
Authors.<br />
6.2.7 Hydro-electric power:<br />
77. Hydroelectric (HE) power production, which is concentrated in the north of Tunisia, strongly<br />
correlated with rainfall in the north-east and north-west of Tunisia between 2000 and 2010 (correlation<br />
coefficient 0.85). The annual average over the period was 89 million kW/h with an average of 0.7% of the<br />
total electricity production (Table 6.12).<br />
Table 6.12: Correlation between rainfall and hydropower, 2000-2010<br />
Corelation data 2000 2001 2002 2003 2004 2005 2006 2007 2008 2009 2010<br />
Rainfall in the North<br />
(mm)<br />
HE production<br />
(Million kW/h)<br />
HE production<br />
(% of the total)<br />
452 501 397 762 758 691 551 545 444 697 710<br />
64 54 64 166 154 145 92 48 31 78 83<br />
0.60 0.47 0.54 1.34 1.18 1.05 0.65 0.33 0.20 0.50 0.51<br />
TUNISIA - DEGRADATION COST OF WATER RESOURCES OF THE MEDJERDA BASIN 48
Sustainable Water Integrated Management (<strong>SWIM</strong>) - Support Mechanism<br />
Project funded by the <strong>European</strong> Union<br />
Total Production<br />
(Million kW/h)<br />
10.59<br />
6<br />
11.39<br />
2<br />
11.84<br />
1<br />
12.41<br />
1<br />
13.06<br />
7<br />
13.79<br />
3<br />
14.12<br />
2<br />
14.66<br />
1<br />
15.30<br />
3<br />
15.69<br />
3<br />
Source: Global Perspective website: ; Rainfall Yearbook (2011); and<br />
Authors.<br />
16.25<br />
1<br />
78. The degradation cost is related to hydropower generation in northern Tunisia which is offset by gas or<br />
fuel-based production in drought years. The degradation cost was calculated using the cost of production<br />
factors <strong>for</strong> the substitution of electricity generation and the cost of carbon <strong>for</strong> GHG emissions. However,<br />
the effects of environmental pollutant emissions associated with the use of fossil fuels have not been<br />
evaluated. Based on an average of 11 years, the loss of hydropower is 5.97 million kW/h in 2010. The<br />
degradation cost thus rises to 0.76 million DT from 0.66 million DT as cost alternative <strong>for</strong> producing<br />
electricity using fossil fuels and 99,987 DT <strong>for</strong> equivalent carbon emissions in 2010 due to fluctuating water<br />
flows (Table 6.12). Also, 2008 seems to have been the driest year of the decade with a loss of HE<br />
production of 58.4 million kW/h and degradation cost of almost 7.5 million DT (including 6.5 million DT<br />
representing the cost of substitution) as opposed to 2003, which is a wet season and led to HE gains as<br />
compared to the average with a negative degradation cost of 9.9 million DT (including -8.6 million DT<br />
representing the cost of substitution) in 2010 prices (Table 6.13).<br />
Table 6.13: Cost of hydroelectric degradation due to changes in water flow, 2010<br />
Effects of Water Loss of HE HE: CO 2 Fuel/Gas: Net CO 2 Total CO 2 Overall<br />
Flow Fluctuations production as<br />
compared to the<br />
average (11 years)<br />
emissio<br />
ns<br />
CO 2<br />
emissions<br />
emissions emissions cost of CO 2<br />
emissions<br />
Production<br />
factors<br />
Degradation<br />
cost<br />
Million kW/h CO 2 /kW/h CO 2 /kW/ CO 2 /kW/ Ton DT/ton DT/kW/ Million DT<br />
h h<br />
h<br />
Substitution cost:<br />
5.97 0.11 0.66<br />
2010<br />
Minimum 5.97 0.09 0.54<br />
Maximum 5.97 0.13 0.78<br />
Excess GHG: 2010 5.97 0.004 0.887 0.883 0.005 19 0.09<br />
Minimum: 2008 58.4 0.004 0.887 0.883 0.052 19 0.98<br />
Maximum: 2003 -77.3 0.004 0.887 0.883 -0.068 19 -1.29<br />
Total 0.76<br />
Source: Green It website ; Tunisian Industry website: ;<br />
Global Perspective website: ; and Authors.<br />
6.3 SOLID WASTE CATEGORY<br />
79. Waste management in the Medjerda basin remains problematic especially in rural areas. However, it<br />
is not the entire waste chain that has a direct impact on water resources: it is mainly landfills with leachate<br />
runoffs. However, the degradation cost of the chain of domestic, agricultural and agro-industrial waste is<br />
considered in this study.<br />
Table 6.14: Degradation costs due to waste, 2010 in million DT<br />
Results Collecti Cost of Recycling Biomass- Depreciation Future GHG non- Total<br />
TUNISIA - DEGRADATION COST OF WATER RESOURCES OF THE MEDJERDA BASIN 49
Sustainable Water Integrated Management (<strong>SWIM</strong>) - Support Mechanism<br />
Project funded by the <strong>European</strong> Union<br />
on in<br />
rural<br />
areas<br />
landfill<br />
cleaning<br />
<strong>for</strong> waste<br />
generate<br />
d<br />
shortfall<br />
based<br />
power<br />
productio<br />
n shortfall<br />
of land<br />
adjacent to<br />
landfills<br />
shortfall<br />
<strong>for</strong><br />
electricity<br />
production<br />
discounte<br />
d at 5%<br />
avoided in<br />
future<br />
discounte<br />
d at 5%<br />
Degradation 26.8 11.2 7.6 5.2 6.5 3.3 1.0 60.5<br />
cost<br />
Minimum 13.4 5.8 5.3 0.0 4.3 0.0 0.0 28.8<br />
Maximum 40.2 12.6 8.4 58.3 8.6 3.3 1.0 132.4<br />
Source: Annex IV.<br />
80. Degradation costs due to waste amount to 61 million DT in 2010 with a variation from 29 to 132<br />
million dinars in 2010 (Table 6.14). The degradation costs include: non-collection in rural areas, the cost of<br />
cleaning landfills <strong>for</strong> waste generated in 2010, the shortfall in recycling in 2010, the shortfall in power<br />
generation through biomass (agricultural waste), the depreciation of land near landfills, the future shortfall<br />
of electricity generation expected at 5% (discounted at the present time) and GHG not avoided in future<br />
expected at 5% (discounted at the present time).The description of the methodology and calculations are<br />
included in Annex IV.<br />
6.4 BIODIVERSITY CATEGORY<br />
81. The role of wetlands as usage values (e.g. in agriculture, fishing, flood mitigation, groundwater<br />
recharge) and non-usage values (as habitat <strong>for</strong> aquatic species) have been validated in several studies in<br />
Tunisia. 55 The degradation of biodiversity is reflected both by the decrease in wet areas as well as the<br />
reduction in the wealth of fauna and flora.Although the construction of dams has increased the area of<br />
wetlands to 22,400 ha since 1945 and sewage water settling ponds in the treatment stations constitute<br />
artificial wetlands, the latter cannot replace natural wetlands that provide habitats and ecosystems more<br />
favourable to the survival of many plant and animal species. In addition, the highly non-stationary release<br />
of water <strong>for</strong> flood management, including optimizing the production of electricity (Sidi Salem Dam) causes<br />
the most significant and most obvious changes in the flow regime thus resulting into direct impact on the<br />
morphology of the riverbed and loss of biodiversity.<br />
82. The main causes of wetland loss in the Medjerda are drainage, urbanization in medium-sized cities<br />
along the river, the effect of old and new mines, agricultural expansion, and the creation of dams and<br />
hillside lakes upstream. In addition, these wetlands are polluted by sources mentioned above in the Water<br />
and Waste sections. According to Karem et al. (1999), Medjerda has lost 10,440 hectares of wetlands.<br />
83. It is very difficult to assess the actual loss of biodiversity in the Medjerda. However, considering the<br />
average adopted by the World Bank (2007) <strong>for</strong> the Medjerda basin, the annual loss would be 10 hectares<br />
of wetlands. Replacement cost was used to assess the degradation cost. It is important to note that this<br />
approach is affected by significant limitations. On the one hand, the use of actual expenditures may<br />
underestimate the damage costs because they can rarely compensate <strong>for</strong> all services previously provided<br />
by the original ecosystem especially with respect to the effect of dam water releases on biodiversity.<br />
55 World Bank (2007).<br />
TUNISIA - DEGRADATION COST OF WATER RESOURCES OF THE MEDJERDA BASIN 50
Sustainable Water Integrated Management (<strong>SWIM</strong>) - Support Mechanism<br />
Project funded by the <strong>European</strong> Union<br />
TEEB 56 has estimated the cost of replacement of a wetland based on a comprehensive meta-analysis. The<br />
cost amounts to 47,091 DT per ha. The average wetlands lost per year in the Medjerda, as derived from<br />
the World Bank (2007), is 10 ha. Thus, the degradation cost, which remains highly underestimated,<br />
amounts to 470,910 dinars in 2010 with a minimum of 400,000 DT and an unspecified maximum.<br />
6.5 NATURAL DISASTERS AND GENERAL ENVIRONMENT CATEGORY<br />
6.5.1 Natural disasters<br />
84. Several projects are underway to reduce the risk of flooding in Tunisia. One of them is the PISEAU II<br />
project, with part of $EU 170 million intended <strong>for</strong> the management of water resources in river basins at<br />
risk. A project of 140 million DT, partially funded by JICA, covers priority flood zones in Tunis that require<br />
the construction of several drainage channels. In addition, JICA has also funded a study to reduce flooding<br />
in the Medjerda watershed. Greater Tunis has been the object of a study funded by the BAfD to diagnose<br />
the current situation in all catchment areas <strong>for</strong> four governorates (Tunis, Ariana, Ben Arous and Manouba)<br />
and recommend investments to reduce flooding. In addition, a study by the World Bank has focused on the<br />
vulnerability of the Greater Tunis to climate change, in this case, the accelerated rise in sea level and<br />
neighbourhoods at high risk of flooding.<br />
85. The evidence provided by climate projections indicate potential increased frequency of flood flows<br />
that in the Medjerda that would affect Greater Tunis. However, the year 2010 was relatively free of major<br />
events regarding natural disasters, including floods, especially when compared to 2009 when several<br />
flooding episodes occurred with casualties and damage being reported. Thus, the cost of environmental<br />
degradation associated with natural disasters is not considered <strong>for</strong> the year 2010.<br />
6.5.2 Overall Environment<br />
86. Theimbalance between surface water use compared to groundwater use to the detriment of the<br />
<strong>for</strong>mer will become more pronounced in the future. This imbalance will be further exacerbated with the<br />
effects of climate change. Indeed, in addition to the expected increase in temperature, leadingtoincreased<br />
evapotranspiration, reduced rainfall should also be expected. This could lead to both a lower recharge of<br />
aquifers as well as increased use of these aquifers by farmers to offset the growing deficit between rainfall<br />
and evapotranspiration.<br />
87. However, only GHG emissions were considered in the context of general environment and were<br />
covered under Hydroelectric Production and Solid Waste, amounting to 1.1 million dinars in 2010.<br />
6.6 CONCLUSIONS<br />
88. The cost estimate of water resource degradation has resulted in the following conclusions:<br />
a) The cost of water salinity (11 million DT) within and beyond the Medjerda basin is almost equal<br />
to the salinity cost in agricultural production (12.3 million DT) within the same basin.<br />
56 TEEB website: .<br />
TUNISIA - DEGRADATION COST OF WATER RESOURCES OF THE MEDJERDA BASIN 51
Sustainable Water Integrated Management (<strong>SWIM</strong>) - Support Mechanism<br />
Project funded by the <strong>European</strong> Union<br />
b) Damage due to lack of access to drinking water and rural sanitation (81 million DT) in the<br />
Medjerda basin is significantly higher than damage due to drinking water salinity.<br />
c) Poor collection and lack of solidwaste treatment result in less important damages (61 million<br />
DT) than those due to lack of access to safe drinking water and sanitation in rural areas (81 million<br />
DT).<br />
d) Damages affecting the River Medjerda water quality are less pronounced (17 million DT), which<br />
suggests that land-based pollution is not fully discharged into the river.<br />
e) Damages created by erosion in dam siltation of dams are around 7.1 million DT, which may<br />
mean that dam siltation may be the result of sediments in watersheds and not necessarily erosion of<br />
land sediments that do not always reach dam reservoirs. These damages are almost equivalent to<br />
soil nutrient losses due to erosion (7.4 million DT).<br />
89. Based on these findings, four priorities emerge <strong>for</strong> the short- and the medium-term:<br />
a) Treatment of drinking water salinity;<br />
b) Sanitation in rural areas;<br />
c) Solid Waste collection and treatment; and<br />
d) Effectiveness of land planning <strong>for</strong> dam siltation reduction.<br />
TUNISIA - DEGRADATION COST OF WATER RESOURCES OF THE MEDJERDA BASIN 52
Sustainable Water Integrated Management (<strong>SWIM</strong>) - Support Mechanism<br />
Project funded by the <strong>European</strong> Union<br />
7. COST OF REMEDIATION OF THE MEDJERDA BASIN<br />
7.1 GENERAL OVERVIEW OF REMEDIATION COSTS<br />
90. Based on the priorities identified in the previous section, four intervention scenarios were considered<br />
but only three were implemented. Only the drinking water salinity, water and sanitation in rural areas and<br />
muncipalwaste management have been evaluated as categories. Interventions related to land use <strong>for</strong><br />
erosion reduction and, thus, dam siltation have not been considered due to lack of studies establishing a<br />
causal link between land use and siltation reduction in order to per<strong>for</strong>m economic assessment.<br />
91. The most efficient scenarios were selected and are shown in Table 7.1 and Figure 7.1. On water and<br />
sanitation in rural areas, the combination of the sanitation scenario and drinking water and sanitation<br />
scenario can make the latter profitable. Concerning drinking water in Greater Tunis, desalination of part of<br />
the water resources in order to dilute the drinking water salinity is profitable. However, this alternative has<br />
not been compared to the cost of transporting water from the Barbara Basin dams, and it would become<br />
unprofitable if the threshold of 30,000 m 3 /day over three months of desalination is exceeded. The<br />
strategic reserve of the Barbara Basin can ensure not only the safety of the resource, but also achieve<br />
water dilution when the salt content is high in summer, especially during dry seasons. For waste alone, any<br />
alternative to landfill with electricity generation in cells is profitable. The segregation and recycling<br />
alternatives are not profitable because they are too costly. Thus, to overcome this shortcoming, a<br />
multicriteria analysis could be considered <strong>for</strong> decision making with the focus not only on the C/A analysis<br />
but also on employment creation, poverty reduction, etc.<br />
Table 7.1: Remediation cost <strong>for</strong> Medjerda and the Greater Tunis, 2010 in million DT<br />
Medjerda and Greater Degradation Reduction Investment NPV Restoration C/P <strong>Analysis</strong> NPV<br />
Tunis<br />
2010<br />
2011<br />
NPV<br />
Million DT Million DT Million DT Million DT Million DT<br />
Planning 0 0 0 0 940-5,050 DT/ha<br />
1,100-5,400<br />
DT/ha<br />
Waste 28.6 5.7 83 84 0.9<br />
Water and Sanitation in<br />
rural areas<br />
Drinking water in<br />
Greater Tunis<br />
Source: Authors.<br />
81.3 13.7 133.7 150.7 17.1<br />
10.6 4.4 19 35 8.0<br />
Figure 7.1: Remediation cost <strong>for</strong> Medjerda and the Greater Tunis, 2010 in million DT<br />
TUNISIA - DEGRADATION COST OF WATER RESOURCES OF THE MEDJERDA BASIN 53
Millions de DT<br />
Sustainable Water Integrated Management (<strong>SWIM</strong>) - Support Mechanism<br />
Project funded by the <strong>European</strong> Union<br />
150<br />
130<br />
110<br />
90<br />
70<br />
50<br />
30<br />
10<br />
-10<br />
Dégradation et Restauration<br />
Millions de DT<br />
Dégradation 2010<br />
Réduction 2011<br />
VAN de l'Investissement<br />
VAN de la Restauration<br />
Aménagement Déchets Eau et Assain.<br />
milieu rural<br />
Source: Authors.<br />
Eau potable<br />
Grand Tunis<br />
20<br />
18<br />
16<br />
14<br />
12<br />
10<br />
8<br />
6<br />
4<br />
2<br />
0<br />
VAN C/A et Ratio A/C des Interventions<br />
VAN C/A: Millions de DT<br />
Ratio A/C<br />
Aménagement Déchets Eau et Assain.<br />
milieu rural<br />
Eau potable<br />
Grand Tunis<br />
92. The remediation cost analysis of three categories based on the net present value (NPV) of the<br />
investment over 20 years (24 years <strong>for</strong> waste) with a rate of 10% discount and internal rate of return (IRR),<br />
has identified the most efficient investments as follows:<br />
a) For drinking water, desalination of 20,000 m 3 /day over three months will have an NPV of DT 8<br />
million and an IRR of 32% with an B/C ratio greater than 1.<br />
b) Sanitation is profitable with or without drinking water and will create an NPV of 32 million DT<br />
with IRR 22%.However, the water and sanitation combined matching investments are more<br />
profitable with an NPV of 17 million DT, an IRR of over 10% and a B/C ratio greater than 1.<br />
c) Transfer and disposal of municipal waste are only profitable if a transfer station and a landfill<br />
are established with power production capacity from methane emissions in each governorate.<br />
These investments will have an NPV of 0.9 million DT, an IRR of 10% and a B/C ratio greater than 1.<br />
7.2 DRINKING WATER QUALITY<br />
93. The cost of the remediation of drinking water by reducing salinity was derived by estimating three<br />
volumes/day of water (20,000, 30,000 and 40,000 m 3 /day during the three months in the summer when<br />
the water content increases due to lack of rain). This requires desalination pre-treatment <strong>for</strong> 20 years to<br />
effect a dilution allowing <strong>for</strong> tap water of acceptable sodium standards. Thus, desalination is needed to<br />
improve water quality and is there<strong>for</strong>e not considered as a measure to increase the water resource<br />
because of its rarity. Costs of scenarios 1, 2 and 3 are respectively 1.4, 2.2 and 2.9 million DT per year over<br />
20 years (Table 7.2).<br />
Table 7.2:Remeidation cost due <strong>for</strong> drinking water quality, 2010<br />
Desalination scenario<br />
Investment duration: 20 years<br />
Scenario 1: 20,000<br />
m 3 /day over 3 months<br />
Scenario 2: 30,000<br />
m 3 /day over 3 months<br />
Scenario 3: 40,000<br />
m 3 /day over 3 months<br />
Average cost/year in million DT 1.4 2.2 2.9<br />
Minimum in million DT 2.3 3.4 4.5<br />
Maximum in million DT 2.1 3.2 4.3<br />
Note: 0.8 $EU/m 3 was selected as dynamic cost of desalination of the Medjerda water and includes the recovery<br />
rate of investment as well as maintenance.However, the social cost is not taken into account (emissions from<br />
fossil fuels to generate additional electricity needed <strong>for</strong> desalination and impact of brackish water discharge).<br />
Source:Authors.<br />
TUNISIA - DEGRADATION COST OF WATER RESOURCES OF THE MEDJERDA BASIN 54
Sustainable Water Integrated Management (<strong>SWIM</strong>) - Support Mechanism<br />
Project funded by the <strong>European</strong> Union<br />
94. The introduction of desalination of the Medjerda water during summer or drought periods would<br />
marginally improve the quality of the water distributed via dilution by SONEDE in the Medjerda Basin and<br />
in the Greater Tunis region. This improvement in water quality would reduce the consumption of bottled<br />
water, especially non-mineralized water, which represents one third of the consumption of bottled water<br />
according to the survey mentioned above (Table 7.3). Though very conservative, reducing the consumption<br />
of bottled water has been considered at 1/5 of current consumption (4.4 million DT) <strong>for</strong> the C/A analysis<br />
over 20 years while considering the consumption of bottled water and the target population constant over<br />
the period (which is very uncertain due to the strong increasing tendency of consumption in recent years).<br />
95. Scenario 1, consisting of desalinating 20,000 m 3 /day over 3 months, is profitable with a positive NPV<br />
of 8 million DT, an IRR of over 10% and the VA/C ratio greater than 1. Scenario 2, consisting of desalinating<br />
30,000 m 3 /day over 3 months, can reach a tipping point threshold at which the alternative would become<br />
unprofitable and which serves as a sensitivity analysis. Scenario 3 is rejected (Table 7.4).<br />
Table 7.3: Investments and discounted benefits <strong>for</strong> drinking water quality, 2011-30<br />
Water and sanitation in rural areas<br />
Initial<br />
investment in<br />
2011<br />
Total<br />
investments at<br />
10% over 20<br />
Initial<br />
benefit in<br />
2012<br />
years<br />
Million DT Million DT Million DT Million DT<br />
Total benefit at<br />
10% over 20<br />
years<br />
Scenario 1: 20,000 de m 3 /day over 3<br />
15.8 19.3 3.9 33.0<br />
months/year<br />
Scenario 2: 30,000 m 3 /day over 3 months/year 23.7 28.9 3.9 33.0<br />
Scenario 3: 40,000 m 3 /day over 3 months/year 31.7 38.5 3.9 33.0<br />
Source: Authors.<br />
Table 7.4: Cost/Benefit analysis <strong>for</strong> the remediation of drinking water quality, 2010<br />
Indicators<br />
Of the C/B analysis<br />
Profitability criterion<br />
(discount rate of 10%<br />
and investment duration of 20<br />
years)<br />
Scenario 1<br />
20,000<br />
m 3 /day over 3<br />
months/year<br />
Scenario 2<br />
30,000<br />
m 3 /day over<br />
3<br />
months/year<br />
Scenario 3<br />
40,000<br />
m 3 /day<br />
over 3<br />
months/ye<br />
ar<br />
NPV million DT >0 8.0 0.5 -11.3<br />
IRR ≥10% 32% 11% --<br />
B/C ratio (current<br />
value)<br />
>1 1.7 1.1 0.9<br />
Results<br />
Note: the flow of benefits occurs with a delay of 1 to 2 years.<br />
Source:Authors.<br />
To be<br />
considered<br />
To be<br />
considered<br />
To reject<br />
96. This analysis deserves further investigation to derive the elasticity of demand <strong>for</strong> drinking tap water<br />
with improved taste (reducing salinity in summer) of the latter. Still, the three scenarios suggested only<br />
marginally reduce the water salt content andcould be considered as back-up <strong>for</strong> drought years when<br />
salinity in the Medjerda increases substantially. In addition, an ef<strong>for</strong>t upstream, that is actions as part of<br />
TUNISIA - DEGRADATION COST OF WATER RESOURCES OF THE MEDJERDA BASIN 55
Sustainable Water Integrated Management (<strong>SWIM</strong>) - Support Mechanism<br />
Project funded by the <strong>European</strong> Union<br />
better land management, would allow <strong>for</strong> a positive impact on water resources and hence on the quality of<br />
drinking water.<br />
7.3 WATER AND SANITATION IN RURAL AREAS<br />
97. Many projects such as PISEAU II (Section 2) with a total cost of $EU 170 million are underway to<br />
improve drinking water especially in rural areas. In addition, a particular ef<strong>for</strong>t is underway by ONAS in<br />
collaboration with the AfD and the World Bank to catch up with the rate of sanitation coverage in rural<br />
areas especially in the governorate of Beja.<br />
98. Achievable reductions in cases of diarrhoea and mortality due to diarrhoea after improving water<br />
supply, sanitation and hygiene measures are based on recent meta-analyzes shown in Table 7.5. The cases<br />
in the figure where: (i) drinking water supply exists when the connection to the sewer does not exist, and<br />
(ii) where drinking water supply does not exist and the connection to the sewer does not exist have been<br />
selected: On average, reductions would be 50% and 60% respectively (Table 7.3) and this taking into<br />
account the state of hygiene in households. 57<br />
99. Investment and awareness costs related to the improvement of water supply, sanitation and hygiene<br />
measures are shown in Table 7.3 with wide variations. Average reductions of 50% <strong>for</strong> sanitation and 60%<br />
<strong>for</strong> water and sanitation have been adopted to derive gains amounting to 9 million DT in 2011 (Table 7.6) if<br />
investments were to be immediately realized in the Basin of Medjerda in rural areas. Intervention would<br />
increase the rate of sanitation coverage from 17% in 2010 and will include population growth until 2030 in<br />
rural areas. Intervention would increase the coverage of water and sanitation from 16% in 2010 and will<br />
include population growth until 2030 in rural areas.<br />
Table 7.5: Feasible reduction of diarrhoea cases with improvement of services<br />
Water and<br />
sanitation<br />
coverage rate<br />
Population<br />
distribution<br />
2010<br />
Improvement of water and sanitation<br />
Drinking water<br />
supply and<br />
sewage<br />
network<br />
connection<br />
Drinking water<br />
supply<br />
and no<br />
connection to<br />
the sewage<br />
network<br />
56% Improved reliability and quality of water (to ensure<br />
water supply adequately and safely) to those of the<br />
population currently having problems with water<br />
supply reliability and quality<br />
21% a) Improved reliability and quality of running water (to<br />
ensure water supply adequately and safely) to those<br />
of the population currently having problems with<br />
water supply reliability and quality<br />
b) Connection of wastewater (and flush <strong>for</strong> those with<br />
toilets or no toilets) <strong>for</strong> this entire population.<br />
Feasible reduction of diarrhoea<br />
cases when:<br />
Good hygiene Hygiene<br />
at household improvement at<br />
level is verified the household<br />
level is necessary<br />
15% 45%<br />
35% 65%<br />
57 Bassi et al. (2011).<br />
TUNISIA - DEGRADATION COST OF WATER RESOURCES OF THE MEDJERDA BASIN 56
Sustainable Water Integrated Management (<strong>SWIM</strong>) - Support Mechanism<br />
Project funded by the <strong>European</strong> Union<br />
No drinking<br />
water supply<br />
and sewage<br />
network<br />
connection<br />
No drinking<br />
water supply<br />
and no sewage<br />
network<br />
connection<br />
1% Reliable and safe water supply locally <strong>for</strong> this entire<br />
population<br />
22% Reliable and safe water supply and connection <strong>for</strong><br />
wastewater (and flush <strong>for</strong> those with toilets or no<br />
toilets) <strong>for</strong> this entire population.<br />
25% 55%<br />
45% 75%<br />
Total 100% 28% 60%<br />
Source: adaptedfrom Bassi et al. (2011).<br />
Table 7.6: Investment and discounted benefits <strong>for</strong> water and sanitation, 2011-30<br />
Water and sanitation in Investment per<br />
rural areas<br />
inhabitant<br />
Minimu<br />
m<br />
DT/inhab<br />
.<br />
Maximum<br />
DT/inhab.<br />
Water 143 171<br />
Sanitation 64 100<br />
Hygiene awareness 6 11<br />
Initial<br />
investment<br />
2011<br />
Total<br />
investment at<br />
10% over 20<br />
years<br />
Initial<br />
benefit 2012<br />
Total benefit at<br />
10% over 20<br />
years<br />
Million DT Million DT Million DT Million DT<br />
scenario 1<br />
30 38 6.3 77<br />
Sanitation and<br />
Awareness<br />
scenario 2<br />
75 95 7.4 89<br />
Water, Sanitation and<br />
Awareness<br />
scenario 3<br />
105 134 13.7 151<br />
scenarios 1 and 2<br />
Note: maintenance costs 4% <strong>for</strong> water supply and sanitation <strong>for</strong> the initial investment were considered with a<br />
net increase of 3% per annum over the period. The cost of sensitisation is allocated in the first year with annual<br />
media reminders.<br />
Source: WASH website: ;<br />
and Authors.<br />
100. Scenario 1 ensuring improved sanitation to 313,519 inhabitants 58 between 2011 and 2030 is profitable<br />
with a positive NPV of 32 million DT, an IRR of over 10% and VA/C ratio greater than 1. Scenario 2 ensuring<br />
safe drinking water and improved sanitation to 295,076 inhabitants between 2011 and 2030 is not<br />
profitable. However, when the scenario 3, which includes scenario 1 and 2, is considered, the investment<br />
becomes profitable with a positive NPV of 17 million DT, an IRR of over 10% and the VA of the B/C ratio of<br />
over 1 (Table 7.7). In other words, sanitation with or without drinking water justifies the investments and<br />
reduces the pollution of water resources drastically.<br />
58 Tunisian Annual Statistics 2006-2010 (2011).<br />
TUNISIA - DEGRADATION COST OF WATER RESOURCES OF THE MEDJERDA BASIN 57
Sustainable Water Integrated Management (<strong>SWIM</strong>) - Support Mechanism<br />
Project funded by the <strong>European</strong> Union<br />
Table 7.7: Cost/Benefit analysis <strong>for</strong> the restoration of rural water and sanitation, 2010<br />
Indicators<br />
of C/P analysis<br />
Profitability criterion<br />
(discount rate of 10%<br />
and investment duration of 20<br />
years)<br />
Scenario 1<br />
Water and<br />
awareness<br />
over 20 years<br />
Scenario 2<br />
Water, sanitation<br />
and awareness<br />
over 20 years<br />
Scenario 3<br />
Scenarios 1<br />
and 2 over<br />
20 years<br />
NPV million DT >0 32 -15 17<br />
IRR ≥10% 22% 7% 12%<br />
B/C ratio (current<br />
>1 2.0 0.9 1.1<br />
value)<br />
Results<br />
To be<br />
considered<br />
To reject<br />
To be<br />
considered<br />
Note: the flow of benefits occurs with a delay of 1 to 2 years.<br />
Source: Authors.<br />
7.4 IMPROVEMENT OFMUNICIPAL WASTE MANAGEMENT<br />
101. The 2011 GIZ report on the waste chain management excludes the rural population because of the<br />
dispersion of villages resulting in high technical costs. Hence, the difficulty in linking them with a<br />
centralized system covering cities, municipalities and some mixed regions. Thus, <strong>for</strong> the rural population,<br />
community and participatory approaches are recommended eventually.<br />
102. The GIZ report includes 4 of 6 governorates in the Medjerda, namely, Beja, Jandouba, Le Kef and<br />
Siliana. Waste generation reached 183,369 tons of municipal waste and 39,600 tons of inert waste in 2009:<br />
household waste (150,000 tons, including 544 tons recycled by EcoLef), sludge from STEPs (13,000 tons of<br />
dried sludge); construction debris (49,500 tons), common industrial waste (9,000 tons), healthcare waste<br />
(556 tons) and waste from slaughterhouses (1,089). Agricultural waste (2 million tons) is added to this<br />
total, but a value creation option was used in the degradation cost up here. For STEPs, 6 scenarios are<br />
developed with an estimate of nearly 8,000 tons of dry matter in 2033 at a cost ranging between 88 DT per<br />
ton <strong>for</strong> all discharge to 180 DT per ton <strong>for</strong> sludge recovery.<br />
Table 7.8: Investments and discounted benefits <strong>for</strong> waste, 2011-34<br />
Water and sanitation in rural areas<br />
Initial<br />
investment<br />
2011<br />
Total<br />
investment at<br />
10% over 24<br />
years<br />
Initial<br />
benefit 2012<br />
Total benefit at<br />
10% over 24<br />
years<br />
Million DT Million DT Million DT Million DT<br />
scenario 1: Transfer Station, Segregation, 15%<br />
134 229 7.2 71<br />
recycling, 15% composting and landfill<br />
scenario 2: Transfer Station, Segregation, 10%<br />
129 222 6.4 63<br />
recycling, 10% composting and landfill<br />
scenario 3: Transfer Station, landfill and electricity<br />
31 83 5.0 84<br />
generation<br />
Note: maintenance costs of 5% <strong>for</strong> initial investments were considered with a net increase of 3% per annum<br />
over the period.<br />
Source: World Bank (2011), World Bank (2012); and Authors.<br />
TUNISIA - DEGRADATION COST OF WATER RESOURCES OF THE MEDJERDA BASIN 58
Sustainable Water Integrated Management (<strong>SWIM</strong>) - Support Mechanism<br />
Project funded by the <strong>European</strong> Union<br />
103. Investment costs relate to the improvement of a portion of the domestic waste chain and cover<br />
transfer stations to the landfill <strong>for</strong> waste generated in cities, municipalities and some mixed regions with<br />
population of nearly 650,000 in 2010 and reaching 835,000 inhabitants in 2033 (Table 7.8).<br />
104. Thus, three scenarios were selected over 24 years <strong>for</strong> the governorates of the Northwest: scenario 1<br />
ensuring, in each governorate, one transfer station, one segregation station with 15% recycling and 15%<br />
composting with burial of the residual volume in landfills; scenario 2 ensuring, in each governorate, one<br />
transfer station, one segregation station with 10% recycling and 10% composting with burial of the residual<br />
volume in landfills; and scenario 3 ensuring, in each governorate, one transfer station and a landfill<br />
allowing <strong>for</strong> the construction of plants <strong>for</strong> electricity generation. Thus, investment costs vary between 31<br />
and 134 million DT with the cost <strong>for</strong> transportation (0.2 DT per km/ton), <strong>for</strong> transfer stations, <strong>for</strong><br />
segregation and <strong>for</strong> the landfills, as well as <strong>for</strong> operation and maintenance included in the analysis.Gains in<br />
the first year vary between 5.0 and 7.2 million DT (Table 7.9).<br />
Table 7.9: Cost /Benefit analysis <strong>for</strong> the restoration of domestic waste, 2010<br />
Indicators<br />
of C/A analysis<br />
Profitability criterion<br />
(discount rate of 10%<br />
and duration of investments<br />
of 24 years)<br />
Scenario 1<br />
Transfer station,<br />
segregation,<br />
15% recycling,<br />
15% composting<br />
and landfill<br />
Scenario 2<br />
Transfer station,<br />
segregation,<br />
10% recycling,<br />
10% composting<br />
and landfill<br />
Scenario 3<br />
Transfer<br />
station, landfill<br />
and electricity<br />
production<br />
NPV million DT >0 -158 -159 0,9<br />
IRR ≥10% -- -- 10%<br />
B/C ratio (current<br />
>1 0.3 0.3 1.0<br />
value)<br />
Results To reject To reject To be<br />
considered<br />
105. A C/A analysis was conducted concerning the improvement of part of the chain of domestic waste<br />
management and results are shown in Table 7.6. (See Annex V <strong>for</strong> detailed analysis). Scenarios 1 and 2 are<br />
not economically viable because they are too expensive. However, scenario 3 is profitable with a positive<br />
NPV of 0.9 million DT, an IRR of over 10% and VA of B/C ratio greater than 1 (Table 7.6).<br />
7.5 REDUCTION OF EROSION UPSTREAM TO REDUCE DAM SILTATION<br />
106. A program of the 2002-2011 National Conservation Strategy <strong>for</strong> water and soil conservation, and the<br />
protection of dams against siltation has been <strong>for</strong>mulated and a global development project <strong>for</strong> watersheds<br />
of all dams has been prepared and scheduled in Tunisia successfully. This approach is preventive and more<br />
effective than replacement costs used to calculate the costs of degradation above and is worth considering<br />
as a possible calculation of the restoration costs.<br />
107. Thus, ODESYPANO interventions and, to a lesser extent, those of the Regional Commissary <strong>for</strong><br />
Agricultural Development have generated benefits in the targeted regions. Nevertheless, it is very difficult<br />
to assess the exact impact of erosion control <strong>for</strong> the control and mobilization of surface water or<br />
agricultural land management. Still, the World Bank (2010) evaluated the interventions of these two<br />
TUNISIA - DEGRADATION COST OF WATER RESOURCES OF THE MEDJERDA BASIN 59
Sustainable Water Integrated Management (<strong>SWIM</strong>) - Support Mechanism<br />
Project funded by the <strong>European</strong> Union<br />
institutions in the Barbara Basin, on the north of the Medjerda basin, where many watersheds have the<br />
same topography and are subject to the same climatic conditions and the same erosion. However, the<br />
evaluation takes the direct benefits of conservation practices, such as planning or planting wheat, trees,<br />
etc., as well as indirect, such as carbon sequestration, without really trying to establish a causal<br />
relationship between interventions and the reduction of dam siltation.<br />
108. NPV with a discount rate of 10% over 20 years is 940-5,050 DT/ha in the area targeted <strong>for</strong> ODESYPANO<br />
interventions. Agro<strong>for</strong>estry (olives/cereals intermittently), rangeland improvement, permanent grassland<br />
and planting sulla (Forage Crops Genetic Resources) on farmland contribute most to this result, because<br />
interventions are most profitable from the social point of view. Cords and dry stone thresholds appear<br />
profitable only in combination with agro<strong>for</strong>estry.An NPV of 1,100-5,400 DT/ha is added to these benefits at<br />
the level of general environment. The interventions of the Regional Commissary <strong>for</strong> Agricultural<br />
Development give similar results with almost 2,700 DT/ha of the discount rate of 2% in the area targeted.<br />
109. Also, the third Mountainous Areas Development Project, funded by the World Bank, has recently been<br />
completed successfully, also producing significant gains albeit not showing decreased erosion. This project<br />
in particular contributes to: (i) an increase in plant and <strong>for</strong>est cover, rising from 32% to 38%, (ii) an increase<br />
in the percentage of land benefiting from investments in water and soil conservation, rising from 0.3% to<br />
13% and covering 20,700 hectares of fragile lands, and (iii) significant progress resulting in higher yields,<br />
diversification of agricultural production systems and rationalization of land allocation.<br />
110. A planning study <strong>for</strong> CES management in the governorate of Jendouba also resulted in positive<br />
benefits when social groups are taken into account but without really deriving a C/A <strong>for</strong> erosion and dam<br />
siltation.<br />
111. A study conducted by Daly-Hasen (2008) evaluated the benefit of <strong>for</strong>est direct and indirect values with<br />
more than of 14 DT/ha <strong>for</strong> the prevention of erosion (Box 7.1).<br />
Box 7.1:Usage value of a <strong>for</strong>est<br />
The value of usage of a <strong>for</strong>est and the distribution of benefits were calculated by Daly-Hassen et. al (2008) <strong>for</strong><br />
all returns that the government or the local population receive from <strong>for</strong>ests, external and social services<br />
(services <strong>for</strong> the whole society in general, biodiversity, <strong>for</strong> example, the prevention of soil degradation). The<br />
results showed that private benefits amounted to 96.8 $EU/ha in 2005 (equally shared between the<br />
government and local users). Wood pasture and fodder were the most valuable products generating 41.4<br />
million and 34.2 $EU/ha respectively. External benefits reached an average of 24.9 $EU/ha. Its main<br />
components are the prevention of erosion (9.8 $EU/ha), carbon sequestration (11.8 $EU/ha) and biodiversity<br />
conservation (3.2 $EU/ha). However, leisure is the least rewarding part of the economic benefit amounting to<br />
0.1 $EU/ha, despite the existence of several national parks and reserves in the study area.<br />
112. There remaining only the difficulty to derive usable costs <strong>for</strong> erosion prevention, no C/A analysis will<br />
be conducted in this case; however, there is an urgent need to launch a comparative study using<br />
multivariate analysis to correlate topography, land use, precipitation and dam siltation on at least three<br />
dams in the Medjerda. This will allow <strong>for</strong> establishing the determinants of siltation necessary <strong>for</strong> the design<br />
and implementation of upstream interventions that reduce siltation of dams.<br />
TUNISIA - DEGRADATION COST OF WATER RESOURCES OF THE MEDJERDA BASIN 60
Sustainable Water Integrated Management (<strong>SWIM</strong>) - Support Mechanism<br />
Project funded by the <strong>European</strong> Union<br />
8. RECOMMENDATIONS<br />
113. The diagnosis and analysis that have been developed in the previous chapters have allowed us to<br />
reach three general conclusions:<br />
a) the priority given to investments aimed primarily at increasing the quality of urban life and<br />
not providing much investment and institutions <strong>for</strong> the improvement of rural life while the<br />
Medjerda basin has a rural fabric;<br />
b) qualitative assessment of impacts on natural resources is generally understood under a<br />
technical point of view; however, the economic evaluation of such impact is almost nonexistent;<br />
and<br />
c) the "sectorisation" of decision making so that environmental issues are the sole competence<br />
of the environmental authorities of the country and are treated as advice or counsel, and this lack<br />
of “horizontal” integration and reflection and accurate accountability of existing institutions to<br />
achieve the overall objectives of sustainable development in the Medjerda basin.<br />
114. Five intervention areas are proposed <strong>for</strong> the integrated and sustainable management of the<br />
Medjerda water resources underlying the recommendations of this study:<br />
a) The gradual shift in the policy of intensifying natural resources exploitation, especially<br />
through mobilization of water resources. This shift can be achieved based on criteria that explicitly<br />
include economic per<strong>for</strong>mance and degradation as well as the scarcity of the Medjerda Basin<br />
resources.This should allow <strong>for</strong> better exploitation of water resources and secondly integrate<br />
heritage conservation concerns <strong>for</strong> "land and water" with improved productivity.<br />
b) Focusing primarily on efficient investment <strong>for</strong> domestic pollution control in rural and periurban<br />
areas that have been neglected in the past. Priority would be:<br />
1. Firstly, State investment in the extension of drinking water and sanitation in rural<br />
areas of the basin where poverty is predominant, using appropriate technologies. The<br />
findings of this study will allow ONAS to develop the sanitation strategy based on<br />
persuasive economic and environmental elements and provide monitoring indicators<br />
such as the reduction of the degradation cost of water resources.<br />
2. Planned investments by ANGed with the assistance of KfW should include not only<br />
the type of traditional landfills but also the generation of additional revenue in the <strong>for</strong>m<br />
of electricity as well as processing and closing of unregulated dumps in the Medjerda<br />
Basin.<br />
c) Planning of upstream interventions that reduce dam siltation in order to conclude upon the<br />
determinants of siltation and assess with precision the impact of anti-erosion measures in relation<br />
to control and mobilization of surface water as well as adapt erosion control methods based on<br />
their effective use by farmers.<br />
d) A decentralized in<strong>for</strong>mation network <strong>for</strong> continuous observation, tracking, monitoring of<br />
the environment and natural resources in the Medjerda basin.This network should be reoriented<br />
in partnership with the institutions of the water and the environment. This network will aim to:<br />
1. define and validate continuous protocols of exchange and cooperation with other<br />
in<strong>for</strong>mation sources and databases<br />
2. undertake measures <strong>for</strong> state of soil and water (already begun under the PISEAU<br />
and COPEAU);<br />
TUNISIA - DEGRADATION COST OF WATER RESOURCES OF THE MEDJERDA BASIN 61
Sustainable Water Integrated Management (<strong>SWIM</strong>) - Support Mechanism<br />
Project funded by the <strong>European</strong> Union<br />
3. reflect the understanding and assessment of the environment and its impact on<br />
health and degradation of the natural capital so as to contribute to decision-making<br />
based on accurate, regular data and in<strong>for</strong>mation; and<br />
4. provide all users with all in<strong>for</strong>mation and data on the nature and quality of water<br />
and soil as well as the constraints and incentives.<br />
e) The establishment of horizontal system <strong>for</strong> overall, integrated water management<br />
in the Medjerda watershed is strongly recommended. Effective and efficient investments<br />
are not sufficient to ensure multi-sectoral cooperation between ministries and beneficiaries.<br />
A "horizontal" system should be established to reflect the comprehensive and integrated<br />
water management in the Medjerda watershed. It is strongly recommended that the actions<br />
implemented are supported by a permanent group established in the MoA headquarters<br />
which would gather all sources of in<strong>for</strong>mation and scientific and technical expertise from the<br />
same ministry and its institutions (SONEDE INAT, CRDA, ODESYPANO) as well as external<br />
departments involved such as the MoE (ONAS ANGed, CITET) and MdSP and user<br />
representatives.This permanent policy and monitoring group of the Medjerda Basin can be<br />
established under the aegis of the Directorate General of the Office of Planning and Hydraulic<br />
Equilibria of MoA and should, in the first place:<br />
a) develop expertise in the assessment of benefits and damages and water<br />
conservation, and a consultancy regarding ways and means of integrating this aspect<br />
into sectoral development programs and strategies, and<br />
b) implement a system of monitoring and evaluation <strong>for</strong> investments and activities in<br />
the Medjerda basin.<br />
TUNISIA - DEGRADATION COST OF WATER RESOURCES OF THE MEDJERDA BASIN 62
Sustainable Water Integrated Management (<strong>SWIM</strong>) - Support Mechanism<br />
Project funded by the <strong>European</strong> Union<br />
9. REFERENCES<br />
Arnold, B. and Col<strong>for</strong>d, JM. 2007. “Treating water with chlorine at point-of-use to improve water quality and<br />
reduce child diarrhea in developing countries: a systematic review and meta-analysis.” American Journal of<br />
Tropical Medicine and Hygiene, vol. 76(2): 354-364.<br />
Baker, B., Metcalfe, P. Butler, S., Gueron, Y., Sheldon, R., and J,. East. 2007. The benefits of the Water<br />
Framework Directive Programme of Measures in England and Wales. Sponsored by Defra, Welsh Assembly<br />
Government, Scottish Executive, Department of Environment Northern Ireland, Environment Agency, Scottish<br />
Environment Protection Agency, Department of Business, Enterprise and Regulatory Re<strong>for</strong>m, Scotland and<br />
Northern Ireland Forum <strong>for</strong> Environmental Research, UK Water Industry Research, the Joint Environmental<br />
Programme, UK Major Ports Group, British Ports Association, CC Water, Royal Society <strong>for</strong> the Protection of<br />
Birds, National Farmers’ Union and Country Land and Business Association (the “Collaborative Partners”).<br />
Banque mondiale. 2007. République Tunisienne Evaluation du Coût de la Dégradation de l’Eau. Bureau Régional<br />
Moyen-Orient & Afrique du Nord. Département Développement Durable. Rapport No. 38456-TN. Washington,<br />
D.C.<br />
Banque Mondiale. 2010. La Génération des Bénéfices Environnementaux pour Améliorer la Gestion des Bassins<br />
Versants en Tunisie. République Tunisienne. Rapport No 50192 – TN. Bureau Régional Moyen-Orient & Afrique<br />
Du Nord Département Développement Durable. Washington, D.C.<br />
Bassi, S. (IEEP), P. ten Brink (IEEP), A. Farmer (IEEP), G. Tucker (IEEP), S. Gardner (IEEP), L. Mazza (IEEP), W. Van<br />
Breusegem (Arcadis), A. Hunt (Metroeconomica), M. Lago (Ecologic), J. Spurgeon (ERM), M. Van Acoleyen<br />
(Arcadis), B. Larsen and, F. Doumani. 2011. Benefit Assessment Manual <strong>for</strong> <strong>Policy</strong> Makers: Assessment of Social<br />
and Economic Benefits of Enhanced Environmental Protection in the <strong>ENP</strong>I countries. A guiding document <strong>for</strong> the<br />
project ‘<strong>Analysis</strong> <strong>for</strong> <strong>European</strong> <strong>Neighbourhood</strong> <strong>Policy</strong> (<strong>ENP</strong>) Countries and the Russian Federation on social and<br />
economic benefits of enhanced environmental protection’. Brussels.<br />
Caractérisation des pollutions de l’oued Medjerda. 2011. Comité de Coopération Marseille Provence en<br />
partenariat avec le service COPEAU et l’ANPE et le financement de l’Agence de l’Eau Rhône Méditerranée.<br />
Tunis.<br />
Centre d’analyse stratégique. 2009. La valeur tutélaire du carbone. Rapports et documents N.16/2009 -<br />
Rapport de la commission présidée par Alain Quinet. Paris.<br />
Centre <strong>for</strong> Development and Environment (CDE). 2009. Benefits of sustainable land management. University of<br />
Bern. UNCCD, WOCAD, and others. Bern.<br />
Commission of the <strong>European</strong> Communities (CEC). 1991. Council Directive of 21 May 1991 concerning urban<br />
waste water treatment (91/271/EEC). OJ L135, 30.5.1991.<br />
Clasen, T., Schmidt, W-P., Rabie, T., Roberts, I., and Cairncross, S. 2007. “Interventions to improve water quality<br />
<strong>for</strong> preventing diarrhoea: systematic review and meta-analysis.” British Medical Journal, 334:782-91.<br />
Curtis, V. and Cairncross, S., 2003. “Effect of Washing Hands with Soap on Diarrhoea Risk in the Community: A<br />
Systematic Review.” Lancet Infectious Diseases, vol. 3:275-81.<br />
Daly-Hassen, H., Mansoura, A.B., 2008. “Private and social values and their distribution in Tunisian cork oak<br />
<strong>for</strong>ests.” Paper <strong>for</strong> the XIII World Forestry Congress, Buenos Aires, Argentina, 18 – 23 October 2009.<br />
Department <strong>for</strong> Energy and Climate Change (DEEC). 2009. Carbon Valuation in UK <strong>Policy</strong> Appraisal: A Revised<br />
Approach. London.<br />
TUNISIA - DEGRADATION COST OF WATER RESOURCES OF THE MEDJERDA BASIN 63
Sustainable Water Integrated Management (<strong>SWIM</strong>) - Support Mechanism<br />
Project funded by the <strong>European</strong> Union<br />
<strong>European</strong> Commission (EC). 2008. Impact Assessment - Document accompanying the Package of<br />
Implementation measures <strong>for</strong> the EU’s objectives on climate change and renewable energy <strong>for</strong> 2020 -<br />
Commission Staff Working Document. Brussels.<br />
<strong>European</strong> Commission (EC). 2009. Directive 2009/28/EC of the <strong>European</strong> Parliament and of the Council of 23<br />
April 2009 on the promotion of the use of energy from renewable sources and amending and subsequently<br />
repealing Directives 2001/77/EC and 2003/30/EC.<br />
<strong>European</strong> Environment Agency (EEA). Undated: glossary.eea.europa.eu<br />
<strong>European</strong> Environment Agency (EEA). 2009. Water resources across Europe — confronting water scarcity and<br />
drought.<br />
Fewtrell, L., Kaufmann, R., Kay, D., Enanoria, W., Haller, L., and Col<strong>for</strong>d, JM. 2005. “Water, sanitation, and<br />
hygiene interventions to reduce diarrhoea in less developed countries: a systematic review and meta-analysis.”<br />
Lancet Infectious Diseases, vol. 5:42-52.<br />
FAO. 2010c. Global Forest Resources Assessment: www.fao.org/<strong>for</strong>estry/62318/en/<br />
FAO.2011a. State of the World’s Forests 2011. <br />
FAO. 2011b. FAO Forestry Country In<strong>for</strong>mation: Tunisia. .<br />
Forster, P., V. Ramaswamy, P. Artaxo, T. Berntsen, R. Betts, D.W. Fahey, J. Haywood, J. Lean, D.C. Lowe, G.<br />
Myhre, J. Nganga, R. Prinn, G. Raga, M. Schulz and R. Van Dorland, 2007. Changes in Atmospheric Constituents<br />
and in Radiative Forcing. In: Climate Change 2007: The Physical Science Basis. Contribution of Working Group I<br />
to the Fourth Assessment Report of the Intergovernmental Panel on Climate Change [Solomon, S., D. Qin, M.<br />
Manning, Z. Chen, M. Marquis, K.B. Averyt, M.Tignor and H.L. Miller (eds.)]. Cambridge University Press,<br />
Cambridge, United Kingdom and New York, N.Y.<br />
GIZ. 2010. Etude de Faisabilité : Gestion des Déchets Municipaux de la Vallée de la Medjerda Phase 1 –<br />
Diagnostic de la Situation Actuelle et Définition des Objectifs. Tunis<br />
Hachicha, Mohamed. 2007. “Les sols salés et leur mise en valeur en Tunisie”.<br />
Science et changements planétaires/Sécheresse. Volume 18, Numéro 1, 45-50, Janvier, Février, Mars 2007.<br />
IFH. 2001. Recommendations <strong>for</strong> Selection of Suitable Hygiene Procedures <strong>for</strong> the Use in the Domestic<br />
Environment. International Scientific Forum on Home Hygiene. United Kingdom.<br />
Jebari, Sihem. 2009. Water erosion modeling using disaggregation - A study in semi-arid Tunisia fractal rainfall.<br />
Report No. 1047. Department of Water Resources Engineering, Lund Institute of Technology, Lund University,<br />
Sweden.<br />
Jebari, S., Berndtsson, R., Lebdi, F., and Bahri, A., 2012. “Historical aspects of soil erosion in the Mejerda<br />
catchment.” Hydrological Sciences Journal, 57 (5), 1–12.<br />
Karem A., Maamouri F., Ben Mohamed A. (sous la direction). 1999. Actes du séminaire de Gestion et<br />
conservation des zones humides tunisiennes. ProjetMedWet, Sousse, Octobre 1997, Tunis.<br />
Kotuby-Amacher, Janice, Boyd Kitchen and Rich Koenig. 2003. Salinity and Plant Tolerance. Utah State<br />
University. Utah.<br />
Lindhjem and Navrud. 2010. Meta-analysis of stated preference VSL studies: Further model sensitivity and<br />
benefit transfer issues. Prepared by HenrikLindhjem, Vista Analyse, Norway, and StåleNavrud, Department of<br />
Economics and Resource Management, Norwegian University of Life Sciences, Working Party on National<br />
Environmental Policies, OECD.<br />
Luby, S., Agboatwalla, M., Feikin, D., Painter, J., Ward Billheimer, MS., Altaf, A., and Hoekstra, R. 2005. “Effect<br />
of hand washing on child health: a randomised controlled trial.” Lancet, 366: 225-33.<br />
MA - Millennium Ecosystem Assessment. 2005. Ecosystems and Human Well-being: Biodiversity Synthesis.<br />
World Resources Institute, Washington, D.C.<br />
www.millenniumassessment.org/documents/document.354.aspx.pdf<br />
Matthews, E. and Themelis, N.J. 2007. Potential <strong>for</strong> Reducing Global Methane Emissions From Landfills, 2000-<br />
2030, Sardinia 2007, Eleventh International Waste Management and Landfill Symposium. NASA Goddard<br />
Institute <strong>for</strong> Space Studies, Earth Engineering Center, Columbia Univ. Boston.<br />
TUNISIA - DEGRADATION COST OF WATER RESOURCES OF THE MEDJERDA BASIN 64
Sustainable Water Integrated Management (<strong>SWIM</strong>) - Support Mechanism<br />
Project funded by the <strong>European</strong> Union<br />
Mediterranean Environmental Technical Assistance Program (METAP). 2009. Coastal Legal and Institutional<br />
Assessment and Environmental Degradation, Remedial and Averted Cost in Coastal Northern Lebanon. Funded<br />
by EC <strong>SM</strong>AP III and The Ministry of Foreign Affairs of Finland. Washington, D.C.<br />
Merlo M. and L. Croitoru (eds.). 2005. Valuing Mediterranean Forests: Towards Total Economic Value.<br />
Walling<strong>for</strong>d: CABI Publishing.<br />
Nelson, J. 1978. "Residential choice, hedonic prices, and the demand <strong>for</strong> urban air quality".Journal of Urban<br />
Economics 5 (3): 357–369.<br />
Nordhaus, William. 2001. “Global Warming Economics.” Science. 294(5545): 1283-1284. Nordhaus, William.<br />
2011. “Estimates of the Social Cost of Carbon: Background and Results from the RICE-2011 Model.” NBER<br />
Working Paper No. 17540. Oct 2011.<br />
Pimentel. D., Harvey. C., et al. 1995. “Environmental and economic costs of soil erosion and conservation<br />
benefits.” Science. 267: 1117-23.<br />
Rabie, T. and Curtis, V. 2006. “Handwashing and risk of respiratory infections: a quantitative systematic<br />
review.” Tropical Medicine and International Health, vol. 11(3): 258-67.<br />
Raskin, P., Gleick, P.H., Kirshen, P., Pontius, R. G. Jr and Strzepek, K., 1997. Comprehensive assessment of the<br />
freshwater resources of the world. Stockholm Environmental Institute, Sweden. Document prepared <strong>for</strong> UN<br />
Commission <strong>for</strong> Sustainable Development 5th Session 1997.<br />
Sonneveld, B.G.J.S. and Dent, D.L. 2007. “How good is GLASOD?” Journal of Environmental Management, 1-10.<br />
TEEB. 2009. The economics of ecosystems and biodiversity <strong>for</strong> national and international policy makers -<br />
summary: responding to the value of nature. <strong>European</strong> Commission, Brussels.<br />
TEEB. 2010. The Economics of Ecosystems and Biodiversity: Ecological and Economic Foundations. Edited by<br />
Pushpam Kumar, Earthscan, London.<br />
TEEB. 2011. The Economics of Ecosystems and Biodiversity in National and International <strong>Policy</strong> Making. Edited<br />
by Patrick ten Brink. Earthscan, London.<br />
ten Brink, P. and S. Bassi. 2008. Benefits of Environmental Improvements in the <strong>European</strong> <strong>Neighbourhood</strong> <strong>Policy</strong><br />
(<strong>ENP</strong>) Countries – A Methodology. A project working document <strong>for</strong> DGENV.<br />
U.S. Department of the Interior (USDI). 2012. U.S. Geological Survey Minerals Yearbook<br />
2010. Washington, D.C.<br />
Van Acoleyen, M., and Baouendi, A. 2011. <strong>Analysis</strong> <strong>for</strong> <strong>European</strong> <strong>Neighbourhood</strong> <strong>Policy</strong> (<strong>ENP</strong>) Countries and the<br />
Russian Federation of social and economic benefits of enhanced environmental protection – Tunisia Country<br />
Report, funded by the <strong>European</strong> Commission. Brussels.<br />
World Health Organisation (WHO). 2002. Environmental Health Indicators <strong>for</strong> the WHO <strong>European</strong> region.<br />
Update of Methodology. Geneva.<br />
WHO. 2010. World Health Statistics 2010. Geneva.<br />
WHO/UNICEF. 2010a. Progress on Sanitation and Drinking-Water 2010 Update. Geneva<br />
WHO/UNICEF. 2010b. Estimates <strong>for</strong> the use of improved drinking-water sources and improved sanitation<br />
facilities: Tunisia. JMP <strong>for</strong> Water Supply and Sanitation. March 2010. www.childinfo.org.<br />
World Bank. 2004. Cost of Environmental Degradation – The Case of Lebanon and Tunisia. Environmental<br />
Economics Series. Paper number 97. Edited by M. Sarraf, M. Oweygene and B. Larsen. Washington, D.C.<br />
World Bank. 2008. Environmental Health and Child Survival: Epidemiology, Economics, Experiences.<br />
Washington, D.C.<br />
World Bank. 2010. Lebanon Country Environmental <strong>Analysis</strong>. Washington, D.C.<br />
World Bank. 2011. World Development Indicators. Washington, D.C.<br />
World Bank. 2012. For Better For Worse. Republic of Egypt. Washington, D.C.<br />
10. ANNEX I IDENTIFICATION MISSION<br />
TUNISIA - DEGRADATION COST OF WATER RESOURCES OF THE MEDJERDA BASIN 65
Sustainable Water Integrated Management (<strong>SWIM</strong>) - Support Mechanism<br />
Project funded by the <strong>European</strong> Union<br />
Evaluation of the Degradation cost of the Environment of the Medjerda Basin in Tunisia: List of<br />
people met<br />
Tunis, from July 30 to August 04, 2012<br />
Institution Name Function<br />
General Directorate <strong>for</strong> the<br />
Protection and Control of<br />
Agricultural Product Quality<br />
MR BouzidNasraoui<br />
MR FethiSakli<br />
MR AbdelbakiLabidi<br />
MR Mohamed Beji<br />
MR ChaabaneMoussa<br />
MR Adel Jemmazi<br />
Ms FatmaChiha<br />
MR KacemChammkhi<br />
General Director<br />
Plant Protection Director<br />
Chemical Analyses Service<br />
Deputy Director of Inputs and Products<br />
Ing/P – Chief of fertilizer and pesticide<br />
homologation service<br />
Deputy Director of Internal Sanitary Control<br />
Deputy Director of Seeds and Plants<br />
Flora homologation and protection<br />
Directorate of Large Dams<br />
and Hydraulic Works<br />
Office of Planning and<br />
Water Equilibrium<br />
Directorate General of<br />
Water Resources<br />
MR TawfikAbdelhedi<br />
MR Hassen Ben Ali<br />
MR Mellouli Mohamed<br />
MsSondessKamoun<br />
MR MoncefRekaya<br />
General Director<br />
General Director<br />
General Director<br />
ONAS<br />
Regional Directorate <strong>for</strong> the<br />
Environment of the North<br />
Seashore<br />
General Directorate of the<br />
Environment and Quality of<br />
Life<br />
National Agency <strong>for</strong> the<br />
Protection of the<br />
Environment (ANPE)<br />
Observatory of New and<br />
Emerging Diseases<br />
ANGED<br />
MR NejibAbid<br />
MR Omrani<br />
MR Adel Boughanmi<br />
Ms NesrineGdiri<br />
Ms AwatefMessai<br />
MR Samir Kaabi<br />
Ms MounaSfaxi<br />
MR MabroukNedhif<br />
Ms MyriamJenaih<br />
Director of Planning<br />
Chief of Planning & Budgets Department<br />
TUNISIA - DEGRADATION COST OF WATER RESOURCES OF THE MEDJERDA BASIN 66
Sustainable Water Integrated Management (<strong>SWIM</strong>) - Support Mechanism<br />
Project funded by the <strong>European</strong> Union<br />
INSTM<br />
DUE<br />
MR BechirBéjaoui<br />
MR NoureddineZaaboul<br />
MR Denis Pommier<br />
Friday 03 August 2012<br />
General Directorate of<br />
Forests<br />
INAT<br />
SONEDE<br />
MR RafikAini<br />
Ms JamilaTarhouni<br />
Ms SalmBettaeib<br />
MR Mohame Salah Ben<br />
Romdhane<br />
MR MosbahHellali<br />
Rural Engineering Department<br />
Fishery Department<br />
DGACTA<br />
MRAbdellahCherid<br />
DGFIOP<br />
Ms LamiaJemmali<br />
Directorate of Hygiene MR Mohamed Rabhi General Director<br />
Consultation Workshop on the Degradation cost of the Environment of the Medjerda Basin in<br />
Tunisia: List of Participants<br />
Tunis, 7 December 2012<br />
# Forename Name Title Organisation Department E-mail address<br />
1 Dr. Sherif ARIF Consultant <strong>SWIM</strong>-<strong>SM</strong> sherifarif59@yahoo.<br />
com<br />
2 MR Khalil ATTIA P.D.G ONAS – Ministry<br />
<strong>for</strong> the<br />
pdg@onas.nat.tn<br />
3 MR Mohamed AYADI District<br />
SupervisorAri<br />
ana CRDA<br />
Environment<br />
Ministry <strong>for</strong><br />
Agriculture<br />
4 MR Habib AZAIEZ P.D.G SECADENORD<br />
Ministry <strong>for</strong><br />
Agriculture<br />
Regional<br />
Commissary<br />
<strong>for</strong><br />
Agricultural<br />
Development<br />
of Ariana<br />
Association<br />
<strong>for</strong> the<br />
Exploitation of<br />
Canal and<br />
Water Supply<br />
Systems of<br />
the North<br />
ayedm11@yahoo.fr<br />
secadenord@secade<br />
nord.com.tn<br />
TUNISIA - DEGRADATION COST OF WATER RESOURCES OF THE MEDJERDA BASIN 67
Sustainable Water Integrated Management (<strong>SWIM</strong>) - Support Mechanism<br />
Project funded by the <strong>European</strong> Union<br />
5 MR Sami AZOUZ Deputy<br />
Director<br />
6 MR Néji BALTI Chief<br />
Engineer<br />
SECADENORD<br />
Ministry <strong>for</strong><br />
Agriculture<br />
Ministry <strong>for</strong><br />
Agriculture<br />
CRDA of Jendouba<br />
7 MR Béchir BEJAOUI Researcher National Institute<br />
<strong>for</strong> Marine<br />
Sciences and<br />
Technologies<br />
8 Ms Faïza BEN ATIG Environment<br />
alist<br />
SCET-TUNISIE<br />
9 MR Riadh BEN MOUSSA Service Chief Ministry <strong>for</strong><br />
Agriculture<br />
1<br />
0<br />
1<br />
1<br />
1<br />
2<br />
MR<br />
Bader<br />
Essalem<br />
Dr. Anne CHAPONNIER<br />
E<br />
BEN LETAIEF Service Chief National Office <strong>for</strong><br />
Sanitation<br />
Association<br />
<strong>for</strong> the<br />
Exploitation of<br />
Canal and<br />
Water Supply<br />
Systems of<br />
the North<br />
Water<br />
Resources<br />
(Hydraulic)<br />
Marine<br />
Environment<br />
Environment,<br />
Hydraulics<br />
and<br />
Agriculture<br />
Directorate<br />
General <strong>for</strong><br />
Funding<br />
Investments<br />
and<br />
Professional<br />
Organisations<br />
azouzsami@gmail.co<br />
m<br />
Nbalti05@gmail.com<br />
nouri_zaaboub@yah<br />
oo.fr<br />
benmoussa_riadh@y<br />
ahoo.fr<br />
dop.suiviprojet@ona<br />
s.nat.tn<br />
Expert GIZ CCC Project anne.chaponniere@<br />
giz.de<br />
MR Fadi DOUMANI Consultant <strong>SWIM</strong>-<strong>SM</strong> fdoumani@yahoo.co<br />
m<br />
1<br />
3<br />
1<br />
4<br />
1<br />
5<br />
1<br />
6<br />
1<br />
7<br />
1<br />
8<br />
Ms<br />
f.benatig@scettunisie.com.tn<br />
Marie-<br />
Josée<br />
ELLOUMI Directeur ANPE Department<br />
of monitoring<br />
environmenta<br />
l fields<br />
Dr. Raoudha GAFREJ Assistant<br />
Professor<br />
Expert<br />
MR Chedli GHAZOUANI Chief<br />
Engineer<br />
University of Tunis<br />
El Manar<br />
- ISSBAT<br />
Ministry <strong>for</strong><br />
Agriculture<br />
CRDA of Jendouba<br />
MR Balti HABIB CUDA of Beja Ministry <strong>for</strong><br />
Agriculture<br />
MR Abdelkader HAMDANE Consultant-<br />
Trainer<br />
MR Habib HELALI Deputy<br />
Director<br />
INAT<br />
Ministry <strong>for</strong><br />
Agriculture<br />
Departement<br />
of Protection<br />
of the<br />
environment<br />
Hydaulics and<br />
Rural<br />
Equipment<br />
Bureau of<br />
International<br />
Cooperation<br />
Ministry <strong>for</strong><br />
Agriculture<br />
elloumi_mj_anpetun<br />
isie@yahoo.fr<br />
r.lahache@gnet.tn<br />
ghazouanich@yahoo<br />
.fr<br />
baltihabibbalti@yah<br />
oo.com<br />
abdelkader.hamdan<br />
e@gmail.com<br />
habib.hellali@iresa.a<br />
grinet.tn<br />
TUNISIA - DEGRADATION COST OF WATER RESOURCES OF THE MEDJERDA BASIN 68
Sustainable Water Integrated Management (<strong>SWIM</strong>) - Support Mechanism<br />
Project funded by the <strong>European</strong> Union<br />
1<br />
9<br />
2<br />
0<br />
2<br />
1<br />
2<br />
2<br />
2<br />
3<br />
2<br />
4<br />
2<br />
5<br />
2<br />
6<br />
2<br />
7<br />
2<br />
8<br />
2<br />
9<br />
3<br />
0<br />
3<br />
1<br />
Dr. Taoufik HERMASSI Researcher National Research<br />
Institute <strong>for</strong> Rural<br />
Engineering,<br />
Water and<br />
Forestry<br />
Research<br />
Laboratory of<br />
Rural<br />
Engineering<br />
taoufikhermassi@ya<br />
hoo.com<br />
MR Hamdi JABRI Engineer ANGED jabrihamdi@yahoo.f<br />
r<br />
MR Abderraouf JAZIRI HER Division Ministry <strong>for</strong> Regional jaziri_raouf@yahoo.f<br />
Chief<br />
Agriculture Commissary r<br />
CRDA of<br />
<strong>for</strong><br />
Ariana<br />
Agricultural<br />
Development<br />
of Ariana<br />
Dr. Sihem JEBARI Researcher INGREF Hydrology -<br />
CES<br />
MR Fethi JEMAI Regional Ministry <strong>for</strong><br />
Director Environment<br />
MR Samir KAABI Department<br />
Chief<br />
National Agency<br />
<strong>for</strong> the Protection<br />
of the<br />
Environment<br />
Ministry <strong>for</strong><br />
Ms Sondes KAMOUN General<br />
Director Agriculture<br />
Ms Awatef LARBI MESSAI Service Chief Ministry <strong>for</strong><br />
Environment<br />
Regional<br />
Directorate of<br />
the<br />
Environment<br />
of Beja<br />
Tunisian<br />
Observatory<br />
of the<br />
Environment`<br />
Directorate<br />
General <strong>for</strong><br />
the<br />
Environment<br />
and Quality of<br />
Life<br />
MR Faouzi MAAMOURI Coordinator WWF Medpo WWF Tunis<br />
office<br />
Dr. Mohamed<br />
Department<br />
Raouf<br />
of Hydraulics<br />
MAHJOUB Professor Superior School <strong>for</strong><br />
Engineers<br />
and Rural<br />
Equipment<br />
MR Mohamed MELLOULI Ministry <strong>for</strong><br />
Agriculture<br />
MR Chokri MEZGHANI Deputy<br />
Director<br />
MR<br />
Mohamed<br />
Lotfi<br />
Ministry <strong>for</strong><br />
Environment<br />
NACEF Director Ministry <strong>for</strong><br />
Agriculture<br />
Directorate<br />
General of<br />
Dams<br />
and Large<br />
Hydraulic<br />
Works<br />
Directorate<br />
General <strong>for</strong><br />
Sustainable<br />
Development<br />
Bureau of<br />
Inventory and<br />
Water<br />
Resources<br />
sihem.jebari@gmail.<br />
com<br />
jemaifethi17@yahoo<br />
.fr<br />
dt.ctl@anpe.nat.tn<br />
sondeskamoun@yah<br />
oo.fr<br />
awatef.messai@yah<br />
oo.fr<br />
Fmaamouri@wwftu<br />
nis.org<br />
mahjoub_raouf@ya<br />
hoo.fr<br />
chokri.mezghani@ya<br />
hoo.fr<br />
nacefml1@yahoo.fr<br />
TUNISIA - DEGRADATION COST OF WATER RESOURCES OF THE MEDJERDA BASIN 69
Sustainable Water Integrated Management (<strong>SWIM</strong>) - Support Mechanism<br />
Project funded by the <strong>European</strong> Union<br />
3<br />
2<br />
3<br />
3<br />
3<br />
4<br />
3<br />
5<br />
3<br />
6<br />
3<br />
7<br />
3<br />
8<br />
3<br />
9<br />
4<br />
0<br />
MR Mabrouk NADHIF Director Ministry <strong>for</strong> Public<br />
Health<br />
Dr. Fethi OULED-SAAD Deputy<br />
Director<br />
Ms Samira RAFRAFI Deputy<br />
Director<br />
Dr.<br />
Mll<br />
e<br />
Mohamed<br />
Salah<br />
ODESYPAMO<br />
Ministry <strong>for</strong><br />
Agriculture<br />
ROMDHANE Professor INAT/University of<br />
Carthage<br />
Rakia CATINI General<br />
Director<br />
(assisting<br />
SaadSEDDIK)<br />
MR Bouaziz SIFI Laboratory<br />
Chief<br />
MR Mohamed TARHANI Deputy<br />
Director<br />
Ministry <strong>for</strong><br />
Agriculture<br />
INRAT<br />
Ministry <strong>for</strong><br />
Regional<br />
Development and<br />
Planning<br />
Dr. Boubaker THABET Professor National<br />
Agronomic<br />
Institute of Tunisia<br />
MR Denis POMMIER EU Delegation in<br />
Tunisia<br />
National<br />
Observatory<br />
<strong>for</strong> New and<br />
Emerging<br />
Diseases<br />
Protection<br />
Management<br />
of Natural<br />
Resources<br />
Directorate<br />
General <strong>for</strong><br />
Financing,<br />
Investments<br />
et<br />
Professional<br />
Organisations<br />
Ecosystems<br />
and Aquatic<br />
Resources<br />
Directorate<br />
General <strong>for</strong><br />
Rural<br />
Engineering<br />
and Water<br />
Exploitation<br />
Laboratory of<br />
Agronomic<br />
Sciences and<br />
Techniques<br />
Directorate<br />
General <strong>for</strong><br />
Infrastructure<br />
s<br />
Agricultural<br />
and Agroalimentary<br />
Economy -<br />
Management<br />
mabrouk.nedhif@rn<br />
s.tn<br />
fethiouled@yahoo.fr<br />
samira.rafrafi@gmail<br />
.com<br />
ramdhanms@gmail.<br />
com<br />
saad.seddik@iresa.a<br />
grinet.tn<br />
bouazizsifi@yahoo.fr<br />
mohamed.tarhani@<br />
mdci.gov.tn<br />
boubaker_thabet.ina<br />
t@yahoo.com<br />
denis.pommier@eea<br />
s.europa.eu.<br />
4<br />
1<br />
4<br />
2<br />
4<br />
3<br />
4<br />
4<br />
4<br />
5<br />
Ms Monia ZIADI Division Chief<br />
SONEDE<br />
MR Essaied NAASSAOUI Director of<br />
ONAS<br />
MR Jemmali KHALIL<br />
MR Habib BALTI<br />
MR<br />
BahaEddin<br />
e<br />
JRADI<br />
SONEDE<br />
<strong>SWIM</strong>-Sustain<br />
Water<br />
MED Project<br />
TUNISIA - DEGRADATION COST OF WATER RESOURCES OF THE MEDJERDA BASIN 70
Sustainable Water Integrated Management (<strong>SWIM</strong>) - Support Mechanism<br />
Project funded by the <strong>European</strong> Union<br />
4<br />
6<br />
4<br />
7<br />
4<br />
8<br />
4<br />
9<br />
5<br />
0<br />
5<br />
1<br />
5<br />
2<br />
5<br />
3<br />
5<br />
4<br />
MR Hamed DALY INRAT<br />
Ms Najet GHARBI DGGREE n.gharbi@laposte.ne<br />
t<br />
Ms Soufia ABROUG ONAS<br />
Ms Nasima GUEDIRI ME/DRLN<br />
Ms Mouna SFAXI Engineer at<br />
ANPE<br />
Ms Kathrin ALBMANN Denis<br />
Pommier’s<br />
Delegation of the<br />
<strong>European</strong> Union in<br />
Tunisia<br />
Assistant<br />
Ms Dalila JAZIRI Directorate<br />
General <strong>for</strong><br />
Planning and<br />
Conservation of<br />
Agricultural Land<br />
MR Habib JAZIRI Directorate<br />
General <strong>for</strong><br />
Planning and<br />
Conservation of<br />
Agricultural Land<br />
Ms Caroline VILOS Coordinator<br />
of the event<br />
LDK Consultants<br />
Ministry <strong>for</strong><br />
Agriculture<br />
Ministry <strong>for</strong><br />
Agriculture<br />
dalila.jaziri@laposte.<br />
net<br />
jaziri.habib@yahoo.f<br />
r<br />
TUNISIA - DEGRADATION COST OF WATER RESOURCES OF THE MEDJERDA BASIN 71
Sustainable Water Integrated Management (<strong>SWIM</strong>) - Support Mechanism<br />
Project funded by the <strong>European</strong> Union<br />
11. ANNEX II GENERAL METHODOLOGY FOR THE EVALUATION OF<br />
THE COSTS OF DEGRADATION<br />
Water Category and Sub-Categories<br />
Drinking water quality and treatment. Treatment of drinking water can occur at two levels: at<br />
treatment stations <strong>for</strong> drinking water and at household level. The degradation cost is calculated by<br />
determining the change in production and, deriving the additional cost of treatment required at<br />
stations (e.g., when olive oil production wastewater is discharged into the watershed without<br />
treatment) and determining revealed preferences at the household level (e.g. when a household<br />
uses a filter, boils water and/or in an extreme case buys bottled water when the drinking water<br />
quality is poor). For the cost of restoration, the benefits can be derived by dilution (change in<br />
production) during the desalination of one part of the volume of water intended <strong>for</strong> domestic<br />
consumption as well as other investments that cover all other sub- categories in order to reduce<br />
anthropogenic and natural pollution of the resource.<br />
Quality of the services of drinking water or household water and of sanitation in urban and rural<br />
areas as well as of irrigation systems. The state of services is not considered in this case but could<br />
also be evaluated by deriving replacement costs associated with alternative sources of domestic<br />
water (bottles, wells, tanks, etc.) or production costs associated with cleaning/scouring septic tanks<br />
in case of deficiency of service. Opportunity costs can also be calculated <strong>for</strong> technical losses in the<br />
distribution network, which are considered in this study, or the time spent carrying water or<br />
clean/drain septic tanks. The change in health status is also considered in this subcategory. Some<br />
parameters of water quality do not affect the taste of water as does the excess of dissolved solids<br />
and sulfates.In addition, the bacteriological quality of the water can cause diseases such as typhoid,<br />
hepatitis A, trachoma and nematodes. In addition, the physico-chemical quality of the water can<br />
cause diseases such as excess red blood cells, hypertension and methemoglobinaemia which are<br />
respectively attributed to the excess of chlorides, sodium and nitrates.However, the causal<br />
relationship between water quality and certain diseases is very difficult to establish definitively,<br />
especially when it comes to cancer linked to ingestion of pesticides that contaminate drinking water<br />
or the food chain. Thus, the most reliable causality is that between diarrhoea that is transmitted via<br />
biological contamination on the one hand and the lack of water or water quality including drinking<br />
water, inadequate state of sanitation within the household and lack of hygiene measures (scarce use<br />
of soap) by household members on the other. Thus, a dose-response function, which has largely<br />
been established by a large number of studies, was used to assess water-borne diseases, including<br />
premature mortality and morbidity from diarrhoea affecting children under 5 years.Thus, the<br />
prevalence of diarrhoea in the region and the level of coverage of drinking water and sanitation have<br />
been considered in the dose-response function to derive the results. On mortality, it is difficult to<br />
assign a value to a premature death and this is a controversial issue. Yet the value of a human<br />
statistical life (VVS), which represents the reduction of premature death risk, has been used and is<br />
equal to 378,643 DT <strong>for</strong> all premature mortality in Tunisia. Also, the cost of care was considered <strong>for</strong><br />
TUNISIA - DEGRADATION COST OF WATER RESOURCES OF THE MEDJERDA BASIN 72
Sustainable Water Integrated Management (<strong>SWIM</strong>) - Support Mechanism<br />
Project funded by the <strong>European</strong> Union<br />
morbidity (hospitals, doctors, nursing assistants, medication, number of days of inactivity, etc.) at 45<br />
DT on average per case of diarrhoea <strong>for</strong> children under 5 years and 21 DT <strong>for</strong> population equal to or<br />
older than 5 years. 59 The cost of restoration includes investments to increase the coverage of water<br />
supply and sanitation. This should be accompanied by a good service and the launch of an awareness<br />
campaign <strong>for</strong> a change of behaviour in terms of hygiene within the household. In addition, an<br />
increase in the efficiency of irrigation systems is achieved using the change in productivity.<br />
Quality of water resources. This subcategory is exclusively anthropogenic in origin and is affected by<br />
the discharge of domestic wastewater, industrial, mining and fishing (fresh water fish farming)<br />
effluents as well as runoff due to nitrates and pesticides used in the agricultural sector. Leachates are<br />
however covered under Waste. Pollution of surface water and groundwater affects water use<br />
(domestic, agricultural and industrial), the ecosystem (eutrophication, effects on direct, indirect<br />
values and options, etc.) of the watershed and coastal areas, the cost of land, housing and<br />
apartments (hedonic method) along the polluted areas, and eco-tourism (loss of opportunity<br />
especially along the riverbanks and coasts polluted). However, it is very difficult to evaluate the<br />
degradation of water quality per impact. Thus, surveys using contingent valuation allow to derive the<br />
user’s revealed preferences (willingness-to-pay) in order to restore the desired state of the<br />
resource.This method is used based on a transfer of benefits (see Annex III).Moreover, to restore the<br />
quality of the resource, investments usually include: a choice ranging from the use of simple and<br />
inexpensive processes, such as natural sanitation using reeds, to the construction of STEPs with<br />
primary, secondary or tertiary treatment <strong>for</strong> the discharges of domestic wastewater; the change of<br />
the production process and/or the individual or collective treatment of industrial effluents; an<br />
awareness campaign among farmers to optimize the use of pesticides and nitrates or adopt organic<br />
farming; and in an extreme case where the resource is unrecoverable, a substitution of the resource<br />
by water supply from further distance or desalination with the transport of water resources being<br />
considered.<br />
Salinity. Salinity of surface water and groundwater is natural and anthropogenic (soil erosion due to<br />
human activity), and has effects on health, if water is used <strong>for</strong> domestic purposes (see above Quality<br />
of Drinking Water), agricultural productivity and ecosystems. Only the effects on agriculture are<br />
taken into account in this case with the use of a production change to derive the degradation cost.<br />
On the other hand, the cost of restoration may include several alternatives: the salinity<br />
compensation using more fertilizers (with a contrary effect, though, which pollutes water resources);<br />
dilution of groundwater resources by injecting treated wastewater; better land use by implementing<br />
a land strategy which may include planning instruments such as re<strong>for</strong>estation, responsible soil<br />
management, prevention or mitigation of soil erosion by water and wind, etc; and in an extreme case<br />
where the resource is unrecoverable, resource substitution by more distant water supply or<br />
desalination and transportation of water resources can be considered.<br />
Quantity. The scarcity of water resources is natural and anthropogenic, and is manifested by reduced<br />
flow or runoff, which is exacerbated by the increased use of resources to address population growth<br />
59 Bassi et al. (2011).<br />
TUNISIA - DEGRADATION COST OF WATER RESOURCES OF THE MEDJERDA BASIN 73
Sustainable Water Integrated Management (<strong>SWIM</strong>) - Support Mechanism<br />
Project funded by the <strong>European</strong> Union<br />
and cover economic activities.Moreover, the lengthening and disruption of drought cycles<br />
(frequencies and intensities) affect surface water and groundwater undergoing a lowering of<br />
groundwater levels and groundwater depth. The lack of flow is usually compensated: in an<br />
emergency, by the spontaneous use of treated or untreated wastewater which can cause<br />
contamination of the food chain; in an intermediate case, by pumping in more depth (rapid lowering<br />
or use of fossil water there<strong>for</strong>e non-renewable) groundwater resources is necessary to address<br />
domestic needs and/or maintain agricultural productivity; and in extreme cases, a substitution of the<br />
resource requiring water supply from a further distance or desalination and transport of water<br />
resources is considered <strong>for</strong> the surface water. The change in production, opportunity costs (shortfall)<br />
and replacement costs are considered <strong>for</strong> the calculation of the degradation cost while the cost of<br />
the restoration depends on the alternative chosen.<br />
Erosion and Storage. Management of water resources is affected by erosion and exacerbated by<br />
climate change reducing the storage capacity. The siltation and sedimentation of dams, mountain<br />
lakes, beds of rivers and coasts are compounded by inadequate land use upstream (such as<br />
de<strong>for</strong>estation, irresponsible soil management, water and wind erosion of soils, etc.) and exacerbated<br />
by climate change manifested in increased frequency and intensity of floods during the wet<br />
seasons.Replacement costs can be calculated by considering the decline in soil nutrient value which<br />
must be compensated by fertilizers, opportunity costs (releases necessary to disgorge basins) of<br />
water lost and damage to the ecosystem, defensive expenditures (dredging, construction of hillside<br />
lakes to absorb excess sedimentation); replacement costs (adding height to dams or building new<br />
dams); opportunity costs(shortfall) due to the reduction of the volume of water stored and<br />
reduction of the lifespan of dams and hill lakes; reduction of ecosystem services.In addition, the cost<br />
of restoration are in some cases the same costs used to assess degradation such as investments <strong>for</strong><br />
the construction of new dams. However, restoration costs may also include the implementation of a<br />
land planning strategy which may include instruments such as re<strong>for</strong>estation, responsible soil<br />
management, prevention or mitigation of erosion by water and wind soils, etc.<br />
Hydroelectric power. Output reduction is recorded in drought periods and the exacerbation of<br />
drought due to climate change could lead to power outages. The degradation cost considers the<br />
social cost of substitution <strong>for</strong> electricity generation by power plants fueled by fossil fuels.This cost<br />
includes the effects of pollutants and greenhouse gases. The cost of restoration or adaptation<br />
includes the substitution of fossil fuel power plants by renewable energy plants.<br />
Waste Category and Sub-Categories<br />
Chain of solid waste in urban and rural areas, including sludge from STEPs. Pollution from domestic<br />
and agricultural waste is of anthropogenic origin. Thus, the poor management of domestic solid<br />
waste and sludge (and possibly salt deposits with desalination per<strong>for</strong>med by SONEDE in the south)<br />
and agricultural wastes can result in several impacts such as: discom<strong>for</strong>t, health, visual, olfactory,<br />
auditory pollution, air, soil and water (leachate runoff) pollution, unregulated dumps can cause<br />
explosions and fires, reduction of the price of land/buildings/apartments around the landfill, etc. The<br />
degradation costs consider the entire chain of waste. Collection: allocation of 1% of household<br />
disposable income <strong>for</strong> households without coverage <strong>for</strong> solid waste while the sludge is collected by<br />
TUNISIA - DEGRADATION COST OF WATER RESOURCES OF THE MEDJERDA BASIN 74
Sustainable Water Integrated Management (<strong>SWIM</strong>) - Support Mechanism<br />
Project funded by the <strong>European</strong> Union<br />
providers, but generally rejected wild in nature (wadis, landfills, etc.). Landfills: cleaning cost per m 3 .<br />
Separation and recycling: the opportunity cost of recyclables using the market rate <strong>for</strong> non-recycled<br />
materials. Shortfall of energy production because of the lack of use of agricultural waste. Reduction<br />
in land prices around the landfill (revealed preferences using the hedonic method) or wadis where<br />
sludge from STEPs is rejected: lower prices <strong>for</strong> land, buildings and apartments at ± 15% in a<br />
circumference up to 30 m of the landfill, and ± 10% in a circumference of 30 to 100 m around the<br />
landfill. 60 Methane capture in sanitary landfills: shortfall of energy production and carbon footprint<br />
in the absence of a sanitary landfill. In addition, the cost of restoration depends on selected<br />
alternatives <strong>for</strong> the collection, transfer stations, stations <strong>for</strong> separation and recycling and sanitary<br />
landfills with or without methane capture.<br />
Chain of medical and hazardous waste. This is not considered in this study, but the impact could be<br />
more important than domestic waste if the services managing medical and hazardous waste are not<br />
adequate.<br />
Biodiversity category<br />
Various encroachments are recorded across the basin resulting in loss of ecosystems and medicinal<br />
plants. TEEB has been considered <strong>for</strong> the degradation cost (loss of services) while all interventions<br />
under other subcategories can be considered as restoration costs.<br />
Natural Disasters and Climatic Changes Category<br />
Natural disasters and climate change impacts are considered in a continuum from short to long term.<br />
Natural disasters. Floods, droughts, extreme events, etc. haveescalated in intensity and frequency<br />
over time. The costs of impacts include: health (mortality, injury, drowning, diseases, psycho-physical<br />
stress); property destroyed; impaired assets (revealed preferences using hedonic methods) in areas<br />
likely to be most affected by flooding (depreciation of land prices in floodplains), swells (depreciation<br />
of land prices in coastal areas due to the waves and coastal erosion), etc.; disruption of services;<br />
infrastructure affected; resources (releases with reduced resource and ecosystem effects)<br />
dilapidated, reduced economic productivity, etc.. The cost of restoration or prevention depends on<br />
the readiness and effectiveness of the response.<br />
GHG emissions. Downscaling models to estimate the effects of climate change exist <strong>for</strong> Tunisia.<br />
However, in this case, only the GHG emissions with an impact on the general environment will be<br />
considered.The World Resources Institute has identified two tons of CO 2 per year per capita as the<br />
threshold not to exceed so as to limit the temperature increase by 2 degrees Celsius above which a<br />
dangerous and irreversible climate change will become inevitable. Thus, the degradation cost<br />
considered marginal carbon emissions that exceed 2 tons of CO 2 per year per capita (excess tons of<br />
CO 2 per year and per capita multiplied by the population and the price of carbon). The social cost of<br />
CO 2 present and future (2000-2099) represents the damage caused by a ton of current emissions in<br />
60 Nelson (1978).<br />
TUNISIA - DEGRADATION COST OF WATER RESOURCES OF THE MEDJERDA BASIN 75
Sustainable Water Integrated Management (<strong>SWIM</strong>) - Support Mechanism<br />
Project funded by the <strong>European</strong> Union<br />
terms of floods, droughts, accelerated rise in sea level, decreased food production, species<br />
extinction, migration etc.. Several estimates are available <strong>for</strong> the social cost of CO 2 emissions ranging<br />
from $EU 3 to $EU 95 (Nordhaus, 2001; Stern, 2007; UNIPPC, 2007). Recently, the <strong>European</strong><br />
Commission (EC 2008 and DECC 2009) considered $EU 6 per ton as the lowest consolidated value of<br />
CO 2 and the French study (Centre <strong>for</strong> Strategic <strong>Analysis</strong>, 2009) 11 $EU per ton as the upper limit of<br />
CO 2 in 2009. A range of $EU 11.3 to 15.4 per ton of CO 2 in 2010 are the prices considered as<br />
minimum and maximum based on Nordhaus, 2011, who re-estimated the social cost of carbon at the<br />
present time and until 2015, including uncertainty, action weighting, and risk aversion. The average<br />
price is considered at $EU 13.3 equivalent to 19 DT per ton of CO 2 ($EU 45.1 per ton of carbon) in<br />
$EU of 2010.<br />
TUNISIA - DEGRADATION COST OF WATER RESOURCES OF THE MEDJERDA BASIN 76
Sustainable Water Integrated Management (<strong>SWIM</strong>) - Support Mechanism<br />
Project funded by the <strong>European</strong> Union<br />
12. ANNEX III SPECIFIC METHODS FOR THE EVALUATION OF THE<br />
COSTS OF DEGRADATION FOR THE WATER CATEGORY<br />
Methodology <strong>for</strong> Water Quality<br />
Unlike transfers of unadjusted benefits where the willingness to pay (CAP) on the policy site is<br />
assumed to be equal to the average values of the CAP on the original site (CAPp = CAPs)Transfers<br />
tend to adjust the values by taking into account all the possible differences (e.g. socio-economic and<br />
environmental variables included in the benefits aggregate function) between the two sites (see<br />
Bateman et al. (2000) or Garrod et Willis (1999)). Equation 1 provides a conceptual representation of<br />
the benefit transfer function approach:<br />
Site Survey: PAC = aS + + βs1Xs1 βs2Xs2<br />
Site <strong>Policy</strong>: CAPp = aS + + βs1Xp 1 βs2Xp 2<br />
Where s denotes the site survey, p the site policy and X 1 X 2 vectors specific features and<br />
characteristics of the population <strong>for</strong> each site (e.g., levels of income and education, at the baselines<br />
<strong>for</strong> water quality ...). Benefit transfer is considered a suitable tool <strong>for</strong> transferring CAP estimates<br />
adjusted between different locations where the vector of attributes and socio-economic<br />
characteristics (X 1 . X 2 ) which determine the similarities and differences between the policy and the<br />
survey site cannot be established. When these differences exist and their magnitudes are known, it is<br />
possible to substitute the known variables in the original site investigation aggregated benefits<br />
function to provide estimates. This exercise involves the choice of factors included and omitted from<br />
the analysis because of the limitation of data availability.<br />
Table A3.1: The annual CAP values <strong>for</strong> improving by 100% the water environment in 2016<br />
Elicitation method/ Model <strong>for</strong> 100%<br />
improvement in 2015<br />
England Wales England and Wales<br />
CAP<br />
average<br />
£/hous./ye<br />
ar<br />
CAP<br />
median£/h<br />
ous./year<br />
CAP average<br />
£/hous./year<br />
CAP<br />
median<br />
£/hous./ye<br />
ar<br />
CAP average<br />
£/hous./yea<br />
r<br />
CAP<br />
median<br />
£/hous./ye<br />
ar<br />
PCCV sample statistics 49.2 30.0 62.6 50.0 50.4 30.0<br />
PCCV MCO model 44.8 25.3 40.1 22.7 44.5 25.1<br />
Logit DCCV model 167.0 167.0 181.4 181.4 167.9 167.9<br />
Logit CE model 293.7 293.7 508.0 508.0 299.9 299.9<br />
Source: Baker et al. (2007).<br />
Baker et al. (2007) recently estimated the economic value placed by households in England and<br />
Wales to improve the water quality at local and national level as a result of the implementation of<br />
the Water Directive (Table A3.1). It is one of the few studies that have used an ecological series<br />
based on the water quality metrics <strong>for</strong> describing baselines and improvements. The results of this<br />
TUNISIA - DEGRADATION COST OF WATER RESOURCES OF THE MEDJERDA BASIN 77
Sustainable Water Integrated Management (<strong>SWIM</strong>) - Support Mechanism<br />
Project funded by the <strong>European</strong> Union<br />
research are used by the Department <strong>for</strong> Environment, Food and Rural Affairs and the Environmental<br />
Agency in England and Wales to in<strong>for</strong>m policy decisions necessary to comply with the directive.<br />
Raw wastewater and industrial discharges and all contaminants from processes, such as liquid waste<br />
of domestic, industrial and agricultural (e.g. organic pollution, hazardous waste and pesticides)<br />
origin, in the water basin of the Medjerda affect this resource negatively in general. Non-market<br />
economic value of a change in water quality that could result from wastewater treatment and waste<br />
policy options is calculated <strong>for</strong> the quality of surface waters. A method of benefit transfer is used in<br />
this context. The proposed methodology covers the direct and indirect values resulting from the<br />
improvement of the quality of water resources (Table A3.2).<br />
Table A3.2: Improvements of current usage and non-usage values of water resources<br />
Benefit Types of water usage Example<br />
Flow derived Recreation activities: fishing, swimming, boating<br />
Direct<br />
from resource<br />
usage<br />
utilisation<br />
Potential<br />
benefits of<br />
water quality<br />
Current<br />
usage<br />
Non Usage<br />
Indirec<br />
t usage<br />
Flow derived<br />
along the banks<br />
Option<br />
Existence<br />
Legs<br />
Source: Adapted from Baker et al. (2007).<br />
Recreation activities: Hiking, trekking<br />
Relaxation, peace and tranquillity<br />
Aesthetic, enjoyment of natural beauty<br />
Preferences of future utilization of the resource <strong>for</strong><br />
personal purposes<br />
Maintain a good environment <strong>for</strong> everyone’s enjoyment<br />
Pleasure in the knowledge that future generations will be<br />
able to use the resource<br />
Table A3.3 : CAP per household based on the payment card and the double choice derived from<br />
benefit transfers, 2010<br />
Willingness to pay Population Member in each<br />
household<br />
Scenario 3<br />
100% improvement after 6 years<br />
(# million) (#) Willingness to pay<br />
2010 2010 2010<br />
Minimum Average Maximum<br />
Greater Tunis ($EU/year) 2.5 4 13.4 14.3 17.6<br />
Medjerda Urban ($EU/year) 0.4 5 13.4 14.3 17.6<br />
Medjerda Rural ($EU/year) 0.8 6 13.4 14.3 17.6<br />
Greater Tunis (DT/year) 2.5 4 13.4 14.3 17.6<br />
Medjerda Urban (DT/year) 0.4 5 13.4 14.3 17.6<br />
Medjerda Rural (DT/year) 0.8 6 13.4 14.3 17.6<br />
Note: $ PPP Gross Domestic Income per capita was used to adjust the income differential (0.21) between the UK<br />
and Tunisia income; elasticity is estimated at 1. Exchange rate used 1$EU = 1.4 DT.<br />
Source: Baker et al. (2007); World Bank (2011); and Author.<br />
The assessment of market and nonmarket goods is based on people's preferences <strong>for</strong> environmental<br />
improvement and values are measured either by a direct elicitation procedure or by the indirect<br />
TUNISIA - DEGRADATION COST OF WATER RESOURCES OF THE MEDJERDA BASIN 78
Sustainable Water Integrated Management (<strong>SWIM</strong>) - Support Mechanism<br />
Project funded by the <strong>European</strong> Union<br />
analysis of transactions in markets where preferences <strong>for</strong> environmental goods are expected to<br />
affect the price of the marketed goods (Table A3.3). The value of the entire affected population is<br />
established by a <strong>for</strong>eign exchange transaction reflected in the sum of the value of every person to<br />
improve the environment. The service transfer method cannot be considered as an evaluation<br />
method in itself, but rather as a fast and inexpensive alternative <strong>for</strong> data transfer over the existing<br />
value.<br />
TUNISIA - DEGRADATION COST OF WATER RESOURCES OF THE MEDJERDA BASIN 79
Sustainable Water Integrated Management (<strong>SWIM</strong>) - Support Mechanism<br />
Project funded by the <strong>European</strong> Union<br />
13. ANNEX IV SPECIFIC METHODS FOR THE EVALUATION OF THE<br />
COSTS OF DEGRADATION FOR THE WASTE CATEGORY<br />
Collection cost in rural areas. The cost of collection in rural areas <strong>for</strong> 1.6 million people in the<br />
Medjerda basin is equivalent to 1% of their revenue of 10,000 DT per household per year 61 ranging<br />
from 5,000 to 15,000 dinars per household.There<strong>for</strong>e, the degradation cost <strong>for</strong> non-collection is<br />
equivalent to 26.8 million DT in 2010.<br />
Cost of cleaning the waste discharged into unregulated dumps. The population considered is the<br />
peri-urban population of some towns and rural population reaching 2.2 million with 0.58 kg 62<br />
generated per capita per day with a range of 0.30 to 0.65 kg.<br />
The following assumptions are used:<br />
• The depth of the landfill is 1 meter on average.<br />
• The average density of waste dumped is 340 kg/m³.<br />
• Reducing the volume through the wildfires in landfills is 2/3 leaving a balance of 1/3.<br />
The total municipal waste uncollected in 2010 was 340,006 tons. These wastes have the potential to<br />
pollute 333,339 m 2 = (1.6 million * 365 * 0.58 kg) * 1/3 * 1/340. To clean the unregulated dumps, 32<br />
DT per m 3 per ton (1 m 2 per 1 m depth) was adopted. 63 The cost of cleaning amounts to 11.2 million<br />
DT in 2010 with a variation from 6 to 13 million DT.<br />
Table A4.1: Potentially recyclable waste in the Medjerda, 2010<br />
Population<br />
Generat<br />
ed<br />
waste<br />
Generate<br />
d waste Metals Glass<br />
Paper/ca<br />
rton Plastics Textile Compost<br />
# Kg/day Tons/year 1.4% 0.6% 4.1% 5.5% 7.0% 20%<br />
Population urban 393,716 0.75 107,780 1,509 647 4,419 5,928 7,545 21,556<br />
Population periurban<br />
and town 86,020 0.58 18,210 255 109 747 1,002 1,275 3,642<br />
Population rural 1,606,074 0.58 340,006 4,760 2,040 13,940 18,700 23,800 68,001<br />
Total 2,085,810 465,996 6,524 2,796 19,106 25,630 32,620 93,199<br />
Products recycled 600<br />
Products Recyclable<br />
net 6,524 2,796 19,106 25,030 32,620 93,199<br />
Cost/ton (DT/ton) 117.6 19.9 32.4 65.9 26.1 39.2<br />
Degradation cost 767,045 55,756 619,121 1,649,346 851,947 3,657,780<br />
Degradation cost total 7,600,995<br />
Minimum 5,320,697<br />
Maximum 8,361,095<br />
61 GIZ (2011).<br />
62 Ibid.<br />
63 Bassi et al. (2011).<br />
TUNISIA - DEGRADATION COST OF WATER RESOURCES OF THE MEDJERDA BASIN 80
Sustainable Water Integrated Management (<strong>SWIM</strong>) - Support Mechanism<br />
Project funded by the <strong>European</strong> Union<br />
Source : GIZ (2011) ; Bassi et al. (2011) ; and Authors.<br />
Recycling. Waste management in Tunisia has developed <strong>for</strong>mal and in<strong>for</strong>mal systems <strong>for</strong> the<br />
recovery of materials with high impacts on the volume and weight of municipal waste <strong>for</strong> collection<br />
and final disposal. Innovative methods of recycling have been developed such as ECO-Lef, which<br />
organizes the collection and recycling of plastics at the local level, and contributes to the creation of<br />
jobs and income. ECO-Lef deals only with plastics and has developed its activities almost exclusively<br />
in the governorate of Beja with approximately 600 tons of plastics collected in 2010. The results are<br />
shown in Table A4.1 and the degradation cost amounts to 7.6 million DT in 2010 with a variation<br />
from 5.3 to 8.4 million DT.<br />
Electricity production with biomass. The Medjerda basin is oriented towards the major cereal crops<br />
and livestock. Agricultural waste, with waste from livestock estimated at 1.6 million tons, 0.3 million<br />
from prunings and 0.27 tons from cereal crops. In the GIZ report (2011). The electric potential<br />
achievable by the anaerobic digestion of agricultural biomass in the basin of Medjerda was calculated<br />
and is 71 MW of installed capacity with an annual production of 462,329 million kilowatts/h. Waste<br />
generated by the food industry may also represent an electrical potential of 10 MW or 65,116,761<br />
kilowatts/h. This is equivalent to 51.1 and 7.0 million DT respectively atthe average rate of 0.1105 DT<br />
per kW/h. However, only 10% and 1% respectively of the amounts generated can be mobilized being<br />
the equivalent to 5.1 and 0.05 million DT in 2010 respectively.<br />
Depreciation of land surrounding landfills.The hedonic cost methodology was used to derive the<br />
cost of depreciation of land surrounding the landfills. 64 Landfills have been studied in the <strong>for</strong>m of a<br />
circle to derive the first ring and the second ring: ± 15% reduction in land prices in a circumference<br />
up to 30 m around the landfill, and ± 10% reduction in land prices in a circumference of 30 to 100 m<br />
around the landfill. Apartments and buildings were not considered, or higher impairment could be<br />
calculated. No distinction was made between semi-controlled and unregulated landfills in the basin<br />
of Medjerda. The smallest surface area listed by GIZ (2011) was assigned to landfills listed without<br />
surface area. The results are shown in Table A4.2.<br />
Lost electricity production and GHG emitted as a result of non-capture of methane in future. The<br />
generation of solid waste in the basin of Medjerda reaches 465,996 tons. Within 3 years, 10% of the<br />
potential generation of methane could be captured and used to generate electricity. Thus, out of a<br />
potential of 67 million m 3 of methane, 3 million m 3 could be captured. Only one year has been<br />
considered in the future <strong>for</strong> the sake of simplification while the flow capture may extend over several<br />
years. The production of electricity that can be generated is 31.1 million kW/h using the following<br />
<strong>for</strong>mula: 1 m 3 CH 4 = 9.8 kW/h at 100% efficiency. The monetary equivalent is 3.3 million DT when the<br />
NPV is calculated using a discount rate of 5% with an average rate of 0.1105 DT per kW/h to consider<br />
these lost benefits at the present time. The emission of methane that could be avoided within 3<br />
years is equivalent to 2,185 tons, equivalent to 54,617 tons of CO 2 equiv. The monetary equivalent is<br />
1 million DT when the NPV is calculated using a discount rate of 5%.<br />
64 Nelson (1978).<br />
TUNISIA - DEGRADATION COST OF WATER RESOURCES OF THE MEDJERDA BASIN 81
Sustainable Water Integrated Management (<strong>SWIM</strong>) - Support Mechanism<br />
Project funded by the <strong>European</strong> Union<br />
TUNISIA - DEGRADATION COST OF WATER RESOURCES OF THE MEDJERDA BASIN 82
Sustainable Water Integrated Management (<strong>SWIM</strong>) - Support Mechanism<br />
Project funded by the <strong>European</strong> Union<br />
Table A4.2: Hedonic evaluation of land around the landfills, 2010<br />
Landfill Type Surface<br />
area<br />
D 2 =S/Pi/4<br />
Original<br />
diametre<br />
Original<br />
radius<br />
Radius<br />
30 m<br />
Radius<br />
100 m<br />
Surface<br />
area 30 m<br />
Surface<br />
area 100<br />
m<br />
Losses<br />
30 m<br />
Losses<br />
100 m<br />
Land<br />
price<br />
Losses 30 m<br />
15% of the<br />
price<br />
Losses 100 m<br />
10% of the<br />
price<br />
m 2 m m m m m 2 m 2 m 2 m 2 DT/m 2 DT DT<br />
Beja Controlled 30,000 38,197 195 98 128 167 51,247 87,323 21,247 36,076 30 (20-40) 95,613 108,227<br />
Maagoula Controlled 5,000 6,366 80 40 70 109 15,347 37,253 10,347 21,906 30 (20-40) 46,563 65,717<br />
Mejez el Bab Controlled 25,000 31,831 178 89 119 158 44,642 78,632 19,642 33,989 30 (20-40) 88,391 101,967<br />
Jendouba Controlled 30,000 38,197 195 98 128 167 51,247 87,323 21,247 36,076 30 (20-40) 95,613 108,227<br />
Boussalem Controlled 5,000 6,366 80 40 70 109 15,347 37,253 10,347 21,906 30 (20-40) 46,563 65,717<br />
Tabarka Controlled 300,000 381,972 618 309 339 378 361,076 448,929 61,076 87,853 30 (20-40) 274,843 263,559<br />
Siliana Controlled 18,000 22,918 151 76 106 145 35,095 65,773 17,095 30,678 30 (20-40) 76,929 92,034<br />
Goubellat Unregulated 15,000 19,099 138 69 99 138 30,852 59,914 15,852 29,062 30 (20-40) 71,335 87,186<br />
Teboursouk Unregulated 50,000 63,662 252 126 156 195 76,607 119,651 26,607 43,044 30 (20-40) 119,733 129,131<br />
ZahretMedien Unregulated 30,000 38,197 195 98 128 167 51,247 87,323 21,247 36,076 30 (20-40) 95,613 108,227<br />
Ben Metir Unregulated 5,000 6,366 80 40 70 109 15,347 37,253 10,347 21,906 30 (20-40) 46,563 65,717<br />
Ghardimaou Unregulated 30,000 38,197 195 98 128 167 51,247 87,323 21,247 36,076 30 (20-40) 95,613 108,227<br />
OuedMeliz Unregulated 5,000 6,366 80 40 70 109 15,347 37,253 10,347 21,906 30 (20-40) 46,563 65,717<br />
Dahmani Unregulated 5,000 6,366 80 40 70 109 15,347 37,253 10,347 21,906 30 (20-40) 46,563 65,717<br />
Jerissa Unregulated 40,000 50,930 226 113 143 182 64,097 103,877 24,097 39,780 30 (20-40) 108,436 119,340<br />
KalaatKashba Unregulated 20,000 25,465 160 80 110 149 37,867 69,549 17,867 31,681 30 (20-40) 80,402 95,044<br />
KalaatSenan Unregulated 15,000 19,099 138 69 99 138 30,852 59,914 15,852 29,062 30 (20-40) 71,335 87,186<br />
Ksour Unregulated 20,000 25,465 160 80 110 149 37,867 69,549 17,867 31,681 30 (20-40) 80,402 95,044<br />
Nabeur Unregulated 2,500 3,183 56 28 58 97 10,645 29,687 8,145 19,042 30 (20-40) 36,652 57,127<br />
Sakiet S Youssef Unregulated 30,000 38,197 195 98 128 167 51,247 87,323 21,247 36,076 30 (20-40) 95,613 108,227<br />
Sers Unregulated 27,000 34,377 185 93 123 162 47,302 82,149 20,302 34,847 30 (20-40) 91,359 104,540<br />
Tajerouine Unregulated 30,000 38,197 195 98 128 167 51,247 87,323 21,247 36,076 30 (20-40) 95,613 108,227<br />
Touiref Unregulated 8,000 10,186 101 50 80 119 20,339 44,835 12,339 24,495 30 (20-40) 55,527 73,486<br />
TUNISIA - DEGRADATION COST OF WATER RESOURCES OF THE MEDJERDA BASIN 83
Sustainable Water Integrated Management (<strong>SWIM</strong>) - Support Mechanism<br />
Project funded by the <strong>European</strong> Union<br />
Landfill Type Surface<br />
area<br />
D 2 =S/Pi/4<br />
Original<br />
diametre<br />
Original<br />
radius<br />
Radius<br />
30 m<br />
Radius<br />
100 m<br />
Surface<br />
area 30 m<br />
Surface<br />
area 100<br />
m<br />
Losses<br />
30 m<br />
Losses<br />
100 m<br />
Land<br />
price<br />
Losses 30 m<br />
15% of the<br />
price<br />
Losses 100 m<br />
10% of the<br />
price<br />
m 2 m m m m m 2 m 2 m 2 m 2 DT/m 2 DT DT<br />
Aroussa Unregulated 10,000 12,732 113 56 86 125 23,462 49,417 13,462 25,955 30 (20-40) 60,580 77,864<br />
Bargou Unregulated 25,000 31,831 178 89 119 158 44,642 78,632 19,642 33,989 30 (20-40) 88,391 101,967<br />
Bouarada Unregulated 30,000 38,197 195 98 128 167 51,247 87,323 21,247 36,076 30 (20-40) 95,613 108,227<br />
Gaafour Unregulated 20,000 25,465 160 80 110 149 37,867 69,549 17,867 31,681 30 (20-40) 80,402 95,044<br />
Le Krib Unregulated 20,000 25,465 160 80 110 149 37,867 69,549 17,867 31,681 30 (20-40) 80,402 95,044<br />
Makhtar Unregulated 20,000 25,465 160 80 110 149 37,867 69,549 17,867 31,681 30 (20-40) 80,402 95,044<br />
Rouhia Unregulated 15,000 19,099 138 69 99 138 30,852 59,914 15,852 29,062 30 (20-40) 71,335 87,186<br />
SidiBouRouis Unregulated 12,000 15,279 124 62 92 131 26,477 53,752 14,477 27,274 30 (20-40) 65,147 81,823<br />
Presumed<br />
Nefza<br />
unregulated<br />
5,000 6,366 80 40 70 109 15,347 37,253 10,347 21,906 30 (20-40) 46,563 65,717<br />
Presumed<br />
Testour<br />
unregulated<br />
5,000 6,366 80 40 70 109 15,347 37,253 10,347 21,906 30 (20-40) 46,563 65,717<br />
Presumed<br />
Ain Draham unregulated<br />
5,000 6,366 80 40 70 109 15,347 37,253 10,347 21,906 30 (20-40) 46,563 65,717<br />
Presumed<br />
Fernana<br />
unregulated<br />
5,000 6,366 80 40 70 109 15,347 37,253 10,347 21,906 30 (20-40) 46,563 65,717<br />
Presumed<br />
El Kef<br />
unregulated<br />
30,000 38,197 195 98 128 167 51,247 87,323 21,247 36,076 30 (20-40) 95,613 108,227<br />
Presumed<br />
Menzel Salem unregulated<br />
5,000 6,366 80 40 70 109 15,347 37,253 10,347 21,906 30 (20-40) 46,563 65,717<br />
Presumed<br />
Kesra<br />
unregulated<br />
5,000 6,366 80 40 70 109 15,347 37,253 10,347 21,906 30 (20-40) 46,563 65,717<br />
Sub-total 2,959,102 3,528,314<br />
Total 6,487,415<br />
Minimum at 20 DT per m 2 4,324,944<br />
Maximum at 40 DT per m 2 8,649,887<br />
TUNISIA - DEGRADATION COST OF WATER RESOURCES OF THE MEDJERDA BASIN 84
Sustainable Water Integrated Management (<strong>SWIM</strong>) - Support Mechanism<br />
Project funded by the <strong>European</strong> Union<br />
Source : Nelson (1978) ; Bassi et al. (2011) ; GIZ (2011) ; ImmoTunisie website : ; and Authors.<br />
TUNISIA - DEGRADATION COST OF WATER RESOURCES OF THE MEDJERDA BASIN 85
Sustainable Water Integrated Management (<strong>SWIM</strong>) - Support Mechanism<br />
Project funded by the <strong>European</strong> Union<br />
14. ANNEX V RESTORATION RESULTS<br />
Benefits associated with access to improved sanitation and drinking water are shown in Table A5.1.<br />
Capacity, unit costs and investments required <strong>for</strong> the waste chain after collection are shown in Tables<br />
A5.2 to A5.4.<br />
Table A5.1: Benefits associated with access to drinking water and sanitation, 2010<br />
Medjerda rural population 2010 Diarrhoea<br />
reduction<br />
Diarrhoeacaused<br />
mortality<br />
reduction<br />
Reduction of<br />
diarrhoea<br />
cases<br />
Value<br />
per<br />
case<br />
Gains in 2010<br />
# million DT Million DT<br />
No access to sanitation (million) 0.266<br />
Birth rate<br />
15.1 0.500 9 378,643 3.3<br />
(Number of newborns per 1000 inhabitants)<br />
Population < 5 years (million) 0.025 1.25 0.03 45.0 1.4<br />
Population ≥ 5 years (million) 0.241 0.250 0.06 21.2 1.3<br />
Sub-Total 6.0<br />
No access to water and sanitation (million) 0.250<br />
Birth rate<br />
15.1 0.600 10 378,643 3.8<br />
(Number of newborns per 1000 inhabitants)<br />
Population < 5 years (million) 0.025 1.50 0.04 45 1.7<br />
Population ≥ 5 years (million) 0.225 0.300 0.07 21 1.4<br />
Sub-Total 6.9<br />
Total 12.9<br />
Sources: adaptedfrom de Bassi et al. (2011); World Development Indicators (2011); Tunisian Annual Statistics<br />
2006-2010 (2011); and Authors.<br />
Table A5.2: Capacity required after waste collection <strong>for</strong> the North-West governorates, 2010-2034<br />
Capacity of<br />
transfer<br />
stations<br />
Distance<br />
Capacity of<br />
segregation<br />
stations<br />
Surface<br />
area<br />
Recycling, composting and/or landfills<br />
Scenario1<br />
15% R - 15% C<br />
Scenario 2<br />
10% R - 10% C<br />
Scenario 3<br />
0% R- 0% C<br />
Ton/d km Ton/d km 2<br />
Beja 165 40-60 200 20 90 116 200<br />
Jenjouba 226 40-60 250 20 113 145 250<br />
Le Kef 140 40-60 200 10 90 116 200<br />
Siliana 127 40-60 180 10 81 104 180<br />
Total 658 830 374 481 830<br />
Source: GIZ (2011); and Authors.<br />
Table A5.3: Unit cost <strong>for</strong> the waste chain of the North-West governorates<br />
Transfer<br />
station<br />
capacity<br />
Transport<br />
Capacity of<br />
segregation<br />
stations<br />
Recycling, composting and/or landfills<br />
Surface Scenario1 Scenario 2 Scenario 3<br />
area 15% R - 15% C 10% R - 10% C 0% R- 0% C<br />
DT/ton/d DT/km/ton DT/ton/d km 2 DT/Ton/d DT/Ton/j DT/Ton/d<br />
Beja 35,000 0.2 82,069 50 141,425 100,000 10,000<br />
Jenjouba 35,000 0.2 82,069 50 141,425 100,000 10,000<br />
Le Kef 35,000 0.2 82,069 40 141,425 100,000 10,000<br />
TUNISIA - DEGRADATION COST OF WATER RESOURCES OF THE<br />
MEDJERDA BASIN<br />
86
Sustainable Water Integrated Management (<strong>SWIM</strong>) - Support Mechanism<br />
Project funded by the <strong>European</strong> Union<br />
Siliana 35,000 0.2 82,069 40 141,425 100,000 10,000<br />
Source: GIZ (2011); and Authors.<br />
Table A5.4: Investments <strong>for</strong> the waste chain of the North-West governorates<br />
Governorate<br />
Cost of<br />
transfer<br />
stations<br />
Million DT<br />
Cost of<br />
transports<br />
Cost of<br />
segregation<br />
stations<br />
Cost of recycling, composting and<br />
landfills<br />
Total cost of investment without<br />
transport<br />
Scenario1 Scenario 2 Scenario 3 Scenario1 Scenario 2 Scenario 3<br />
15% r - 40% 12% r - 30% 0% r- 0% c 15% r - 15% 10% r - 10% 0% r- 0%<br />
Million Million DT Million<br />
DT<br />
DT<br />
Million DT Million DT Million DT Million DT Million<br />
DT<br />
Beja 8 1.8 16 13 12 3 37 36 27<br />
Jenjouba 11 2.5 21 16 15 3 47 46 35<br />
LeKef 7 1.5 16 13 12 3 36 35 26<br />
Siliana 6 1.4 15 11 10 2 32 31 23<br />
Total 32 7.2 68 53 48 11 153 148 111<br />
Source: GIZ (2011); and Authors.<br />
TUNISIA - DEGRADATION COST OF WATER RESOURCES OF THE<br />
MEDJERDA BASIN<br />
87
Sustainable Water Integrated Management (<strong>SWIM</strong>) - Support Mechanism<br />
Project funded by the <strong>European</strong> Union<br />
15. ANNEX VI DISAGGREGATED RESULTS OF DEGRADATION AND<br />
RESTORATION COSTS<br />
Table A6.1: Disaggregated results on degradation cost<br />
Category Medjerda Greater Tunis Total<br />
Degradatio<br />
n cost<br />
Million DT<br />
% Minimum<br />
Million<br />
DT<br />
Maximum<br />
Million DT<br />
Degradatio<br />
n cost<br />
Million DT<br />
Minimum<br />
Million<br />
DT<br />
Maximum<br />
Million DT<br />
Degradation<br />
cost<br />
Million DT<br />
Water 129.5 68% 99.1 164.5 22.3 17.5 28.1 151.8<br />
Waste 60.5 32% 32.1 131.3 - - - 60.5<br />
Biodiversity 0.5 0% 0.4 - - - - 0.5<br />
Environmentgeneral 1.1 1% - - - - - 1.1<br />
Total 191.5 100% 131.6 295.8 22.3 17.5 28.1 213.9<br />
% du GDP 3.3% 2.3% 5.1% 0.34%<br />
Water 2.2% 1.7% 2.8% 0.2%<br />
Waste 1.0% 0.6% 2.3% 0.1%<br />
Biodiversity 0.0% 0.0% 0.0% 0.0%<br />
Environmentgeneral 0.0% 0.0% 0.0% 0.0%<br />
Total 3.3% 2.3% 5.1% 0.34%<br />
WATER 129.5 67.6% 99.1 164.5 22.3 17.5 28.1<br />
Quality of drinking<br />
water 8.8 4.6% 5.8 11.7 10.6 7.1 14.1 47.4%<br />
Waterborne diseases 81.3 42.5% 68.2 94.4<br />
Distribution 1.5 0.8% 1.3 1.8 6.1 5.2 7.0 27.3%<br />
Quality of water<br />
resources 5.6 2.9% 5.3 6.9 5.6 5.3 6.9 25.2%<br />
Quantity 4.8 2.5% 4.3 5.3<br />
Salinity 12.3 6.4% 9.9 14.8<br />
Erosion 7.4 3.9% 3.7 14.8<br />
Storage 7.1 3.7% 0.1 14.1<br />
Hydroelectricity 0.7 0.3% 0.5 0.8<br />
WASTE 60.5 31.6% 32.1 131.3<br />
Collection 26.8 14.0% 13.4 40.2<br />
Cleaning 11.2 5.9% 5.8 12.6<br />
Recycling 7.6 4.0% 5.3 8.4<br />
Biomass 5.2 2.7% - 58.3<br />
Land depreciation 6.5 3.4% 4.3 8.6<br />
Energy 3.3 1.7% 3.2 3.3<br />
BIODIVERSITY 0.5 0.2% 0.4 ≥0<br />
Wetlands 0.5 0.2% 0.4 ≥0<br />
NATURAL DISASTER<br />
AND GENERAL<br />
ENVIRONMENT 1.1 0.6%<br />
Natural disaster 0.0 0.0% 0.0 0.0<br />
General environment 1.1 0.6% 1.1 2.3<br />
TUNISIA - DEGRADATION COST OF WATER RESOURCES OF THE<br />
MEDJERDA BASIN<br />
88
Sustainable Water Integrated Management (<strong>SWIM</strong>) - Support Mechanism<br />
Project funded by the <strong>European</strong> Union<br />
Category Medjerda Greater Tunis Total<br />
Degradatio<br />
n cost<br />
Million DT<br />
% Minimum<br />
Million<br />
DT<br />
Maximum<br />
Million DT<br />
Degradatio<br />
n cost<br />
Million DT<br />
Minimum<br />
Million<br />
DT<br />
Maximum<br />
Million DT<br />
Degradation<br />
cost<br />
Million DT<br />
Hydroelectricity 0.1 0.1% 0.1 1.3<br />
Landfills 1.0 0.5% 1.0 1.0<br />
Source: Authors.<br />
TUNISIA - DEGRADATION COST OF WATER RESOURCES OF THE<br />
MEDJERDA BASIN<br />
89