Shinano-gawa
Shinano-gawa
Shinano-gawa

Create successful ePaper yourself
Turn your PDF publications into a flip-book with our unique Google optimized e-Paper software.
Japan 10<br />
<strong>Shinano</strong>-<strong>gawa</strong><br />
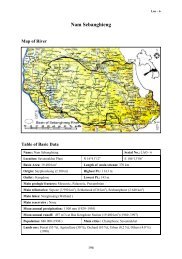
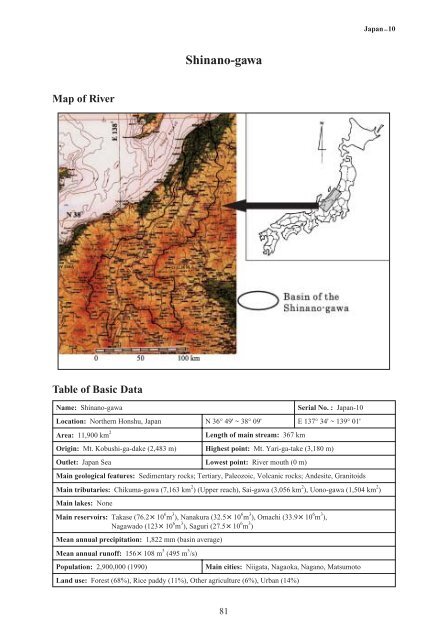
Map of River<br />
Table of Basic Data<br />
Name: <strong>Shinano</strong>-<strong>gawa</strong><br />
Location: Northern Honshu, Japan<br />
Area: 11,900 km 2<br />
N 36° 49' ~ 38° 09'<br />
Length of main stream: 367 km<br />
Serial No. : Japan-10<br />
E 137° 34' ~ 139° 01'<br />
Origin: Mt. Kobushi-ga-dake (2,483 m) Highest point: Mt. Yari-ga-take (3,180 m)<br />
Outlet: Japan Sea<br />
Lowest point: River mouth (0 m)<br />
Main geological features: Sedimentary rocks; Tertiary, Paleozoic, Volcanic rocks; Andesite, Granitoids<br />
Main tributaries: Chikuma-<strong>gawa</strong> (7,163 km 2 ) (Upper reach), Sai-<strong>gawa</strong> (3,056 km 2 ), Uono-<strong>gawa</strong> (1,504 km 2 )<br />
Main lakes: None<br />
Main reservoirs: Takase (76.210 6 m 3 ), Nanakura (32.510 6 m 3 ), Omachi (33.910 6 m 3 ),<br />
Na<strong>gawa</strong>do (12310 6 m 3 ), Saguri (27.510 6 m 3 )<br />
Mean annual precipitation: 1,822 mm (basin average)<br />
Mean annual runoff: 156108 m 3 (495 m 3 /s)<br />
Population: 2,900,000 (1990)<br />
Main cities: Niigata, Nagaoka, Nagano, Matsumoto<br />
Land use: Forest (68%), Rice paddy (11%), Other agriculture (6%), Urban (14%)<br />
81
Japan 10<br />
1. General Description<br />
The <strong>Shinano</strong>-<strong>gawa</strong> is one of the largest rivers in Japan. It has a catchment area of 11,900 km 2 , the third<br />
largest in Japan, and a length of 367 km, the longest in Japan. It is called the “Chikuma-<strong>gawa</strong>” in<br />
Nagano Prefecture and “<strong>Shinano</strong>-<strong>gawa</strong>” in Niigata Prefecture. The Chikuma-<strong>gawa</strong> originates from Mt.<br />
Kobushi-ga-take (2,475 m), flows north through the Saku basin and joins the Sai-<strong>gawa</strong> originating from<br />
Mt. Yari-ga-take (3,180 m) at Nagano City, and then turns northeast into the Niigata Prefecture through<br />
the Zenkouji basin. The Chikuma-<strong>gawa</strong>’s course is 214 km long, and it drains an area of 7,163 km 2 . In<br />
Niigata Prefecture its name changes to “<strong>Shinano</strong>-<strong>gawa</strong>”, and it flows northeast across the Echigo plain,<br />
one of the best rice producing districts in Japan, before joining the right tributary of the Uono-<strong>gawa</strong> at<br />
Kawaguchi. It finally discharges to Sea of Japan at Niigata City. The population in the basin is about<br />
2,900,000.<br />
The spatial distribution of precipitation in the basin is complex. The middle part of the Chikuma-<strong>gawa</strong><br />
and the middle and lower part of the Sai-<strong>gawa</strong> are some of the lowest precipitation areas of Japan with<br />
annual precipitation of about 1,000 mm. In contrast, the annual precipitation over the upper part of the<br />
Sai-<strong>gawa</strong>, and the upper and lower parts of the Chikuma-<strong>gawa</strong>, are 1,600-3,000 mm, 1,000-1,400 mm<br />
and 1,400-1,800 mm respectively. The central part of Niigata Prefecture, especially in the mountains, is<br />
one of the heavy snow regions of Japan. Sometimes, more than a metre depth of snow can fall during a<br />
night. The annual precipitation is from 2,200 to 3,000 mm, 40-50% of which is snowfall. The mean<br />
annual precipitation of the basin is about 1,800 mm, almost equal to the mean annual precipitation of<br />
Japan.<br />
Floods in the <strong>Shinano</strong>-<strong>gawa</strong> are caused mainly by frontal rain in early summer (Japan’s rainy season,<br />
Baiu), typhoons that hit Japan in summer to autumn, and snowmelt in spring. The <strong>Shinano</strong>-<strong>gawa</strong> has<br />
high-flows from March to September and is considered to be the best water resource in Japan<br />
2. Geographical Information<br />
2.1 Geological Map<br />
82
Japan 10<br />
2.2 Land Use Map<br />
2.3 Characteristics of River and Main Tributaries<br />
No.<br />
1<br />
2<br />
3<br />
4<br />
Name of river<br />
<strong>Shinano</strong><br />
(Main river)<br />
Chikuma<br />
(Upper reach)<br />
Sai<br />
(Tributary)<br />
Uono<br />
(Tributary)<br />
Length [km]<br />
Catchment area<br />
[km 2 ]<br />
367<br />
11,900<br />
214<br />
7,163<br />
161<br />
68<br />
1,504<br />
Highest peak [m]<br />
Lowest point [m]<br />
Mt. Yari-ga-take 3,180<br />
River mouse 0<br />
Mt. Kobushi-ga-take<br />
2,475<br />
Mt. Yari-ga-take<br />
3,180<br />
Mt. Nakano-dak<br />
2,085<br />
A: Other agricultural field (vegetable, grass) F: Forest L: Lake, River, Marsh O: Orchard<br />
P: Paddy field U: Urban<br />
Cities<br />
Population<br />
Niigata, Nagaoka<br />
2,900,000<br />
Nagano, Ueda<br />
1,500,000<br />
Matumoto<br />
208,972<br />
Koide, Muikamachi<br />
73,530<br />
Land use<br />
F (68%)<br />
P (11%)<br />
A (7%)<br />
U (14%)<br />
83
Japan 10<br />
2.4 Longitudinal Profiles<br />
3. Climatological Information<br />
3.1 Annual Isohyetal Map and Observation Stations<br />
84
Japan 10<br />
3.2 List of Meteorological Observation Stations<br />
No.*<br />
40316<br />
40318<br />
Station<br />
Ohyu<br />
Kamizyo<br />
Elevation<br />
[m]<br />
300<br />
250<br />
40319 Myozin 162<br />
4036521 Kitamaki 1,090<br />
4036520 Koya 845<br />
4036516 Nagakubo<br />
shinmachi<br />
679<br />
4036513 Kakeyu 715<br />
4036522 Niekawa 900.5<br />
4036504 Kinasa 721.5<br />
** Nagano 418<br />
** Niigata 2<br />
Location<br />
N 37° 10' 36"<br />
E 139° 05' 24"<br />
N 37° 20' 54"<br />
E 139° 03' 00"<br />
N 37° 12' 07"<br />
E 138° 52' 36"<br />
N 36° 03' 16"<br />
E 138° 29' 04"<br />
N 36 07' 24"<br />
E 138 34' 18"<br />
N 36° 14' 58"<br />
E 138° 16' 42"<br />
N 36° 18' 02"<br />
E 138° 08' 30"<br />
N 36° 00' 29"<br />
E 137° 51' 38"<br />
N 36° 40' 48"<br />
E 138° 00' 28"<br />
N 36° 39' 06"<br />
E 138° 11' 07"<br />
Observation<br />
period<br />
1954 - present<br />
1974 - present<br />
Mean annual<br />
precipitation 1)<br />
[mm]<br />
2,737.8<br />
2,725.2<br />
Mean annual<br />
evaporation<br />
N<br />
N<br />
Observation<br />
items 2)<br />
1955 - present 2,699.0 N P<br />
1951 - present 1,047.8 N P<br />
1955 - present 1,125.2 N P<br />
1954 - present 1,004.1 N P<br />
1955 - present 1,236.6 N P<br />
1954 - present 1,724.4 N P<br />
1952 - present 1,427.6 N P<br />
1889 - present 981 N DS, P, SR<br />
N 37° 54' 30"<br />
E 139° 03' 00" 1886 - present 1,804 1,110.2<br />
(1880 - 1950)<br />
* Serial number used by River Bureau, Ministry of Land, Infrastructure and Transportation.<br />
** Meteorological Obsevatory, Japan Meteorological Agency.<br />
1) Period of the mean is from the beginning of the observation to present.<br />
2) P: Precipitation DS: Duration of sunshne SR: Solar radiation<br />
P<br />
P<br />
DS, P, SR<br />
3.3 Monthly Climate Data<br />
Observation<br />
item<br />
Temperature<br />
[°C]<br />
Precipitation<br />
[mm]<br />
Evaporation<br />
[mm]<br />
Solar radiation<br />
[MJ/m 2 /d]<br />
Duration of<br />
sunshine [hr]<br />
Observation<br />
station<br />
Jan Feb Mar Apr May Jun Jul Aug Sep Oct Nov Dec Annual<br />
Period for<br />
the mean<br />
Niigata 2.6 2.5 5.4 11.2 16.1 20.4 24.5 26.2 22.0 16.0 10.2 5.3 13.5 1971 - 2000<br />
Niigata 180.3 128.0 104.6 93.6 103.3 128.3 178.2 142.7 163.0 148.9 200.6 204.4 1,775.8 1971 - 2000<br />
Niigata 32.9 37.7 62.2 97.5 126.2 136.3 156.8 179.2 117.8 81.1 52.1 36.5 1,110.2 1888 - 1950<br />
Niigata 5.1 7.7 11.3 15.7 18.0 17.1 17.2 17.3 12.6 9.9 6.1 4.4 11.8 1971 - 2000<br />
Niigata 56.1 72.9 130.9 181.9 204.8 168.1 182.7 214.8 146.4 142.8 90.0 59.4 137.6 1971 - 2000<br />
85
Japan 10<br />
3.4 Long-term Variation of Monthly Precipitation<br />
4. Hydrological Information<br />
4.1 Map of Streamflow Observation Stations<br />
86
Japan 10<br />
4.2 List of Hydrological Observation Stations<br />
No.*<br />
Station<br />
Location<br />
Catchment area (A)<br />
[km 2 ]<br />
Observation<br />
period<br />
Observation items 1)<br />
(frequency)<br />
40316 Odiya<br />
45 km<br />
9,719<br />
1942 - present<br />
Q (h)<br />
402037 Tategahana 155.3 km 6,442.3 1975 - present Q (h)<br />
4036503 Ikuta 212.1 km 2,036.4 1975 - present Q (h)<br />
4036508 Kuisege 186.4 km 2,595.9 1949 - present Q (h)<br />
4036516 Koichi 9.0 km** 2,773.0 1953 - present Q (h)<br />
No.*<br />
Q<br />
2)<br />
[m 3 /s]<br />
Qmax 3)<br />
[m 3 /s]<br />
Qmax<br />
4)<br />
[m 3 /s]<br />
Qmin<br />
5)<br />
[m 3 /s]<br />
Q/A<br />
[m 3 /s/100km 2 ]<br />
Qmax/A<br />
[m 3 /s/100km 2 ]<br />
Period of<br />
statistics<br />
40316 503 9,638 3,776 91 5.18 99 1951 - 1999<br />
402037 232 7, 440 2,485 94 3.60 115.49 1975 - 1999<br />
4036503 53.65 1,361.6 1,092.6 17.51 2.63 66.86 1975 - 1999<br />
4036508 61.93 1,529.4 1,288.0 15.25 2.39 58.92 1949 - 1999<br />
4036516 124.33 1,067.8 1,368.6 37.93 4.48 38.50 1953 - 1999<br />
* Serial Number used by The River Bureau, Ministry of Land, Infrastructure and Transportation<br />
** Distance from the confluence of the Chikuma river<br />
1) Q(h): Discharge and Water level 2) Mean annual discharge 3) Maximum discharge 4) Mean maximum discharge<br />
5) Mean minimum discharge<br />
4.3 Long-term Variation of Monthly Discharge<br />
87
Japan 10<br />
4.4 Annual Pattern of Discharge<br />
88
Japan 10<br />
4.5 Unique Hydrological Features<br />
In ancient times, the present Echigo Plain was a giant estuary-like lake and was slowly filled with<br />
sedimentary deposits carried down by the <strong>Shinano</strong>-<strong>gawa</strong>, to form marshy, low-lying land. As it was<br />
marshy, once flooding occurred, water overflowed from the river and washed away houses and fields,<br />
and caused loss of life. In 1716, Kazuemon Honma first petitioned the government to construct the<br />
Ohkouzu diversion channel. It was to be requested again and again in the course of the following 200<br />
years, until finally it was approved with construction beginning in 1909. The construction was<br />
completed some 22 years after it began in 1931. The diversion channel, approximately 10 km long,<br />
diverts the flood waters of the <strong>Shinano</strong>-<strong>gawa</strong> into the Sea of Japan. Before the construction of the<br />
diversion channel, major floods occurred on average every 3 or 4 years. But after the completion of the<br />
channel, there has been very little damage and as a result, the Echigo Plain has been developing rapidly.<br />
Myoken Weir was constructed in 1989 just upstream at Nagaoka City, where the <strong>Shinano</strong>-<strong>gawa</strong> pours<br />
onto the flood plain of the Nagaoka-Niigata area. The weir length is 524 m and 8 motor-controlled<br />
gates are installed. One of them is used for flushing sediment. Upstream of the weir the maximum<br />
control volume that can be stored is 1,100,000 m 3 . The weir has three functions: one is to protect the<br />
river bed from excessive erosion, the second is to stabilize the flow upstream of the weir which shows a<br />
diurnal fluctuation due to the operation of the <strong>Shinano</strong>-<strong>gawa</strong> (Odiya) Hydropower Plant just upstream<br />
of the weir, and the third is to support the planned bridge carrying the national highway.<br />
The Sekiya Diversion Channel is located on the western margin of central Niigata City. Although the<br />
Sekiya Diversion Channel was planned in the Edo era, the construction of the channel was not started<br />
until 1968, and was completed in 1973. The channel length is 1.8 km and it is 240-280 m wide. It has<br />
both flood control and water usage functions. It protects Niigata City, the largest seaside city on the<br />
Japan Sea, against flooding by the <strong>Shinano</strong>-<strong>gawa</strong>, and it prevents saltwater intrusion of the estuary.<br />
Moreover, it protects the Niigata coast from erosion and the Niigata-Nishi port against sedimentation.<br />
4.6 Annual Maximum and Minimum Discharges<br />
Chikuma-<strong>gawa</strong> at Tategahana [6,442.3 km 2 ]<br />
Year<br />
Maximum 1)<br />
Date [m 3 /s]<br />
Minimum 2)<br />
Month [m 3 /s]<br />
1984 5/2 1,261.35 1/30 83.71 1992 7/18 984.08 9/18 111.01<br />
1985 7/1 4,238.46 3/7 72.33 1993 9/10 1,934.65 3/21 120.82<br />
1986 7/17 1,108.30 2/23 105.59 1994 9/30 1,342.42 8/18 53.93<br />
1987 3/21 692.42 10/30 44.16 1995 7/12 2,905.71 12/28 81.54<br />
1988 6/4 1,912.44 2/29 56.06 1996 6/26 1,835.30 1/2 76.94<br />
1989 9/20 2,062.76 1/5 120.58 1997 7/18 1,172.46 11/11 97.62<br />
1990 9/20 1,401.36 7/29 44.64 1998 9/16 2,998.18 12/29 115.93<br />
1991 9/19 2,524.96 2/9 144.99 1999 8/15 4,050.94 1/2 102.08<br />
1), 2) Instantaneous observation by recording chart<br />
Year<br />
Maximum 1)<br />
Date [m 3 /s]<br />
Minimum 2)<br />
Month [m 3 /s]<br />
89
Japan 10<br />
<strong>Shinano</strong>-<strong>gawa</strong> at Odiya [9,719 km 2 ]<br />
Year<br />
Maximum 1)<br />
Date [m 3 /s]<br />
1980 4/7 2,830 2/27 52 1990 9/20 3,570 8/17 53<br />
1981 8/23 9,640 5/31 61 1991 8/31 3,230 12/8 50<br />
1982 9/13 9,300 7/4 45 1992 6/21 2,090 8/20 23<br />
1983 9/29 7,810 2/24 81 1993 5/14 3,100 1/25 80<br />
1984 5/2 4,160 8/22 76 1994 4/13 2,010 2/6 74<br />
1985 7/1 7,200 1/28 85 1995 7/12 4,700 2/26 61<br />
1986 9/3 2,560 8/30 87 1996 6/26 2,360 8/15 76<br />
1987 3/25 2,160 10/15 77 1997 4/8 2,790 9/3 88<br />
1988 6/4 2,990 2/23 92 1998 9/16 5,970 2/12 108<br />
1989 9/20 3,180 1/7 146 1999 6/30 4,000 8/3 69<br />
1), 2) Instantaneous observation by recording chart<br />
Minimum 2)<br />
Date [m 3 /s]<br />
Year<br />
Maximum 1)<br />
Date [m 3 /s]<br />
Minimum 2)<br />
Date [m 3 /s]<br />
4.7 Hyetographs and Hydrographs of Major Floods<br />
Rainfall at<br />
Niekawa<br />
Discharge at Odiya<br />
Discharge at Tategahana<br />
90
Japan 10<br />
Rainfall at<br />
Niekawa<br />
Discharge at Odiya<br />
Discharge at Tategahana<br />
5. Water Resources<br />
5.1 General Description<br />
The <strong>Shinano</strong>-<strong>gawa</strong> has the greatest annual discharge, 15410 8 m 3 , of any river in Japan. Development<br />
of this water resource was started before Word War II but greatly increased after the war. A number of<br />
dams for hydropower have been constructed in the Chikuma-<strong>gawa</strong> and upper Sai-<strong>gawa</strong> basins, both of<br />
which have many suitable places for dam construction because of their steep topography, especially in<br />
the Sai-<strong>gawa</strong> basin. Several large hydroelectric power plants have been built by the Tokyo Electric<br />
Company along the Takase-<strong>gawa</strong> in the upper reaches of the Sai-<strong>gawa</strong> near its source, Mt. Yari-ga-take<br />
(3,180 m). The Takase Dam with a height of 176 m is one of the largest dams in the Orient. The Shin-<br />
Takase-<strong>gawa</strong> power plant is located downstream of the Takase Dam and its output is 1,280 MW. The<br />
combined output from the plants in the Takase-<strong>gawa</strong> is 1344.9 MW. The total power produced in all<br />
the basins is 2,618 MW.<br />
Nowadays, water from <strong>Shinano</strong>-<strong>gawa</strong> is fully used not only for hydropower but also for irrigation,<br />
industrial usage and municipal water supply. It irrigates 12,647 ha of agricultural land, and supplies<br />
15.2 m 3 /s of municipal and 15.2 m 3 /s of industrial water.<br />
91
Japan 10<br />
5.2 Map of Water Resources Systems<br />
5.3 List of Major Water Resources Facilities<br />
Major Reservoirs<br />
Name of river<br />
Name of dam<br />
(reservoir)<br />
Catchment<br />
area<br />
[km 2 ]<br />
Gross<br />
capacity<br />
[10 6 m 3 ]<br />
Effective<br />
capacity<br />
[10 6 m 3 ]<br />
Purposes 1)<br />
Year of<br />
completion<br />
Takase Takase 131.0 76.2 16.2 P 1981<br />
Takase Ohmachi 193.0 33.9 28.9 F, N, W, P 1985<br />
Azusa Midono 431.0 15.1 4.0 P 1969<br />
Azusa Na<strong>gawa</strong>do 380.5 123.0 94.0 A,P 1968<br />
Saguri Saguri<strong>gawa</strong> 76.2 27.5 19.8 F, N, P, W 1991<br />
A: Agricultural use F: Flood control N: Maintenance of normal flows P: Hydropower W: Municipal water supply<br />
92
Japan 10<br />
5.4 Major Floods and Droughts<br />
Major Floods at Odiya<br />
Date<br />
(year. month)<br />
Peak discharge<br />
[m 3 /s]<br />
Rainfall<br />
[mm]<br />
Duration<br />
1959.8 5,570 -<br />
Meteorological<br />
cause<br />
Typhoon<br />
No.7<br />
Dead<br />
and<br />
Missing<br />
1969.8 6,110 8.8-8.12 Stationary front 0<br />
1978.6 5,870<br />
1981.8 9,640<br />
1982.9 9,300<br />
1983.9 7,810<br />
1985.7 7,200<br />
1998.9 5,970<br />
385<br />
6.25 - 6.27<br />
166<br />
8.22 - 8.23<br />
167<br />
9.11 - 9.12<br />
116<br />
9.27 - 9.28<br />
107<br />
6.29 - 6.30<br />
113<br />
9.15 - 9.16<br />
Bai-u front 2<br />
Typhoon<br />
No.15<br />
Typhoon<br />
No.18<br />
Typhoon<br />
No.10<br />
Typhoon<br />
No.6<br />
Typhoon<br />
No.5<br />
Major damages<br />
(Districts affected)<br />
- Mid stream<br />
Mid stream,<br />
Uono river basin<br />
Mid stream,<br />
Uono river basin<br />
0 Upper and mid stream<br />
2 Upper and mid stream<br />
3 Upper and mid stream<br />
0 Upper and mid stream<br />
0 Mid stream<br />
Major Drought<br />
Period Affected areas Major damages and counteractions<br />
7 - 9, 1994 Whole basin Water supply cut to 10-50% of normal. Duration 31 July to 21 August<br />
5.5 Groundwater and River Water Quality<br />
River Water Quality 1) at Cyouseibashi 2) between 2000/6 - 2001/5<br />
Date<br />
pH<br />
BOD [mg/l]<br />
CODMn [mg/l]<br />
SS [mg/l]<br />
6/21 7/19 8/23 9/20 10/18 11/15 12/20 1/17 2/21 3/21 4/18 5/16<br />
7.2 7.6 7.6 7.8 7.9 7.4 7.3 7.5 7.9 7.5 7.2 7.5<br />
0.9 1.3 1.1 0.7 1.1 0.7 0.7 0.8 1.1 1.1 0.6 0.8<br />
11.1 2.1<br />
10 112 12 52 5 10 12 8 6 15 20 14<br />
Coliform group 3)<br />
[MPN/100ml]<br />
Discharge 4)<br />
[m 3 /s]<br />
2.3<br />
10 3<br />
368.2<br />
2.8 3.3 3.3 1.3 1.1 1.7 1.3 4.9 3.3 1.7 2.3<br />
10 4 10 3 10 4 10 4 10 4 10 4 10 3 10 2 10 3 10 3 10 3<br />
597.9 227.2 417.5 234.0 303.4 503.7 373.1 343.5 603.4 1,170.5 703.8<br />
1) Observed once a month on a dry day normally several days after rainfall.<br />
2) Located in Nagaoka City 28 km upstream from the river mouth.<br />
3) Measurement method: BGLB (brilliant green lactose bile) culture MPN (most probable number) method.<br />
4) Discharge on the water quality observation date.<br />
93
Japan 10<br />
6. Socio-cultural Characteristics<br />
The Chikuma-<strong>gawa</strong> catchment area is 7,163 km 2 , about 10% of which is flat land. The principal<br />
activity on this flat land is agriculture, mainly rice production, and the irrigated area is 49,600 ha.<br />
Apples are cultivated in the Zenkouji plain as one of the specialties of the Nagano Prefecture. There are<br />
many hot springs, such as Tokura, Kamiyamada and Nozawa, along the Chikuma-<strong>gawa</strong>,. Tourism is<br />
one of the major industries of the basin. As amply demonstrated by the Winter Olympic Games held in<br />
Nagano, there are many ski resorts as well as mountain and hot spring resorts. Moreover, every year<br />
6,500,000 people visit “Zenkouji” because the head temple of the Buddhist Tendai sect is in Nagano<br />
city.<br />
The history of the <strong>Shinano</strong>-<strong>gawa</strong> is one of fighting floods. As described in Section 4.5, people suffered<br />
from floods until the completion of the Ohkouzu Diversion Channel. Nowadays, by using the plentiful<br />
waters of the <strong>Shinano</strong>-<strong>gawa</strong>, the Echigo Plain is the best granary in Japan, and specialises in rice<br />
production.<br />
7. References, Databooks and Bibliography<br />
Geographical Survey Institute (1984): The National Atlas of Japan, Ministry of Construction (2.1, 2.2).<br />
Geological Survey of Japan (1992): Geological Atlas of Japan, Ministry of Construction (2.2).<br />
Geological Survey of Japan (1993): 1:1,000,000-scale international map, (NI-52/53/54, NJ-52, 53, 54),<br />
Ministry of Construction (front page).<br />
River Bureau (1941-1998): Uryou nenpyou (Rainfall Yearbook), Vol.1 ~ 46, Ministry of Construction<br />
(3.2, 3.4).<br />
River Bureau (1948-1998): Ryuryo nenpyou (Streamflow Yearbook), Vol. 1 ~ 48, Ministry of<br />
Construction (4.2, 4.3, 4.4, 4.5, 4.6).<br />
<strong>Shinano</strong> River Work Office (1993): <strong>Shinano</strong> River, Japan’s longest, Hokuriki Regional Construction<br />
Bureau, Ministry of Construction (2.4, 5.1).<br />
<strong>Shinano</strong> River Work Office (1979): A century of history of the <strong>Shinano</strong>-<strong>gawa</strong>, Hokuriku Regional<br />
Construction Bureau, Ministry of Construction (1, 5.1, 6).<br />
<strong>Shinano</strong>cawa-karyu Work Office (1995): A report on drought in the lower reach of the <strong>Shinano</strong>-<strong>gawa</strong><br />
in the summer of 1994, Hokuriku Regional Construction Bureau, Ministry of Construction (5.4).<br />
<strong>Shinano</strong> River Work Office (1994): The Ohkouzu Diversion Channel, Hokuriki Regional Construction<br />
Bureau, Ministry of Construction (4.5).<br />
Tokyo Electric Power Company: Hydroelectric power plants along the Takase River (5.1).<br />
94