You also want an ePaper? Increase the reach of your titles
YUMPU automatically turns print PDFs into web optimized ePapers that Google loves.
Japan 11<br />
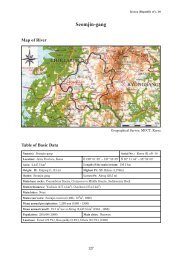
<strong>Tone</strong>-<strong>gawa</strong><br />
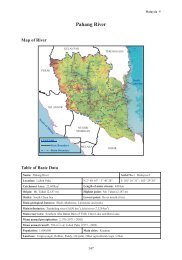
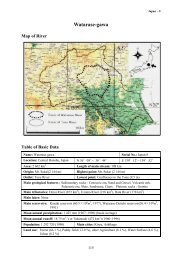
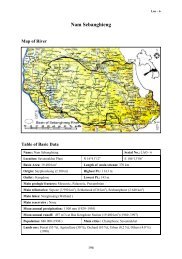
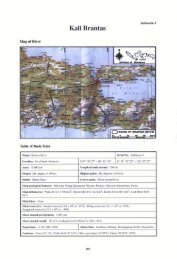
Map of River<br />
Table of Basic Data<br />
Name: <strong>Tone</strong>-<strong>gawa</strong><br />
Location: Central Honshu, Japan<br />
Area: 16,840 km 2<br />
Serial No.: Japan-11<br />
N 35° 32' - 37° 5'<br />
E 138° 24' - 140° 51'<br />
Length of main stream: 322 km<br />
Origin: Mt. Ohminakami<br />
Highest point: 1,834 m (trunk of <strong>Tone</strong>-<strong>gawa</strong>)<br />
Outlet: Pacific Ocean<br />
Lowest point: River mouth (0 m)<br />
Main geological features: Mountain area: sandstone, slate, limestone from the Paleozoic and Mesozoic eras,<br />
and volcanic rock, Plain area: Pleistocene and alluvium<br />
Main tributaries: Katashina-<strong>gawa</strong> (676.1 km 2 ), Agatsuma-<strong>gawa</strong> (1,355.2 km 2 ), Kanna-<strong>gawa</strong> (417.6 km 2 ),<br />
Kabura-<strong>gawa</strong> (632.4 km 2 ), Karasu-<strong>gawa</strong> (759.1 km 2 ), Watarase-<strong>gawa</strong> (2,621.4 km 2 ),<br />
Kokai-<strong>gawa</strong> (1,043.1 km 2 ), Kinu-<strong>gawa</strong> (1,760.6 km 2 )<br />
Main lakes: Kazumigaura, Kitaura, Chuzenji-ko, Imba-numa, Tega-numa, Ushiku-numa<br />
Main reservoirs: Yagisawa (115.5 x 10 6 m 3 , 1967), Naramata (85.0 x 10 6 m 3 , 1991), Hujiwara (31.0 x 10 6 m 3 , 1958),<br />
Aimata (20.0 x 10 6 m 3 , 1959), Sonohara (13.2 x 10 6 m 3 , 1966), Shimokubo (120.0 x 10 6 m 3 , 1969),<br />
Ikari (32.0 x 10 6 m 3 , 1956), Kawamata (73.1 x 10 6 m 3 , 1965), Kawaji (76.0 x 10 6 m 3 , 1983)<br />
Mean annual precipitation: 1162.6 mm at Maebashi, 1580.1 mm at Choshi (1971 - 2000).<br />
Mean annual runoff: 165.2 m 3 /sec at Yattajima, 220.6 m 3 /sec at Kurihashi (1960 - 2000)<br />
Population: about 12,000,000<br />
Main cities: Maebashi, Takasaki, Saitama, Tsukuba Utsunomiya<br />
Land use: Forest (45.5%), Paddy field (18.2%), Cropland (<strong>11.</strong>2%), Orchard (3.3%), Urban (3.7%),<br />
Residential area (6.4%), Water surface (5.1%), Other (6.6%)<br />
95
Japan 11<br />
1. General Description<br />
The <strong>Tone</strong> River (<strong>Tone</strong>-<strong>gawa</strong>) has the largest catchment area (16,840 km 2 ) and the second longest main<br />
river channel (322 km) in Japan. The river originates at Mt. Ohminakami in the Echigo Mountains and<br />
runs across the Kanto Plain, the largest plain in Japan. The ancient <strong>Tone</strong> River flowed to Tokyo Bay.<br />
During the “Eastward Transfer Project” carried out by the Toku<strong>gawa</strong> Shogunate in the Edo era (1603-<br />
1867) its course was shifted during the 17 th century. The present <strong>Tone</strong> River flows out to the Pacific<br />
Ocean at Choshi City. The Kanto Plain includes the capital of Japan, Tokyo, and the Tokyo<br />
Metropolitan area has been expanding into the plain. Although the catchment area of the <strong>Tone</strong> River<br />
occupies only 4.5% of the land area of Japan, about 10% of the Japanese population live in the<br />
catchment. The high population density of the basin increases the importance of the <strong>Tone</strong> River in<br />
Japan.<br />
Modern river management in the basin started in the Meiji era (1868-1912). Since then there have been<br />
unprecedented floods in the basin, and the design flood flow has been revised several times after large<br />
floods. In 1947, Typhoon Kathleen brought heavy rainfall, and embankments broke in the middle<br />
reaches of the <strong>Tone</strong> River. The resultant flooding extended to Tokyo, and caused great damage to the<br />
Tokyo Metropolitan area. One of the causes of the flooding is urbanization of the Tokyo Metropolitan<br />
area. The population of Tokyo and the prefectures in Kanto District was about 10,000,000 in the Meiji<br />
era. However, since then it has increased to about 30,000,000, and property values have increased very<br />
much. Demand for the available water resources has also increased, and recent droughts have caused<br />
serious social problems.<br />
2. Geographical Information<br />
2.1 Geological Map<br />
* Based on the Geological Map of Japan 1:1,000,000, 3 rd Edition CD-ROM, Geological Survey of Japan.<br />
96
Japan 11<br />
2.2 Land Use Map<br />
<br />
<br />
<br />
<br />
<br />
<br />
<br />
<br />
<br />
<br />
<br />
<br />
<br />
<br />
<br />
<br />
<br />
* Based on the National Land Information, National Land Agency, Japan<br />
2.3 Characteristics of River and Main Tributaries<br />
No.<br />
Name of river<br />
Length [km]<br />
Catchment area<br />
[km 2 ]<br />
Highest peak [m]<br />
Lowest point [m]<br />
Cities<br />
Population (1997)<br />
1<br />
2<br />
3<br />
4<br />
5<br />
6<br />
7<br />
8<br />
<strong>Tone</strong><br />
(Main river)<br />
Katashina<br />
(Tributary)<br />
Agatsuma<br />
(Tributary)<br />
Karasu<br />
(Tributary)<br />
Kanna<br />
(Tributary)<br />
Watarase<br />
(Tributary)<br />
Kinu<br />
(Tributary)<br />
Kokai<br />
(Tributary)<br />
322<br />
16,840<br />
60.8<br />
673.3<br />
76.2<br />
1,352<br />
61.8<br />
470<br />
87.4<br />
407<br />
107.6<br />
2,621.4<br />
176.7<br />
1,760.6<br />
1<strong>11.</strong>8<br />
1,043.1<br />
1834<br />
0<br />
2163<br />
288.5<br />
1362<br />
169.9<br />
1654<br />
56.6<br />
1818<br />
64<br />
2144<br />
13<br />
2141<br />
7<br />
185<br />
5<br />
Ohmiya, Tsukuba<br />
(435,463), (150,351)<br />
Numata<br />
(47,378)<br />
Shibukawa<br />
(48,385)<br />
Takasaki<br />
(238,228)<br />
Fujioka<br />
(63,516)<br />
Kiryu, Ashikaga<br />
(119,559), (164,841)<br />
Utsunomiya, Nikko<br />
(434,770), (18,837)<br />
Shimodate, Mouka<br />
(66,125), (61,754)<br />
97
Japan 11<br />
2.4 Longitudinal Profiles<br />
3. Climatological Information<br />
3.1 Annual Isohyetal Map and Observation Stations<br />
* Based on the National Land Information, Ministry of Land, Infrastructure and Transport, Japan<br />
98
Japan 11<br />
3.2 List of Meteorological Observation Stations<br />
No.<br />
42046<br />
*<br />
42091<br />
*<br />
42121<br />
*<br />
42146<br />
*<br />
42221<br />
*<br />
42286<br />
*<br />
47624<br />
**<br />
47626<br />
**<br />
47615<br />
**<br />
47648<br />
**<br />
Station<br />
Fujiwara<br />
Minakami<br />
Elevation<br />
[m]<br />
700<br />
520<br />
Kusatsu 1,230<br />
Numata 430<br />
Tashiro 1,230<br />
Kamisatomi 180<br />
Maebashi 112.1<br />
Kumagaya 30.0<br />
Utsunomiya 119.4<br />
Choshi 20.1<br />
Location<br />
N 36° 51.9'<br />
E 139° 3.8'<br />
N 36° 47.8'<br />
E 138° 59.7'<br />
N 36° 36.9'<br />
E 138° 35.6'<br />
N 36° 39.0'<br />
E 139° 3.9'<br />
N 36° 27.6'<br />
E 138° 27.9'<br />
N 36° 22.5'<br />
E 138° 53.9'<br />
N 36° 24.1'<br />
E 139° 3.8'<br />
N 36° 8.8'<br />
E 139° 23.0'<br />
N 36° 32.8'<br />
E 139° 52.3'<br />
N 35°44.2'<br />
E 140° 51.6'<br />
Observation<br />
period<br />
21<br />
103<br />
Mean annual<br />
precipitation<br />
[mm]<br />
1,801.7<br />
1,692.3<br />
Mean annual<br />
temperature<br />
[°C]<br />
8.7<br />
10.2<br />
Observation<br />
items 1)<br />
103 1,689.7 7.4 A<br />
103 1,084.8 <strong>11.</strong>4 A<br />
21 1,482.7 7.1 A<br />
21 1,329.2 13.3 A<br />
30 1,162.6 14.2 M<br />
30 1,243.2 14.6 M<br />
30 1,443.4 13.4 M<br />
30 1,580.1 15.3 M<br />
* Serial Number used by JMA (Japan Meteorological Agency).<br />
** Serial Number used by WMO (World Meteorological Organization).<br />
1) A: The AMeDAS (Automatic Meteorological Data Acquisition System) established in 1979. Some stations have long term records before the<br />
installation of the AMeDAS system. The observation items are precipitation, air temperature, wind speed, wind direction and sunshine duration.<br />
M: Meteorological Observation, JMA, records 14 items including precipitation, air temperature, sunshine duration, solar radiation, wind speed, wind<br />
direction.<br />
A<br />
A<br />
3.3 Monthly Climate Data<br />
Observation<br />
Item<br />
Temperature<br />
[°C]<br />
Precipitation<br />
[mm]<br />
Solar radiation<br />
[MJ/m 2 /d]<br />
Duration of<br />
Sunshine [hr]<br />
Observation<br />
station<br />
Jan Feb Mar Apr May Jun Jul Aug Sep Oct Nov Dec Annual<br />
Period for<br />
the mean<br />
Maebashi 3.3 3.6 6.9 12.9 17.7 21.2 24.7 26.1 21.9 16.1 10.5 5.8 14.2 1971 - 2000<br />
Maebashi 20.8 33.0 56.3 78.7 90.7 151.4 183.0 184.7 214.8 93.4 42.7 13.2 1,162.6 1971 - 2000<br />
Maebashi 9.4 <strong>11.</strong>7 14.4 16.1 17.3 13.9 14.4 14.8 <strong>11.</strong>1 10.5 9.0 8.4 12.6 1971 - 2000<br />
Maebashi 203.9 186.1 202.8 187.4 193.7 119.0 135.2 162.8 116.8 158.1 173.3 198.6 2,037.7 1971 - 2000<br />
99
Japan 11<br />
3.4 Long-term Variation of Monthly Precipitation<br />
4. Hydrological Information<br />
4.1 Map of Streamflow Observation Stations<br />
Locations for the telemetric water level (open triangle) and water quality (filled circle) stations were chosen by the Foundation of River and Basin<br />
Integrated Communications (FRICS). The Ministry of Land, Infrastructure and Transport operates 355 water level stations in the <strong>Tone</strong> River Basin. Some<br />
of small stations are not included in the above diagram.<br />
100
Japan 11<br />
4.2 List of Selected Hydrological Observation Stations<br />
No.*<br />
30302<br />
Station<br />
Yakatabara<br />
30306 Yattajima<br />
30404 Kurihashi<br />
30506 Fukawa<br />
30602 Noda<br />
Location<br />
N 36° 37' 02"<br />
E 139° 02' 39"<br />
N 36° 15' 37"<br />
E 139° 12' 37"<br />
N 36° 08' 25"<br />
E 139° 42' 20"<br />
N 35° 50' 59"<br />
E 140° 08' 31"<br />
N 35° 56' 08"<br />
E 139° 51' 18"<br />
Catchment area (A)<br />
[km 2 ]<br />
980.9<br />
Observation<br />
period<br />
1954 - present<br />
Observation items 1)<br />
5,150.0 1951 - present Q<br />
8,588.0 1938 - present Q<br />
12,458.0 1938 - present Q, WQ<br />
8,687.9 1955 - present Q<br />
Q<br />
No.*<br />
Q<br />
2)<br />
[m 3 /s]<br />
Qmax 3)<br />
[m 3 /s]<br />
max 4)<br />
[m 3 /s]<br />
min 5)<br />
[m 3 /s]<br />
Q/A<br />
[m 3 /s/100km 2 ]<br />
Qmax/A<br />
[m 3 /s/100km 2 ]<br />
Period of<br />
statistics<br />
30302 40.62 1,120 1,254.16 0.02 4.14 114.18 42<br />
30306 158.91 17,000 9,222.35 24.20 3.09 3,300.97 46<br />
30404 250.50 13,000 11,443.50 6.10 2.92 1,513.74 60<br />
30506 221.88 8,170 7,559.39 1.64 1.78 65.58 55<br />
30602 109.93 3,700 1,271.55 23.93 1.27 42.59 44<br />
*: Serial number used by The River Bureau, Ministry of Construction<br />
1) Q: Discharge, WQ: Water quality 4) Mean maximum discharge<br />
2) Mean annual discharge 5) Mean minimum discharge<br />
3) Maximum discharge<br />
4.3 Long-term Variation of Monthly Discharge<br />
101
Japan 11<br />
4.4 Annual Pattern of Discharge<br />
102
Japan 11<br />
4.6 Annual Maximum and Minimum Discharges<br />
Station: Yattajima [5,150 km 2 ]<br />
Year<br />
Maximum<br />
[m 3 /s]<br />
Minimum<br />
[m 3 /s]<br />
Year<br />
Maximum<br />
[m 3 /s]<br />
Minimum<br />
[m 3 /s]<br />
1970 1,043 26.8 1980 793 59.1 1990 2,841 57.9<br />
1971 2,562 24.2 1981 7,690 62.4 1991 4,589 84.1<br />
1972 5,370 44.1 1982 8,192 59.0 1992 946 42.7<br />
1973 808 36.1 1983 4,267 60.6 1993 1,623 -<br />
1974 5,553 48.9 1984 - - 1994 2,758 65.2<br />
1975 1,169 47.3 1985 4,077 43.5 1995 1,209 47.2<br />
1976 1,876 31.1 1986 4,454 55.8 1996 1,079 54.8<br />
1977 2,240 52.1 1987 781 46.2 1997 1,203 55.0<br />
1978 630 44.5 1988 3,047 32.0 1998 9,222 -<br />
1979 1,738 43.3 1989 2,990 43.0 1999 5,202 67.5<br />
Year<br />
Maximum<br />
[m 3 /s]<br />
Minimum<br />
[m 3 /s]<br />
103
Japan 11<br />
Station: Kurihashi [8,588 km 2 ]<br />
Year<br />
Maximum<br />
[m 3 /s]<br />
Minimum<br />
[m 3 /s]<br />
Year<br />
Maximum<br />
[m 3 /s]<br />
Minimum<br />
[m 3 /s]<br />
1970 859 52.1 1980 1,094 54.7 1990 4,472 30.8<br />
1971 3,878 46.9 1981 7,940 58.1 1991 6,543 75.5<br />
1972 6,709 33.2 1982 11,444 65.1 1992 1,207 67.6<br />
1973 579 37.4 1983 5,938 36.1 1993 2,583 73.9<br />
1974 4,926 52.6 1984 - - 1994 3,157 55.0<br />
1975 1,258 51.1 1985 5,648 36.4 1995 2,074 43.7<br />
1976 2,107 62.5 1986 4,062 50.4 1996 2,217 47.2<br />
1977 3,506 61.3 1987 1,861 28.3 1997 2,176 55.6<br />
1978 1,666 27.0 1988 2,368 35.4 1998 10,577 71.8<br />
1979 3,631 25.1 1989 3,065 55.3 1999 6,608 59.1<br />
Year<br />
Maximum<br />
[m 3 /s]<br />
Minimum<br />
[m 3 /s]<br />
4.7 Hyetographs and Hydrographs of Major Floods<br />
104
Japan 11<br />
5. Water Resources<br />
5.1 General Description<br />
Takasaki City, in 1887, was the first city to use the water resources of the <strong>Tone</strong> River for domestic<br />
water supply. The Tokyo Metropolitan government began by exploiting the water resources of the<br />
Tama River catchment. The development of this water resource approached its limit with the<br />
completion of Ogouchi Dam in 1957 and so Tokyo had to increase its dependence on the <strong>Tone</strong> River<br />
basin for domestic water. Today, seventy five percent of Toyko’s water comes from the <strong>Tone</strong> River.<br />
Some 88% of the domestic water supply comes from dams located in the upper reaches of the <strong>Tone</strong><br />
River and its main tributaries. There are eight dams in the headwater regions of the <strong>Tone</strong> River, and<br />
three dams in the Kinu River basin, with a total combined capacity is 642,730,000 m 3 .<br />
The water produced from the dams in the <strong>Tone</strong> River is transferred to the Ara River through the<br />
Musashi Canal located in the middle reach of the <strong>Tone</strong> River, and is then supplied to the Tokyo<br />
Metropolitan area for domestic use. Water transferred to the Edo River is taken to the Kanamachi water<br />
purification plant, and is used to supply domestic water to the eastern part of Tokyo. The North-Chiba<br />
Water Conveyance Channel was constructed to carry water from lower reaches of the <strong>Tone</strong> River when<br />
there is a shortage of water in Tokyo.<br />
The amount of water supplied from the <strong>Tone</strong> River is about 6,500,000 m 3 per day. The population<br />
using <strong>Tone</strong> water is about 12,000,000. About 250,000 ha of land are irrigated in the <strong>Tone</strong> River basin.<br />
There are about 4,600 water intake facilities, and water rights for agricultural use total 1,320 m 3 /s.<br />
5.2 Map of Water Resource Systems<br />
105
Japan 11<br />
5.3 List of Major Water Resources Facilities<br />
Major Reservoirs<br />
Name of river<br />
Name of dam<br />
(reservoir)<br />
Catchment<br />
area<br />
[km 2 ]<br />
Gross<br />
capacity<br />
[10 6 m 3 ]<br />
Effective<br />
capacity<br />
[10 6 m 3 ]<br />
Purposes 1)<br />
Year of<br />
completion<br />
<strong>Tone</strong> Yagisawa 167.4 204.3 175.8 F, A, P, W 1966<br />
<strong>Tone</strong> Fujiwara 401.0 52.5 35.9 F, A, P 1957<br />
Naramata (<strong>Tone</strong>) Naramata 60.1 90.0 85.0 F, A, W 1991<br />
Akatani (<strong>Tone</strong>) Aimata 110.8 110.8 20.0 F, A, P 1958<br />
Katashina (<strong>Tone</strong>) Sonohara 493.9 493.9 14.1 F, A, P 1965<br />
Kanna (<strong>Tone</strong>) Shimokubo 3229 130.0 120.0 F, A, P, W, I 1966<br />
Kinu Ikari 271.2 55.0 46.0 F, A, P 1956<br />
Kinu Kawamata 179.4 87.6 73.1 F, A, P 1965<br />
Kinu Kawaji 323.6 83.0 76.0 F, A, W, I 1983<br />
Watarase Kusaki 254.0 60.5 50.5 F, A, P, W, I 1976<br />
Major Interbasin Transfer<br />
Name of<br />
transfer line<br />
Musashi Canal <strong>Tone</strong>-<strong>gawa</strong> Ara-kawa 14.52 50.0 I, W 1968<br />
<strong>Tone</strong> Saitama Canal<br />
Diversion<br />
Minumadai<br />
Canal<br />
North-Chiba Water<br />
Conveyance Channel<br />
Name of rivers and places<br />
connected<br />
From<br />
To<br />
<strong>Tone</strong>-<strong>gawa</strong><br />
<strong>Tone</strong>-<strong>gawa</strong><br />
(Agricultural<br />
field)<br />
(Agricultural<br />
field)<br />
Length<br />
[km]<br />
Maximum<br />
capacity<br />
[m 3 /s]<br />
1) A: Agricultural use F: Flood control I: Industrial use N: Maintenance of normal flows P: Hydro-power<br />
W: Municipal water supply<br />
Purpose 1)<br />
Year of<br />
completion<br />
16.68 34.0 A 1968<br />
102.9 43.4 A, W 1968<br />
<strong>Tone</strong>-<strong>gawa</strong> Edo-<strong>gawa</strong> 28.5 40.0 F, W, N 1995<br />
106
Japan 11<br />
5.4 Major Floods and Droughts<br />
Major Floods at Yattajima and Kurihashi<br />
Date<br />
1947.9<br />
Peak discharge<br />
at Yattajima<br />
[m 3 /s]<br />
Peak discharge<br />
at Kurihashi<br />
[m 3 /s]<br />
Rainfall [mm]<br />
Duration<br />
17,000 - 300.5*<br />
1948.9 - 6,640 203.0*<br />
1949.8 9,680 7,180 186.2*<br />
1950.8 6,320 7,530 180.0*<br />
1958.9 9,730 7,340 174.3*<br />
* Whole <strong>Tone</strong> basin, three day total precipitation.<br />
** IAF: Inundation above floor, IBF: Inundation below floor in number of houses.<br />
Meteorological<br />
cause<br />
Typhoon<br />
“Catherine”<br />
Typhoon<br />
“Ion”<br />
Typhoon<br />
“Kitty”<br />
Stationary<br />
Depression<br />
Typhoon-22<br />
“Kano<strong>gawa</strong>”<br />
1959.8 9,070 10,050 217* Typhoon-7<br />
1966.6 5,880 5,490 170.1* Typhoon-4<br />
Dead<br />
and<br />
missing<br />
104<br />
15<br />
36<br />
7<br />
83<br />
6<br />
8<br />
14<br />
14<br />
14<br />
14<br />
2<br />
53<br />
2<br />
Major damages**<br />
IAF: 121,762<br />
IBF: 45,902<br />
IAF: 5,497<br />
IBF: 2,861<br />
IAF: 27,338<br />
IBF: 19,508<br />
IAF: 2,327<br />
IBF: 3,848<br />
IAF: 970<br />
IBF: 19,908<br />
IAF: 984<br />
IBF: 2,591<br />
IAF: 1,561<br />
IBF: 18,815<br />
1971.8 2,460 3,940 166.4* Typhoon-20 - N.A.<br />
1972.9 4,380 7,020 199.2* Typhoon-20 - N.A.<br />
1977.8 - 3,621<br />
1979.10 1,756 3,572<br />
1981.8 7,367 8,174<br />
over 300 mm<br />
(22 days)<br />
300 mm at<br />
Watarase area<br />
300-500 mm in<br />
mountain area<br />
Continuous<br />
Rain<br />
- N.A.<br />
Typhoon-20 - N.A.<br />
Typhoon-15 -<br />
1982.8 7,529 11,118 - Typhoon-18<br />
1982.10 8,007 11,606 - -<br />
1991.9 - 4,688 - Typhoon-18<br />
1998.9 9,770 10,430 - Typhoon-5 -<br />
-<br />
-<br />
-<br />
-<br />
IAF: 78<br />
IBF: 20<br />
IAF: 1<br />
IAF: 1,268<br />
IBF: 408<br />
N.A.<br />
Inundated Area<br />
182 ha<br />
Major Droughts<br />
Period Affected areas Major damages and counteractions<br />
1964.5 - 1964.7 Kanto district So called Olympic drought<br />
1987.6 - 1987.8 Kanto district Maximum cut ratio 30%<br />
1994.7 - 1994.9 Kanto district Maximum cut ratio 30%<br />
1995.8 - 1995.9 Kanto district Maximum cut ratio 30%<br />
107
Japan 11<br />
5.5 River Water Quality<br />
River Water Quality 1) at Kurihashi in 2000<br />
Date 1 Jan 1 Feb 1 Mar 18 Apr 30 May 21 Jun 25 Jul 24 Aug 5 Sep 11 Oct 7 Nov 7 Dec<br />
pH 7.6 7.6 7.5 7.3 7.2 7.4 7.5 7.3 7.4 7.5 7.5 7.5<br />
BOD [mg/l] 2.6 2.4 2.7 1.4 0.6 1.6 1.4 2.5 1.1 0.9 1.1 3.1<br />
DO [mg/l] <strong>11.</strong>8 12.5 12.2 10.7 9.6 8.0 7.7 6.6 7.6 8.2 8.1 <strong>11.</strong>0<br />
SS [mg/l]<br />
5 9 7 10 17 17 27 100 21 9 15 8<br />
Coliform group 2)<br />
[x10 3 MPN/100ml]<br />
1.7 0.2 0.5 0.2 0.5 3.3 2.8 23.0 4.9 13.0 0.0 3.3<br />
Discharge 3) [m 3 /s] 90.40 86.07 82.11 125.82 245.53 121.58 161.1 229.29 132.5 223.5 212.6 109.5<br />
River Water Quality 1) at Fukawa in 2000<br />
Date<br />
1 Jan 1 Feb 1 Mar 18 Apr 30 May 21 Jun 25 Jul 24 Aug 5 Sep 11 Oct 7 Nov 7 Dec<br />
pH 7.6 7.5 7.8 7.4 7.4 7.5 7.9 7.7 7.7 7.5 7.5 7.6<br />
BOD [mg/l] 2.4 2.3 3.1 2.3 1.4 1.9 2.0 1.9 1.4 0.5 1.1 0.9<br />
DO [mg/l] 6.1 <strong>11.</strong>9 12.4 10.1 8.4 7.6 8.2 8.4 8.1 8.7 9.3 <strong>11.</strong>5<br />
SS [mg/l]<br />
4 8 6 13 12 16 12 13 23 14.5 <strong>11.</strong>5 7<br />
Coliform group 2)<br />
[x10 3 MPN/100ml]<br />
1.1 1.3 2.3 4.9 7.9 7.0 4.9 <strong>11.</strong>0 1.2 7.9 7.0 1.3<br />
Discharge 3) [m 3 /s] 122.8 73.6 93.8 84.5 195.6 85.2 161.0 196.1 131.2 294.7 242.1 151.6<br />
1) Observed once a month on a dry day normally several days after rainfall.<br />
2) Measurement method: BGLB (brilliant green lactose bile) culture MPN (most probable number) method.<br />
3) Discharge on the water quality observation date.<br />
6. Socio-cultural Characteristics<br />
The sea surface level is estimated to have fallen by over 100 m at the last glacial maximum some<br />
20,000 years ago. The sea surface then started to rise in the inter-glacial stage, and about 5,000 years<br />
ago, reached a level several metres higher than the present level. At that time, the Kanto plain was a<br />
bay. When the sea level was falling, the ancient river course of the <strong>Tone</strong> was created. About 1,000<br />
years ago the <strong>Tone</strong> River flowed to Tokyo bay, but about 300 years ago the course was diverted to the<br />
Pacific Ocean by the Toku<strong>gawa</strong> Shogunate.<br />
The “Eastward Transfer of the <strong>Tone</strong> River” project was begun by Ieyasu Toku<strong>gawa</strong>, the first Shogun of<br />
the Toku<strong>gawa</strong> Shogunate in the Edo era. The purposes of the project were to protect the capital of Edo<br />
(the present day Tokyo) from floods, and to develop agriculture in the middle reaches of the <strong>Tone</strong><br />
River. The project also provided the capital with a defensive barrier against attack by the kingdom of<br />
northern Japan.<br />
The first western style flood control scheme was introduced in 1897. The design flood flow was set at<br />
3,750 m 3 /s at Kurihashi. In the severe flood of 1910, the estimated peak flow was about 7,000 m 3 /s at<br />
Kurihashi, about twice the size of the design flood. This event led to a revision of the flood control<br />
scheme in the <strong>Tone</strong> River. However, since then the design flood flow has had to be revised several<br />
108
Japan 11<br />
times because of floods that have exceeded the previous design values.<br />
Edo, the capital of Toku<strong>gawa</strong> Shogunate, was renamed to Tokyo in the Meiji era, and continued to<br />
grow as the capital of Japan. The <strong>Tone</strong> River basin is located upstream of the Tokyo Metropolitan area,<br />
and rapid changes in land use have led to the need for repeated revisions of the design flood flow.<br />
After the serious flooding caused by Typhoon Catherine in 1947, the <strong>Tone</strong> River has not experienced<br />
any breach of its embankments in spite of several major rainfall events. The Kanto Regional<br />
Development Bureau, Ministry of Land, Infrastructure, and Transport, has a responsibility for river<br />
management and continues to maintain this valuable water resource, to prevent flood disasters, and to<br />
preserve the nature and environment of the <strong>Tone</strong> River.<br />
7. References, Databooks and Bibliography<br />
Geological Survey of Japan (ed.) (1995): Geological Map of Japan 1:1,000,000, 3rd Edition, CD-ROM<br />
Version. Digital Geoscience Map G-1, Geological Survey of Japan.<br />
Japan Meteorological Agency (2001): Japan Climatological Chart, 320 pp. (in Japanese)<br />
Kanto Regional Construction Bureau, Ministry of Construction (1999): Catalogue of Hydrological<br />
Stations, 165 pp. (in Japanese)<br />
Kanto Regional Construction Bureau (1993): TONEGAWAFlood Control and Water Resources.<br />
Kokudochousa-kai, 195 pp. (in Japanese)<br />
Kanto Regional Construction Bureau (1987): <strong>Tone</strong><strong>gawa</strong> hyakunenshi (100 year’s history of the <strong>Tone</strong><br />
River), Ministry of Construction, 2303 pp. (in Japanese)<br />
Kanto Regional Development Bureau, MLIT (2001): Flood Control and Water Resources in the <strong>Tone</strong><br />
River, Japan River Association, 14 pp. (in Japanese)<br />
Kinu River Dam Control Office, Kanto Regional Construction Bureau, Outline of Dams in Kinu River<br />
Basin. 35 pp. (in Japanese)<br />
Lower <strong>Tone</strong> River Office, Edo-<strong>gawa</strong> River Office, Kanto Regional Construction Bureau, Ministry of<br />
Construction (2000): North-Chiba Water Conveyance Channel, 26 pp. (in Japanese)<br />
Lower <strong>Tone</strong> River Office, Kanto Regional Construction Bureau, Ministry of Construction: <strong>Tone</strong> River<br />
Lower Basin of the <strong>Tone</strong> River, 22 pp.<br />
River Bureau (1947-2000): Ryuryo nenpyo (Streamflow yearbook).<br />
<strong>Tone</strong> River Dam Control Office, Kanto Regional Development Bureau, MLIT (2001): Outline of Dams<br />
in <strong>Tone</strong> River Basin. (in Japanese)<br />
Tomiyama, Kazuko (1974): Water, Green, and Soil. Chuko-Shinsho, (in Japanese)<br />
Upper <strong>Tone</strong> River Office, Kanto Regional Development Bereau, MLIT (2001): Encyclopedia of<br />
TONEGAWA, http://www.tonejo.go.jp/jiten/ (Japanese contents)<br />
Upper <strong>Tone</strong> River Office, Kanto Regional Construction Bureau: <strong>Tone</strong> River, 29 pp. (in Japanese)<br />
Water Resources Development Public Corporation: Outline of <strong>Tone</strong> Water Canal. (in Japanese)<br />
109