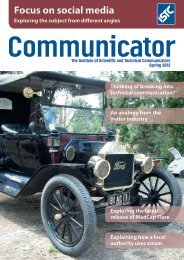
S1000D-compliant illustrations - ISTC
S1000D-compliant illustrations - ISTC
S1000D-compliant illustrations - ISTC

You also want an ePaper? Increase the reach of your titles
YUMPU automatically turns print PDFs into web optimized ePapers that Google loves.
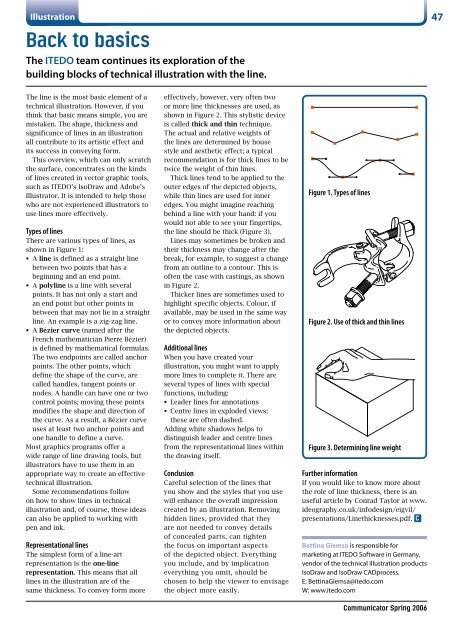
Illustration<br />
Back to basics<br />
The ITEDO team continues its exploration of the<br />
building blocks of technical illustration with the line.<br />
47<br />
The line is the most basic element of a<br />
technical illustration. However, if you<br />
think that basic means simple, you are<br />
mistaken. The shape, thickness and<br />
significance of lines in an illustration<br />
all contribute to its artistic effect and<br />
its success in conveying form.<br />
This overview, which can only scratch<br />
the surface, concentrates on the kinds<br />
of lines created in vector graphic tools,<br />
such as ITEDO’s IsoDraw and Adobe’s<br />
Illustrator. It is intended to help those<br />
who are not experienced illustrators to<br />
use lines more effectively.<br />
Types of lines<br />
There are various types of lines, as<br />
shown in Figure 1:<br />
• A line is defined as a straight line<br />
between two points that has a<br />
beginning and an end point.<br />
• A polyline is a line with several<br />
points. It has not only a start and<br />
an end point but other points in<br />
between that may not lie in a straight<br />
line. An example is a zig-zag line.<br />
• A Bézier curve (named after the<br />
French mathematician Pierre Bézier)<br />
is defined by mathematical formulas.<br />
The two endpoints are called anchor<br />
points. The other points, which<br />
define the shape of the curve, are<br />
called handles, tangent points or<br />
nodes. A handle can have one or two<br />
control points; moving these points<br />
modifies the shape and direction of<br />
the curve. As a result, a Bézier curve<br />
uses at least two anchor points and<br />
one handle to define a curve.<br />
Most graphics programs offer a<br />
wide range of line drawing tools, but<br />
illustrators have to use them in an<br />
appropriate way to create an effective<br />
technical illustration.<br />
Some recommendations follow<br />
on how to show lines in technical<br />
illustration and, of course, these ideas<br />
can also be applied to working with<br />
pen and ink.<br />
Representational lines<br />
The simplest form of a line-art<br />
representation is the one-line<br />
representation. This means that all<br />
lines in the illustration are of the<br />
same thickness. To convey form more<br />
effectively, however, very often two<br />
or more line thicknesses are used, as<br />
shown in Figure 2. This stylistic device<br />
is called thick and thin technique.<br />
The actual and relative weights of<br />
the lines are determined by house<br />
style and aesthetic effect; a typical<br />
recommendation is for thick lines to be<br />
twice the weight of thin lines.<br />
Thick lines tend to be applied to the<br />
outer edges of the depicted objects,<br />
while thin lines are used for inner<br />
edges. You might imagine reaching<br />
behind a line with your hand: if you<br />
would not able to see your fingertips,<br />
the line should be thick (Figure 3).<br />
Lines may sometimes be broken and<br />
their thickness may change after the<br />
break, for example, to suggest a change<br />
from an outline to a contour. This is<br />
often the case with castings, as shown<br />
in Figure 2.<br />
Thicker lines are sometimes used to<br />
highlight specific objects. Colour, if<br />
available, may be used in the same way<br />
or to convey more information about<br />
the depicted objects.<br />
Additional lines<br />
When you have created your<br />
illustration, you might want to apply<br />
more lines to complete it. There are<br />
several types of lines with special<br />
functions, including:<br />
• Leader lines for annotations<br />
• Centre lines in exploded views;<br />
these are often dashed.<br />
Adding white shadows helps to<br />
distinguish leader and centre lines<br />
from the representational lines within<br />
the drawing itself.<br />
Conclusion<br />
Careful selection of the lines that<br />
you show and the styles that you use<br />
will enhance the overall impression<br />
created by an illustration. Removing<br />
hidden lines, provided that they<br />
are not needed to convey details<br />
of concealed parts, can tighten<br />
the focus on important aspects<br />
of the depicted object. Everything<br />
you include, and by implication<br />
everything you omit, should be<br />
chosen to help the viewer to envisage<br />
the object more easily.<br />
Figure 1. Types of lines<br />
Figure 2. Use of thick and thin lines<br />
Figure 3. Determining line weight<br />
Further information<br />
If you would like to know more about<br />
the role of line thickness, there is an<br />
useful article by Conrad Taylor at www.<br />
ideography.co.uk/infodesign/eigvil/<br />
presentations/Linethicknesses.pdf. C<br />
Bettina Giemsa is responsible for<br />
marketing at ITEDO Software in Germany,<br />
vendor of the technical illustration products<br />
IsoDraw and IsoDraw CADprocess.<br />
E: BettinaGiemsa@itedo.com<br />
W: www.itedo.com<br />
Communicator Spring 2006