Calculations concerning voltage ripple of x-ray generators
Calculations concerning voltage ripple of x-ray generators
Calculations concerning voltage ripple of x-ray generators

Create successful ePaper yourself
Turn your PDF publications into a flip-book with our unique Google optimized e-Paper software.
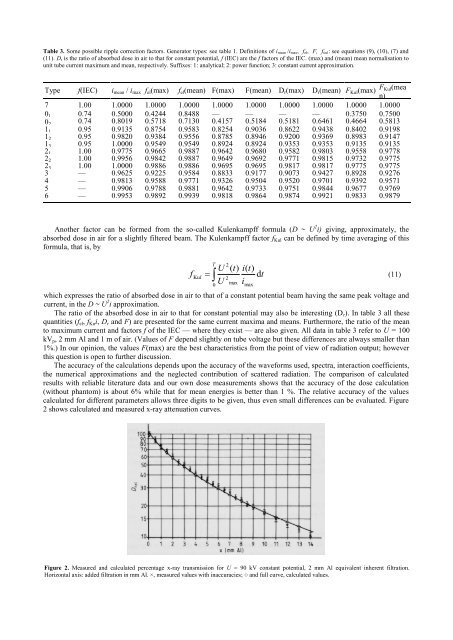
Table 3. Some possible <strong>ripple</strong> correction factors. Generator types: see table 1. Definitions <strong>of</strong> i mean /i max, f el, F, fKul: see equations (9), (10), (7) and<br />
(11). D r is the ratio <strong>of</strong> absorbed dose in air to that for constant potential, f (IEC) are the f factors <strong>of</strong> the IEC. (max) and (mean) mean normalisation to<br />
unit tube current maximum and mean, respectively. Suffixes: 1: analytical; 2: power function; 3: constant current approximation.<br />
Type f(IEC) i mean / i max f el (max) f el (mean) F(max) F(mean) D r (max) D r (mean) F Kul (max) F Kul(mea<br />
n)<br />
7 1.00 1.0000 1.0000 1.0000 1.0000 1.0000 1.0000 1.0000 1.0000 1.0000<br />
0 1 0.74 0.5000 0.4244 0.8488 — — — — 0.3750 0.7500<br />
0 2<br />
0.74 0.8019 0.5718 0.7130 0.4157 0.5184 0.5181 0.6461 0.4664 0.5813<br />
1 1 0.95 0.9135 0.8754 0.9583 0.8254 0.9036 0.8622 0.9438 0.8402 0.9198<br />
1 2 0.95 0.9820 0.9384 0.9556 0.8785 0.8946 0.9200 0.9369 0.8983 0.9147<br />
1 3 0.95 1.0000 0.9549 0.9549 0.8924 0.8924 0.9353 0.9353 0.9135 0.9135<br />
2 1 1.00 0.9775 0.9665 0.9887 0.9642 0.9680 0.9582 0.9803 0.9558 0.9778<br />
2 2 1.00 0.9956 0.9842 0.9887 0.9649 0.9692 0.9771 0.9815 0.9732 0.9775<br />
2 3 1.00 1.0000 0.9886 0.9886 0.9695 0.9695 0.9817 0.9817 0.9775 0.9775<br />
3 — 0.9625 0.9225 0.9584 0.8833 0.9177 0.9073 0.9427 0.8928 0.9276<br />
4 — 0.9813 0.9588 0.9771 0.9326 0.9504 0.9520 0.9701 0.9392 0.9571<br />
5<br />
6<br />
—<br />
—<br />
0.9906<br />
0.9953<br />
0.9788<br />
0.9892<br />
0.9881<br />
0.9939<br />
0.9642<br />
0.9818<br />
0.9733<br />
0.9864<br />
0.9751<br />
0.9874<br />
0.9844<br />
0.9921<br />
0.9677<br />
0.9833<br />
0.9769<br />
0.9879<br />
Another factor can be formed from the so-called Kulenkampff formula (D ~ U 2 i) giving, approximately, the<br />
absorbed dose in air for a slightly filtered beam. The Kulenkampff factor f Kul can be defined by time averaging <strong>of</strong> this<br />
formula, that is, by<br />
f<br />
Kul<br />
T<br />
<br />
0<br />
U<br />
U<br />
2<br />
2<br />
( t)<br />
i(<br />
t)<br />
dt<br />
max i<br />
(11)<br />
which expresses the ratio <strong>of</strong> absorbed dose in air to that <strong>of</strong> a constant potential beam having the same peak <strong>voltage</strong> and<br />
current, in the D ~ U 2 i approximation.<br />
The ratio <strong>of</strong> the absorbed dose in air to that for constant potential may also be interesting (D r ). In table 3 all these<br />
quantities (f el , f Ku i, D r and F) are presented for the same current maxima and means. Furthermore, the ratio <strong>of</strong> the mean<br />
to maximum current and factors f <strong>of</strong> the IEC — where they exist — are also given. All data in table 3 refer to U = 100<br />
kV p , 2 mm Al and 1 m <strong>of</strong> air. (Values <strong>of</strong> F depend slightly on tube <strong>voltage</strong> but these differences are always smaller than<br />
1%.) In our opinion, the values F(max) are the best characteristics from the point <strong>of</strong> view <strong>of</strong> radiation output; however<br />
this question is open to further discussion.<br />
The accuracy <strong>of</strong> the calculations depends upon the accuracy <strong>of</strong> the waveforms used, spectra, interaction coefficients,<br />
the numerical approximations and the neglected contribution <strong>of</strong> scattered radiation. The comparison <strong>of</strong> calculated<br />
results with reliable literature data and our own dose measurements shows that the accuracy <strong>of</strong> the dose calculation<br />
(without phantom) is about 6% while that for mean energies is better than 1 %. The relative accuracy <strong>of</strong> the values<br />
calculated for different parameters allows three digits to be given, thus even small differences can be evaluated. Figure<br />
2 shows calculated and measured x-<strong>ray</strong> attenuation curves.<br />
max<br />
Figure 2. Measured and calculated percentage x-<strong>ray</strong> transmission for U = 90 kV constant potential, 2 mm Al equivalent inherent filtration.<br />
Horizontal axis: added filtration in mm Al. ×, measured values with inaccuracies; ○ and full curve, calculated values.