Unraveling DNA Condensation with Optical Tweezers - Zhuang
Unraveling DNA Condensation with Optical Tweezers - Zhuang
Unraveling DNA Condensation with Optical Tweezers - Zhuang

You also want an ePaper? Increase the reach of your titles
YUMPU automatically turns print PDFs into web optimized ePapers that Google loves.
P ERSPECTIVES<br />
wafer bonding approach allows point defects<br />
and potentially also waveguides to be<br />
introduced parallel to the layers by proper<br />
lithography. In addition, wafer bonding can<br />
incorporate a layer that acts as a light<br />
source (if optically pumped). In the specific<br />
fabrication approach of Ogawa et al. (3),<br />
the woodpile structure consists of a GaAs<br />
photonic crystal <strong>with</strong> point defects and an<br />
InGaAsP multi–quantum-well structure as<br />
light emitter. The measured photoluminescence<br />
spectra clearly prove the photonic<br />
band gap. In addition, they show in-gap defect<br />
modes depending on the defect size, as<br />
expected from theory. The authors succeeded<br />
in mapping the defect by the in-gap<br />
frequency of 1.55 µm.<br />
What are the technological implications?<br />
In principle, the combination of lithography,<br />
etching, and wafer bonding<br />
could be extended to more complex photonic<br />
circuits <strong>with</strong> desirable properties. To<br />
take full advantage of the 3D properties of<br />
photonic crystals, the number of layers has<br />
to be increased. The real question is<br />
whether wafer bonding may offer an economically<br />
and technologically feasible<br />
fabrication approach for complex and<br />
functional 3D photonic crystals containing<br />
waveguides and microresonators. Based<br />
on present knowledge, for economical fabrication<br />
the problem of wafer scale alignment<br />
has to be solved. Another problem is<br />
the cost to etch down all the wafers to<br />
woodpile-layer thickness, a process that<br />
might be too time-consuming for mass<br />
production. The fabrication of siliconbased<br />
structures would be attractive. In<br />
this case, the optically pumped active layer<br />
could be SiO 2 , doped <strong>with</strong> silicon<br />
nanocrystals and erbium, emitting around<br />
1.5 µm wavelength. The required alignment<br />
of silicon woodpiles appears to be<br />
more difficult than in the case of GaAs,<br />
owing to the lower electronic band gap of<br />
silicon.<br />
Ogawa et al. (3) have described the fabrication<br />
of 3D photonic crystals of woodpile<br />
type including point defects and a multi–quantum-well<br />
structure. They report on<br />
photoluminescence measurements of corresponding<br />
microresonator states <strong>with</strong>in<br />
the band gap. This is a major step forward<br />
in the direction of desirable complex photonic<br />
circuits as integrated “semiconductors<br />
for light.”<br />
References<br />
1. S. John, Phys. Rev. Lett. 58, 2486 (1987).<br />
2. E. Yablonovitch, Phys. Rev. Lett. 58, 2059 (1987).<br />
3. Sh. Ogawa et al., Science 305, 227 (2004); published<br />
online 3 June 2004 (10.1126/science.1097968).<br />
4. K. M. Ho et al., Phys. Rev. Lett. 65, 3152 (1990).<br />
5. A. Blanco et al., Nature 405, 437 (2000).<br />
6. O. Toader, S. John, Science 292, 1133 (2001).<br />
7. Y. V. Miklyaev et al., Appl. Phys. Lett. 82, 1284 (2003).<br />
8. M. Alexe, U. Gösele, Eds., Wafer Bonding—Applications<br />
and Technology (Springer, Berlin, 2004).<br />
MOLECULAR BIOLOGY<br />
<strong>Unraveling</strong> <strong>DNA</strong> <strong>Condensation</strong><br />
<strong>with</strong> <strong>Optical</strong> <strong>Tweezers</strong><br />
Since the invention of optical tweezers<br />
by Ashkin, Chu, and co-workers almost<br />
20 years ago (1), this technique<br />
has been applied to a variety of biological<br />
systems. It has yielded a wealth of information,<br />
such as how biopolymers behave<br />
under stress (2), how <strong>DNA</strong>-interacting enzymes<br />
decode or digest <strong>DNA</strong> (3–6), how<br />
motor proteins walk along molecular<br />
tracks (7, 8), and how RNA and protein<br />
molecules fold and unfold (9–11). By allowing<br />
the manipulation of individual molecules,<br />
optical tweezers reveal how these<br />
biological systems work at the molecular<br />
level. On page 222 of this issue, Case et<br />
al. (12) demonstrate yet another elegant<br />
application of this technique: unraveling<br />
the mystery of how proteins called condensins<br />
make <strong>DNA</strong> take on a compact<br />
form.<br />
In essence, optical tweezers use a tightly<br />
focused laser beam to trap a particle in<br />
three dimensions and, through redirection<br />
of the beam, manipulate the particles (1).<br />
Focused light exerts two forces on the particle.<br />
The gradient force draws the particle<br />
toward the focus of the beam where the<br />
The author is in the Department of Chemistry and<br />
Chemical Biology, Department of Physics, Harvard<br />
University, Cambridge, MA 02138, USA. E-mail:<br />
zhuang@chemistry.harvard.edu<br />
Xiaowei <strong>Zhuang</strong><br />
light field is the strongest. The scattering<br />
force arises from the radiation pressure exerted<br />
on the particle by absorbed or scattered<br />
photons, which blow the particle<br />
down the optical axis like a wind. When<br />
balanced, these two forces hold the particle<br />
just slightly downstream of the light focus.<br />
Perhaps the most fascinating applications<br />
of optical tweezers are in biology.<br />
Because biological molecules are often too<br />
small to be manipulated directly by optical<br />
tweezers, a micrometer-sized dielectric<br />
sphere is often attached to the molecule of<br />
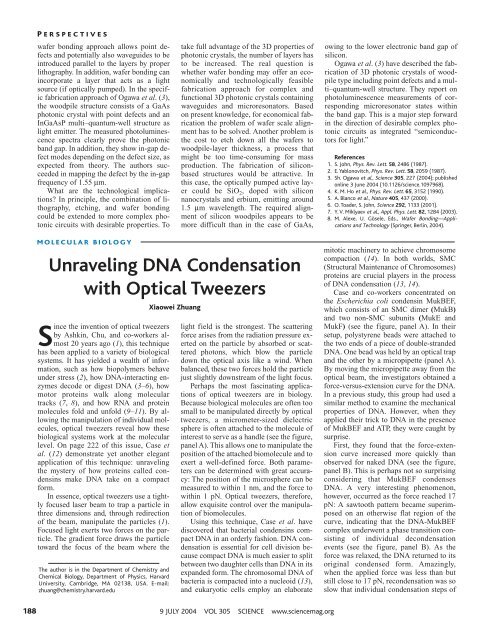
interest to serve as a handle (see the figure,<br />
panel A). This allows one to manipulate the<br />
position of the attached biomolecule and to<br />
exert a well-defined force. Both parameters<br />
can be determined <strong>with</strong> great accuracy:<br />
The position of the microsphere can be<br />
measured to <strong>with</strong>in 1 nm, and the force to<br />
<strong>with</strong>in 1 pN. <strong>Optical</strong> tweezers, therefore,<br />
allow exquisite control over the manipulation<br />
of biomolecules.<br />
Using this technique, Case et al. have<br />
discovered that bacterial condensins compact<br />
<strong>DNA</strong> in an orderly fashion. <strong>DNA</strong> condensation<br />
is essential for cell division because<br />
compact <strong>DNA</strong> is much easier to split<br />
between two daughter cells than <strong>DNA</strong> in its<br />
expanded form. The chromosomal <strong>DNA</strong> of<br />
bacteria is compacted into a nucleoid (13),<br />
and eukaryotic cells employ an elaborate<br />
mitotic machinery to achieve chromosome<br />
compaction (14). In both worlds, SMC<br />
(Structural Maintenance of Chromosomes)<br />
proteins are crucial players in the process<br />
of <strong>DNA</strong> condensation (13, 14).<br />
Case and co-workers concentrated on<br />
the Escherichia coli condensin MukBEF,<br />
which consists of an SMC dimer (MukB)<br />
and two non-SMC subunits (MukE and<br />
MukF) (see the figure, panel A). In their<br />
setup, polystyrene beads were attached to<br />
the two ends of a piece of double-stranded<br />
<strong>DNA</strong>. One bead was held by an optical trap<br />
and the other by a micropipette (panel A).<br />
By moving the micropipette away from the<br />
optical beam, the investigators obtained a<br />
force-versus-extension curve for the <strong>DNA</strong>.<br />
In a previous study, this group had used a<br />
similar method to examine the mechanical<br />
properties of <strong>DNA</strong>. However, when they<br />
applied their trick to <strong>DNA</strong> in the presence<br />
of MukBEF and ATP, they were caught by<br />
surprise.<br />
First, they found that the force-extension<br />
curve increased more quickly than<br />
observed for naked <strong>DNA</strong> (see the figure,<br />
panel B). This is perhaps not so surprising<br />
considering that MukBEF condenses<br />
<strong>DNA</strong>. A very interesting phenomenon,<br />
however, occurred as the force reached 17<br />
pN: A sawtooth pattern became superimposed<br />
on an otherwise flat region of the<br />
curve, indicating that the <strong>DNA</strong>-MukBEF<br />
complex underwent a phase transition consisting<br />
of individual decondensation<br />
events (see the figure, panel B). As the<br />
force was relaxed, the <strong>DNA</strong> returned to its<br />
original condensed form. Amazingly,<br />
when the applied force was less than but<br />
still close to 17 pN, recondensation was so<br />
slow that individual condensation steps of<br />
188<br />
9 JULY 2004 VOL 305 SCIENCE www.sciencemag.org
Force (pN)<br />
A<br />
B<br />
40<br />
30<br />
20<br />
10<br />
0<br />
1.0<br />
Dielectric<br />
sphere<br />
Micropipette<br />
Pull 1<br />
Pull 2<br />
Pull 3<br />
1.5 2.0 2.5 3.0<br />
Extension (m)<br />
35 nm were observed, probably caused by<br />
the conformational change of a single<br />
MukBEF molecule. <strong>Condensation</strong> took<br />
place in the presence of ATP and its nonhydrolyzable<br />
analogs but not in their absence,<br />
indicating that ATP binding rather<br />
than ATP hydrolysis provided the energy<br />
source for condensation.<br />
Perhaps the most surprising result is the<br />
reproducible sawtooth pattern observed<br />
when the same <strong>DNA</strong> was pulled multiple<br />
times. Sawtooth patterns in force-extension<br />
curves of biopolymers are not a new phenomenon.<br />
When the giant muscle protein,<br />
titin, was stretched by an atomic force apparatus,<br />
a beautiful sawtooth pattern was<br />
observed, indicating the sequential unfolding<br />
of individual immunoglobulin domains<br />
(15). A similar pattern was also seen when<br />
a nucleosome array was pulled by an optical<br />
trap, signaling the release of <strong>DNA</strong> from<br />
individual histones (16). In these examples,<br />
the sawtooth pattern indicated a trend toward<br />
increasing disruption forces. This<br />
C<br />
MukBEF<br />
<strong>DNA</strong><br />
F<br />
F<br />
<strong>Optical</strong> beam<br />
A nip and tuck for <strong>DNA</strong>. <strong>Unraveling</strong> a <strong>DNA</strong>-MukBEF complex <strong>with</strong> optical tweezers. (A) In the experimental<br />
setup of Case et al. (12), polystyrene beads (beige spheres) were attached to the two<br />
ends of a piece of double-stranded <strong>DNA</strong> (purple). One bead was held by an optical trap (orange)<br />
and the other by a micropipette (gray handle). By moving the micropipette away from the optical<br />
beam, the investigators obtained force-versus-extension curves for <strong>DNA</strong> bound to the bacterial<br />
condensin MukBEF (blue). Here, only the SMC dimers (MukB) are shown; the non-SMC subunits,<br />
MukE and MukF, are believed to bind to the head domains of MukB (blue rectangles). (B) Force-versus-extension<br />
curves obtained for three consecutive pulling runs of the <strong>DNA</strong>-MukBEF complex. (C)<br />
A model of force-induced decondensation of the <strong>DNA</strong>-MukBEF complex.<br />
F<br />
P ERSPECTIVES<br />
would be expected given that higher forces<br />
are required to break stronger bonds and so<br />
such bonds tend to break later during the<br />
force loading process. For bonds that require<br />
a similar amount of force to break,<br />
individual disruptions are believed to occur<br />
randomly. However, in the case of the<br />
<strong>DNA</strong>-MukBEF complex, the investigators<br />
obtained a highly reproducible sawtooth<br />
pattern in consecutive pulling runs <strong>with</strong> no<br />
correlation between the disruption force of<br />
each peak and its order of occurrence (see<br />
the figure, panel B).<br />
To explain these results, Case and coworkers<br />
propose that ATP-bound MukBEF<br />
polymerizes along the <strong>DNA</strong> by interactions<br />
between the head domains of adjacent<br />
MukBEF molecules (see the figure, panel<br />
C). This joint-head structure binds tightly<br />
to <strong>DNA</strong> (panel C) and does not detach<br />
from the <strong>DNA</strong> even under forces as high as<br />
90 pN. This ATP-dependent interaction between<br />
the two neighboring head domains<br />
of MukBEF and the subsequent stimulation<br />
of binding between <strong>DNA</strong> and the SMC<br />
dimers is consistent <strong>with</strong> a recent biochemical<br />
study of the Bacillus subtilis SMC<br />
(17). Case et al. further propose that a<br />
weaker intramolecular interaction between<br />
the two heads of the same MukBEF dimer<br />
causes <strong>DNA</strong> condensation. The breaking of<br />
this interaction at 17 pN leads to the observed<br />
sawtooth pattern (see the figure,<br />
panel C). The striking reproducibility of<br />
the sawtooth pattern may indicate that this<br />
latter interaction always starts to break<br />
from one end of the condensed <strong>DNA</strong> filament,<br />
presumably because the force is<br />
weaker for a MukBEF molecule that has<br />
only a single neighbor (panel C).<br />
Although these experiments have provided<br />
new insights into the interactions between<br />
condensins and <strong>DNA</strong> that are critical<br />
for understanding the <strong>DNA</strong> condensation<br />
process, much is still unknown. For example,<br />
the compaction ratio observed in this<br />
experiment is only about 4, much less than<br />
the observed value of 10 3 to 10 4 in bacteria.<br />
Concerted actions of condensins, topoisomerases,<br />
other <strong>DNA</strong> binding proteins, and<br />
<strong>DNA</strong> supercoiling in vivo are likely to be<br />
responsible for this discrepancy, but the interplay<br />
between these different factors is<br />
largely unknown. Another interesting question<br />
is whether the functional mechanism<br />
of <strong>DNA</strong> condensation orchestrated by condensins<br />
is conserved between prokaryotic<br />
and eukaryotic cells. Considering the<br />
largely conserved structure of SMC dimers<br />
between the two types of organisms, one<br />
would be inclined to say yes. However, a<br />
recent single-molecule study of Xenopus<br />
laevis condensin I by Strick and co-workers<br />
gave very different results (18). The<br />
most striking difference is that ATP hydrolysis<br />
is required for the compaction of <strong>DNA</strong><br />
by condensin I, whereas Case et al. show<br />
that MukBEF-induced <strong>DNA</strong> condensation<br />
takes place in the presence of nonhydrolyzable<br />
ATP as well. Quantitatively, the step<br />
sizes of individual condensation and decondensation<br />
events are noticeably larger<br />
for condensin I, and so is the overall compaction<br />
ratio observed in the experiment by<br />
Strick and co-workers. Whether these differences<br />
arise from different functional<br />
mechanisms between prokaryotic and eukaryotic<br />
condensins or are merely due to<br />
different experimental conditions is worth<br />
investigating.<br />
Having observed many elegant experiments<br />
on biological molecules using optical<br />
tweezers, I’ve often wondered how far<br />
this method can take us. After all, holding<br />
a molecule at its two ends and then stretching<br />
it is not what happens to biomolecules<br />
naturally in cells. However, the power of<br />
this technique has never ceased to amaze<br />
me when applied <strong>with</strong> intelligent experi-<br />
www.sciencemag.org SCIENCE VOL 305 9 JULY 2004<br />
189
P ERSPECTIVES<br />
mental design. For example, efforts to improve<br />
the precision of optical traps now allow<br />
the transcription of <strong>DNA</strong> to be followed<br />
at almost base-pair resolution (19).<br />
Processes as complicated as <strong>DNA</strong> packaging<br />
by viruses and <strong>DNA</strong> uptake by bacteria<br />
have been studied under near physiological<br />
conditions (20, 21). Case et al. have now<br />
added another wonderful example to this<br />
list, not to mention the equally impressive<br />
accomplishments attributable to other single-molecule<br />
force spectroscopy techniques<br />
(22–24). In the field of manipulation<br />
and force measurements of single molecules,<br />
it appears that, so far, one is limited<br />
only by one’s imagination.<br />
References<br />
1. A. Ashkin et al., Opt. Lett. 11, 288 (1986).<br />
2. C. Bustamante et al., Science 265, 1599 (1994).<br />
3. M. D. Wang et al., Science 282, 902 (1998).<br />
4. G. J. L. Wuite et al., Nature 404, 103 (2000).<br />
5. R. J. Davenport et al., Science 287, 2497 (2000).<br />
6. T. T. Perkins et al., Science 301, 1914 (2003).<br />
7. A. D. Mehta et al., Nature 400, 590 (1999).<br />
8. K. Svoboda et al., Nature 365, 721 (1993).<br />
9. M. S. Z. Kellermayer et al., Science 276, 1112 (1997).<br />
10. L. Tskhovrebova et al., Nature 387, 308 (1997).<br />
11. B. Onoa et al., Science 299, 1892 (2003).<br />
12. R. B. Case et al., Science 305, 222 (2004); published<br />
online 3 June 2004 (10.1126/science.1098225).<br />
13. D. J. Sherratt, Science 301, 780 (2003).<br />
14. J. R. Swedlow, T. Hirano, Mol. Cell 11, 557 (2003).<br />
15. M. Rief et al., Science 276, 1109 (1997).<br />
16. B. D. Brower-Toland et al., Proc. Natl. Acad. Sci. U.S.A.<br />
99, 1960 (2002).<br />
17. M. Hirano, T. Hirano, EMBO J., 10.1038/sj.emboj.<br />
7600264 (2004).<br />
18. T. R. Strick et al., Curr. Biol. 14, 874 (2004).<br />
19. J. W. Shaevitz et al., Nature 426, 684 (2003).<br />
20. D. E. Smith et al., Nature 413, 748 (2001).<br />
21. B. Maier et al., Nat. Struct. Mol. Biol,10.1038/nsmb783<br />
(2004).<br />
22. T. R. Strick et al., Nature 404, 901 (2000).<br />
23. X. <strong>Zhuang</strong>, M. Rief, Curr. Opin. Struct. Biol. 13, 88<br />
(2003).<br />
24. A. M. van Oijen et al., Science 301, 1235 (2003).<br />
MATERIALS SCIENCE<br />
Microstructures in 4D<br />
The ability to watch the three-dimensional<br />
growth of a single crystal that<br />
is deeply embedded in a bulk sample,<br />
as Schmidt et al. report on page 229 of this<br />
issue, is a breakthrough in materials characterization<br />
(1). Their work demonstrates<br />
the opportunities created for materials research<br />
by further development of the threedimensional<br />
x-ray diffraction (3DXRD)<br />
microscope at the European Synchrotron<br />
Radiation Facility in Grenoble. The<br />
3DXRD microscope, which Schmidt et al.<br />
developed into a truly 4DXRD microscope<br />
by adding the dimension of time, is likely to<br />
play a major role in revealing the underlying<br />
mechanisms of evolving microstructures<br />
of partially or fully crystalline materials<br />
such as metals, ceramics, and polymers.<br />
Controlling microstructure is important,<br />
because it largely determines the properties<br />
of a wide variety of materials. For example,<br />
the yield strength of metals is inversely proportional<br />
to the average grain size (2), the<br />
conductivity of superconductors is strongly<br />
reduced through grain boundaries (3), and<br />
magnetic domain walls can be pinned by<br />
grain boundaries and precipitates (impurities).<br />
Moreover, the degree of crystallinity<br />
and the size and arrangement of crystallites<br />
in a semicrystalline polymer have a profound<br />
effect on its physical and mechanical<br />
properties (4). Ideally, the formation of the<br />
microstructure should be monitored under<br />
conditions like those of real processing and<br />
in the bulk of the material. This puts high<br />
demands on the measurement technique.<br />
Schmidt et al. have made an exciting step<br />
forward by imaging simultaneously the<br />
The author is in the Department of Materials Science<br />
and Engineering, Delft University of Technology,<br />
Rotterdamseweg 137, 2628 AL Delft, Netherlands. E-<br />
mail: S.E.Offerman@tnw.tudelft.nl<br />
S. Erik Offerman<br />
spatial and time-dependent microstructure<br />
of bulk material down to the micrometer<br />
range, which was not possible until now<br />
<strong>with</strong> any other experimental technique or<br />
ab initio calculation.<br />
Traditionally, metallurgists use light microscopy<br />
to reveal the microstructure from<br />
cross sections of the material.<br />
However, the 2D<br />
image that is obtained in<br />
this way is an oversimplification<br />
of the complex<br />
3D microstructure. The<br />
combined use of computer-aided<br />
reconstruction<br />
techniques and light<br />
microscopy allows the<br />
creation of 3D images of<br />
limited parts of the microstructure<br />
via repeatedly<br />
grinding off a thin<br />
layer of material and taking<br />
an image (5). Despite<br />
the effort, light microscopy<br />
techniques are<br />
limited to ex situ measurements.<br />
The advent of<br />
electron microscopy techniques<br />
drastically improved<br />
the resolution of<br />
the image to the nanometer<br />
level. In addition, in<br />
situ electron microscopy<br />
measurements have been performed to<br />
capture the evolution of the microstructure<br />
at high temperatures (6). Nevertheless,<br />
free-surface effects that are always present<br />
in 2D imaging techniques during in situ<br />
measurements complicate the analysis<br />
and the ability to draw unambiguous conclusions.<br />
Neutron and synchrotron radiation<br />
facilities, which enable high penetration<br />
even in high electron density materials,<br />
have opened the possibility for nondestructive<br />
imaging of the 3D microstructure.<br />
Yet the time dimension was still lacking<br />
in 3D imaging <strong>with</strong> micrometer spatial<br />
resolution.<br />
Using the exceptionally high brilliance<br />
of third-generation synchrotron sources,<br />
Schmidt et al. developed a technique to<br />
study microstructures in 4D <strong>with</strong> a spatial<br />
resolution of micrometers and a time resolution<br />
of minutes. The strength of the<br />
technique that Schmidt et al. developed is<br />
that many relevant aspects of the evolving<br />
Microstructural mapping. Schematic drawing of a deformed metal,<br />
showing the complexity and inhomogeneities of the microstructure:<br />
dislocations (T-shaped symbol), precipitates (small solid<br />
spheres), subgrain and grain boundaries, and a recrystallizing grain in<br />
3D (arrows show direction of growth of grain surfaces). Large color<br />
differences indicate large differences in crystallographic orientation<br />
(top).<br />
microstructure can be measured simultaneously<br />
for the bulk of the material. This<br />
circumvents the need for additional measurements<br />
under different conditions and<br />
of a different part of the material. This is<br />
important because microstructures are<br />
very inhomogeneous, as illustrated in the<br />
figure.<br />
Generally, the microstructure of a polycrystalline<br />
material is composed of multi-<br />
190<br />
9 JULY 2004 VOL 305 SCIENCE www.sciencemag.org