Chapter 23: The Evolution of Populations
Chapter 23: The Evolution of Populations
Chapter 23: The Evolution of Populations

You also want an ePaper? Increase the reach of your titles
YUMPU automatically turns print PDFs into web optimized ePapers that Google loves.
<strong>Chapter</strong> <strong>23</strong>: <strong>The</strong> <strong>Evolution</strong> <strong>of</strong><br />
<strong>Populations</strong>
Overview: <strong>The</strong> Smallest Unit <strong>of</strong> <strong>Evolution</strong><br />
One misconception is that organisms evolve during<br />
their lifetimes<br />
Natural selection acts on individuals, but only<br />
populations evolve<br />
Genetic variations in populations contribute to<br />
evolution
Figure <strong>23</strong>.2<br />
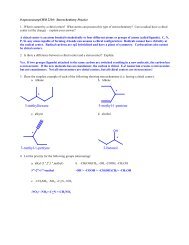
Overview: <strong>The</strong> Smallest Unit <strong>of</strong> <strong>Evolution</strong><br />
Consider, for example, a population <strong>of</strong> medium<br />
ground finches on Daphne Major Island<br />
• During a drought, large‐beaked birds were more<br />
likely to crack large seeds and survive<br />
• <strong>The</strong> finch population evolved by natural selection<br />
Average beak<br />
depth (mm)<br />
1976 1978<br />
(after<br />
drought)
Overview: <strong>The</strong> Smallest Unit <strong>of</strong> <strong>Evolution</strong><br />
Microevolution is a change in allele frequencies in<br />
a population over generations<br />
Three mechanisms cause allele frequency change:<br />
• Natural selection<br />
• Genetic drift<br />
• Gene flow<br />
Only natural selection causes adaptive evolution<br />
Population genetics is the study <strong>of</strong> how<br />
populations microevolve.
Genetic variation makes evolution<br />
possible<br />
Variation in heritable traits is a prerequisite for<br />
evolution<br />
Mendel’s work on pea plants provided evidence <strong>of</strong><br />
discrete heritable units (genes)
Genetic Variation<br />
Genetic variation among individuals is caused by<br />
differences in genes or other DNA segments<br />
Phenotype is the product <strong>of</strong> inherited genotype and<br />
environmental influences<br />
Natural selection can only act on variation with a genetic<br />
component<br />
Figure <strong>23</strong>.3
Variation Within a Population<br />
Both discrete and quantitative characters contribute<br />
to variation within a population<br />
• Discrete characters can be classified on an either‐or basis<br />
• Quantitative characters vary along a continuum within a<br />
population<br />
Genetic variation can be measured as gene<br />
variability or nucleotide variability<br />
For gene variability, average heterozygosity<br />
measures the average percent <strong>of</strong> loci that are<br />
heterozygous in a population<br />
Nucleotide variability is measured by comparing the<br />
DNA sequences <strong>of</strong> pairs <strong>of</strong> individuals
Variation Between <strong>Populations</strong><br />
Most species exhibit geographic variation, differences<br />
between gene pools <strong>of</strong> separate populations<br />
For example, Madeira is home to several isolated<br />
populations <strong>of</strong> mice<br />
• Chromosomal variation among populations is due to drift,<br />
not natural selection
Figure <strong>23</strong>.4<br />
1 2.4<br />
3.14<br />
5.18<br />
6<br />
7.15<br />
8.11 9.12 10.16<br />
13.17<br />
19<br />
XX<br />
1 2.19<br />
3.8<br />
4.16 5.14<br />
6.7<br />
9.10 11.12 13.17<br />
15.18<br />
XX
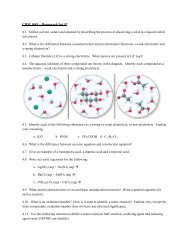
Variation Between <strong>Populations</strong><br />
Some examples <strong>of</strong> geographic variation occur as a<br />
cline, which is a graded change in a trait along a<br />
geographic axis<br />
For example, mummichog fish vary in a coldadaptive<br />
allele along a temperature gradient<br />
• This variation results from natural selection<br />
Ldh-B b allele frequency<br />
Maine<br />
Georgia<br />
Cold (6°C) Warm (21ºC)<br />
Latitude (ºN)
Sources <strong>of</strong> Genetic Variation<br />
New genes and alleles can arise by mutation or gene<br />
duplication
Formation <strong>of</strong> New Alleles<br />
A mutation is a change in nucleotide sequence <strong>of</strong><br />
DNA<br />
Only mutations in cells that produce gametes can<br />
be passed to <strong>of</strong>fspring<br />
A point mutation is a change in one base in a gene
Formation <strong>of</strong> New Alleles<br />
<strong>The</strong> effects <strong>of</strong> point mutations can vary:<br />
• Mutations in noncoding regions <strong>of</strong> DNA are <strong>of</strong>ten<br />
harmless (Introns)<br />
• Mutations in a genes can be neutral because <strong>of</strong><br />
redundancy in the genetic code<br />
• Mutations that result in a change in protein production<br />
are <strong>of</strong>ten harmful<br />
• Mutations that result in a change in protein production<br />
can sometimes be beneficial
Altering Gene Number or Position<br />
Chromosomal mutations that delete, disrupt, or<br />
rearrange many loci are typically harmful<br />
Duplication <strong>of</strong> small pieces <strong>of</strong> DNA increases<br />
genome size and is usually less harmful<br />
Duplicated genes can take on new functions by<br />
further mutation<br />
An ancestral odor‐detecting gene has been<br />
duplicated many times: humans have 1,000 copies<br />
<strong>of</strong> the gene, mice have 1,300
Rapid Reproduction<br />
Mutation rates are low in animals and plants<br />
• <strong>The</strong> average is about one mutation in every 100,000 genes<br />
per generation<br />
• Mutations rates are <strong>of</strong>ten lower in prokaryotes and higher<br />
in viruses
Sexual Reproduction<br />
Sexual reproduction can shuffle existing alleles into<br />
new combinations<br />
In organisms that reproduce sexually,<br />
recombination <strong>of</strong> alleles is more important than<br />
mutation in producing the genetic differences that<br />
make adaptation possible
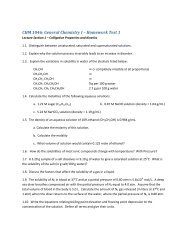
<strong>The</strong> Hardy‐Weinberg Equation<br />
<strong>The</strong> Hardy‐Weinberg equation can be used to<br />
test whether a population is evolving<br />
<strong>The</strong> first step in testing whether evolution is<br />
occurring in a population is to clarify what we<br />
mean by a population
Gene Pools and Allele Frequencies<br />
A population is a localized group <strong>of</strong> individuals<br />
capable <strong>of</strong> interbreeding and producing fertile<br />
<strong>of</strong>fspring<br />
A gene pool consists <strong>of</strong> all the alleles for all loci in a<br />
population<br />
A locus is fixed if all individuals in a population are<br />
homozygous for the same allele
Figure <strong>23</strong>.6<br />
Beaufort Sea<br />
ALASKA<br />
MAP<br />
AREA<br />
CANADA<br />
Porcupine<br />
herd range<br />
Porcupine herd<br />
Fortymile<br />
herd range<br />
Fortymile herd
Gene Pools and Allele Frequencies<br />
<strong>The</strong> frequency <strong>of</strong> an allele in a population can be<br />
calculated<br />
• For diploid organisms, the total number <strong>of</strong> alleles<br />
at a locus is the total number <strong>of</strong> individuals times 2<br />
(Why x2?)<br />
• <strong>The</strong> total number <strong>of</strong> dominant alleles at a locus is 2<br />
alleles for each homozygous dominant individual<br />
plus 1 allele for each heterozygous individual; the<br />
same logic applies for recessive alleles
<strong>The</strong> Hardy‐Weinberg Equation<br />
By convention, if there are 2 alleles at a locus, p<br />
and q are used to represent their frequencies<br />
• Think <strong>of</strong> them as decimal percentages<br />
<strong>The</strong> frequency <strong>of</strong> all alleles in a population will<br />
add up to 1<br />
• For example, p + q = 1
<strong>The</strong> Hardy‐Weinberg Equation<br />
For example, consider a population <strong>of</strong> wildflowers<br />
that is incompletely dominant for color:<br />
• 320 red flowers (C R C R )<br />
• 160 pink flowers (C R C W )<br />
• 20 white flowers (C W C W )<br />
Calculate the number <strong>of</strong> copies <strong>of</strong> each allele:<br />
• C R (320 2) 160 800<br />
• C W (20 2) 160 200
<strong>The</strong> Hardy‐Weinberg Equation<br />
To calculate the frequency <strong>of</strong> each allele:<br />
• p freq C R 800 / (800 200) 0.8<br />
• q freq C W 200 / (800 200) 0.2<br />
<strong>The</strong> sum <strong>of</strong> alleles is always 1<br />
• 0.8 0.2 1
<strong>The</strong> Hardy‐Weinberg Principle<br />
<strong>The</strong> Hardy‐Weinberg principle describes a<br />
population that is not evolving<br />
If a population does not meet the criteria <strong>of</strong> the<br />
Hardy‐Weinberg principle, it can be concluded<br />
that the population is evolving
Hardy‐Weinberg Equilibrium<br />
<strong>The</strong> Hardy‐Weinberg principle states that<br />
frequencies <strong>of</strong> alleles and genotypes in a population<br />
remain constant from generation to generation<br />
In a given population where gametes contribute to<br />
the next generation randomly, allele frequencies<br />
will not change<br />
Mendelian inheritance preserves genetic variation<br />
in a population
Figure <strong>23</strong>.7<br />
Alleles in the population<br />
Frequencies <strong>of</strong> alleles<br />
p = frequency <strong>of</strong><br />
C R allele = 0.8<br />
Gametes produced<br />
Each egg: Each sperm:<br />
q = frequency <strong>of</strong><br />
C W allele = 0.2<br />
80%<br />
chance<br />
20%<br />
chance<br />
80%<br />
chance<br />
20%<br />
chance
Generation<br />
1<br />
X<br />
C R C R<br />
genotype<br />
Plants mate<br />
C W C W<br />
genotype<br />
Generation<br />
2<br />
All C R C W<br />
(all pink flowers)<br />
50% CR 50% CW<br />
gametes gametes<br />
come together at random<br />
Generation<br />
3 25% C R C R<br />
50% C R C W 25% C W C W<br />
50% C R<br />
gametes<br />
50% C W<br />
gametes<br />
come together at random<br />
Generation<br />
4<br />
25% C R C R 50% C R C W 25% C W C W<br />
Alleles segregate, and subsequent<br />
generations also have three types<br />
<strong>of</strong> flowers in the same proportions
<strong>The</strong> Hardy‐Weinberg Equation<br />
Hardy‐Weinberg equilibrium describes the<br />
constant frequency <strong>of</strong> alleles in such a gene pool<br />
Consider, for example, the same population <strong>of</strong><br />
500 wildflowers and 1000 alleles where<br />
• p freq C R 0.8<br />
• q freq C W 0.2
<strong>The</strong> Hardy‐Weinberg Equation<br />
<strong>The</strong> frequency <strong>of</strong> genotypes can be calculated<br />
• C R C R p 2 (0.8) 2 0.64<br />
• C R C W 2pq 2(0.8)(0.2) 0.32<br />
• C W C W q 2 (0.2) 2 0.04<br />
<strong>The</strong> frequency <strong>of</strong> genotypes can be confirmed<br />
using a Punnett square
Figure <strong>23</strong>.8<br />
80% C R (p = 0.8)<br />
20% C W (q = 0.2)<br />
C R<br />
Sperm<br />
(80%) C W (20%)<br />
C R<br />
(80%)<br />
Eggs<br />
64% (p 2 )<br />
C R C R<br />
16% (pq)<br />
C R C W<br />
C W<br />
(20%)<br />
16% (qp)<br />
C R C W 4% (q 2 )<br />
C W C W<br />
64% C R C R , 32% C R C W , and 4% C W C W<br />
Gametes <strong>of</strong> this generation:<br />
64% C R<br />
(from C R C R plants)<br />
+<br />
16% C R<br />
(from C R C W plants)<br />
=<br />
80% C R = 0.8 = p<br />
4% C W<br />
(from C W C W plants)<br />
+<br />
16% C W<br />
(from C R C W plants)<br />
Genotypes in the next generation:<br />
=<br />
20% C W = 0.2 = q<br />
64% C R C R , 32% C R C W , and 4% C W C W plants
<strong>The</strong> Hardy‐Weinberg Equation<br />
If p and q represent the relative frequencies <strong>of</strong> the<br />
only two possible alleles in a population at a<br />
particular locus, then<br />
• p 2 2pq q 2 1<br />
• where p 2 and q 2 represent the frequencies <strong>of</strong> the<br />
homozygous genotypes and 2pq represents the<br />
frequency <strong>of</strong> the heterozygous genotype
Conditions for Hardy‐Weinberg<br />
Equilibrium<br />
<strong>The</strong> Hardy‐Weinberg theorem describes a hypothetical<br />
population that is not evolving<br />
In real populations, allele and genotype frequencies do<br />
change over time
Conditions for Hardy‐Weinberg<br />
Equilibrium<br />
<strong>The</strong> five conditions for nonevolving populations are<br />
rarely met in nature:<br />
1. No mutations<br />
2. Random mating<br />
3. No natural selection<br />
4. Extremely large population size<br />
5. No gene flow<br />
Caveat: Natural populations can evolve at some loci,<br />
while being in Hardy‐Weinberg equilibrium at other<br />
loci
Applying the Hardy‐Weinberg Principle<br />
We can use the Hardy‐Weinberg equation to estimate<br />
the percentage <strong>of</strong> the human population carrying the<br />
allele for an inherited disease<br />
We can assume the locus that causes phenylketonuria<br />
(PKU) is in Hardy‐Weinberg equilibrium given that:<br />
1. <strong>The</strong> PKU gene mutation rate is low<br />
2. Mate selection is random with respect to<br />
whether or not an individual is a carrier for the<br />
PKU allele
Applying the Hardy‐Weinberg Principle<br />
3. Natural selection can only act on rare homozygous<br />
individuals who do not follow dietary restrictions<br />
4. <strong>The</strong> population is large<br />
5. Migration has no effect as many other populations<br />
have similar allele frequencies
Applying the Hardy‐Weinberg Principle<br />
<strong>The</strong> occurrence <strong>of</strong> PKU is 1 per 10,000 births<br />
• q 2 0.0001<br />
• q 0.01<br />
<strong>The</strong> frequency <strong>of</strong> normal alleles is<br />
• p 1 – q 1 –0.01 0.99<br />
<strong>The</strong> frequency <strong>of</strong> carriers is<br />
• 2pq 2 0.99 0.01 0.0198<br />
• or approximately 2% <strong>of</strong> the U.S. population
Altering Gene Frequencies<br />
Natural selection, genetic drift, and gene flow can<br />
alter allele frequencies in a population<br />
Three major factors alter allele frequencies and bring<br />
about most evolutionary change:<br />
• Natural selection<br />
• Genetic drift<br />
• Gene flow
Natural Selection<br />
Differential success in reproduction results in<br />
certain alleles being passed to the next generation<br />
in greater proportions<br />
For example, an allele that confers resistance to<br />
DDT increased in frequency after DDT was used<br />
widely in agriculture
Genetic Drift<br />
<strong>The</strong> smaller a sample, the greater the chance <strong>of</strong><br />
deviation from a predicted result<br />
Genetic drift describes how allele frequencies<br />
fluctuate unpredictably from one generation to the<br />
next<br />
Genetic drift tends to reduce genetic variation through<br />
losses <strong>of</strong> alleles
Genetic Drift
C R C R C R C R C W C W C R C R<br />
C W C W C R C W C R C R<br />
Only 5 <strong>of</strong><br />
10 plants<br />
leave<br />
<strong>of</strong>fspring<br />
C R C W<br />
C R C R C R C W C W C W<br />
Only 2 <strong>of</strong><br />
10 plants<br />
leave<br />
<strong>of</strong>fspring<br />
C R C R C R C R C R C R<br />
C R C R<br />
C R C R C R C R<br />
C R C W<br />
C R C R<br />
C R C R<br />
C R C W<br />
C W C W<br />
C R C R<br />
C R C R<br />
C R C R<br />
C R C W<br />
C R C W<br />
C R C W<br />
C R C R<br />
C R C R<br />
Generation 1<br />
p (frequency <strong>of</strong> C R ) = 0.7<br />
q (frequency <strong>of</strong> C W ) = 0.3<br />
Generation 2<br />
p = 0.5<br />
q = 0.5<br />
Generation 3<br />
p = 1.0<br />
q = 0.0
<strong>The</strong> Founder Effect<br />
<strong>The</strong> founder effect occurs when a few individuals<br />
become isolated from a larger population<br />
Allele frequencies in the small founder population<br />
can be different from those in the larger parent<br />
population
<strong>The</strong> Bottleneck Effect<br />
<strong>The</strong> bottleneck effect is a sudden reduction in<br />
population size due to a change in the environment<br />
<strong>The</strong> resulting gene pool may no longer be reflective<br />
<strong>of</strong> the original population’s gene pool<br />
If the population remains small, it may be further<br />
affected by genetic drift
Figure <strong>23</strong>.10-1
Understanding the bottleneck effect can increase<br />
understanding <strong>of</strong> how human activity affects other<br />
species<br />
Case Study: Impact <strong>of</strong> Genetic Drift on the Greater Prairie<br />
Chicken<br />
Loss <strong>of</strong> prairie habitat caused a severe reduction in<br />
the population <strong>of</strong> greater prairie chickens in Illinois<br />
<strong>The</strong> surviving birds had low levels <strong>of</strong> genetic<br />
variation, and only 50% <strong>of</strong> their eggs hatched
Figure <strong>23</strong>.11<br />
Pre‐bottleneck<br />
(Illinois, 1820)<br />
Post‐bottleneck<br />
(Illinois, 1993)<br />
Greater prairie chicken<br />
(a)<br />
Range<br />
<strong>of</strong> greater<br />
prairie<br />
chicken<br />
Location<br />
Population<br />
size<br />
Number<br />
<strong>of</strong> alleles<br />
per locus<br />
Percentage<br />
<strong>of</strong> eggs<br />
hatched<br />
Illinois<br />
1930–1960s<br />
1993<br />
1,000–25,000<br />
Case Study: Impact <strong>of</strong> Genetic Drift on the<br />
Greater Prairie Chicken<br />
Researchers used DNA from museum specimens<br />
to compare genetic variation in the population<br />
before and after the bottleneck<br />
• <strong>The</strong> results showed a loss <strong>of</strong> alleles at several loci<br />
Researchers introduced greater prairie chickens<br />
from population in other states and were<br />
successful in introducing new alleles and<br />
increasing the egg hatch rate to 90%
Effects <strong>of</strong> Genetic Drift: A Summary<br />
1. Genetic drift is significant in small populations<br />
2. Genetic drift causes allele frequencies to change at<br />
random<br />
3. Genetic drift can lead to a loss <strong>of</strong> genetic variation<br />
within populations<br />
4. Genetic drift can cause harmful alleles to become<br />
fixed
Gene Flow<br />
Gene flow consists <strong>of</strong> the movement <strong>of</strong> alleles among<br />
populations<br />
Alleles can be transferred through the movement <strong>of</strong><br />
fertile individuals or gametes (for example, pollen)<br />
Gene flow tends to reduce variation among<br />
populations over time
Gene Flow<br />
Gene flow can decrease the fitness <strong>of</strong> a population<br />
Consider, for example, the great tit (Parus major) on<br />
the Dutch island <strong>of</strong> Vlieland<br />
• Mating causes gene flow between the central and<br />
eastern populations<br />
• Immigration from the mainland introduces alleles that<br />
decrease fitness<br />
• Natural selection selects for alleles that increase<br />
fitness<br />
• Birds in the central region with high immigration have<br />
a lower fitness; birds in the east with low immigration<br />
have a higher fitness
Figure <strong>23</strong>.12<br />
60<br />
Population in which the<br />
surviving females<br />
eventually bred<br />
Central<br />
population<br />
Survival rate (%)<br />
50<br />
40<br />
30<br />
20<br />
Central<br />
Eastern<br />
NORTH SEA<br />
Vlieland,<br />
the Netherlands<br />
Eastern<br />
population<br />
2 km<br />
10<br />
0<br />
Females born<br />
in central<br />
population<br />
Females born<br />
in eastern<br />
population<br />
Parus major
Gene Flow<br />
Gene flow can also increase the fitness <strong>of</strong> a population<br />
Consider, for example, the spread <strong>of</strong> alleles for<br />
resistance to insecticides<br />
• Insecticides have been used to target mosquitoes that<br />
carry West Nile virus and malaria<br />
• Alleles have evolved in some populations that confer<br />
insecticide resistance to these mosquitoes<br />
• <strong>The</strong> flow <strong>of</strong> insecticide resistance alleles into a<br />
population can cause an increase in fitness<br />
Gene flow is an important agent <strong>of</strong> evolutionary<br />
change in human populations
<strong>The</strong>sis: Natural selection is the only<br />
mechanism that consistently causes<br />
adaptive evolution
<strong>Evolution</strong> by natural selection involves both change<br />
and “sorting”<br />
• New genetic variations arise by chance<br />
• Beneficial alleles are “sorted” and favored by natural<br />
selection<br />
Only natural selection consistently results in adaptive<br />
evolution<br />
Natural selection brings about adaptive evolution<br />
by acting on an organism’s phenotype
Relative Fitness<br />
<strong>The</strong> phrases “struggle for existence” and “survival<br />
<strong>of</strong> the fittest” are misleading as they imply direct<br />
competition among individuals<br />
Relative fitness is the contribution an individual<br />
makes to the gene pool <strong>of</strong> the next generation,<br />
relative to the contributions <strong>of</strong> other individuals<br />
Reproductive success is generally more subtle and<br />
depends on many factors<br />
Selection favors certain genotypes by acting on<br />
the phenotypes <strong>of</strong> certain organisms
Directional, Disruptive, and Stabilizing<br />
Selection<br />
Three modes <strong>of</strong> selection:<br />
• Directional selection favors individuals at one end <strong>of</strong><br />
the phenotypic range<br />
• Disruptive selection favors individuals at both<br />
extremes <strong>of</strong> the phenotypic range<br />
• Stabilizing selection favors intermediate variants<br />
and acts against extreme phenotypes
Figure <strong>23</strong>.13<br />
Frequency <strong>of</strong><br />
individuals<br />
Original population<br />
Original<br />
population<br />
Evolved<br />
population<br />
Phenotypes (fur color)<br />
(a) Directional selection (b) Disruptive selection (c) Stabilizing selection
<strong>The</strong> Key Role <strong>of</strong> Natural Selection in Adaptive<br />
<strong>Evolution</strong><br />
Striking adaptations have arisen by natural<br />
selection<br />
• For example, cuttlefish can change color rapidly<br />
for camouflage<br />
• For example, the jaws <strong>of</strong> snakes allow them to<br />
swallow prey larger than their heads
Figure <strong>23</strong>.14<br />
Bones shown in<br />
green are movable.<br />
Ligament
Summary<br />
Natural selection increases the frequencies <strong>of</strong> alleles<br />
that enhance survival and reproduction<br />
Adaptive evolution occurs as the match between an<br />
organism and its environment increases<br />
Because the environment can change, adaptive<br />
evolution is a continuous process<br />
Genetic drift and gene flow do not consistently lead to<br />
adaptive evolution as they can increase or decrease<br />
the match between an organism and its environment
Sexual Selection<br />
Sexual selection is natural selection for mating<br />
success<br />
It can result in sexual dimorphism, marked<br />
differences between the sexes in secondary sexual<br />
characteristics
Sexual Selection<br />
Intrasexual selection is competition among<br />
individuals <strong>of</strong> one sex (<strong>of</strong>ten males) for mates <strong>of</strong><br />
the opposite sex<br />
Intersexual selection, <strong>of</strong>ten called mate choice,<br />
occurs when individuals <strong>of</strong> one sex (usually<br />
females) are choosy in selecting their mates<br />
Male showiness due to mate choice can increase a<br />
male’s chances <strong>of</strong> attracting a female, while<br />
decreasing his chances <strong>of</strong> survival
Sexual Selection<br />
How do female preferences evolve?<br />
<strong>The</strong> good genes hypothesis suggests that if a trait is<br />
related to male health, both the male trait and<br />
female preference for that trait should increase in<br />
frequency
Figure <strong>23</strong>.16<br />
EXPERIMENT<br />
Recording <strong>of</strong> SC<br />
male’s call<br />
Recording <strong>of</strong> LC<br />
male’s call<br />
SC male gray<br />
tree frog<br />
SC sperm <br />
Female gray<br />
tree frog<br />
Eggs LC sperm<br />
LC male gray<br />
tree frog<br />
Offspring <strong>of</strong> Offspring <strong>of</strong><br />
SC father LC father<br />
Survival and growth <strong>of</strong> these half-sibling <strong>of</strong>fspring compared<br />
RESULTS<br />
Offspring Performance 1995 1996<br />
Larval survival<br />
Larval growth<br />
Time to metamorphosis<br />
LC better<br />
NSD<br />
LC better<br />
(shorter)<br />
NSD<br />
LC better<br />
LC better<br />
(shorter)<br />
NSD = no significant difference; LC better = <strong>of</strong>fspring <strong>of</strong> LC males superior to<br />
<strong>of</strong>fspring <strong>of</strong> SC males.
<strong>The</strong> Preservation <strong>of</strong> Genetic Variation<br />
Neutral variation is genetic variation that does not<br />
confer a selective advantage or disadvantage<br />
Various mechanisms help to preserve genetic variation<br />
in a population<br />
• Diploidy<br />
• Balancing Selection
Diploidy<br />
Diploidy maintains genetic variation in the form <strong>of</strong><br />
hidden recessive alleles<br />
Heterozygotes can carry recessive alleles that are<br />
hidden from the effects <strong>of</strong> selection
Balancing Selection<br />
Balancing selection occurs when natural selection<br />
maintains stable frequencies <strong>of</strong> two or more<br />
phenotypic forms in a population<br />
Balancing selection includes<br />
• Heterozygote advantage<br />
• Frequency‐dependent selection
Heterozygote Advantage<br />
Heterozygote advantage occurs when heterozygotes<br />
have a higher fitness than do both homozygotes<br />
Natural selection will tend to maintain two or more<br />
alleles at that locus<br />
<strong>The</strong> sickle‐cell allele causes mutations in hemoglobin<br />
but also confers malaria resistance
Figure <strong>23</strong>.17<br />
Key<br />
Frequencies <strong>of</strong> the<br />
sickle-cell allele<br />
Distribution <strong>of</strong><br />
malaria caused by<br />
Plasmodium falciparum<br />
(a parasitic unicellular eukaryote)<br />
0–2.5%<br />
2.5–5.0%<br />
5.0–7.5%<br />
7.5–10.0%<br />
10.0–12.5%<br />
>12.5%
Frequency-Dependent Selection<br />
In frequency‐dependent selection, the fitness <strong>of</strong> a<br />
phenotype declines if it becomes too common in<br />
the population<br />
Selection can favor whichever phenotype is less<br />
common in a population<br />
For example, frequency‐dependent selection selects<br />
for approximately equal numbers <strong>of</strong> “rightmouthed”<br />
and “left‐mouthed” scale‐eating fish
Figure <strong>23</strong>.18<br />
“Left-mouthed”<br />
P. microlepis<br />
Frequency <strong>of</strong><br />
“left-mouthed” individuals<br />
1.0<br />
0.5<br />
“Right-mouthed”<br />
P. microlepis<br />
0<br />
1981<br />
Sample year<br />
’82 ’83 ’84 ’85 ’86 ’87 ’88 ’89 ’90
Why Natural Selection Cannot Fashion<br />
Perfect Organisms<br />
1. Selection can act only on existing variations<br />
2. <strong>Evolution</strong> is limited by historical constraints<br />
3. Adaptations are <strong>of</strong>ten compromises<br />
4. Chance, natural selection, and the environment<br />
interact
Figure <strong>23</strong>.19