Modeling Visual Behavior of Pilots in the Human Performance Model
Modeling Visual Behavior of Pilots in the Human Performance Model
Modeling Visual Behavior of Pilots in the Human Performance Model

You also want an ePaper? Increase the reach of your titles
YUMPU automatically turns print PDFs into web optimized ePapers that Google loves.
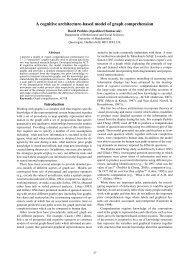
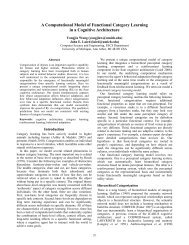
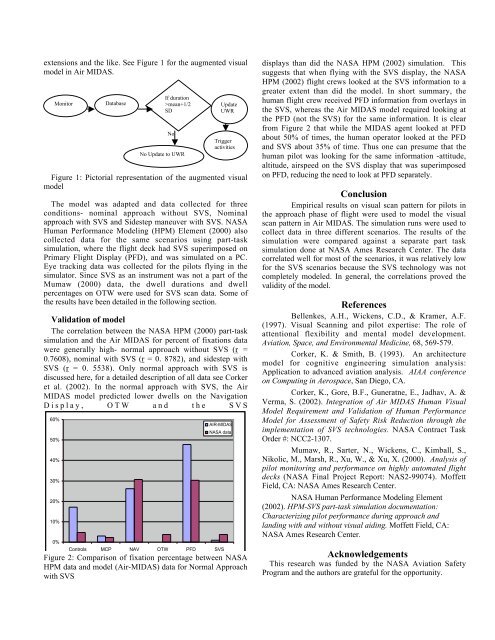
extensions and <strong>the</strong> like. See Figure 1 for <strong>the</strong> augmented visual<br />
model <strong>in</strong> Air MIDAS.<br />
Monitor<br />
Figure 1: Pictorial representation <strong>of</strong> <strong>the</strong> augmented visual<br />
model<br />
The model was adapted and data collected for three<br />
conditions- nom<strong>in</strong>al approach without SVS, Nom<strong>in</strong>al<br />
approach with SVS and Sidestep maneuver with SVS. NASA<br />
<strong>Human</strong> <strong>Performance</strong> <strong><strong>Model</strong><strong>in</strong>g</strong> (HPM) Element (2000) also<br />
collected data for <strong>the</strong> same scenarios us<strong>in</strong>g part-task<br />
simulation, where <strong>the</strong> flight deck had SVS superimposed on<br />
Primary Flight Display (PFD), and was simulated on a PC.<br />
Eye track<strong>in</strong>g data was collected for <strong>the</strong> pilots fly<strong>in</strong>g <strong>in</strong> <strong>the</strong><br />
simulator. S<strong>in</strong>ce SVS as an <strong>in</strong>strument was not a part <strong>of</strong> <strong>the</strong><br />
Mumaw (2000) data, <strong>the</strong> dwell durations and dwell<br />
percentages on OTW were used for SVS scan data. Some <strong>of</strong><br />
<strong>the</strong> results have been detailed <strong>in</strong> <strong>the</strong> follow<strong>in</strong>g section.<br />
Validation <strong>of</strong> model<br />
The correlation between <strong>the</strong> NASA HPM (2000) part-task<br />
simulation and <strong>the</strong> Air MIDAS for percent <strong>of</strong> fixations data<br />
were generally high- normal approach without SVS (r =<br />
0.7608), nom<strong>in</strong>al with SVS (r = 0. 8782), and sidestep with<br />
SVS (r = 0. 5538). Only normal approach with SVS is<br />
discussed here, for a detailed description <strong>of</strong> all data see Corker<br />
et al. (2002). In <strong>the</strong> normal approach with SVS, <strong>the</strong> Air<br />
MIDAS model predicted lower dwells on <strong>the</strong> Navigation<br />
Display, OTW and <strong>the</strong> SVS<br />
60%<br />
50%<br />
40%<br />
30%<br />
20%<br />
10%<br />
0%<br />
Database<br />
If duration<br />
>mean+1/2<br />
SD<br />
Controls MCP NAV OTW PFD SVS<br />
No<br />
No Update to UWR<br />
Update<br />
UWR<br />
Trigger<br />
activities<br />
AIR-MIDAS<br />
NASA data<br />
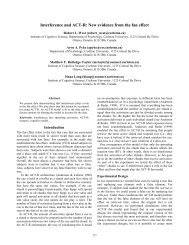
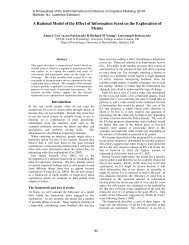
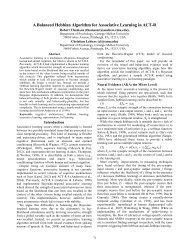
Figure 2: Comparison <strong>of</strong> fixation percentage between NASA<br />
HPM data and model (Air-MIDAS) data for Normal Approach<br />
with SVS<br />
displays than did <strong>the</strong> NASA HPM (2002) simulation. This<br />
suggests that when fly<strong>in</strong>g with <strong>the</strong> SVS display, <strong>the</strong> NASA<br />
HPM (2002) flight crews looked at <strong>the</strong> SVS <strong>in</strong>formation to a<br />
greater extent than did <strong>the</strong> model. In short summary, <strong>the</strong><br />
human flight crew received PFD <strong>in</strong>formation from overlays <strong>in</strong><br />
<strong>the</strong> SVS, whereas <strong>the</strong> Air MIDAS model required look<strong>in</strong>g at<br />
<strong>the</strong> PFD (not <strong>the</strong> SVS) for <strong>the</strong> same <strong>in</strong>formation. It is clear<br />
from Figure 2 that while <strong>the</strong> MIDAS agent looked at PFD<br />
about 50% <strong>of</strong> times, <strong>the</strong> human operator looked at <strong>the</strong> PFD<br />
and SVS about 35% <strong>of</strong> time. Thus one can presume that <strong>the</strong><br />
human pilot was look<strong>in</strong>g for <strong>the</strong> same <strong>in</strong>formation -attitude,<br />
altitude, airspeed on <strong>the</strong> SVS display that was superimposed<br />
on PFD, reduc<strong>in</strong>g <strong>the</strong> need to look at PFD separately.<br />
Conclusion<br />
Empirical results on visual scan pattern for pilots <strong>in</strong><br />
<strong>the</strong> approach phase <strong>of</strong> flight were used to model <strong>the</strong> visual<br />
scan pattern <strong>in</strong> Air MIDAS. The simulation runs were used to<br />
collect data <strong>in</strong> three different scenarios. The results <strong>of</strong> <strong>the</strong><br />
simulation were compared aga<strong>in</strong>st a separate part task<br />
simulation done at NASA Ames Research Center. The data<br />
correlated well for most <strong>of</strong> <strong>the</strong> scenarios, it was relatively low<br />
for <strong>the</strong> SVS scenarios because <strong>the</strong> SVS technology was not<br />
completely modeled. In general, <strong>the</strong> correlations proved <strong>the</strong><br />
validity <strong>of</strong> <strong>the</strong> model.<br />
References<br />
Bellenkes, A.H., Wickens, C.D., & Kramer, A.F.<br />
(1997). <strong>Visual</strong> Scann<strong>in</strong>g and pilot expertise: The role <strong>of</strong><br />
attentional flexibility and mental model development.<br />
Aviation, Space, and Environmental Medic<strong>in</strong>e, 68, 569-579.<br />
Corker, K. & Smith, B. (1993). An architecture<br />
model for cognitive eng<strong>in</strong>eer<strong>in</strong>g simulation analysis:<br />
Application to advanced aviation analysis. AIAA conference<br />
on Comput<strong>in</strong>g <strong>in</strong> Aerospace, San Diego, CA.<br />
Corker, K., Gore, B.F., Guneratne, E., Jadhav, A. &<br />
Verma, S. (2002). Integration <strong>of</strong> Air MIDAS <strong>Human</strong> <strong>Visual</strong><br />
<strong>Model</strong> Requirement and Validation <strong>of</strong> <strong>Human</strong> <strong>Performance</strong><br />
<strong>Model</strong> for Assessment <strong>of</strong> Safety Risk Reduction through <strong>the</strong><br />
implementation <strong>of</strong> SVS technologies. NASA Contract Task<br />
Order #: NCC2-1307.<br />
Mumaw, R., Sarter, N., Wickens, C., Kimball, S.,<br />
Nikolic, M., Marsh, R., Xu, W., & Xu, X. (2000). Analysis <strong>of</strong><br />
pilot monitor<strong>in</strong>g and performance on highly automated flight<br />
decks (NASA F<strong>in</strong>al Project Report: NAS2-99074). M<strong>of</strong>fett<br />
Field, CA: NASA Ames Research Center.<br />
NASA <strong>Human</strong> <strong>Performance</strong> <strong><strong>Model</strong><strong>in</strong>g</strong> Element<br />
(2002). HPM-SVS part-task simulation documentation:<br />
Characteriz<strong>in</strong>g pilot performance dur<strong>in</strong>g approach and<br />
land<strong>in</strong>g with and without visual aid<strong>in</strong>g. M<strong>of</strong>fett Field, CA:<br />
NASA Ames Research Center.<br />
Acknowledgements<br />
This research was funded by <strong>the</strong> NASA Aviation Safety<br />
Program and <strong>the</strong> authors are grateful for <strong>the</strong> opportunity.