Modeling Visual Behavior of Pilots in the Human Performance Model
Modeling Visual Behavior of Pilots in the Human Performance Model
Modeling Visual Behavior of Pilots in the Human Performance Model

Create successful ePaper yourself
Turn your PDF publications into a flip-book with our unique Google optimized e-Paper software.
<strong><strong>Model</strong><strong>in</strong>g</strong> <strong>Visual</strong> <strong>Behavior</strong> <strong>of</strong> <strong>Pilots</strong> <strong>in</strong> <strong>the</strong> <strong>Human</strong> <strong>Performance</strong> <strong>Model</strong> – Air MIDAS<br />
Savita Verma (saverma@mail.arc.nasa.gov)<br />
NASA Ames Research Center, M<strong>of</strong>fett Field CA 94035<br />
Kev<strong>in</strong> Corker (Kev<strong>in</strong>.Corker@sjsu.edu)<br />
San Jose State University, San Jose, CA 95192<br />
Amit Jadhav (amit_jadhav3@hotmail.com)<br />
San Jose State University, San Jose, CA 95192<br />
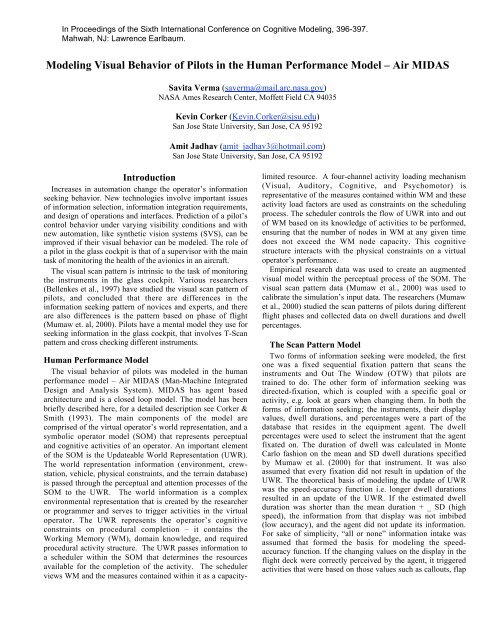
Introduction<br />
Increases <strong>in</strong> automation change <strong>the</strong> operator’s <strong>in</strong>formation<br />
seek<strong>in</strong>g behavior. New technologies <strong>in</strong>volve important issues<br />
<strong>of</strong> <strong>in</strong>formation selection, <strong>in</strong>formation <strong>in</strong>tegration requirements,<br />
and design <strong>of</strong> operations and <strong>in</strong>terfaces. Prediction <strong>of</strong> a pilot’s<br />
control behavior under vary<strong>in</strong>g visibility conditions and with<br />
new automation, like syn<strong>the</strong>tic vision systems (SVS), can be<br />
improved if <strong>the</strong>ir visual behavior can be modeled. The role <strong>of</strong><br />
a pilot <strong>in</strong> <strong>the</strong> glass cockpit is that <strong>of</strong> a supervisor with <strong>the</strong> ma<strong>in</strong><br />
task <strong>of</strong> monitor<strong>in</strong>g <strong>the</strong> health <strong>of</strong> <strong>the</strong> avionics <strong>in</strong> an aircraft.<br />
The visual scan pattern is <strong>in</strong>tr<strong>in</strong>sic to <strong>the</strong> task <strong>of</strong> monitor<strong>in</strong>g<br />
<strong>the</strong> <strong>in</strong>struments <strong>in</strong> <strong>the</strong> glass cockpit. Various researchers<br />
(Bellenkes et al., 1997) have studied <strong>the</strong> visual scan pattern <strong>of</strong><br />
pilots, and concluded that <strong>the</strong>re are differences <strong>in</strong> <strong>the</strong><br />
<strong>in</strong>formation seek<strong>in</strong>g pattern <strong>of</strong> novices and experts, and <strong>the</strong>re<br />
are also differences is <strong>the</strong> pattern based on phase <strong>of</strong> flight<br />
(Mumaw et. al, 2000). <strong>Pilots</strong> have a mental model <strong>the</strong>y use for<br />
seek<strong>in</strong>g <strong>in</strong>formation <strong>in</strong> <strong>the</strong> glass cockpit, that <strong>in</strong>volves T-Scan<br />
pattern and cross check<strong>in</strong>g different <strong>in</strong>struments.<br />
<strong>Human</strong> <strong>Performance</strong> <strong>Model</strong><br />
The visual behavior <strong>of</strong> pilots was modeled <strong>in</strong> <strong>the</strong> human<br />
performance model – Air MIDAS (Man-Mach<strong>in</strong>e Integrated<br />
Design and Analysis System). MIDAS has agent based<br />
architecture and is a closed loop model. The model has been<br />
briefly described here, for a detailed description see Corker &<br />
Smith (1993). The ma<strong>in</strong> components <strong>of</strong> <strong>the</strong> model are<br />
comprised <strong>of</strong> <strong>the</strong> virtual operator’s world representation, and a<br />
symbolic operator model (SOM) that represents perceptual<br />
and cognitive activities <strong>of</strong> an operator. An important element<br />
<strong>of</strong> <strong>the</strong> SOM is <strong>the</strong> Updateable World Representation (UWR).<br />
The world representation <strong>in</strong>formation (environment, crewstation,<br />
vehicle, physical constra<strong>in</strong>ts, and <strong>the</strong> terra<strong>in</strong> database)<br />
is passed through <strong>the</strong> perceptual and attention processes <strong>of</strong> <strong>the</strong><br />
SOM to <strong>the</strong> UWR. The world <strong>in</strong>formation is a complex<br />
environmental representation that is created by <strong>the</strong> researcher<br />
or programmer and serves to trigger activities <strong>in</strong> <strong>the</strong> virtual<br />
operator. The UWR represents <strong>the</strong> operator’s cognitive<br />
constra<strong>in</strong>ts on procedural completion – it conta<strong>in</strong>s <strong>the</strong><br />
Work<strong>in</strong>g Memory (WM), doma<strong>in</strong> knowledge, and required<br />
procedural activity structure. The UWR passes <strong>in</strong>formation to<br />
a scheduler with<strong>in</strong> <strong>the</strong> SOM that determ<strong>in</strong>es <strong>the</strong> resources<br />
available for <strong>the</strong> completion <strong>of</strong> <strong>the</strong> activity. The scheduler<br />
views WM and <strong>the</strong> measures conta<strong>in</strong>ed with<strong>in</strong> it as a capacitylimited<br />
resource. A four-channel activity load<strong>in</strong>g mechanism<br />
(<strong>Visual</strong>, Auditory, Cognitive, and Psychomotor) is<br />
representative <strong>of</strong> <strong>the</strong> measures conta<strong>in</strong>ed with<strong>in</strong> WM and <strong>the</strong>se<br />
activity load factors are used as constra<strong>in</strong>ts on <strong>the</strong> schedul<strong>in</strong>g<br />
process. The scheduler controls <strong>the</strong> flow <strong>of</strong> UWR <strong>in</strong>to and out<br />
<strong>of</strong> WM based on its knowledge <strong>of</strong> activities to be performed,<br />
ensur<strong>in</strong>g that <strong>the</strong> number <strong>of</strong> nodes <strong>in</strong> WM at any given time<br />
does not exceed <strong>the</strong> WM node capacity. This cognitive<br />
structure <strong>in</strong>teracts with <strong>the</strong> physical constra<strong>in</strong>ts on a virtual<br />
operator’s performance.<br />
Empirical research data was used to create an augmented<br />
visual model with<strong>in</strong> <strong>the</strong> perceptual process <strong>of</strong> <strong>the</strong> SOM. The<br />
visual scan pattern data (Mumaw et al., 2000) was used to<br />
calibrate <strong>the</strong> simulation’s <strong>in</strong>put data. The researchers (Mumaw<br />
et al., 2000) studied <strong>the</strong> scan patterns <strong>of</strong> pilots dur<strong>in</strong>g different<br />
flight phases and collected data on dwell durations and dwell<br />
percentages.<br />
The Scan Pattern <strong>Model</strong><br />
Two forms <strong>of</strong> <strong>in</strong>formation seek<strong>in</strong>g were modeled, <strong>the</strong> first<br />
one was a fixed sequential fixation pattern that scans <strong>the</strong><br />
<strong>in</strong>struments and Out The W<strong>in</strong>dow (OTW) that pilots are<br />
tra<strong>in</strong>ed to do. The o<strong>the</strong>r form <strong>of</strong> <strong>in</strong>formation seek<strong>in</strong>g was<br />
directed-fixation, which is coupled with a specific goal or<br />
activity, e.g. look at gears when chang<strong>in</strong>g <strong>the</strong>m. In both <strong>the</strong><br />
forms <strong>of</strong> <strong>in</strong>formation seek<strong>in</strong>g; <strong>the</strong> <strong>in</strong>struments, <strong>the</strong>ir display<br />
values, dwell durations, and percentages were a part <strong>of</strong> <strong>the</strong><br />
database that resides <strong>in</strong> <strong>the</strong> equipment agent. The dwell<br />
percentages were used to select <strong>the</strong> <strong>in</strong>strument that <strong>the</strong> agent<br />
fixated on. The duration <strong>of</strong> dwell was calculated <strong>in</strong> Monte<br />
Carlo fashion on <strong>the</strong> mean and SD dwell durations specified<br />
by Mumaw et al. (2000) for that <strong>in</strong>strument. It was also<br />
assumed that every fixation did not result <strong>in</strong> updation <strong>of</strong> <strong>the</strong><br />
UWR. The <strong>the</strong>oretical basis <strong>of</strong> model<strong>in</strong>g <strong>the</strong> update <strong>of</strong> UWR<br />
was <strong>the</strong> speed-accuracy function i.e. longer dwell durations<br />
resulted <strong>in</strong> an update <strong>of</strong> <strong>the</strong> UWR. If <strong>the</strong> estimated dwell<br />
duration was shorter than <strong>the</strong> mean duration + _ SD (high<br />
speed), <strong>the</strong> <strong>in</strong>formation from that display was not imbibed<br />
(low accuracy), and <strong>the</strong> agent did not update its <strong>in</strong>formation.<br />
For sake <strong>of</strong> simplicity, “all or none” <strong>in</strong>formation <strong>in</strong>take was<br />
assumed that formed <strong>the</strong> basis for model<strong>in</strong>g <strong>the</strong> speedaccuracy<br />
function. If <strong>the</strong> chang<strong>in</strong>g values on <strong>the</strong> display <strong>in</strong> <strong>the</strong><br />
flight deck were correctly perceived by <strong>the</strong> agent, it triggered<br />
activities that were based on those values such as callouts, flap
extensions and <strong>the</strong> like. See Figure 1 for <strong>the</strong> augmented visual<br />
model <strong>in</strong> Air MIDAS.<br />
Monitor<br />
Figure 1: Pictorial representation <strong>of</strong> <strong>the</strong> augmented visual<br />
model<br />
The model was adapted and data collected for three<br />
conditions- nom<strong>in</strong>al approach without SVS, Nom<strong>in</strong>al<br />
approach with SVS and Sidestep maneuver with SVS. NASA<br />
<strong>Human</strong> <strong>Performance</strong> <strong><strong>Model</strong><strong>in</strong>g</strong> (HPM) Element (2000) also<br />
collected data for <strong>the</strong> same scenarios us<strong>in</strong>g part-task<br />
simulation, where <strong>the</strong> flight deck had SVS superimposed on<br />
Primary Flight Display (PFD), and was simulated on a PC.<br />
Eye track<strong>in</strong>g data was collected for <strong>the</strong> pilots fly<strong>in</strong>g <strong>in</strong> <strong>the</strong><br />
simulator. S<strong>in</strong>ce SVS as an <strong>in</strong>strument was not a part <strong>of</strong> <strong>the</strong><br />
Mumaw (2000) data, <strong>the</strong> dwell durations and dwell<br />
percentages on OTW were used for SVS scan data. Some <strong>of</strong><br />
<strong>the</strong> results have been detailed <strong>in</strong> <strong>the</strong> follow<strong>in</strong>g section.<br />
Validation <strong>of</strong> model<br />
The correlation between <strong>the</strong> NASA HPM (2000) part-task<br />
simulation and <strong>the</strong> Air MIDAS for percent <strong>of</strong> fixations data<br />
were generally high- normal approach without SVS (r =<br />
0.7608), nom<strong>in</strong>al with SVS (r = 0. 8782), and sidestep with<br />
SVS (r = 0. 5538). Only normal approach with SVS is<br />
discussed here, for a detailed description <strong>of</strong> all data see Corker<br />
et al. (2002). In <strong>the</strong> normal approach with SVS, <strong>the</strong> Air<br />
MIDAS model predicted lower dwells on <strong>the</strong> Navigation<br />
Display, OTW and <strong>the</strong> SVS<br />
60%<br />
50%<br />
40%<br />
30%<br />
20%<br />
10%<br />
0%<br />
Database<br />
If duration<br />
>mean+1/2<br />
SD<br />
Controls MCP NAV OTW PFD SVS<br />
No<br />
No Update to UWR<br />
Update<br />
UWR<br />
Trigger<br />
activities<br />
AIR-MIDAS<br />
NASA data<br />
Figure 2: Comparison <strong>of</strong> fixation percentage between NASA<br />
HPM data and model (Air-MIDAS) data for Normal Approach<br />
with SVS<br />
displays than did <strong>the</strong> NASA HPM (2002) simulation. This<br />
suggests that when fly<strong>in</strong>g with <strong>the</strong> SVS display, <strong>the</strong> NASA<br />
HPM (2002) flight crews looked at <strong>the</strong> SVS <strong>in</strong>formation to a<br />
greater extent than did <strong>the</strong> model. In short summary, <strong>the</strong><br />
human flight crew received PFD <strong>in</strong>formation from overlays <strong>in</strong><br />
<strong>the</strong> SVS, whereas <strong>the</strong> Air MIDAS model required look<strong>in</strong>g at<br />
<strong>the</strong> PFD (not <strong>the</strong> SVS) for <strong>the</strong> same <strong>in</strong>formation. It is clear<br />
from Figure 2 that while <strong>the</strong> MIDAS agent looked at PFD<br />
about 50% <strong>of</strong> times, <strong>the</strong> human operator looked at <strong>the</strong> PFD<br />
and SVS about 35% <strong>of</strong> time. Thus one can presume that <strong>the</strong><br />
human pilot was look<strong>in</strong>g for <strong>the</strong> same <strong>in</strong>formation -attitude,<br />
altitude, airspeed on <strong>the</strong> SVS display that was superimposed<br />
on PFD, reduc<strong>in</strong>g <strong>the</strong> need to look at PFD separately.<br />
Conclusion<br />
Empirical results on visual scan pattern for pilots <strong>in</strong><br />
<strong>the</strong> approach phase <strong>of</strong> flight were used to model <strong>the</strong> visual<br />
scan pattern <strong>in</strong> Air MIDAS. The simulation runs were used to<br />
collect data <strong>in</strong> three different scenarios. The results <strong>of</strong> <strong>the</strong><br />
simulation were compared aga<strong>in</strong>st a separate part task<br />
simulation done at NASA Ames Research Center. The data<br />
correlated well for most <strong>of</strong> <strong>the</strong> scenarios, it was relatively low<br />
for <strong>the</strong> SVS scenarios because <strong>the</strong> SVS technology was not<br />
completely modeled. In general, <strong>the</strong> correlations proved <strong>the</strong><br />
validity <strong>of</strong> <strong>the</strong> model.<br />
References<br />
Bellenkes, A.H., Wickens, C.D., & Kramer, A.F.<br />
(1997). <strong>Visual</strong> Scann<strong>in</strong>g and pilot expertise: The role <strong>of</strong><br />
attentional flexibility and mental model development.<br />
Aviation, Space, and Environmental Medic<strong>in</strong>e, 68, 569-579.<br />
Corker, K. & Smith, B. (1993). An architecture<br />
model for cognitive eng<strong>in</strong>eer<strong>in</strong>g simulation analysis:<br />
Application to advanced aviation analysis. AIAA conference<br />
on Comput<strong>in</strong>g <strong>in</strong> Aerospace, San Diego, CA.<br />
Corker, K., Gore, B.F., Guneratne, E., Jadhav, A. &<br />
Verma, S. (2002). Integration <strong>of</strong> Air MIDAS <strong>Human</strong> <strong>Visual</strong><br />
<strong>Model</strong> Requirement and Validation <strong>of</strong> <strong>Human</strong> <strong>Performance</strong><br />
<strong>Model</strong> for Assessment <strong>of</strong> Safety Risk Reduction through <strong>the</strong><br />
implementation <strong>of</strong> SVS technologies. NASA Contract Task<br />
Order #: NCC2-1307.<br />
Mumaw, R., Sarter, N., Wickens, C., Kimball, S.,<br />
Nikolic, M., Marsh, R., Xu, W., & Xu, X. (2000). Analysis <strong>of</strong><br />
pilot monitor<strong>in</strong>g and performance on highly automated flight<br />
decks (NASA F<strong>in</strong>al Project Report: NAS2-99074). M<strong>of</strong>fett<br />
Field, CA: NASA Ames Research Center.<br />
NASA <strong>Human</strong> <strong>Performance</strong> <strong><strong>Model</strong><strong>in</strong>g</strong> Element<br />
(2002). HPM-SVS part-task simulation documentation:<br />
Characteriz<strong>in</strong>g pilot performance dur<strong>in</strong>g approach and<br />
land<strong>in</strong>g with and without visual aid<strong>in</strong>g. M<strong>of</strong>fett Field, CA:<br />
NASA Ames Research Center.<br />
Acknowledgements<br />
This research was funded by <strong>the</strong> NASA Aviation Safety<br />
Program and <strong>the</strong> authors are grateful for <strong>the</strong> opportunity.