
Create successful ePaper yourself
Turn your PDF publications into a flip-book with our unique Google optimized e-Paper software.
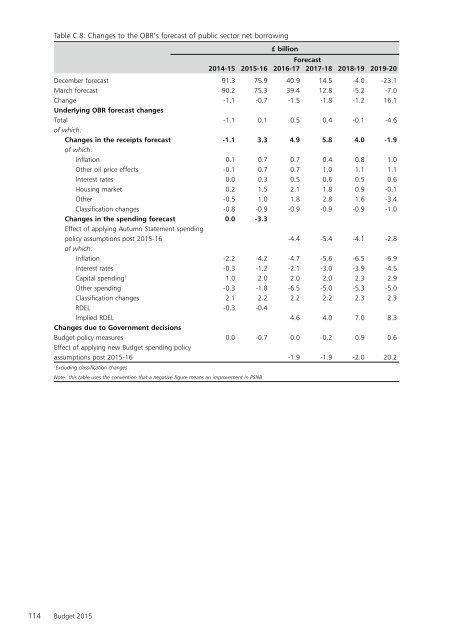
Table C.8: Changes to the OBR’s forecast of public sector net borrowing<br />
£ billion<br />
Forecast<br />
2014-15 2015-16 2016-17 2017-18 2018-19 2019-20<br />
December forecast 91.3 75.9 40.9 14.5 -4.0 -23.1<br />
March forecast 90.2 75.3 39.4 12.8 -5.2 -7.0<br />
Change -1.1 -0.7 -1.5 -1.8 -1.2 16.1<br />
Underlying OBR forecast changes<br />
Total -1.1 0.1 0.5 0.4 -0.1 -4.6<br />
of which:<br />
Changes in the receipts forecast -1.1 3.3 4.9 5.8 4.0 -1.9<br />
of which:<br />
Inflation 0.1 0.7 0.7 0.4 0.8 1.0<br />
Other oil price effects -0.1 0.7 0.7 1.0 1.1 1.1<br />
Interest rates 0.0 0.3 0.5 0.6 0.5 0.6<br />
Housing market 0.2 1.5 2.1 1.8 0.9 -0.1<br />
Other -0.5 1.0 1.8 2.8 1.6 -3.4<br />
Classification changes -0.8 -0.9 -0.9 -0.9 -0.9 -1.0<br />
Changes in the spending forecast 0.0 -3.3<br />
Effect of applying Autumn Statement spending<br />
policy assumptions post 2015-16 -4.4 -5.4 -4.1 -2.8<br />
of which:<br />
Inflation -2.2 -4.2 -4.7 -5.6 -6.5 -6.9<br />
Interest rates -0.3 -1.2 -2.1 -3.0 -3.9 -4.5<br />
Capital spending 1 1.0 2.0 2.0 2.0 2.3 2.9<br />
Other spending -0.3 -1.8 -6.5 -5.0 -5.3 -5.0<br />
Classification changes 2.1 2.2 2.2 2.2 2.3 2.3<br />
RDEL -0.3 -0.4<br />
Implied RDEL 4.6 4.0 7.0 8.3<br />
Changes due to Government decisions<br />
Budget policy measures 0.0 -0.7 0.0 -0.2 0.9 0.6<br />
Effect of applying new Budget spending policy<br />
assumptions post 2015-16 -1.9 -1.9 -2.0 20.2<br />
1<br />
Excluding classification changes<br />
Note: this table uses the convention that a negative figure means an improvement in PSNB.<br />
114 Budget 2015