
You also want an ePaper? Increase the reach of your titles
YUMPU automatically turns print PDFs into web optimized ePapers that Google loves.
Fiscal forecast<br />
1.57 As set out in Table 1.3, from its post-war peak of 10.2% of GDP in 2009-10, the OBR<br />
forecasts public sector net borrowing will fall in each year of the forecast period, to: 41<br />
••<br />
5.0% of GDP in 2014-15<br />
••<br />
4.0% of GDP in 2015-16, the final year for which the government has set departmental<br />
spending plans<br />
••<br />
a surplus of 0.2% of GDP in 2018-19, increasing to 0.3% of GDP in 2019-20<br />
1.58 Public sector net debt is forecast to peak at 80.4% of GDP in 2014-15, the same level as<br />
at Autumn Statement 2014, before falling each year and reaching 71.6% of GDP in 2019-20.<br />
In 2015-16 public sector net debt is forecast to be 80.2% of GDP, 0.2 percentage points lower<br />
than 2014-15.<br />
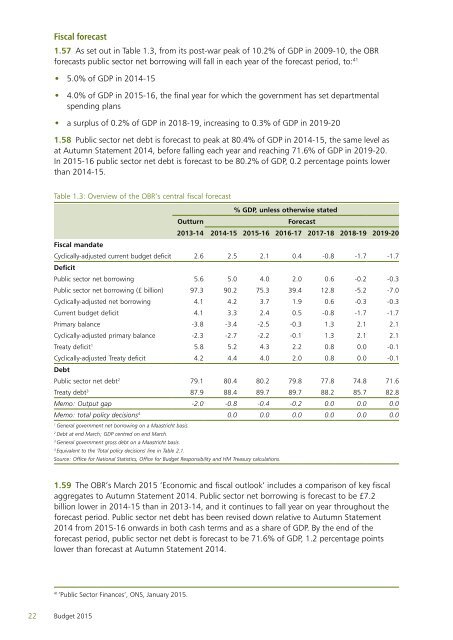
Table 1.3: Overview of the OBR’s central fiscal forecast<br />
% GDP, unless otherwise stated<br />
Outturn<br />
Forecast<br />
2013-14 2014-15 2015-16 2016-17 2017-18 2018-19 2019-20<br />
Fiscal mandate<br />
Cyclically-adjusted current budget deficit 2.6 2.5 2.1 0.4 -0.8 -1.7 -1.7<br />
Deficit<br />
Public sector net borrowing 5.6 5.0 4.0 2.0 0.6 -0.2 -0.3<br />
Public sector net borrowing (£ billion) 97.3 90.2 75.3 39.4 12.8 -5.2 -7.0<br />
Cyclically-adjusted net borrowing 4.1 4.2 3.7 1.9 0.6 -0.3 -0.3<br />
Current budget deficit 4.1 3.3 2.4 0.5 -0.8 -1.7 -1.7<br />
Primary balance -3.8 -3.4 -2.5 -0.3 1.3 2.1 2.1<br />
Cyclically-adjusted primary balance -2.3 -2.7 -2.2 -0.1 1.3 2.1 2.1<br />
Treaty deficit 1 5.8 5.2 4.3 2.2 0.8 0.0 -0.1<br />
Cyclically-adjusted Treaty deficit 4.2 4.4 4.0 2.0 0.8 0.0 -0.1<br />
Debt<br />
Public sector net debt 2 79.1 80.4 80.2 79.8 77.8 74.8 71.6<br />
Treaty debt 3 87.9 88.4 89.7 89.7 88.2 85.7 82.8<br />
Memo: Output gap -2.0 -0.8 -0.4 -0.2 0.0 0.0 0.0<br />
Memo: total policy decisions 4 0.0 0.0 0.0 0.0 0.0 0.0<br />
1<br />
General government net borrowing on a Maastricht basis.<br />
2<br />
Debt at end March; GDP centred on end March.<br />
3<br />
General government gross debt on a Maastricht basis.<br />
4<br />
Equivalent to the 'Total policy decisions' line in Table 2.1.<br />
Source: Office for National Statistics, Office for Budget Responsibility and HM Treasury calculations.<br />
1.59 The OBR’s March 2015 ‘Economic and fiscal outlook’ includes a comparison of key fiscal<br />
aggregates to Autumn Statement 2014. Public sector net borrowing is forecast to be £7.2<br />
billion lower in 2014-15 than in 2013-14, and it continues to fall year on year throughout the<br />
forecast period. Public sector net debt has been revised down relative to Autumn Statement<br />
2014 from 2015-16 onwards in both cash terms and as a share of GDP. By the end of the<br />
forecast period, public sector net debt is forecast to be 71.6% of GDP, 1.2 percentage points<br />
lower than forecast at Autumn Statement 2014.<br />
41<br />
‘Public Sector Finances’, ONS, January 2015.<br />
22 Budget 2015