
Create successful ePaper yourself
Turn your PDF publications into a flip-book with our unique Google optimized e-Paper software.
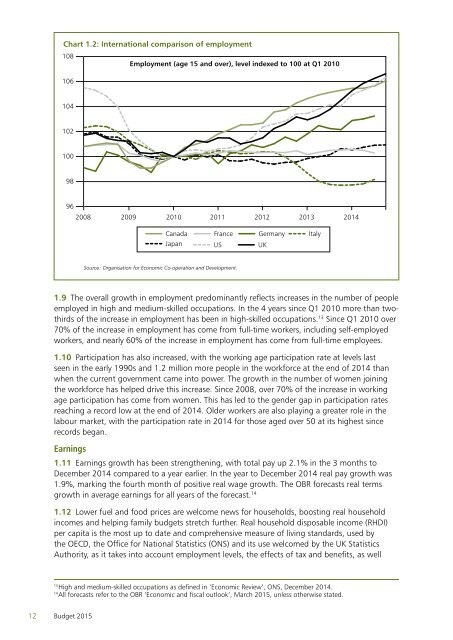
Chart 1.2: International comparison of employment<br />
108<br />
Employment (age 15 and over), level indexed to 100 at Q1 2010<br />
106<br />
104<br />
102<br />
100<br />
98<br />
96<br />
2008<br />
2009<br />
2010<br />
2011<br />
2012<br />
2013<br />
2014<br />
Canada France Germany Italy<br />
Japan US<br />
UK<br />
Source: Organisation for Economic Co-operation and Development.<br />
1.9 The overall growth in employment predominantly reflects increases in the number of people<br />
employed in high and medium-skilled occupations. In the 4 years since Q1 2010 more than twothirds<br />
of the increase in employment has been in high-skilled occupations. 13 Since Q1 2010 over<br />
70% of the increase in employment has come from full-time workers, including self-employed<br />
workers, and nearly 60% of the increase in employment has come from full-time employees.<br />
1.10 Participation has also increased, with the working age participation rate at levels last<br />
seen in the early 1990s and 1.2 million more people in the workforce at the end of 2014 than<br />
when the current government came into power. The growth in the number of women joining<br />
the workforce has helped drive this increase. Since 2008, over 70% of the increase in working<br />
age participation has come from women. This has led to the gender gap in participation rates<br />
reaching a record low at the end of 2014. Older workers are also playing a greater role in the<br />
labour market, with the participation rate in 2014 for those aged over 50 at its highest since<br />
records began.<br />
Earnings<br />
1.11 Earnings growth has been strengthening, with total pay up 2.1% in the 3 months to<br />
December 2014 compared to a year earlier. In the year to December 2014 real pay growth was<br />
1.9%, marking the fourth month of positive real wage growth. The OBR forecasts real terms<br />
growth in average earnings for all years of the forecast. 14<br />
1.12 Lower fuel and food prices are welcome news for households, boosting real household<br />
incomes and helping family budgets stretch further. Real household disposable income (RHDI)<br />
per capita is the most up to date and comprehensive measure of living standards, used by<br />
the OECD, the Office for National Statistics (ONS) and its use welcomed by the UK Statistics<br />
Authority, as it takes into account employment levels, the effects of tax and benefits, as well<br />
13<br />
High and medium-skilled occupations as defined in ‘Economic Review’, ONS, December 2014.<br />
14<br />
All forecasts refer to the OBR ‘Economic and fiscal outlook’, March 2015, unless otherwise stated.<br />
12 Budget 2015