1 Introduction 2 Compilation 3 Running the program - Lammps
1 Introduction 2 Compilation 3 Running the program - Lammps
1 Introduction 2 Compilation 3 Running the program - Lammps

You also want an ePaper? Increase the reach of your titles
YUMPU automatically turns print PDFs into web optimized ePapers that Google loves.
1 <strong>Introduction</strong><br />
This code is primarily written to visualize <strong>the</strong>rmodynamic data which LAMMPS output in log files<br />
for its quick analysis, after as well as during <strong>the</strong> simulation. For example, this could be used<br />
to visually observe trends in different <strong>the</strong>rmodynamic outputs such as computes, variables, fixes,<br />
which can be output through <strong>the</strong>rmo style command. The code works with both line and multi<br />
format of <strong>the</strong>rmo style as well as with <strong>the</strong>rmo style custom in an user friendly manner. The code<br />
essentially writes a file temp, compatible with Xmgrace and <strong>the</strong>n plots it in Xmgrace in <strong>the</strong> final stage<br />
of its execution.<br />
2 <strong>Compilation</strong><br />
g++ -O3 -Wno-deprecated <strong>the</strong>rmo_extract.cpp -lm -o <strong>the</strong>rm<br />
Move <strong>the</strong> executable to /usr/local/bin or any o<strong>the</strong>r directory which is in your path (or add <strong>the</strong> current<br />
directory to your $PATH) so that it can be accessed easily from any directory.<br />
3 <strong>Running</strong> <strong>the</strong> <strong>program</strong><br />
The syntax to run <strong>the</strong> executable is<br />
<strong>the</strong>rm path_to_logfile<br />
To read data from multiple log files, <strong>the</strong> syntax is<br />
<strong>the</strong>rm path_to_logfile1 path_to_logfile2 path_to_logfile3 ... ...<br />
or if all <strong>the</strong> log files are in <strong>the</strong> same directory and are named log.1, log.2, log.3 etc., <strong>the</strong>y can be<br />
read in short as<br />
<strong>the</strong>rm log.*<br />
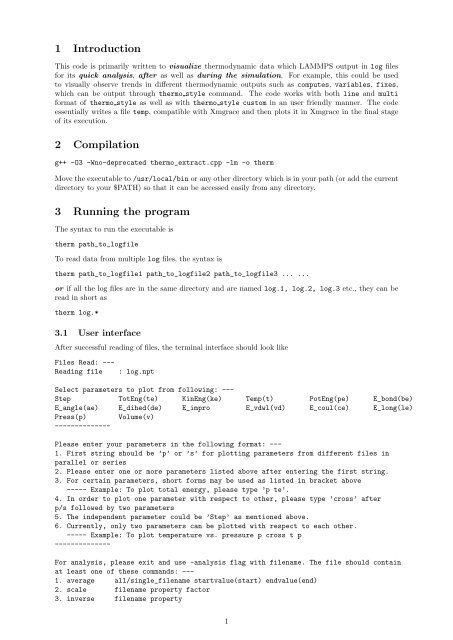
3.1 User interface<br />
After successful reading of files, <strong>the</strong> terminal interface should look like<br />
Files Read: ---<br />
Reading file<br />
: log.npt<br />
Select parameters to plot from following: ---<br />
Step TotEng(te) KinEng(ke) Temp(t) PotEng(pe) E_bond(be)<br />
E_angle(ae) E_dihed(de) E_impro E_vdwl(vd) E_coul(ce) E_long(le)<br />
Press(p) Volume(v)<br />
--------------<br />
Please enter your parameters in <strong>the</strong> following format: ---<br />
1. First string should be ’p’ or ’s’ for plotting parameters from different files in<br />
parallel or series<br />
2. Please enter one or more parameters listed above after entering <strong>the</strong> first string.<br />
3. For certain parameters, short forms may be used as listed in bracket above<br />
----- Example: To plot total energy, please type ’p te’.<br />
4. In order to plot one parameter with respect to o<strong>the</strong>r, please type ’cross’ after<br />
p/s followed by two parameters<br />
5. The independent parameter could be ’Step’ as mentioned above.<br />
6. Currently, only two parameters can be plotted with respect to each o<strong>the</strong>r.<br />
----- Example: To plot temperature vs. pressure p cross t p<br />
--------------<br />
For analysis, please exit and use -analysis flag with filename. The file should contain<br />
at least one of <strong>the</strong>se commands: ---<br />
1. average all/single_filename startvalue(start) endvalue(end)<br />
2. scale filename property factor<br />
3. inverse filename property<br />
1
4. write Under Coding<br />
5. subtract property1 property2 filename outputpropertyname<br />
6. add Under Coding<br />
--------------<br />
Enter <strong>the</strong> parameter(s) of which you want <strong>the</strong> plot for files, read successfully:<br />
Although this interface is self-explanatory by large, brief summary is provided below. First it shows which<br />
files have been read successfully through "Files Read:" portion. Then, it shows <strong>the</strong> available parameters<br />
which can be plotted (which in current case are generic <strong>the</strong>rmo style multi option parameters). The<br />
code automatically scans for <strong>the</strong>rmo style parameters within <strong>the</strong> log file and prints <strong>the</strong>m out for you.<br />
Then, it lists <strong>the</strong> brief description of different options which are available for input.<br />
3.2 Entering required input<br />
The code allows <strong>the</strong> multiple files to be read ei<strong>the</strong>r in series or in parallel<br />
• Series: This means that <strong>the</strong> similar data (like temperature) of multiple log files will be stored<br />
in a single vector in a sequence, corresponding to sequence of input files. This will be plotted as<br />
single entity in Xmgrace. For such case an abbreviated letter "s" is used as an input. For example,<br />
it could be used to plot a parameter from a set of simulations that were run successively and <strong>the</strong><br />
output was stored in separate files.<br />
• Parallel: This means <strong>the</strong> similar data (like temperature) of multiple files will be stored in different<br />
vectors and will be plotted as different entities (in different colors) in Xmgrace. For such case an<br />
abbreviated letter "p" is used as an input.<br />
Before we proceed fur<strong>the</strong>r, I would like to mention that <strong>the</strong> code also recognizes abbreviated codes for<br />
several popular parameters. These are given in ”paren<strong>the</strong>sis” right next to corresponding parameters.<br />
For example, t, p, ke, and v can be written instead of Temp, Press, KinEng, and Volume, respectively.<br />
Here are few examples along with <strong>the</strong>ir explanations.<br />
p t<br />
will plot temperature as a function of number of points (not MD time) from <strong>the</strong> log file(s). If two<br />
or more files were read, it will plot <strong>the</strong> temperature for all separate files in different colors.<br />
p p<br />
will plot pressure as a function of number of points from <strong>the</strong> log file(s). If two or more files were read,<br />
it will plot <strong>the</strong> pressure for all separate files in different colors.<br />
p te vd ke<br />
will plot total energy, van der Waals energy and kinetic energy as a function of number of points<br />
from <strong>the</strong> log file(s). For example, if two files are read, it will result in 6 different plots in Xmgrace, i.e.,<br />
3 plots for each file.<br />
s t<br />
will plot temperature in a series manner, i.e., if you have more than one file, it will plotted as a single<br />
entity with respect to number of points from both files.<br />
s te vd<br />
will plot total energy and van der Waals energy in series in two plots.<br />
3.3 Few o<strong>the</strong>r features<br />
• The code plots <strong>the</strong> datapoints not only from finished runs but also from simulations currently being<br />
run. In a half-complete file (simulation being run), it rejects <strong>the</strong> last line of <strong>the</strong> log file and plots<br />
<strong>the</strong> rest.<br />
• The code also puts out appropriate legend information for each data set in <strong>the</strong> Xmgrace automatically.<br />
For ”parallel” case, it is "filename:parameter". For ”series” case it is just "parameter".<br />
2
• Ano<strong>the</strong>r functionality of <strong>the</strong> code is in "cross" option at input line. This option can be used<br />
to plot one quantity with respect to ano<strong>the</strong>r to observe some sort of possible correlations. Lets<br />
say if we want to plot pressure vs volume (although both are fluctuating significantly during <strong>the</strong><br />
simulation), we will write at user input line,<br />
p cross p v<br />
This command will plot all <strong>the</strong> simulation data points of pressure (ordinate) with respect to<br />
volume (abscissa).<br />
• As it was mentioned before that <strong>the</strong> X-axis is not "time" but "number of points", it can easily be<br />
changed to time within Xmgrace graphical user interface by rescaling X-axis appropriately though<br />
Data → Transformations → Geometric transform → Scale X option.<br />
3.4 Optional commands<br />
Currently <strong>the</strong> codes have two optional command-line parameters that could be put in for special cases.<br />
• -leave option: This option is used when certain sections of <strong>the</strong> logfile need to be skipped. For<br />
example, if <strong>the</strong> logfile contains data from a) minimization run followed by b) NVT simulation run<br />
followed by c) NPT simulation for X steps. If you want to plot volume in Xmgrace which only<br />
comes at NPT stage, it following command should be issued.<br />
"<strong>the</strong>rm -leave 2 logfile" followed by "p v" when it asks for required input after it reads <strong>the</strong><br />
logfile. This will skip first two runs from plotting and will only plot <strong>the</strong> 3 rd NPT run.<br />
• -anal option: This option can be used to do some preliminary analysis on data, stored in logfile.<br />
The analysis, in principle, can also be done in Xmgrace itself (after code plots <strong>the</strong> data) using<br />
Xmgrace options through its graphical user interface. This part is not fully coded yet. In order<br />
to use this option, one needs to create a file with input analysis information stored in following<br />
syntax. These are all separate examples commands and can be written in any order or only one of<br />
<strong>the</strong>m. Lets call <strong>the</strong> file "analysis".<br />
average all start end<br />
average all 5000 end<br />
average logfile 5000 10000<br />
scale logfile Volume 0.001<br />
inverse<br />
subtract<br />
logfile Volume<br />
TotEng KinEng logfile Diff<br />
On <strong>the</strong> terminal, <strong>the</strong> command to be executed should be<br />
<strong>the</strong>rm -anal analysis logfile<br />
When executed, <strong>the</strong> following set of commands in <strong>the</strong> analysis file will result in <strong>the</strong> following.<br />
– average all start end: This will print out average as well as standard deviation of all<br />
quantities (which are mentioned in input) for all files on <strong>the</strong> terminal. Here, <strong>the</strong> average will<br />
be done from <strong>the</strong> start to <strong>the</strong> end of <strong>the</strong> simulation data.<br />
– average all 5000 end: This will print out average as well as standard deviation of all<br />
quantities (which are mentioned in input) for all files on <strong>the</strong> terminal. However, in this case,<br />
<strong>the</strong> code will skip first 5000 data points and will printout average and standard deviation for<br />
<strong>the</strong> rest of <strong>the</strong> data.<br />
– average logfile 5000 10000: This will print out average as well as standard deviation of<br />
all quantities (which are mentioned in input) for logfile on <strong>the</strong> terminal. In this case, <strong>the</strong><br />
code will only average data points from 5000 to 10000. This command used repeatedly could<br />
be employed for calculating block averages of various quantities.<br />
– scale logfile Volume 0.001: This command will scale <strong>the</strong> Volume data points in logfile<br />
by a factor of 0.001 and will plot <strong>the</strong> resultant quantity in Xmgrace.<br />
3
– inverse logfile Volume: This command will inverse <strong>the</strong> Volume data points in logfile<br />
and plot <strong>the</strong> resultant quantity in Xmgrace.<br />
– subtract TotEng KinEng logfile Diff: This command will take <strong>the</strong> difference TotEng -<br />
KinEng in logfile and plot <strong>the</strong> resultant quantity Diff in Xmgrace.<br />
4 Changing <strong>the</strong> formatting of data in Xmgrace<br />
The Xmgrace offers several plotting styles for fonts, data points representation, lines, axes representations,<br />
overall graph representations. The current code overwrites some of <strong>the</strong>se representation features<br />
for a visual representation which I like better. However, one could easily change <strong>the</strong>se properties by<br />
changing symbol and line properties in plot xmgrace() function.<br />
Contact Information:<br />
In case of any questions, please contact Vikas Varshney @ vv0210 at gmail dot com<br />
4