Emission Inspection of In-use Vehicle in Bangladesh - CASE
Emission Inspection of In-use Vehicle in Bangladesh - CASE
Emission Inspection of In-use Vehicle in Bangladesh - CASE

Create successful ePaper yourself
Turn your PDF publications into a flip-book with our unique Google optimized e-Paper software.
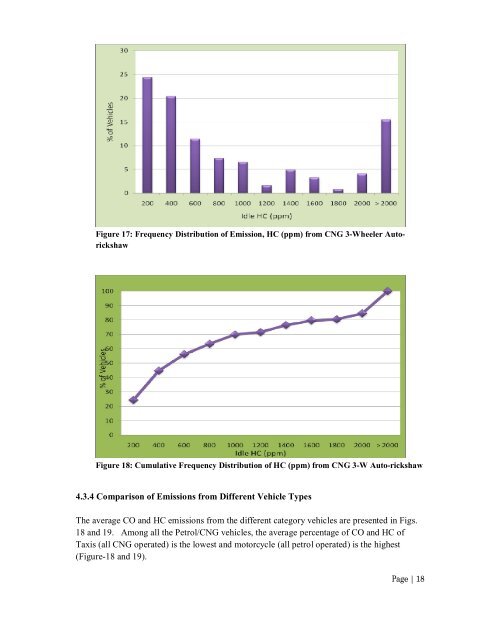
Figure 17: Frequency Distribution <strong>of</strong> <strong>Emission</strong>, HC (ppm) from CNG 3-Wheeler Autorickshaw<br />
Figure 18: Cumulative Frequency Distribution <strong>of</strong> HC (ppm) from CNG 3-W Auto-rickshaw<br />
4.3.4 Comparison <strong>of</strong> <strong>Emission</strong>s from Different <strong>Vehicle</strong> Types<br />
The average CO and HC emissions from the different category vehicles are presented <strong>in</strong> Figs.<br />
18 and 19. Among all the Petrol/CNG vehicles, the average percentage <strong>of</strong> CO and HC <strong>of</strong><br />
Taxis (all CNG operated) is the lowest and motorcycle (all petrol operated) is the highest<br />
(Figure-18 and 19).<br />
Page | 18