Lecture Series 20: Demand and Supply Analysis
Lecture Series 20: Demand and Supply Analysis
Lecture Series 20: Demand and Supply Analysis

You also want an ePaper? Increase the reach of your titles
YUMPU automatically turns print PDFs into web optimized ePapers that Google loves.
DEMAND AND SUPPLY ANALYSIS<br />
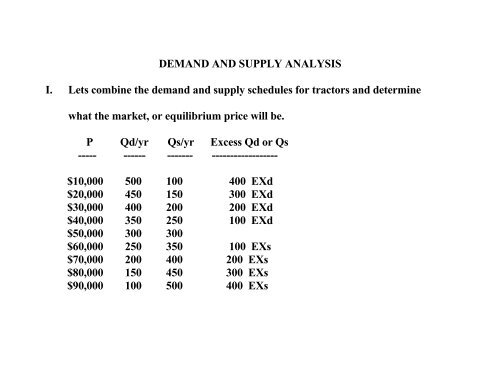
I. Lets combine the dem<strong>and</strong> <strong>and</strong> supply schedules for tractors <strong>and</strong> determine<br />
what the market, or equilibrium price will be.<br />
P Qd/yr Qs/yr Excess Qd or Qs<br />
----- ------ ------- ------------------<br />
$10,000 500 100 400 EXd<br />
$<strong>20</strong>,000 450 150 300 EXd<br />
$30,000 400 <strong>20</strong>0 <strong>20</strong>0 EXd<br />
$40,000 350 250 100 EXd<br />
$50,000 300 300<br />
$60,000 250 350 100 EXs<br />
$70,000 <strong>20</strong>0 400 <strong>20</strong>0 EXs<br />
$80,000 150 450 300 EXs<br />
$90,000 100 500 400 EXs
II. Graphic Representation of Selected Goods <strong>and</strong> Market Situations:<br />
Price<br />
A)<br />
S<br />
D<br />
Quantity / unit of time<br />
Does a market exist for this good?<br />
• No. The good costs too much to produce.
B)<br />
Price<br />
D<br />
S<br />
Quantity / unit of time<br />
What does this graph represent?<br />
• A free good. The entire quantity dem<strong>and</strong>ed is available at a price of zero.
C)<br />
Price<br />
• A scarce commodity.<br />
S<br />
D<br />
Quantity / unit time<br />
What does this graph represent?
P1<br />
P0<br />
III. How is price affected when dem<strong>and</strong> curves shift?<br />
• An increase in dem<strong>and</strong> while holding supply constant will cause a price increase.<br />
• A decrease in dem<strong>and</strong> while holding supply constant will cause a price decrease.<br />
Price<br />
D0<br />
D1<br />
Quantity / unit time<br />
In this case, the increase in dem<strong>and</strong> caused price to rise from P0 to P1.
P0<br />
P1<br />
IV. How is price affected when supply curves shift ?<br />
• An increase in supply while holding dem<strong>and</strong> constant will cause a price decrease.<br />
• A decrease in supply while holding dem<strong>and</strong> constant will cause a price increase.<br />
Price<br />
S0<br />
S1<br />
Quantity / unit time<br />
In this case, the increase in supply caused the price to fall from P0 to P1.<br />
D
Pc<br />
Pe<br />
Pp<br />
V. The affect of a chewing tobacco tax charged to producer:<br />
Price<br />
D<br />
Tax<br />
S1<br />
S0<br />
Quantity / unit time<br />
Tax = $.05 on every pack, charged to the producer<br />
This serves to shift the supply curve up $.05 to S1<br />
Pp = price after the tax, price the producer receives<br />
Pc = Price after the tax, price the consumer pays<br />
Qt = quantity dem<strong>and</strong>ed after the tax
Notice that Pc - Pe < tax. Therefore, the tax is not completely passed to the consumer.<br />
The producer bears some of the burden of the tax.<br />
A) If the dem<strong>and</strong> curve was perfectly inelastic, the entire tax would be passed<br />
to the consumer.<br />
B) If the dem<strong>and</strong> curve was perfectly elastic, the entire tax would be paid by<br />
the producer.
Pc<br />
Pe<br />
Pp<br />
VI. What if a sales tax (paid by consumers) is placed on chewing tobacco ?<br />
Price<br />
Tax<br />
D1<br />
D0<br />
S<br />
Quantity / unit time<br />
1) <strong>Dem<strong>and</strong></strong> curve shifts down by the amount of the tax because the tax<br />
reduces disposable income.<br />
2) Therefore it makes no difference on whether a tax is placed on the<br />
consumer or on the producer.
Pc<br />
Pp<br />
VII. Who bears the burden of an excise or sales tax ?<br />
Price<br />
A) If dem<strong>and</strong> is perfectly inelastic:<br />
D<br />
Tax<br />
S1<br />
S0<br />
Quantity / unit time<br />
In this case, the consumer pays the entire tax.
Pc<br />
Pp<br />
Price<br />
B) If dem<strong>and</strong> is perfectly elastic:<br />
Tax<br />
S1<br />
S0<br />
D<br />
Quantity / unit time<br />
In this case, the producer pays the entire tax.
Price<br />
Pc<br />
Pp<br />
C) If the supply curve is perfectly elastic:<br />
Tax<br />
S1<br />
S0<br />
D<br />
Quantity / unit of time<br />
In this case, the consumer pays the entire tax.
Pc<br />
Pp<br />
Price<br />
D) If the supply curve is perfectly inelastic:<br />
S<br />
Tax<br />
D1<br />
D0<br />
Quantity / unit time<br />
In this case, the producer pays the entire tax.
Pc<br />
Pe<br />
Pp<br />
VIII. The easiest way to see the affect of an excise tax is to insert a wedge<br />
Price<br />
on the LEFT HAND side of equilibrium.<br />
C<br />
A<br />
B<br />
Tax<br />
D0<br />
QT Qe Quantity / unit time<br />
S
A) Look at a $.50 excise tax.<br />
B) Area under the dem<strong>and</strong> curve represents the value of the commodity to<br />
society.<br />
C) Area under the supply curve represents the value of the resources or the<br />
cost to society.<br />
D) What does the shaded triangle represent?<br />
• It is a lost to society, a welfare loss, or an efficiency loss.<br />
• Why? We have saved resources by reducing production but the<br />
value of the output not produced is greater than the resources saved.
Pp<br />
Pe<br />
Pc<br />
IX. The effect of a subsidy:<br />
Price<br />
D<br />
S0<br />
Subsidy<br />
Quantity / unit time
A) Wedge is inserted on the RIGHT HAND side of equilibrium.<br />
B) The result is too much production.<br />
C) Who actually pays the subsidy? Tax payers: consumers.<br />
D) Again we have an efficiency loss equal to the shaded triangle. The value of<br />
the extra output is less than the value of the resources used to produce it.