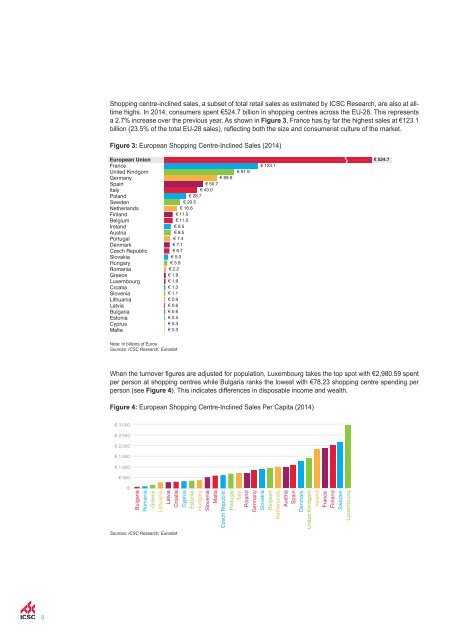
Shopping centre-inclined sales, a subset of total retail sales as estimated by ICSC Research, are also at alltime highs. In 2014, consumers spent €524.7 billion in shopping centres across the EU-28. This represents a 2.7% increase over the previous year. As shown in Figure 3, France has by far the highest sales at €123.1 billion (23.5% of the total EU-28 sales), reflecting both the size and consumerist culture of the market. Figure 3: European Shopping Centre-Inclined Sales (2014) European Union France United Kindgom Germany Spain Italy Poland Sweden Netherlands Finland Belgium Ireland Austria Portugal Denmark Czech Republic Slovakia Hungary Romania Greece Luxembourg Croatia Slovenia Lithuania Latvia Bulgaria Estonia Cyprus Malta € 69.9 € 50.7 € 43.0 € 28.7 € 20.5 € 16.6 € 11.0 € 11.0 € 8.5 € 8.5 € 7.4 € 7.1 € 6.7 € 5.0 € 3.9 € 2.2 € 1.9 € 1.6 € 1.3 € 1.1 € 0.9 € 0.6 € 0.6 € 0.5 € 0.3 € 0.3 € 91.9 € 123.1 € 524.7 Note: In billions of Euros Sources: ICSC Research; Eurostat When the turnover figures are adjusted for population, Luxembourg takes the top spot with €2,980.59 spent per person at shopping centres while Bulgaria ranks the lowest with €78.23 shopping centre spending per person (see Figure 4). This indicates differences in disposable income and wealth. Figure 4: European Shopping Centre-Inclined Sales Per Capita (2014) € 3,000 € 2,500 € 2,000 € 1,500 € 1,000 € 500 € Bulgaria Romania Greece Lithuania Latvia Croatia Sources: ICSC Research; Eurostat Cyprus Estonia Hungary Slovenia Malta Czech Republic Portugal Italy Poland Germany Slovakia Belgium Netherlands Austria Spain Denmark United Kindgom Ireland France Finland Sweden Luxembourg 8
B. <strong>SHOPPING</strong> CENTRE VITAL SIGNS At the European aggregate, the industry’s vital signs are strong and retail real estate continues to perform well as measured by a number of key indicators. Of course, there is a great deal of variation across shopping centre markets from country to country and between different types of centres. On a square-metre basis, retail real estate represents just over a quarter of all commercial real estate space in Europe (25.7%). It is important to note that while other real estate asset classes are heavily concentrated in principal cities, retail real estate and the services it accommodates are more widely distributed across countries, regional and sub-regional markets. The retail market penetrates—and represents an important civic function in—virtually every community in Europe. SIGNIFICANCE <strong>OF</strong> <strong>EUROPEAN</strong> RETAIL REAL ESTATE SECTOR: The European shopping centre industry represents a major sector of the economy, which explains why policymakers are keen to understand the direct and indirect effects of existing and proposed regulation on the industry. As shown in Figure 5, there is almost 190 million sq m of shopping centre gross leasable area (GLA) across the 34 European countries analysed. The mature retail markets of UK, France and Germany lead the way, followed closely by the large and fast-growing Russian market. In total, this space encompasses 9,263 centres, which includes 6,972 traditional shopping centres, 2,067 retail parks and 224 factory outlets. Figure 5: European Shopping Centre Stock (2014) TRADITIONAL FACTORY OUTLET RETAIL PARKS TOTAL Count Floorspace Count Floorspace Count Floorspace Count Floorspace Austria 146 2,787,790 6 125,000 66 779,440 218 3,692,230 Belgium 63 1,286,161 4 62,230 69 1,041,329 136 2,389,720 Bulgaria 23 755,183 1 15,000 5 137,873 29 908,056 Croatia 50 1,275,769 1 15,250 4 67,774 55 1,358,793 Cyprus 0 0 0 0 0 0 0 0 Czech Republic 84 1,567,715 2 47,600 51 460,974 137 2,076,289 Denmark 105 1,760,151 2 23,000 1 44,000 108 1,827,151 Estonia 35 654,297 0 0 0 0 35 654,297 Finland 103 2,098,844 0 0 11 128,100 114 2,226,944 France 787 17,661,498 22 435,081 322 5,371,437 1131 23,468,016 Germany 584 14,402,212 13 171,500 155 3,090,057 752 17,663,769 Greece 31 606,125 8 96,850 6 190,680 45 893,655 Hungary 60 1,367,472 2 29,900 18 467,400 80 1,864,772 Ireland 101 1,642,170 2 24,758 56 804,259 159 2,471,187 Italy 753 13,779,802 22 596,216 63 1,124,147 838 15,500,165 Latvia 42 569,043 0 0 2 46,000 44 615,043 Lithuania 43 926,762 0 0 6 150,150 49 1,076,912 Luxembourg 12 283,545 0 0 7 84,359 19 367,904 Malta 10 114,024 0 0 0 0 10 114,024 Netherlands 498 6,072,518 3 81,400 5 55,600 506 6,209,518 Poland 391 9,336,039 11 176,300 50 969,340 452 10,481,679 Portugal 116 2,805,244 6 236,860 29 356,849 151 3,398,953 Romania 123 2,826,289 1 16,000 18 214,542 142 3,056,831 Slovakia 60 1,110,735 0 0 31 263,347 91 1,374,082 Slovenia 41 786,575 0 0 2 46,100 43 832,675 Spain 424 10,957,305 17 211,678 76 2,034,783 517 13,203,766 Sweden 223 4,058,801 2 31,875 79 3,030,940 304 7,121,616 United Kingdom 718 17,093,612 37 640,155 916 11,519,918 1671 29,253,685 EU-28 Total 5,626 118,585,681 162 3,036,653 2,048 32,479,398 7,836 154,101,732 Bosnia and Herzegovina 16 241,263 1 17,000 0 0 17 258,263 Norway 322 4,613,571 1 15,000 0 0 323 4,628,571 Russia 510 17,096,725 3 77,124 3 139,300 516 17,313,149 Serbia 27 433,400 3 55,500 3 57,650 33 546,550 Switzerland 188 2,795,038 6 79,700 4 63,466 198 2,938,204 Turkey 283 8,259,251 48 1,343,423 9 292,453 340 9,895,127 Greater-European Total 6,972 152,024,929 224 4,624,400 2,067 33,032,267 9,263 189,681,596 Note: Floorspace represents GLA in square metres Sources: Cushman & Wakefield; HUI Research; Trevor Woods Associates 9