THE SOCIO-ECONOMIC CONTRIBUTION OF EUROPEAN SHOPPING CENTRES

Create successful ePaper yourself
Turn your PDF publications into a flip-book with our unique Google optimized e-Paper software.
B. <strong>SHOPPING</strong> CENTRE VITAL SIGNS<br />
At the European aggregate, the industry’s vital signs are strong and retail real estate continues to perform<br />
well as measured by a number of key indicators. Of course, there is a great deal of variation across shopping<br />
centre markets from country to country and between different types of centres.<br />
On a square-metre basis, retail real estate represents just over a quarter of all commercial real estate space<br />
in Europe (25.7%). It is important to note that while other real estate asset classes are heavily concentrated<br />
in principal cities, retail real estate and the services it accommodates are more widely distributed across<br />
countries, regional and sub-regional markets. The retail market penetrates—and represents an important<br />
civic function in—virtually every community in Europe.<br />
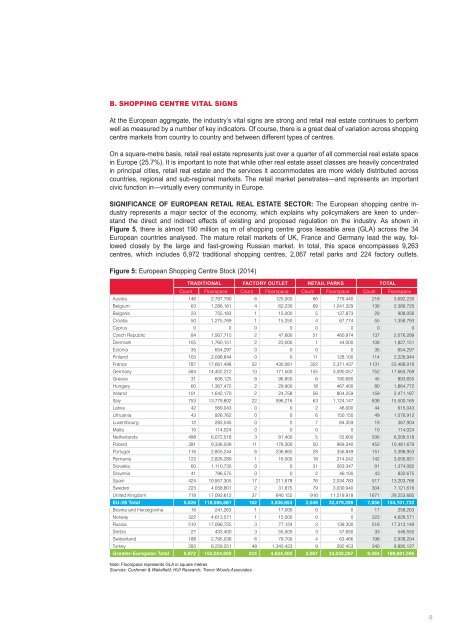
SIGNIFICANCE <strong>OF</strong> <strong>EUROPEAN</strong> RETAIL REAL ESTATE SECTOR: The European shopping centre industry<br />
represents a major sector of the economy, which explains why policymakers are keen to understand<br />
the direct and indirect effects of existing and proposed regulation on the industry. As shown in<br />
Figure 5, there is almost 190 million sq m of shopping centre gross leasable area (GLA) across the 34<br />
European countries analysed. The mature retail markets of UK, France and Germany lead the way, followed<br />
closely by the large and fast-growing Russian market. In total, this space encompasses 9,263<br />
centres, which includes 6,972 traditional shopping centres, 2,067 retail parks and 224 factory outlets.<br />
Figure 5: European Shopping Centre Stock (2014)<br />
TRADITIONAL FACTORY OUTLET RETAIL PARKS TOTAL<br />
Count Floorspace Count Floorspace Count Floorspace Count Floorspace<br />
Austria 146 2,787,790 6 125,000 66 779,440 218 3,692,230<br />
Belgium 63 1,286,161 4 62,230 69 1,041,329 136 2,389,720<br />
Bulgaria 23 755,183 1 15,000 5 137,873 29 908,056<br />
Croatia 50 1,275,769 1 15,250 4 67,774 55 1,358,793<br />
Cyprus 0 0 0 0 0 0 0 0<br />
Czech Republic 84 1,567,715 2 47,600 51 460,974 137 2,076,289<br />
Denmark 105 1,760,151 2 23,000 1 44,000 108 1,827,151<br />
Estonia 35 654,297 0 0 0 0 35 654,297<br />
Finland 103 2,098,844 0 0 11 128,100 114 2,226,944<br />
France 787 17,661,498 22 435,081 322 5,371,437 1131 23,468,016<br />
Germany 584 14,402,212 13 171,500 155 3,090,057 752 17,663,769<br />
Greece 31 606,125 8 96,850 6 190,680 45 893,655<br />
Hungary 60 1,367,472 2 29,900 18 467,400 80 1,864,772<br />
Ireland 101 1,642,170 2 24,758 56 804,259 159 2,471,187<br />
Italy 753 13,779,802 22 596,216 63 1,124,147 838 15,500,165<br />
Latvia 42 569,043 0 0 2 46,000 44 615,043<br />
Lithuania 43 926,762 0 0 6 150,150 49 1,076,912<br />
Luxembourg 12 283,545 0 0 7 84,359 19 367,904<br />
Malta 10 114,024 0 0 0 0 10 114,024<br />
Netherlands 498 6,072,518 3 81,400 5 55,600 506 6,209,518<br />
Poland 391 9,336,039 11 176,300 50 969,340 452 10,481,679<br />
Portugal 116 2,805,244 6 236,860 29 356,849 151 3,398,953<br />
Romania 123 2,826,289 1 16,000 18 214,542 142 3,056,831<br />
Slovakia 60 1,110,735 0 0 31 263,347 91 1,374,082<br />
Slovenia 41 786,575 0 0 2 46,100 43 832,675<br />
Spain 424 10,957,305 17 211,678 76 2,034,783 517 13,203,766<br />
Sweden 223 4,058,801 2 31,875 79 3,030,940 304 7,121,616<br />
United Kingdom 718 17,093,612 37 640,155 916 11,519,918 1671 29,253,685<br />
EU-28 Total 5,626 118,585,681 162 3,036,653 2,048 32,479,398 7,836 154,101,732<br />
Bosnia and Herzegovina 16 241,263 1 17,000 0 0 17 258,263<br />
Norway 322 4,613,571 1 15,000 0 0 323 4,628,571<br />
Russia 510 17,096,725 3 77,124 3 139,300 516 17,313,149<br />
Serbia 27 433,400 3 55,500 3 57,650 33 546,550<br />
Switzerland 188 2,795,038 6 79,700 4 63,466 198 2,938,204<br />
Turkey 283 8,259,251 48 1,343,423 9 292,453 340 9,895,127<br />
Greater-European Total 6,972 152,024,929 224 4,624,400 2,067 33,032,267 9,263 189,681,596<br />
Note: Floorspace represents GLA in square metres<br />
Sources: Cushman & Wakefield; HUI Research; Trevor Woods Associates<br />
9