San Benito County Water District San Benito County Water District
San Benito County Water District San Benito County Water District
San Benito County Water District San Benito County Water District

You also want an ePaper? Increase the reach of your titles
YUMPU automatically turns print PDFs into web optimized ePapers that Google loves.
<strong>San</strong> <strong>Benito</strong> <strong>County</strong><br />
<strong>Water</strong> <strong>District</strong><br />
Annual Groundwater Report<br />
for <strong>Water</strong> Year 2008<br />
December 15, 2008<br />
Todd Engineers<br />
Emeryville, California<br />
with<br />
Gus Yates, Consulting Hydrologist<br />
Berkeley, , California
SAN BENITO COUNTY WATER DISTRICT<br />
ANNUAL GROUNDWATER REPORT<br />
FOR<br />
WATER YEAR 2008<br />
DECEMBER 2008<br />
PREPARED FOR<br />
SAN BENITO COUNTY<br />
WATER DISTRICT<br />
PREPARED BY<br />
TODD ENGINEERS<br />
2490 MARINER SQUARE LOOP, STE. 215<br />
ALAMEDA, CA 94501<br />
PHONE: 510/747-6920<br />
FAX: 510/747-6921<br />
www.toddengineers.com
TABLE OF CONTENTS<br />
EXECUTIVE SUMMARY ................................................................................. ES-1<br />
INTRODUCTION ..................................................................................................... 1<br />
OVERVIEW OF WATER SUPPLY SYSTEM ...............................................1<br />
HYDROLOGIC CONDITIONS IN WATER YEAR 2008 .............................7<br />
WATER MANAGEMENT ACTIVITIES ............................................................... 8<br />
WATER RESOURCES PLANNING ...............................................................8<br />
RECOMMENDATION FOR 2009 ANNUAL REPORT ..............................11<br />
REPLENISHMENT OF GROUNDWATER .................................................12<br />
DISTRIBUTION OF CVP WATER ..............................................................16<br />
WATER BANKING .......................................................................................17<br />
WATER SUPPLY SOURCES AND USE ............................................................. 18<br />
WATER SUPPLY SOURCES .......................................................................18<br />
WATER USE ..................................................................................................18<br />
GROUNDWATER LEVELS AND TRENDS ....................................................... 26<br />
GROUNDWATER LEVELS .........................................................................26<br />
CHANGE IN GROUNDWATER LEVELS ..................................................27<br />
WATER BALANCE ................................................................................................ 34<br />
INFLOWS .......................................................................................................34<br />
OUTFLOWS ...................................................................................................35<br />
CHANGE IN STORAGE ...............................................................................36<br />
WATER BALANCE CONCLUSIONS .........................................................36<br />
REVENUES AND CHARGES ............................................................................... 42<br />
DISTRICT REVENUES ................................................................................42<br />
DISTRICT CHARGES ...................................................................................42<br />
CONDITIONS EXPECTED FOR WATER YEAR 2009 .................................... 44<br />
RECOMMENDATIONS ........................................................................................ 46<br />
GROUNDWATER PRODUCTION AND REPLENISHMENT ...................46<br />
CVP IMPORTS ..............................................................................................47<br />
GROUNDWATER INFRASTRUCTURE .....................................................47<br />
GROUNDWATER MONITORING ..............................................................47<br />
GROUNDWATER CHARGES .....................................................................47<br />
CONSIDERATIONS FOR FUTURE STUDIES ...........................................48<br />
CONSIDERATIONS FOR FUTURE ANNUAL REPORTS ........................48<br />
REFERENCES ........................................................................................................ 49<br />
Annual Groundwater Report for <strong>Water</strong> Year 2008 December 2008<br />
<strong>San</strong> <strong>Benito</strong> <strong>County</strong> <strong>Water</strong> <strong>District</strong>
LIST OF TABLES<br />
Table 1. Managed Percolation of CVP <strong>Water</strong> and Wastewater During <strong>Water</strong> Years 1994-2008 ...................... 15<br />
Table 2. CVP Entitlements, Allocations, and 2008 Deliveries ........................................................................... 17<br />
Table 3. <strong>Water</strong> Use in <strong>Water</strong> Year 2008 (af) ...................................................................................................... 18<br />
Table 4. Comparison of <strong>Water</strong> Use in <strong>Water</strong> Years 2007 and 2008 ................................................................... 19<br />
Table 5. Change in Storage during <strong>Water</strong> Year 2008 for Zone 6 ....................................................................... 32<br />
Table 6. <strong>Water</strong> Balance for <strong>Water</strong> Year 2006 ..................................................................................................... 37<br />
Table 7. <strong>Water</strong> Balance for <strong>Water</strong> Year 2007 ..................................................................................................... 38<br />
Table 8. <strong>Water</strong> Balance for <strong>Water</strong> Year 2008 ..................................................................................................... 39<br />
Table 9. Charges for Zone 6 <strong>Water</strong> Users, March 2008 - February 2009........................................................... 43<br />
LIST OF FIGURES<br />
Figure 1. Groundwater Basins in <strong>San</strong> <strong>Benito</strong> <strong>County</strong> ........................................................................................... 2<br />
Figure 2. Subbasin Locations ................................................................................................................................ 4<br />
Figure 3. Zone 6 Boundary ................................................................................................................................... 6<br />
Figure 4. Monthly Precipitation in <strong>Water</strong> Year 2008 ........................................................................................... 7<br />
Figure 5. Percolation Areas of Local Surface <strong>Water</strong> and CVP <strong>Water</strong> ................................................................ 13<br />
Figure 6. Reservoir Releases for Percolation ...................................................................................................... 14<br />
Figure 7. Managed Percolation 1994-2008 ......................................................................................................... 15<br />
Figure 8. <strong>Water</strong> Use in Zone 6 by User Category ............................................................................................... 21<br />
Figure 9. Total <strong>Water</strong> use by <strong>Water</strong> Type (GW and CVP) ................................................................................. 22<br />
Figure 10. Total Subbasin <strong>Water</strong> Use by <strong>Water</strong> Type ........................................................................................ 23<br />
Figure 11. CVP and Groundwater Supply by Use .............................................................................................. 24<br />
Figure 12. <strong>Water</strong> Supply Contribution of Groundwater and CVP ..................................................................... 25<br />
Figure 13. Groundwater Elevations October 2007 ............................................................................................. 28<br />
Figure 14. Profiles of Historical Groundwater Levels ........................................................................................ 29<br />
Figure 15. Depth to <strong>Water</strong> October 2007 ............................................................................................................ 30<br />
Figure 16. Groundwater Elevation Change from October 2006 to October 2007 .............................................. 31<br />
Figure 17. Hydrographs of Key Wells (inset map of well locations) ................................................................. 33<br />
Figure 18. Summary of the Zone 6 <strong>Water</strong> Budgets (2005-2008) ....................................................................... 40<br />
Figure 19. Change in Storage (1978 – 2008) ...................................................................................................... 41<br />
APPENDICES<br />
A – Reporting Requirements and Previous Annual Reports<br />
B – Climate Data<br />
C – Streamflow Data and Groundwater Elevation Data<br />
D – Managed Percolation<br />
E – <strong>Water</strong> Balance Methodology<br />
F – Charges, Revenues, and Expenditures<br />
G – List of Acronyms<br />
Annual Groundwater Report for <strong>Water</strong> Year 2008 December 2008<br />
<strong>San</strong> <strong>Benito</strong> <strong>County</strong> <strong>Water</strong> <strong>District</strong>
EXECUTIVE SUMMARY<br />
This Annual Groundwater Report for <strong>San</strong> <strong>Benito</strong> <strong>County</strong> <strong>Water</strong> <strong>District</strong> (<strong>District</strong>) describes<br />
groundwater conditions in the <strong>San</strong> <strong>Benito</strong> <strong>County</strong> portion of the Gilroy-Hollister basin. It<br />
documents water supply sources and use, groundwater levels and storage, and <strong>District</strong><br />
management activities for water year 2008. Recommendations are provided with regard to<br />
amounts of water import, groundwater replenishment, and groundwater pumping for water year<br />
2009. This report also assesses and summarizes the water balance of the groundwater basin.<br />
Rainfall amounts in water year 2008 were below average, marking the second consecutive year<br />
of below-average rainfall. CVP allocations were reduced to 40 and 75 percent of the contracted<br />
amount for agriculture and M&I respectively. This reduction was a direct result of the May<br />
2007 Federal Court decision on Delta smelt. The continued effects of the Court decision are<br />
discussed in more detail in the subsequent section on conditions expected for 2009.<br />
Total water supply decreased by 23 percent basin-wide. The reduction in CVP allocation<br />
resulted in a decrease in its use in all subbasins, with a total decrease of 47 percent in Zone 6.<br />
Groundwater pumping did not increase to fill the demand, remaining at levels similar to 2007.<br />
This lack of increase in groundwater pumping is most likely due to several factors including<br />
the loss of big contracts for lettuce growers in <strong>San</strong> <strong>Benito</strong> <strong>County</strong>, fallowing of fields, change<br />
in crop selections to less water-intensive crops (e.g., onions and garlic), and a lack of<br />
groundwater infrastructure to provide increased supply. Because these factors may only affect<br />
groundwater production in the short-term, an increase in groundwater pumping is expected in<br />
2009 if CVP allocations are reduced.<br />
Because groundwater pumping did not increase, groundwater levels have remained the same or<br />
in some parts of the basin increased slightly. Levels are still close to historical highs in all<br />
subbasins expect the Bolsa. No subbasin is currently in overdraft.<br />
<strong>Water</strong> year 2008 continued to reveal the stabilization or reversal of some previously identified<br />
trends as a result of reduced CVP imports and below-average rainfall; these include the<br />
following:<br />
• Total Zone 6 water use in 2008 decreased compared to 2007. Prior to 2007, total water<br />
use had showed a steady decline from year to year.<br />
• In 2008, groundwater pumping was much larger than the total CVP imports, as shown<br />
on Figure ES-1, reflecting the reduced CVP allocations. Over the previous four years,<br />
CVP imports were greater than groundwater.<br />
Annual Groundwater Report for <strong>Water</strong> Year 2008 December 2008<br />
<strong>San</strong> <strong>Benito</strong> <strong>County</strong> <strong>Water</strong> <strong>District</strong><br />
ES-1
Figure ES 1.<br />
Volumes of CVP Imports and<br />
Groundwater Pumping (1993-2008)<br />
<strong>Water</strong> year 2008 saw the continued active involvement of the <strong>District</strong> in water resource<br />
management projects, including regional projects as well as local cooperative efforts. Several<br />
projects were completed and approved by the <strong>District</strong> in water year 2008 including: a surface<br />
drainage study in <strong>San</strong> Juan, the Hollister Area Urban <strong>Water</strong> and Wastewater Master Plan, and<br />
the Hollister Urban Area Urban <strong>Water</strong> Management Plan (UWMP). Local studies include<br />
continued evaluation of the hydrogeology of Hollister Valley, and a series of hydrogeologic<br />
studies. The <strong>District</strong> is also working on projects with various local agencies—including the<br />
<strong>County</strong>, City of Hollister, and Sunnyslope CWD—that are focused on water and wastewater<br />
issues.<br />
In 2008, the basin water balance was updated for water years 2006, 2007, and 2008. The same<br />
methodology used in previous Annual Reports was adopted, and further documented as an<br />
Appendix to this Annual Report. The water balance provides a quantitative view of the state of<br />
the basin, providing estimates for the specific inflows and outflows of the basin or subbasins.<br />
While many of the values presented in the table are estimates, the relative magnitude of each<br />
water balance element helps illustrate the mechanisms at work in the basin. This detailed<br />
understanding of the groundwater system can serve as a basis to compare changes in the basin<br />
over time and provide valuable tools for groundwater basin management. The end goal of the<br />
water balance is to estimate inflows and outflows to each subbasin and then compare these to<br />
calculate a groundwater change in storage. In addition to comparing the estimated total inflows<br />
and outflows, changes in storage by subbasin are estimated independently using water level<br />
changes and aquifer storavity values. The water balance is prepared for each water year and for<br />
each subbasin.<br />
In general, groundwater outflows in Zone 6 remained fairly constant while inflows varied<br />
based on the hydrologic condition of the basin. The <strong>District</strong> should continue to manage<br />
groundwater levels (and therefore groundwater storage) by augmenting the inflows when water<br />
is available through managed percolation or other methods. Active management of the<br />
groundwater basin can help ensure that water supply is available when needed.<br />
Recently, the <strong>District</strong> revised its methodology for determining groundwater charges. Based on<br />
this method, a 2009 groundwater charge of $2.50 per af is recommended for agricultural use in<br />
Annual Groundwater Report for <strong>Water</strong> Year 2008 December 2008<br />
<strong>San</strong> <strong>Benito</strong> <strong>County</strong> <strong>Water</strong> <strong>District</strong><br />
ES-2
Zone 6 and a groundwater charge of $22.50 per af is recommended for M&I use in Zone 6.<br />
While the revised method is justifiable and reasonable, it is recommended that the <strong>District</strong><br />
consider a longer term rate plan with a broader justification for groundwater charges. The<br />
<strong>District</strong> also renegotiated its contract with the U.S. Bureau of Reclamation for CVP water<br />
deliveries, changing the way existing capital costs are repaid.<br />
<strong>Water</strong> supply for 2009 will depend on factors including rainfall, local surface water storage,<br />
groundwater storage, and CVP operations and storage. Next year, water supply also will be<br />
impacted by court decisions on the Delta smelt, longfin smelt, and salmonoids. Given the<br />
uncertainty of CVP imports, the available water supply for 2009 is expected to be similar to<br />
2008, with significantly reduced CVP allocations. While groundwater pumping did not<br />
significantly increase in 2008, the factors limiting groundwater pumping are short term and<br />
pumping may be expected to increase in 2009 to compensate for the lack of CVP imports.<br />
Total water demand is expected to increase to the levels observed in 2008.<br />
Historically, the <strong>District</strong> conducted extensive percolation operations that ultimately reversed<br />
overdraft and then accumulated a substantial water supply reserve. <strong>District</strong> management of<br />
groundwater storage in conjunction with surface water is currently being refined to avoid<br />
excessively high or low water levels both on a temporal and geographic basis. In 2009, storage<br />
in Hernandez Reservoir may be replenished and percolation of available local water supplies<br />
should be focused on areas exhibiting declines in response to drought and increased pumping.<br />
The Annual Reports have regularly provided brief summaries of specific <strong>District</strong> groundwater<br />
basin management activities. However, these summaries have not been scoped to provide a<br />
comprehensive and integrated overview of existing groundwater basin management. Given the<br />
uncertainty of CVP supplies, it is recommended that the 2009 Annual Report include an<br />
expanded discussion of the overall state of the groundwater basin, planned development, and<br />
current and planned management activities. These will be examined within the context of the<br />
overarching water resource management planning documents—namely the groundwater<br />
management plan and integrated regional water management plan—with the intent of<br />
coordinating groundwater management planning and actions to address future issues.<br />
Annual Groundwater Report for <strong>Water</strong> Year 2008 December 2008<br />
<strong>San</strong> <strong>Benito</strong> <strong>County</strong> <strong>Water</strong> <strong>District</strong><br />
ES-3
INTRODUCTION<br />
This Annual Groundwater Report for <strong>San</strong> <strong>Benito</strong> <strong>County</strong> <strong>Water</strong> <strong>District</strong> (<strong>District</strong>) describes<br />
current groundwater conditions in the <strong>District</strong> and two zones of benefit: Zone 3 and Zone 6. It<br />
documents water supply sources and use, groundwater levels and storage, and <strong>District</strong><br />
management activities from November 2007 through October 2008. In addition, this report<br />
presents an analysis of the basin water balance for water years 2006 through 2008. The water<br />
balance method used in this report and past annual reports is also summarized as an appendix.<br />
Recommendations are provided with regard to water year 2009 water imports, groundwater<br />
replenishment, groundwater pumping, and groundwater charges. This report focuses on the<br />
southern portion of the Gilroy-Hollister Valley groundwater basin, which underlies the broad<br />
valley that extends from <strong>San</strong> <strong>Benito</strong> <strong>County</strong> into southern <strong>San</strong>ta Clara <strong>County</strong>. This valley<br />
includes the City of Hollister, City of <strong>San</strong> Juan Bautista, unincorporated residential areas, and<br />
expansive areas of irrigated agriculture.<br />
This Annual Report has been prepared at the request of the <strong>District</strong> to meet its information<br />
needs and to fulfill statutory reporting requirements that specify the minimum content of the<br />
report should the <strong>District</strong> choose to prepare one. These requirements are presented in<br />
Appendix A. The <strong>District</strong>, at its discretion, has also directed that specific annual reports<br />
include focused discussion of selected topics. Appendix A tabulates the special topics featured<br />
in previous annual reports.<br />
Throughout this report, water volumes and change in storage are shown to the nearest acre-foot<br />
(af). As a result, large numbers may appear to be accurate to four or five digits, which is not the<br />
case. These values are accurate to one to three significant digits (depending on the<br />
measurement). All digits are retained in the text to preserve correct column totals in tables, and<br />
to maintain as much accuracy as possible during subsequent calculations based on the<br />
information presented in this report.<br />
Acknowledgments. This report was prepared by Iris Priestaf, PhD, Maureen Reilly, P.E., and<br />
Chad Taylor, P.G. of Todd Engineers; and Gus Yates, P.G. CHG, Consulting Hydrologist. We<br />
appreciate the assistance of <strong>San</strong> <strong>Benito</strong> <strong>County</strong> <strong>Water</strong> <strong>District</strong> staff, particularly Jeff Cattaneo<br />
and Dale Rosskamp.<br />
OVERVIEW OF WATER SUPPLY SYSTEM<br />
Three sources provide water supply for the municipal, rural, and agricultural land uses in <strong>San</strong><br />
<strong>Benito</strong> <strong>County</strong>. These are local groundwater pumped from wells, local surface water stored in<br />
and released from the <strong>District</strong>-owned and operated Hernandez and Paicines reservoirs, and<br />
water purchased and imported from the Central Valley Project (CVP) by the <strong>District</strong>.<br />
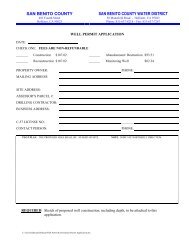
Local Groundwater. The <strong>District</strong> has jurisdiction throughout <strong>San</strong> <strong>Benito</strong> <strong>County</strong> (Figure 1),<br />
which includes at least portions of twelve groundwater basins defined by the California<br />
Department of <strong>Water</strong> Resources (DWR).<br />
Annual Groundwater Report for <strong>Water</strong> Year 2008 December 2008<br />
<strong>San</strong> <strong>Benito</strong> <strong>County</strong> <strong>Water</strong> <strong>District</strong> 1
SANTA CRUZ<br />
SANTA CLARA<br />
Legend<br />
DWR Groundwater Basins<br />
<strong>County</strong> Outline<br />
3-3<br />
3-2<br />
<strong>San</strong> Juan<br />
Bautista<br />
<strong>San</strong> Justo<br />
Reservoir<br />
Hollister<br />
Paicines<br />
Reservoir<br />
3-22<br />
Tres<br />
Pinos<br />
3-23<br />
3-25<br />
3-24<br />
MERCED<br />
FRESNO<br />
5-23<br />
3-28<br />
3-29<br />
MONTEREY<br />
3-30<br />
5-71<br />
Hernandez<br />
Reservoir<br />
3-31<br />
N<br />
DWR Groundwater Basins<br />
3-2 Pajaro Valley 3-24 Quien Sabe Valley<br />
3-3 Gilroy Hollister Valley 3-25 Tres Pinos Valley<br />
3-3.02 Bolsa Area 3-28 <strong>San</strong> <strong>Benito</strong> River Valley<br />
3-3.03 Hollister Area 3-29 Dry Lake Valley<br />
3-3.04 <strong>San</strong> Juan Bautista Area 3-30 Bitter <strong>Water</strong> Valley<br />
3-22 <strong>San</strong>ta Ana Valley 3-31 Hernandez Valley<br />
3-23 Upper <strong>San</strong>ta Ana Valley 5-23 Panoche Valley<br />
5-71 Vallecitos Valley<br />
December 2008<br />
TODD ENGINEERS<br />
Alameda, California<br />
Figure 1<br />
Groundwater Basins in<br />
<strong>San</strong> <strong>Benito</strong> <strong>County</strong>
These are listed on Figure 1 with the respective DWR basin numbers. With the exception of<br />
the Bitter <strong>Water</strong> Valley (which drains generally south to the Salinas River Valley) and the<br />
Panoche and Vallecitos valleys (which drain to the east toward Tulare Lake), the groundwater<br />
basins drain northward as part of the <strong>San</strong> <strong>Benito</strong> River and Pajaro River systems. This report<br />
focuses on the southern part of the Gilroy-Hollister Valley groundwater basin.<br />
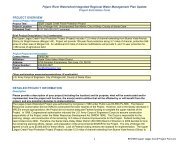
Figure 2 shows groundwater basin boundaries in the northern portion of <strong>San</strong> <strong>Benito</strong> <strong>County</strong>.<br />
The three DWR-defined subbasins include the Bolsa, Hollister, and <strong>San</strong> Juan Bautista Areas.<br />
Figure 2 also shows the boundaries of eight subbasins that were originally delineated in 1996<br />
for the <strong>District</strong> annual reports: Bolsa, Bolsa Southeast (SE), Pacheco, Hollister East, Tres<br />
Pinos, Hollister West, and <strong>San</strong> Juan subbasins, and the Llagas subbasin in <strong>San</strong>ta Clara <strong>County</strong>.<br />
These subbasin boundaries are based on a combination of infrastructure (CVP subsystems),<br />
political boundaries (Zone 6), and geologic structures (faults). This definition of subbasins is<br />
maintained in this report, supporting consistent analysis and reporting of groundwater<br />
conditions.<br />
Local Surface <strong>Water</strong>. Figure 1 also shows the locations of the two reservoirs owned and<br />
operated by the <strong>District</strong>. Hernandez Reservoir (capacity 17,200 af) is located on the upper <strong>San</strong><br />
<strong>Benito</strong> River in southern <strong>San</strong> <strong>Benito</strong> <strong>County</strong>. Paicines Reservoir (capacity 2,870 af) is an<br />
offstream reservoir between the <strong>San</strong> <strong>Benito</strong> River and Tres Pinos Creek. It is filled by water<br />
diverted from the <strong>San</strong> <strong>Benito</strong> River, with some of the diversions consisting of natural runoff<br />
and some consisting of water released from Hernandez Reservoir. <strong>Water</strong> stored in the two<br />
reservoirs is released for percolation in Tres Pinos Creek and the <strong>San</strong> <strong>Benito</strong> River to augment<br />
groundwater recharge during the dry season.<br />
Central Valley Project. The <strong>District</strong> also purchases Central Valley Project (CVP) water from<br />
the U. S. Bureau of Reclamation (USBR). The <strong>District</strong> has a 40-year contract (extending to<br />
2027) for a maximum of 8,250 af/yr of municipal and industrial (M&I) water and 35,550 af/yr<br />
of agricultural water. The <strong>District</strong> negotiated the renewal of this contract in May 2007. As part<br />
of this renewal, a separate repayment plan for existing capital costs was agreed upon, such that<br />
capital costs are not included in the cost per acre-foot of purchase water. <strong>San</strong> Justo Reservoir<br />
(see Figure 1) is used exclusively to store and regulate imported CVP water and has an<br />
operating capacity of 7,000 af.<br />
The imported water is delivered to agricultural, municipal, and industrial customers in the<br />
Pacheco, Bolsa Southeast, <strong>San</strong> Juan, Hollister East, Hollister West, and Tres Pinos subbasins<br />
through 12 subsystems containing approximately 120 miles of pressurized pipeline laterals.<br />
Since 2003, a portion of the M&I water has been treated at the Lessalt water treatment plant,<br />
which allows direct use of CVP water for municipal supply purposes by Sunnyslope <strong>County</strong><br />
<strong>Water</strong> <strong>District</strong> (Sunnyslope CWD) and the City of Hollister.<br />
Annual Groundwater Report for <strong>Water</strong> Year 2008 December 2008<br />
<strong>San</strong> <strong>Benito</strong> <strong>County</strong> <strong>Water</strong> <strong>District</strong> 3
Pacheco Valley<br />
Llagas<br />
Pajaro River<br />
Bolsa<br />
Bolsa<br />
Pacheco<br />
Hollister<br />
Bolsa<br />
SE<br />
Hollister East<br />
<strong>San</strong> <strong>Benito</strong> River<br />
<strong>San</strong> Juan Bautista<br />
<strong>San</strong> Juan<br />
Hollister<br />
West<br />
Hollister<br />
<strong>San</strong>ta Ana Creek<br />
<strong>San</strong> Juan<br />
Bautista<br />
Legend<br />
SBCWD subbasin boundary<br />
DWR subbasins boundary<br />
Major roads<br />
Streams<br />
N<br />
<strong>County</strong> boundary<br />
Major Community/City<br />
0<br />
10,000<br />
Scale in Feet<br />
Tres Pinos<br />
Tres Pinos Creek<br />
December 2008<br />
TODD ENGINEERS<br />
Alameda, California<br />
Tres Pinos<br />
Figure 2<br />
Subbasin Locations
A total of 1,322 af of water was treated and used during 2008. CVP water has also been<br />
released historically to augment groundwater recharge along several local creeks and the <strong>San</strong><br />
<strong>Benito</strong> River. This practice has diminished in recent years with the widespread recovery of<br />
groundwater levels throughout the basin.<br />
Zones of Benefit. In order to obtain funds to support its various water management activities,<br />
the <strong>District</strong> has formed three zones of benefit:<br />
• Zone 1 encompasses the entire county and provides the funding base for specific<br />
<strong>District</strong> administrative expenses.<br />
• Zone 3 generally covers the <strong>San</strong> <strong>Benito</strong> River Valley (from the Highway 25 bridge<br />
south of Paicines to <strong>San</strong> Juan Bautista) and the Tres Pinos Creek Valley from<br />
Paicines to the <strong>San</strong> <strong>Benito</strong> River. Zone 3 provides the funding base for operation of<br />
Hernandez and Paicines reservoirs (see Figure 1) and related groundwater recharge<br />
and management activities.<br />
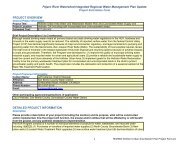
• Zone 6 includes most of the Gilroy-Hollister Valley groundwater basin in <strong>San</strong> <strong>Benito</strong><br />
<strong>County</strong> (see Figure 3) and provides the funding base for importation and distribution<br />
of CVP water and related groundwater management activities.<br />
Annual Groundwater Report for <strong>Water</strong> Year 2008 December 2008<br />
<strong>San</strong> <strong>Benito</strong> <strong>County</strong> <strong>Water</strong> <strong>District</strong> 5
Hollister<br />
<strong>San</strong> Juan Bautista<br />
Legend<br />
Zone 6 Boundary<br />
Generalized Calaveras fault<br />
Highways<br />
Secondary roads<br />
Major Streams<br />
Major Community/City<br />
N<br />
0<br />
12,000<br />
Scale in Feet<br />
December 2008<br />
TODD ENGINEERS<br />
Alameda, California<br />
Tres Pinos<br />
Figure 3<br />
Zone 6<br />
Boundary
HYDROLOGIC CONDITIONS IN WATER YEAR 2008<br />
Figure 4 provides a comparison of average monthly rainfall with monthly rainfall in water year<br />
2008 from the <strong>San</strong> <strong>Benito</strong> weather station at the <strong>District</strong> headquarters in Hollister. The overall<br />
total rainfall of 9.07 inches in water year 2008 was considerably less than average (13 inches)<br />
and similar to the precipitation in water year 2007. As shown, many months were unusually<br />
dry. Climate data and streamflow data for the local area can be found in Appendices B and C,<br />
respectively.<br />
Figure 4. Monthly Precipitation in <strong>Water</strong> Year 2008<br />
9.07 Inches<br />
Total<br />
Annual Groundwater Report for <strong>Water</strong> Year 2008 December 2008<br />
<strong>San</strong> <strong>Benito</strong> <strong>County</strong> <strong>Water</strong> <strong>District</strong> 7
WATER MANAGEMENT ACTIVITIES<br />
The <strong>District</strong> continued its participation in water management activities including water<br />
resources planning, augmentation of groundwater resources, and distribution of CVP water. No<br />
water banking occurred in 2008, although this remains a potential water management tool. The<br />
<strong>District</strong> also maintains a comprehensive monitoring program, including regular measurement of<br />
groundwater pumping, water quality, annual evaluation of groundwater storage change, and<br />
regular update of the basin water balance. These activities are addressed in subsequent sections<br />
of this report.<br />
WATER RESOURCES PLANNING<br />
In 2008, the <strong>District</strong> continued its active involvement in water resource management projects,<br />
programs and planning efforts that address water supply, water quality, wastewater<br />
management, and hydrogeology. This section provides an update on 2008 activities, including<br />
efforts sponsored and led by the <strong>District</strong>; cooperative programs with the <strong>County</strong>, local cities,<br />
and the <strong>Water</strong> Resources Association (WRA), respectively; and regional planning efforts with<br />
<strong>San</strong>ta Clara Valley <strong>Water</strong> <strong>District</strong> (SCVWD).<br />
Groundwater Ambient Monitoring and Assessment (GAMA). In August 2008 water<br />
quality sampling in the basin was begun as part of the GAMA program. The GAMA program is<br />
the joint effort of the United States Geological Survey (USGS), the California <strong>Water</strong> Boards<br />
(SWRCB/RWQCB), Department of <strong>Water</strong> Resources (DWR), Department of Public Health<br />
(DPH), and Lawrence Livermore National Laboratory. The USGS California <strong>Water</strong> Science<br />
Center is the project lead for the Priority Basin Project. The program’s main focus is to help<br />
better understand and identify risks to groundwater resources through water quality sampling<br />
and analysis. With the voluntary cooperation of local water agencies and well owners, USGS is<br />
testing water in California groundwater basins over a 10-year period. Groundwater will be<br />
sampled to characterize its constituents and identify trends in ground-water quality. The results<br />
of these tests will provide information for water agencies to address a variety of issues ranging<br />
in scale from local water supply to statewide resource management. A wrap up meeting is<br />
planned for late 2009 to present general findings.<br />
Occurrence and Management of High Groundwater. In 2006, the <strong>District</strong> conducted an<br />
evaluation of high groundwater conditions in the northern portion of the Hollister Valley (GEI,<br />
January 2006). The evaluation defined factors potentially contributing to high groundwater<br />
including percolation of irrigation water, recharge from creeks, and local reduction of pumping.<br />
The evaluation provides options for managing high groundwater including measures to control<br />
artesian flow, tile drains to manage shallow and perched groundwater, and installation of<br />
production wells to control regional groundwater levels. The evaluation also recommended<br />
additional monitoring wells and a survey along Pacheco Creek. In June 2007, the <strong>District</strong><br />
authorized installation of eight monitoring wells located mostly along Pacheco Creek with one<br />
near the airport. Installation of the monitoring wells and the surveying have been postponed<br />
due to budget considerations.<br />
Annual Groundwater Report for <strong>Water</strong> Year 2008 December 2008<br />
<strong>San</strong> <strong>Benito</strong> <strong>County</strong> <strong>Water</strong> <strong>District</strong> 8
Hydrogeologic Assessments. In 2007, the <strong>District</strong> authorized hydrogeologic assessments of<br />
the <strong>San</strong> Juan, Hollister West, and Tres Pinos groundwater subbasins and the southern portions<br />
of the Hollister East groundwater subbasin. These assessments are intended to synthesize and<br />
expand previous focused groundwater investigations and groundwater-related water resource<br />
planning efforts. The assessments will address key issues including surface water-groundwater<br />
interactions, local high groundwater conditions, effects on groundwater levels and quality of<br />
recharge operations, and sources of local quality problems (e.g., high salinity, boron, arsenic).<br />
The draft hydrogeologic assessment for these subbasins was submitted to the <strong>District</strong> for<br />
review and comment in 2008. A separate report on the hydrogeologic conditions of the<br />
Hollister East subbasin will be submitted to the <strong>District</strong> in late 2008. Field reports are expected<br />
to be complete by February 2009.<br />
<strong>San</strong> Juan Basin Surface Drainage Option Study. Agricultural lands in the <strong>San</strong> Juan Valley<br />
have long been subject to flooding. In 2007, the <strong>District</strong> authorized Advanced Hydro<br />
Engineers to assess the technical design issues and potential routing of a new storm drainage<br />
channel. This channel would extend from Highway 156 near Lucy Brown Lane to a detention<br />
basin and outfall near the <strong>San</strong> <strong>Benito</strong> River. The assessment also includes review of drainagerelated<br />
portions of a CalTrans environmental impact report on the Highway 156 widening<br />
project. This study was completed in early 2008.<br />
<strong>Water</strong> Softener Rebate Program. In May 2007, the <strong>District</strong>, on behalf of the <strong>Water</strong><br />
Resources Association (WRA), and <strong>San</strong> Clara Valley <strong>Water</strong> <strong>District</strong> (SCVWD) initiated a<br />
<strong>Water</strong> Softener Rebate Program, based on the award of a <strong>Water</strong> Use Efficiency Grant as part of<br />
the 2004 Proposition 50 grant program. The $300,000 grant is being applied, along with<br />
$152,780 from WRA and $152,780 from SCVWD, to provision of rebates to customers who<br />
agree to abandon and/or replace their pre-1999 inefficient water softener system with a newer,<br />
more efficient means of water softening. The program provides a range of rebates between<br />
$150 and $300.<br />
The program has a goal of 1,000 water softener replacements by the time of grant completion<br />
in December 2009. Initial participation in the program lagged expectations; as of November<br />
2008, 176 water rebates have been issued. In response, the WRA modified the program to<br />
encompass all of Zone 6, provide rebates for demolishing old water softeners, and increase<br />
community outreach. Outreach efforts have included bill inserts and flyers at farmer’s markets<br />
that educate the public on the effect of salt on the groundwater basin and the effective use of<br />
softeners. A user survey is currently underway to collect data on user’s perception of water<br />
softeners. Results of the survey, slated for completion in January 2009, will help improve<br />
outreach efforts.<br />
The community outreach is already stimulating new interest. In addition, it is possible that the<br />
program may be extended past December 2009.<br />
Hollister Area Urban <strong>Water</strong> and Wastewater Master Plan. The Revised Draft Hollister<br />
Urban Area <strong>Water</strong> and Wastewater Master Plan, completed in February 2007, is intended to<br />
integrate water supply, wastewater treatment and wastewater disposal into a single document<br />
(HDR, 2007). The plan systematically evaluates a range of water supply and wastewater<br />
Annual Groundwater Report for <strong>Water</strong> Year 2008 December 2008<br />
<strong>San</strong> <strong>Benito</strong> <strong>County</strong> <strong>Water</strong> <strong>District</strong> 9
disposal alternatives against a set of criteria. The Final Plan was approved by the City of<br />
Hollister, the <strong>District</strong>, and Sunnyslope in November 2008.<br />
The recommended water supply alternative includes the treatment of local groundwater to meet<br />
water quality objectives. The preferred alternative involves demineralization of groundwater<br />
from existing municipal supply wells and installation of new three new wells in the Hollister<br />
Urban Area.<br />
The preferred wastewater alternative consisted of near-term disposal of recycled wastewater at<br />
specific sites planted with turf or pasture varieties that tolerate relatively high irrigation<br />
salinity. Currently, two interim locations have been selected for the City of Hollister’s<br />
wastewater, an area near the airport and a city park. Sunnyslope plans to use treated wastewater<br />
on a golf course in its service area. According to the Plan, in the longer term—after<br />
demineralization of the municipal groundwater supply is implemented—the decreased salinity<br />
of recycled water would allow it to be used on a wider variety of crops throughout nearby<br />
agricultural areas.<br />
Regional Recycled <strong>Water</strong> Project. When the City of Hollister implements demineralization of<br />
the municipal water supply, high-quality recycled water will be available for general irrigation<br />
use. Previous studies have generally assumed that recycled water would replace CVP water in<br />
the <strong>San</strong> Juan Valley. The new project will evaluate one or more alternative regions for recycled<br />
water use outside the <strong>San</strong> Juan Valley. This project is co-managed by the <strong>District</strong> and the City.<br />
Recycled water was addressed on a conceptual level in the wastewater master plan and in<br />
preliminary reports. A more detailed analysis of the recycled water project is now underway<br />
and results are expected late 2009.<br />
City of Hollister Long-Term Wastewater Management Program. The City of Hollister’s<br />
Long-Term Wastewater Management Program (HydroScience Engineers, 2005) identified<br />
near-term and long-term strategies for treatment and disposal of municipal wastewater. The<br />
environmental impact report (EIR) was finalized in October 2006, except for issues related to<br />
impacts at sites selected for near-term irrigation with recycled water. To evaluate those<br />
impacts, a supplemental EIR (SEIR) has been in progress through water year 2007. The<br />
number of near-term sites was increased to five, and nine alternatives involving various<br />
configurations and combinations of those sites have been evaluated for water level and salinity<br />
impacts using the regional groundwater model. An additional region for long-term use of<br />
recycled water for irrigation was also evaluated. The SEIR was accepted by the City of<br />
Hollister, the <strong>District</strong>, and the <strong>County</strong> in 2008.<br />
Sunnyslope <strong>County</strong> <strong>Water</strong> <strong>District</strong> Long-Term Wastewater Management Plan. The<br />
primary issue addressed in the Long-Term Wastewater Management Plan is whether to invest<br />
in substantial improvements to Sunnyslope CWD’s own wastewater treatment and disposal<br />
facilities or to discontinue operating those facilities and convey wastewater to the City of<br />
Hollister’s plant for treatment and disposal. During water year 2008, Sunnyslope CWD decided<br />
to invest in improvements to its own wastewater treatment and disposal facilities. Planning for<br />
these improvements is in process. Sunnyslope CWD is also planning to implement salinity<br />
Annual Groundwater Report for <strong>Water</strong> Year 2008 December 2008<br />
<strong>San</strong> <strong>Benito</strong> <strong>County</strong> <strong>Water</strong> <strong>District</strong> 10
eduction measures at the wells it operates, by blending, demineralization, or softening of the<br />
water before pumping it into the distribution system.<br />
Hollister Urban Area Urban <strong>Water</strong> Management Plan (UWMP). In June 2005, Sunnyslope<br />
<strong>County</strong> <strong>Water</strong> Agency, along with the City of Hollister and the <strong>District</strong>, began preparing a joint<br />
Urban <strong>Water</strong> Management Plan (UWMP). The UWMP is a central document to long term<br />
water supply planning for the region. The UWMP includes detailed information on the current<br />
and future water demand and supply as well as best management practices for water<br />
conservation. The UWMP was approved by the City of Hollister and Sunnyslope in spring<br />
2008. The UWMP is slated to be approved by the <strong>District</strong> and the <strong>County</strong> in November 2008.<br />
RECOMMENDATION FOR 2009 ANNUAL REPORT<br />
<strong>Water</strong> year 2008 was marked by substantial progress on water management, particularly urban<br />
water and wastewater issues. Specifically, the Hollister Area <strong>Water</strong> and Wastewater Master<br />
Plan and the City of Hollister Long-Term Wastewater Management Program were approved in<br />
late 2008, Sunnyslope <strong>County</strong> <strong>Water</strong> <strong>District</strong> decided in 2008 to pursue its own wastewater<br />
management plan, and the UWMP was approved. These documents provide important direction<br />
for resolution of linked water and wastewater issues in the existing urban portion of the basin.<br />
In the meantime, the cutbacks in CVP allocations and prospects for continuing drought are<br />
likely to result in increased basin-wide groundwater pumping. This will occur over the near<br />
term, including the unknown duration of the drought and the time period needed to resolve<br />
Sacramento-<strong>San</strong> Joaquin Delta issues and to increase the certainty of CVP deliveries. Despite<br />
the recent economic downturn, the near term also is likely to reveal significant development in<br />
the basin (e.g., El Rancho <strong>San</strong> <strong>Benito</strong>) with as-yet undefined but important implications for the<br />
groundwater basin. Recognizing the pending increase in reliance on groundwater basin-wide,<br />
additional focus should be placed on enhanced management of groundwater storage (pumping<br />
and replenishment) to minimize high groundwater problems, help avoid adverse groundwater<br />
level drawdown while satisfying water demand and progressing toward improved groundwater<br />
quality. Some of the new projects and programs to meet these goals already have been defined<br />
and evaluated in previous studies and planning documents, but others likely remain to be<br />
identified.<br />
The Annual Reports have regularly provided brief summaries of specific <strong>District</strong> groundwater<br />
basin management activities, including the subbasin hydrogeologic assessments and<br />
drainage/high groundwater studies. However, these summaries have not been scoped to provide<br />
a comprehensive and integrated overview of existing groundwater basin management in light<br />
of pending changes. Given the immediacy of these changes, it is recommended that the 2009<br />
Annual Report included an expanded discussion and evaluation of the overall state of the<br />
groundwater basin (using existing reports), planned development, and current and planned<br />
management activities. These will be examined within the context of the overarching water<br />
resource management planning documents—namely the groundwater management plan and<br />
integrated regional water management plan—with the intent of coordinating groundwater<br />
management planning and actions to address future issues.<br />
Annual Groundwater Report for <strong>Water</strong> Year 2008 December 2008<br />
<strong>San</strong> <strong>Benito</strong> <strong>County</strong> <strong>Water</strong> <strong>District</strong> 11
REPLENISHMENT OF GROUNDWATER<br />
The <strong>District</strong> operates Hernandez and Paicines reservoirs in the <strong>San</strong> <strong>Benito</strong> River watershed to<br />
store runoff and release it during the dry season to replenish groundwater. In addition, the<br />
<strong>District</strong> has percolated imported CVP water as part of its management activities. Wastewater<br />
also is recharged to groundwater from municipal and industrial wastewater treatment plants.<br />
Figure 5 highlights the stream channels and sites that have been used for percolation of local<br />
surface water and CVP water, and also shows the locations of wastewater treatment plants.<br />
Appendix D provides information for water year 2008 on the operation of Hernandez and<br />
Paicines reservoirs, storage of CVP water in <strong>San</strong> Justo Reservoir, releases of CVP water for<br />
percolation along stream channels, and percolation of municipal wastewater.<br />
Recharge of Local Surface <strong>Water</strong>. Local surface water from Hernandez and Paicines<br />
reservoirs is percolated along the <strong>San</strong> <strong>Benito</strong> River and Tres Pinos Creek. Historically, releases<br />
have been managed to limit flows to the <strong>San</strong> <strong>Benito</strong> River channel above Lucy Brown Lane in<br />
<strong>San</strong> Juan Valley with the intent of maximizing percolation in the basin. Since 1998, releases of<br />
local surface water have been limited to percolation upstream of the Cienega Bridge near<br />
Hollister. In <strong>Water</strong> Year 2008, percolation was further reduced to a negligible volume. This<br />
minimizes or eliminates potential impacts on local high-groundwater conditions and avoids<br />
competition for storage capacity with percolation from City of Hollister wastewater percolation<br />
ponds.<br />
As shown in Table D-1 of Appendix D, 2008 inflows to Hernandez Reservoir were only<br />
10,662 af, but contributed to an increase in storage relative to 2007. Over 45 percent of inflows<br />
occurred during the wet month of January. No reservoir spills occurred. However, 7,646 af<br />
were released for downstream percolation. Reservoir releases ranged from 423 af per month in<br />
January and February to 2,814 af in August. Releases generally are greatest in August and<br />
September as storage is reduced to ensure adequate capacity for flood control before the rainy<br />
season. Over water year 2008, Hernandez Reservoir storage increased from 590 af to 2,693.<br />
The reduced storage at the beginning of the water year reflects the intentional releases in water<br />
year 2007 for maintenance purposes.<br />
The <strong>District</strong> operates Paicines Reservoir to provide off-stream storage of <strong>San</strong> <strong>Benito</strong> River<br />
water diverted for percolation in the Tres Pinos Creek channel. Paicines storage began the<br />
water year at 625 af, increased to 1,652 af, and then decreased to 300 af at the end of the water<br />
year, with 495 af released to Tres Pinos Creek for percolation, approximately 40 percent of<br />
water year 2007’s releases.<br />
Figure 6 shows the annual releases of local surface water for percolation from Hernandez and<br />
Paicines reservoirs from 1996 through 2008. Releases from Hernandez have ranged between<br />
3,500 af/yr and 26,300 af/yr, generally reflecting variations in inflow. The 2008 Hernandez<br />
release of 7,646 af amounted to 65 percent of the average over this period, reflecting dry<br />
conditions; precipitation was 70 percent of normal.<br />
Annual Groundwater Report for <strong>Water</strong> Year 2008 December 2008<br />
<strong>San</strong> <strong>Benito</strong> <strong>County</strong> <strong>Water</strong> <strong>District</strong> 12
Tequisquita Slough<br />
Pajaro River<br />
Pacheco Creek<br />
Arroyo De<br />
Las Viboras<br />
Arroyo Dos Picachos<br />
<strong>San</strong>ta Ana Creek<br />
<strong>San</strong> <strong>Benito</strong> River<br />
<strong>San</strong> Juan<br />
Bautista<br />
WWTP<br />
<strong>San</strong> Juan Bautista<br />
Hollister<br />
DWTP<br />
IWTP<br />
Hollister<br />
Legend<br />
Streams<br />
Percolation area of CVP water and/or<br />
local surface water<br />
Wastewater treatment plant (WWTP)<br />
Subbasin Boundary<br />
City Boundary<br />
Major Community/City<br />
0<br />
N<br />
Scale in Feet<br />
10,000<br />
Sunnyslope<br />
Ridgemark WWTP<br />
Cielo Vista WWTP<br />
Tres Pino Creek<br />
December 2008<br />
TODD ENGINEERS<br />
Alameda, California<br />
Tres Pinos WWTP<br />
Tres Pinos<br />
Figure 5<br />
Location of<br />
Percolation Areas and<br />
Wastewater Treatment<br />
Plants
30,000<br />
25,000<br />
Hernandez<br />
Paicines<br />
Reservoir Releases (AFY)<br />
20,000<br />
15,000<br />
10,000<br />
5,000<br />
0<br />
1996 1997 1998 1999 2000 2001 2002 2003 2004 2005 2006<br />
2007<br />
2008<br />
<strong>Water</strong> Year<br />
December 2008<br />
TODD ENGINEERS<br />
Alameda, California<br />
Figure 6<br />
Reservoir Releases<br />
for Percolation
Table 1. Annual Percolation of <strong>San</strong> Felipe <strong>Water</strong> during <strong>Water</strong> Years 1994-2008 (acre-feet)<br />
<strong>Water</strong><br />
Year<br />
Arroyo de las Viboras<br />
Pacheco<br />
Creek Road Creek 1 Creek 2<br />
Arroyo Dos Picachos<br />
Fallon<br />
Road<br />
Jarvis<br />
Lane<br />
<strong>San</strong>ta Ana Creek<br />
John<br />
Smith Maranatha<br />
Creek Road Road<br />
Airline<br />
Highway<br />
Ridgemark<br />
Tres<br />
Pinos<br />
Creek<br />
<strong>San</strong><br />
<strong>Benito</strong><br />
River<br />
Total<br />
Waste<br />
<strong>Water</strong><br />
1994<br />
1995<br />
1996<br />
1997<br />
1998<br />
1999<br />
2000<br />
2001<br />
2002<br />
2003<br />
2004<br />
2005<br />
2006<br />
2007<br />
2008<br />
232<br />
444<br />
0<br />
0<br />
0<br />
0<br />
1<br />
0<br />
0<br />
0<br />
0<br />
0<br />
0<br />
0<br />
0<br />
136<br />
238<br />
494<br />
447<br />
132<br />
0<br />
0<br />
0<br />
0<br />
0<br />
0<br />
0<br />
0<br />
0<br />
0<br />
515<br />
770<br />
989<br />
601<br />
109<br />
0<br />
0<br />
0<br />
0<br />
0<br />
0<br />
0<br />
0<br />
0<br />
0<br />
0<br />
2<br />
832<br />
1,981<br />
403<br />
0<br />
6<br />
0<br />
2<br />
0<br />
0<br />
0<br />
0<br />
0<br />
0<br />
0<br />
0<br />
67<br />
77<br />
0<br />
0<br />
0<br />
0<br />
0<br />
0<br />
0<br />
0<br />
0<br />
0<br />
0<br />
550<br />
654<br />
235<br />
0<br />
0<br />
0<br />
0<br />
0<br />
0<br />
0<br />
0<br />
0<br />
0<br />
0<br />
0<br />
209<br />
622<br />
708<br />
200<br />
0<br />
4<br />
3<br />
0<br />
1<br />
5<br />
52<br />
0<br />
6.8<br />
0<br />
0<br />
0<br />
73<br />
531<br />
17<br />
65<br />
256<br />
236<br />
161<br />
78<br />
119<br />
83<br />
0<br />
155.7<br />
0<br />
0<br />
0<br />
0<br />
197<br />
353<br />
0<br />
48<br />
21<br />
17<br />
2<br />
9<br />
0<br />
0<br />
0<br />
0<br />
0<br />
0<br />
0<br />
134<br />
286<br />
158<br />
141<br />
240<br />
186<br />
143<br />
172<br />
0<br />
0<br />
0<br />
0<br />
0<br />
0<br />
0<br />
25<br />
29<br />
74<br />
10<br />
12<br />
1<br />
0<br />
0<br />
0<br />
0<br />
0<br />
0<br />
0<br />
85<br />
809<br />
21<br />
1,477<br />
518<br />
452<br />
285<br />
703<br />
426<br />
163<br />
1<br />
0<br />
0.8<br />
88.3<br />
0<br />
158<br />
2,734<br />
6,097<br />
5,619<br />
1,084<br />
413<br />
938<br />
1,041<br />
470<br />
605<br />
882<br />
527<br />
450.5<br />
215.9<br />
6.1<br />
1,885<br />
6,345<br />
10,330<br />
11,087<br />
2,543<br />
1,322<br />
1,740<br />
2,110<br />
1,122<br />
1,074<br />
1,018<br />
527<br />
613.8<br />
304.2<br />
6.1<br />
2,590<br />
2,735<br />
3,273<br />
3,400<br />
3,557<br />
4,448<br />
3,789<br />
3,338<br />
3,952<br />
3,744<br />
3,635<br />
3,490<br />
3,279<br />
3,107<br />
2,977<br />
16,000<br />
14,000<br />
Surface <strong>Water</strong> Percolation<br />
12,000<br />
Wastewater Percolation<br />
Stream Percolation (AF)<br />
10,000<br />
8,000<br />
6,000<br />
4,000<br />
2,000<br />
0<br />
1994 1995 1996 1997 1998 1999 2000 2001 2002 2003 2004 2005 2006<br />
2007<br />
2008<br />
<strong>Water</strong> Year<br />
December 2008<br />
TODD ENGINEERS<br />
Alameda, California<br />
Table 1 and Figure 7<br />
Managed Percolation<br />
1994-2008
Recharge of CVP <strong>Water</strong>. As shown in Figure 5, CVP water has historically been percolated<br />
along the <strong>San</strong> <strong>Benito</strong> River, Tres Pinos Creek, <strong>San</strong>ta Ana Creek, Arroyo Dos Picachos, Arroyo<br />
de las Viboras, Pacheco Creek and other percolation sites.<br />
Table 1 and Figure 7 summarize the annual percolation of CVP water from water year 1994<br />
through 2008, while monthly data for 2008 are provided in Appendix D. CVP percolation<br />
peaked in 1997 and was reduced subsequently in response to the successful recovery of the<br />
groundwater basin from overdraft. Releases of CVP water have been discontinued to Pacheco<br />
Creek, Arroyo Dos Picachos and Arroyo de las Viboras since the 1990s and discontinued from<br />
the Airline Highway and Ridgemark sites in recent years. In water year 2008, CVP releases for<br />
percolation were limited to 6 af along the <strong>San</strong> <strong>Benito</strong> River and Tres Pinos Creek.<br />
Wastewater Percolation. Figure 5 shows the locations of municipal wastewater treatment<br />
plants (WWTPs), including the Tres Pinos, Cielo Vista, and <strong>San</strong> Juan Bautista WWTPs, two<br />
sites operated by Sunnyslope <strong>County</strong> <strong>Water</strong> <strong>District</strong> near Ridgemark, and the City of Hollister<br />
domestic and industrial plants (DWTP and IWTP, respectively). 1<br />
The <strong>San</strong> Juan Bautista plant discharges to a small tributary of <strong>San</strong> Juan Creek that tends to gain<br />
rather than lose water from seepage. Accordingly, little or none of the 177 af of the <strong>San</strong> Juan<br />
Bautista plant effluent discharged during 2008 replenishes groundwater. The remaining<br />
wastewater treatment plants dispose of their wastewater effluent by percolation into the ground.<br />
Of these, the package wastewater treatment plant at the Cielo Vista residential development is<br />
the smallest, percolating less than 25 afy (Yates, 2005) to a leach field.<br />
Table 1 documents the annual amounts of wastewater percolation (see far right column) for the<br />
Hollister, Sunnyslope, and Tres Pinos facilities. The City of Hollister DWTP and IWTP<br />
represent the major portion, amounting to 1,580 af and 1,257 af in 2008, respectively. Figure 7<br />
provides a graphic comparison of wastewater percolation to the CVP percolation discussed<br />
previously. While CVP percolation has been reduced substantially in recent years in response<br />
to groundwater level recovery, wastewater percolation has remained relatively steady, although<br />
declining gradually in recent years. The decline is the result of both residential and industrial<br />
water conservation measures (Wittry, 2007).<br />
DISTRIBUTION OF CVP WATER<br />
CVP water is distributed by the <strong>District</strong> to agricultural and M&I customers in Zone 6. In water<br />
year 2008, water allocations to Zone 6 were significantly reduced. Table 2 shows the contract<br />
entitlements, recent average allocations (USBR, May 11, 2006) and 2008 deliveries for CVP<br />
water in Zone 6. Actual CVP deliveries have differed from the contracted amount, depending<br />
on hydrologic conditions. Allocations were decreased to 40 percent of the contracted amount<br />
for agriculture and 75 percent for M&I. This reduction is a direct result of the May 2007<br />
Federal Court decision on Delta smelt. The continued effects of the Court decision are<br />
discussed in more detail in the subsequent section on conditions expected for 2009.<br />
1 Another plant for the Rancho Larios development near <strong>San</strong> Juan Bautista discharges tertiary-treated<br />
effluent to a sprayfield located outside the basin. That discharge is not considered in this report.<br />
Annual Groundwater Report for <strong>Water</strong> Year 2008 December 2008<br />
<strong>San</strong> <strong>Benito</strong> <strong>County</strong> <strong>Water</strong> <strong>District</strong> 16
In water year 2008, 10,514 af were delivered to agricultural customers and 2,232 af were<br />
delivered to M&I and domestic customers. Distribution to M&I customers occurs primarily<br />
through the Lessalt water treatment plant, which provides treated water directly to the City of<br />
Hollister and Sunnyslope CWD water supply systems. M&I water is also distributed for<br />
irrigation use at the Ridgemark and <strong>San</strong> Juan Oaks golf courses. Domestic users include the<br />
Stonegate subdivision, which treats CVP water at a small water treatment plant.<br />
The use of CVP water for direct M&I use is limited by the available treatment capacity of the<br />
Lessalt treatment plant, which has a design capacity of 3 million gallons per day (MGD) or<br />
approximately 3,360 af/yr. In 2008, Lessalt produced 1,323 af for municipal supply, amounting<br />
to 39 percent of the design capacity. Other M&I uses of CVP water include urban irrigation<br />
(golf courses) and potable supply for the Stonegate community. The <strong>District</strong> was previously<br />
held to a minimum payment of M&I CVP water; this was reduced to 1 af in the renegotiated<br />
contract that became effective May 2008. The current alternative use for CVP water is<br />
groundwater replenishment, which is limited by allocation and the available storage capacity of<br />
the groundwater basin.<br />
Table 2. CVP Entitlements, Allocations, and 2008 Deliveries<br />
Contract<br />
Entitlement<br />
(af)<br />
Recent Average<br />
Allocation<br />
Actual<br />
2008 CVP<br />
Delivery<br />
(af)<br />
Percent of<br />
Contract<br />
Amount<br />
Used in 2008<br />
Current Total<br />
Usage<br />
(CVP & GW)<br />
(af)<br />
(%) (af)<br />
Agriculture 35,550 40% 14,220 10,514 30% 25,310<br />
M&I* 8,250 75% 3,320 2,232 27% 10,225<br />
TOTAL 43,800 46% 20,408 12,745 29% 35,535<br />
*2008 M&I allocation based on 75 percent of historical use per the Bureau’s M&I Shortage Policy.<br />
WATER BANKING<br />
Due to the reduced CVP allocation, the <strong>District</strong> procured additional water supplies through<br />
water transfers. In water year 2008, a total of 1,204 af of imported water was delivered through<br />
other programs. The volumes and sources of these transfers are below:<br />
• 170 af, Merced Irrigation <strong>District</strong><br />
• 984 af, Yuba <strong>Water</strong> Transfer Program and the 2008 Pooled <strong>Water</strong> Transfer Program<br />
• 50 af, Del Puerto <strong>Water</strong> <strong>District</strong><br />
Annual Groundwater Report for <strong>Water</strong> Year 2008 December 2008<br />
<strong>San</strong> <strong>Benito</strong> <strong>County</strong> <strong>Water</strong> <strong>District</strong> 17
WATER SUPPLY SOURCES AND USE<br />
WATER SUPPLY SOURCES<br />
The water needs of Zone 6 are satisfied by two types of water: imported CVP water and locally<br />
pumped groundwater. A third water source, local surface water, is managed to recharge the<br />
groundwater basin.<br />
WATER USE<br />
<strong>Water</strong> use in Zone 6 is divided into two main user categories: agriculture use and municipal<br />
and industrial (M&I). M&I use includes the Sunnyslope CWD and the City of Hollister<br />
municipal systems and Stonegate, a small rural water system, and other domestic users. <strong>Water</strong><br />
use by subbasin, user category, and water type for 2008 is shown in Table 3.<br />
Table 3. <strong>Water</strong> Use in <strong>Water</strong> Year 2008 (af)<br />
CVP <strong>Water</strong><br />
Groundwater<br />
Domestic,<br />
Municipal, &<br />
Domestic,<br />
Municipal, &<br />
Subbasin Agriculture Industrial Agricultural Industrial<br />
Bolsa South East 333 0 2,001 13<br />
Hollister East 5,372 1,420 2,639 1,323<br />
Hollister West 366 33 1,143 3,232<br />
Pacheco 1,517 51 1,703 197<br />
<strong>San</strong> Juan 2,837 322 6,744 1,053<br />
Tres Pinos 88 405 567 2,176<br />
TOTAL 10,514 2,232 14,796 7,993<br />
<strong>Water</strong> Use in 2008. Overall, water usage in 2008 was significantly lower than in previous<br />
years. Table 4 shows total water use in 2008 was 35,535 af as compared to 46,424 af in 2007, a<br />
decrease of 23 percent. Changes in total water uses by user category were most pronounced in<br />
the CVP water usage. CVP water use decreased in all subbasins, a total of 47 percent in Zone 6<br />
mainly due to the reduced allocation. The decrease in CVP water use ranged from 28 percent in<br />
Hollister West to 59 percent in Pacheco. While CVP water use decreased to levels similar to<br />
the late 1990’s, groundwater water use did not increase to fill the demand. With the exception<br />
of Pacheco subbasin, total subbasin groundwater use remained about the same or decreased<br />
slightly. Only Pacheco subbasin showed a significant increase in groundwater use, almost<br />
doubling.<br />
Total water use decreased a total of 23 percent basin-wide. This decrease is most likely due to<br />
several factors including the loss of big contracts for lettuce growers in <strong>San</strong> <strong>Benito</strong> <strong>County</strong>,<br />
fallowing of fields, changes in crop selections to less water intensive crops (e.g. onions and<br />
garlic), and lack of groundwater infrastructure to provide increased supply. The temporary<br />
lack of groundwater infrastructure may have the most significant impact on current and future<br />
Annual Groundwater Report for <strong>Water</strong> Year 2008 December 2008<br />
<strong>San</strong> <strong>Benito</strong> <strong>County</strong> <strong>Water</strong> <strong>District</strong> 18
water use. As many users have relied solely on CVP imports, groundwater wells have not been<br />
maintained as a major water source. In order to switch to groundwater use, many growers may<br />
need to rehabilitate wells and pumps. As a result of this effort, groundwater use may increase<br />
significantly to meet the gap in water supply. If CVP imports remain low, groundwater use<br />
could increase substantially in water year 2009 (Rosskamp, 2008).<br />
Table 4. Comparison of <strong>Water</strong> Use in <strong>Water</strong> Years 2007 and 2008<br />
Total CVP Groundwater Total <strong>Water</strong> Supply<br />
%<br />
%<br />
Change 2007 2008 Change 2007 2008<br />
%<br />
Change<br />
2007 2008<br />
Bolsa<br />
South East 572 333 -42% 2,005 2,014 0% 2,577 2,347 -9%<br />
Hollister<br />
East 11,914 6,792 -43% 3,867 3,962 2% 15,781 10,754 -32%<br />
Hollister<br />
West 552 399 -28% 5,118 4,375 -15% 5,670 4,774 -16%<br />
Pacheco 3,832 1,568 -59% 1,034 1,900 84% 4,866 3,468 -29%<br />
<strong>San</strong> Juan 6,160 3,160 -49% 7,658 7,796 2% 13,818 10,956 -21%<br />
Tres Pinos 804 493 -39% 2,908 2,743 -6% 3,712 3,236 -13%<br />
TOTAL 23,834 12,745 -47% 22,590 22,789 1% 46,424 35,535 -23%<br />
<strong>Water</strong> Use Trends. As discussed above, total water use and the relative contribution of the<br />
two major sources in Zone 6 for water year 2008 decreased significantly relative to past years.<br />
However, the relative water use of agriculture and M&I has remained similar to last year.<br />
Figure 8 shows the total use by M&I and agriculture. Agricultural water use represented 71<br />
percent of total use, unchanged from water year 2007. This percent of total use has decreased<br />
consistently from 88 percent of the total water use in the early 1990’s.<br />
Figure 9 shows the volume of CVP water and groundwater used from 1993 to 2008. Since<br />
1993, the amount of groundwater pumped has slowly decreased as the amount of CVP water<br />
has increased. However, this trend did not hold true in 2007 or 2008 when total groundwater<br />
use increased and has remained steady. If the CVP allocations remain at the same level for<br />
water year 2009, groundwater is expected to increase significantly. As CVP water use has<br />
decreased across all subbasins, the future increase in groundwater is also expected to occur in<br />
all subbasins. Figure 10 reveals that the same trends of CVP and groundwater use are seen in<br />
the individual subbasins as the entire Zone 6. CVP water use was decreased in every subbasin.<br />
Pacheco subbasin is the only subbasin to show a significant increase in groundwater, such that<br />
groundwater use was greater than CVP imports. This could be to the result of better water<br />
quality and/or the state of groundwater infrastructure in the basin; wells were maintained and<br />
ready to increase supply.<br />
Figure 11 shows the type of uses for both CVP and groundwater. In addition to agricultural<br />
and M&I uses, some CVP water is used to replenish groundwater and some is lost to<br />
Annual Groundwater Report for <strong>Water</strong> Year 2008 December 2008<br />
<strong>San</strong> <strong>Benito</strong> <strong>County</strong> <strong>Water</strong> <strong>District</strong> 19
evaporation and seepage from <strong>San</strong> Justo Reservoir (see Appendix D). Both agricultural and<br />
M&I uses of CVP water have increased over the past 15 years but were greatly reduced in<br />
water year 2008 because of allocation reductions. Relative to groundwater, the better quality of<br />
CVP water and pressurized delivery provide tangible benefits to agricultural customers. In<br />
addition, completion of the Lessalt water treatment plant in 2003 has allowed direct use of CVP<br />
water for City of Hollister and Sunnyslope CWD supply. Figure 11 also shows stabilization in<br />
groundwater use after decreases over the past eight years; however, this is expected to change<br />
in 2009.<br />
Figure 12 shows the total supply contribution of groundwater and CVP imports. The<br />
previously observed steady trend of additional CVP water use has slowed and in the short term<br />
has reversed. For the past few years, use of groundwater and CVP water has been nearly equal.<br />
As shown in the upper graph, groundwater use in water year 2008 was almost double CVP<br />
water use. The lower graph illustrates how groundwater use and CVP use had equalized over<br />
time but was changed significantly due to the allocation reductions.<br />
Annual Groundwater Report for <strong>Water</strong> Year 2008 December 2008<br />
<strong>San</strong> <strong>Benito</strong> <strong>County</strong> <strong>Water</strong> <strong>District</strong> 20
60,000<br />
50,000<br />
Agriculture<br />
M & I<br />
40,000<br />
<strong>Water</strong> Use (AF)<br />
30,000<br />
20,000<br />
10,000<br />
0<br />
1988 1989 1990 1991 1992 1993 19941995 1996 1997 1998 1999 2000 2001 2002 2003 20042005 2006<br />
*<br />
2007 Values Corrected From Previous Annual Report<br />
<strong>Water</strong> Year<br />
December 2008 Figure 8<br />
TODD ENGINEERS<br />
Alameda, California<br />
2007 2008<br />
<strong>Water</strong> Use in Zone 6<br />
by User Category<br />
1988-2008
60,000<br />
Groundwater<br />
CVP <strong>Water</strong><br />
50,000<br />
40,000<br />
<strong>Water</strong> Use (AF)<br />
30,000<br />
20,000<br />
10,000<br />
0<br />
19931994 1995 1996 1997 1998 1999 2000 2001 2002 20032004 2005 2006 2007 2008<br />
<strong>Water</strong> Year<br />
December 2008<br />
*<br />
2007 Values Corrected From Previous Annual Report<br />
TODD ENGINEERS<br />
Alameda, California<br />
Figure 9<br />
Total <strong>Water</strong> Use by<br />
<strong>Water</strong> Type
Bolsa SE<br />
Pacheco<br />
12,000<br />
10,000<br />
Groundwater<br />
CVP water<br />
12,000<br />
10,000<br />
Groundwater<br />
CVP water<br />
<strong>Water</strong> Use (AF)<br />
8,000<br />
6,000<br />
<strong>Water</strong> Use (AF)<br />
8,000<br />
6,000<br />
4,000<br />
4,000<br />
2,000<br />
0<br />
1993<br />
1994<br />
1995<br />
1996<br />
1997<br />
1998<br />
1999<br />
2000<br />
2001<br />
<strong>Water</strong> Year<br />
2002<br />
Hollister West<br />
2003<br />
2004<br />
2005<br />
2006<br />
2007<br />
2008<br />
2,000<br />
0<br />
1993<br />
1994<br />
1995<br />
1996<br />
1997<br />
1998<br />
1999<br />
2000<br />
2001<br />
<strong>Water</strong> Year<br />
Hollister East<br />
2002<br />
2003<br />
2004<br />
2005<br />
2006<br />
2007<br />
2008<br />
12,000<br />
10,000<br />
Groundwater<br />
CVP water<br />
12,000<br />
10,000<br />
Groundwater<br />
CVP water<br />
<strong>Water</strong> Use (AF)<br />
8,000<br />
6,000<br />
<strong>Water</strong> Use (AF)<br />
8,000<br />
6,000<br />
4,000<br />
4,000<br />
2,000<br />
0<br />
1993<br />
1994<br />
1995<br />
1996<br />
1997<br />
1998<br />
1999<br />
2000<br />
2001<br />
<strong>Water</strong> Year<br />
2002<br />
2003<br />
2004<br />
2005<br />
2006<br />
2007<br />
2008<br />
2,000<br />
0<br />
1993<br />
1994<br />
1995<br />
1996<br />
1997<br />
1998<br />
1999<br />
2000<br />
2001<br />
<strong>Water</strong> Year<br />
2002<br />
2003<br />
2004<br />
2005<br />
2006<br />
2007<br />
2008<br />
* 2007 Values Corrected From Previous Annual Report<br />
<strong>San</strong> Juan Valley<br />
Tres Pinos<br />
12,000<br />
10,000<br />
Groundwater<br />
CVP water<br />
12,000<br />
10,000<br />
Groundwater<br />
CVP water<br />
<strong>Water</strong> Use (AF)<br />
8,000<br />
6,000<br />
<strong>Water</strong> Use (AF)<br />
8,000<br />
6,000<br />
4,000<br />
4,000<br />
2,000<br />
0<br />
1993<br />
1994<br />
1995<br />
1996<br />
1997<br />
1998<br />
1999<br />
2000<br />
2001<br />
<strong>Water</strong> Year<br />
2002<br />
2003<br />
2004<br />
2005<br />
2006<br />
2007<br />
2008<br />
2,000<br />
0<br />
1993<br />
1994<br />
1995<br />
1996<br />
1997<br />
1998<br />
1999<br />
2000<br />
2001<br />
<strong>Water</strong> Year<br />
2002<br />
2003<br />
2004<br />
2005<br />
2006<br />
2007<br />
2008<br />
December 2008 Figure 10<br />
TODD ENGINEERS<br />
Alameda, California<br />
Subbasin <strong>Water</strong> Use<br />
by <strong>Water</strong> Type<br />
1993-2008<br />
<strong>Water</strong> Year
50,000<br />
CVP <strong>Water</strong><br />
Annual <strong>Water</strong> Use (AF)<br />
45,000<br />
40,000<br />
35,000<br />
30,000<br />
25,000<br />
20,000<br />
Percolation<br />
Percolation<br />
Agriculture<br />
Agriculture<br />
M & I<br />
M & I<br />
Seepage & Evaporation<br />
Seepage & Evaporation<br />
15,000<br />
1,000<br />
5,000<br />
0<br />
1988 1989 1990 1991 1992 1993 1994 1995 1996 19971998 1999 2000 2001 2002 2003 2004 2005 2006 2007 2008<br />
<strong>Water</strong> Year<br />
50,000<br />
Groundwater<br />
45,000<br />
Agriculture<br />
40,000<br />
M & I I<br />
35,000<br />
30,000<br />
25,000<br />
20,000<br />
15,000<br />
10,000<br />
5,000<br />
0<br />
<strong>Water</strong> Year<br />
December 2008<br />
* 2007 Values Corrected From Previous Annual Report<br />
Annual <strong>Water</strong> Use (AF)<br />
1988 1989 1990 1991 1992 1993 1994 1995 1996 19971998 1999 2000 2001 2002 2003 2004 2005 2006 2007 2008<br />
TODD ENGINEERS<br />
Alameda, California<br />
Figure 11<br />
Annual Total of CVP<br />
and Groundwater<br />
by Use
40,000<br />
35,000<br />
Groundwater<br />
CVP<br />
Total <strong>Water</strong> Use by Source (AFY)<br />
30,000<br />
25,000<br />
20,000<br />
15,000<br />
10,000<br />
5,000<br />
0<br />
1993 19941995 1996 1997 1998 1999 2000 2001 2002 2003 20042005 2006 2007 2008<br />
<strong>Water</strong> Year<br />
80%<br />
70%<br />
Percent CVP<br />
Percent Groundwater<br />
60%<br />
Percent of Total <strong>Water</strong> Supply<br />
50%<br />
40%<br />
30%<br />
20%<br />
10%<br />
0%<br />
1993 19941995 1996 1997 1998 1999 2000 2001 2002 2003 20042005 2006 2007 2008<br />
<strong>Water</strong> Year<br />
December 2008<br />
TODD ENGINEERS<br />
Alameda, California<br />
Figure 12<br />
Groundwater and<br />
CVP Imported <strong>Water</strong><br />
Use over Time
GROUNDWATER LEVELS AND TRENDS<br />
GROUNDWATER LEVELS<br />
Groundwater levels in over 100 wells are monitored on a quarterly cycle by the <strong>District</strong>. Figure<br />
13 shows contoured groundwater elevations from the October 2008 monitoring event. The<br />
groundwater elevation contours shown on Figure 13 were created using the methodology<br />
developed in 2007, which differs from previous years in order to more accurately account for<br />
the effects of the Calaveras Fault on water levels. This was accomplished by separately<br />
contouring the wells on the east and west sides of the fault. The contoured October 2007<br />
groundwater elevations are presented in Appendix C as Figure C-3. Groundwater elevations<br />
are highest in the Tres Pinos area to the southeast (400 feet above mean sea level and higher)<br />
and lowest in the Bolsa to the northwest, where a pumping depression results in elevations as<br />
low as 80 feet above mean sea level (msl). More groundwater level data are presented in<br />
Appendix C, including maps showing monitoring locations and groundwater elevation<br />
contours for October 2007, and a table of groundwater level data from October 2007 through<br />
October 2008.<br />
Figure 14 shows water elevations for 2008 and 2007 along three profiles crossing the basin.<br />
These profiles show not only the recent groundwater elevations, but also the range of historical<br />
water levels depicted with shading on the profiles. <strong>Water</strong> elevations in most subbasins are close<br />
to the historical high of 1913; however, Profile B shows that water levels in the Bolsa area are<br />
closer to the middle of the historical range of groundwater elevations. The Bolsa subbasin does<br />
not receive CVP imports and still relies on groundwater for all water needs. The general<br />
contour patterns and groundwater flow directions did not change significantly from October<br />
2007, but water levels were slightly higher at the end of 2008 because of reduced groundwater<br />
pumping. This indicates that the basin is not threatened by overdraft in the near future.<br />
Several areas are experiencing problems from high groundwater levels. Figure 15 shows the<br />
contours of measured depth to groundwater. The eastern part of the <strong>San</strong> Juan subbasin, the<br />
Pacheco subbasin, and the northern part of the Hollister East subbasin are areas with<br />
particularly high water levels; in some places the groundwater is within five feet of the ground<br />
surface or flowing wells are present. Areas where wells were noted to be flowing are indicated<br />
on both Figure 13 and Figure 15.<br />
Near the streams and <strong>San</strong> <strong>Benito</strong> River, such high water levels decrease the amount of potential<br />
percolation because of insufficient groundwater storage capacity to receive it (rejected<br />
recharge). As a consequence, the effectiveness of managed percolation is reduced.<br />
Furthermore, additional managed percolation may exacerbate the problems of high<br />
groundwater, including interference with the effective operation of septic systems and poor<br />
drainage of agricultural land. Certain crops, including orchards with deep root zones, are<br />
adversely affected by groundwater levels approaching or in the root zone (e.g., about four to<br />
7.9 feet for walnuts; UC Davis, 2000 and UN Food and Agriculture Organization, 2006). In the<br />
northern portion of Hollister East and the central part of <strong>San</strong> Juan, high water levels may begin<br />
Annual Groundwater Report for <strong>Water</strong> Year 2008 December 2008<br />
<strong>San</strong> <strong>Benito</strong> <strong>County</strong> <strong>Water</strong> <strong>District</strong> 26
to damage the local walnut groves and apple orchards, respectively. High water levels can also<br />
cause a threat to water quality as the water table is closer to the ground surface and more<br />
susceptible to contamination.<br />
Note that two areas of low groundwater elevations surround major pumping centers: the<br />
southern portion of Hollister East where the City of Hollister and Sunnyslope CWD have wells<br />
and the southern part of the Bolsa where intensive agricultural pumping occurs.<br />
CHANGE IN GROUNDWATER LEVELS<br />
Figure 16 documents the change in water levels from October 2007 to October 2008. In order<br />
to compute the change in water elevations, the difference between the October 2008 and the<br />
October 2007 maps was calculated and contoured. The accuracy of this map was checked by<br />
examining water level changes in individual wells that were monitored in both October 2008<br />
and October 2007.<br />
Overall, water levels rose slightly during water year 2008. The largest change occurred near the<br />
southern edge of the Hollister East subbasin where October 2008 water levels were as much as<br />
80 feet higher than in October 2007. This area has historically experienced large year-to-year<br />
fluctuations in water levels, presumably reflecting variable pumping at nearby wells.<br />
Additionally, there was a small decrease of water levels near the City of Hollister (around 10<br />
feet).<br />
Groundwater elevation changes from year to year can be used to determine the change in<br />
storage, which is the net volume of water added or removed from the basin over the water year.<br />
The change in storage was calculated by using the change in water levels (ft) and multiplying<br />
by the total area (ft 2 ) to determine the total volume change. This volume change is then<br />
multiplied by the average storativity of the subbasin (shown in the table below) to represent the<br />
amount of water that a given volume of aquifer will produce. The storativity values for each<br />
subbasin were derived from a numerical model of the basin developed by Yates and Zhang<br />
(2000).<br />
Table 5 shows the calculated change in storage for each subbasin in Zone 6. The total change<br />
for Zone 6 was an increase of 2,807 af. The greatest change occurred in the Bolsa Southeast<br />
subbasin where 2,483 af more water was stored at the end of water year 2008 compared to<br />
water year 2007. Outside Zone 6, groundwater storage in the Bolsa subbasin increased by 1,796<br />
af.<br />
Annual Groundwater Report for <strong>Water</strong> Year 2008 December 2008<br />
<strong>San</strong> <strong>Benito</strong> <strong>County</strong> <strong>Water</strong> <strong>District</strong> 27
120<br />
140<br />
220<br />
240<br />
100<br />
160<br />
260<br />
280<br />
180<br />
200<br />
300<br />
120<br />
100<br />
320<br />
80<br />
340<br />
120<br />
140<br />
100<br />
140<br />
360<br />
380<br />
<strong>San</strong> Juan<br />
Bautista<br />
200<br />
160<br />
220<br />
180<br />
240<br />
300<br />
220<br />
260<br />
280<br />
200<br />
240<br />
180<br />
280<br />
260<br />
Hollister<br />
400<br />
Legend<br />
Monitored well, 2008<br />
Flowing artesian well, 2008<br />
20-foot groundwater elevation contour<br />
Approximate area of flowing well<br />
Generalized Calaveras Fault<br />
N<br />
Highways<br />
Secondary roads<br />
Major streams<br />
<strong>San</strong> Justo reservoir<br />
0<br />
12,000<br />
Scale in Feet<br />
240<br />
260<br />
280<br />
December 2008<br />
400<br />
420<br />
TODD ENGINEERS<br />
Alameda, California<br />
Tres Pinos<br />
480<br />
Figure 13<br />
Groundwater<br />
Elevations<br />
October 2008
Elevation (feet NGVD 1929)<br />
500<br />
450<br />
400<br />
350<br />
300<br />
250<br />
200<br />
150<br />
100<br />
50<br />
B<br />
Bolsa Pacheco Hollister East<br />
Shore<br />
Road<br />
S<br />
R<br />
Calaveras<br />
Fault<br />
Ground Surface<br />
0<br />
0 10,000 20,000 30,000 40,000 50,000<br />
Distance along Line of Profile (feet)<br />
<strong>San</strong> Felipe<br />
Road<br />
Fairview<br />
Road<br />
B'<br />
Fallon<br />
Road<br />
Range of<br />
historical<br />
water<br />
levels<br />
60,000<br />
Elevation (feet NGVD 1929)<br />
500<br />
450<br />
400<br />
350<br />
300<br />
250<br />
200<br />
150<br />
100<br />
50<br />
A<br />
Range of<br />
historical<br />
water<br />
levels<br />
<strong>County</strong><br />
Line<br />
Pacheco Hollister East Tres Pinos<br />
Orchard<br />
Road<br />
Fallon<br />
Road<br />
0<br />
0 10,000 20,000 30,000 40,000 50,000 60,000 70,000<br />
McCloskey<br />
Road<br />
Ground Surface<br />
Sunnyslope<br />
Road<br />
Distance along Line of Profile (feet)<br />
Airline<br />
Highway<br />
A'<br />
Southside<br />
Road<br />
80,000<br />
Elevation (feet NGVD 1929)<br />
500<br />
450<br />
400<br />
350<br />
300<br />
250<br />
200<br />
150<br />
100<br />
50<br />
Highway<br />
101<br />
C<br />
<strong>San</strong> Juan Hollister West Hollister East<br />
Bixby<br />
Road<br />
Mitchell<br />
Road<br />
Ground Surface<br />
Calaveras<br />
Fault<br />
Fairview<br />
Road<br />
C'<br />
Range of<br />
historical<br />
water<br />
levels<br />
C<br />
B<br />
<strong>San</strong> Juan Bautista<br />
A<br />
Hollister<br />
C’<br />
B’<br />
0<br />
0 10,000 20,000 30,000 40,000 50,000 60,000 70,000<br />
Ground<br />
Surface<br />
<strong>Water</strong> year<br />
2007<br />
Distance along Line of Profile (feet)<br />
Legend<br />
<strong>Water</strong> Year<br />
2008<br />
Range of Historical<br />
<strong>Water</strong> Levels<br />
80,000<br />
December 2008<br />
TODD ENGINEERS<br />
Alameda, California<br />
A’<br />
Tres Pinos<br />
Figure 14<br />
Profiles of<br />
Historical Groundwater<br />
Levels
80<br />
80<br />
40<br />
20<br />
0<br />
Legend<br />
20-foot depth to groundwater contours<br />
Approximate area of flowing wells<br />
Generalized Calaveras fault<br />
Highways<br />
Secondary roads<br />
Major Streams<br />
N<br />
0<br />
12,000<br />
Scale in Feet<br />
20<br />
40<br />
20<br />
20<br />
60<br />
60<br />
80<br />
120<br />
100<br />
80<br />
60<br />
20<br />
120<br />
80<br />
100<br />
0<br />
60<br />
60<br />
20<br />
40<br />
20<br />
December 2008<br />
TODD ENGINEERS<br />
Alameda, California<br />
100<br />
180<br />
120<br />
140<br />
140<br />
160<br />
120<br />
100<br />
80<br />
60<br />
20<br />
100<br />
80<br />
60<br />
40<br />
120<br />
140<br />
120<br />
140<br />
80<br />
40<br />
20<br />
40<br />
60<br />
40<br />
Figure 15<br />
Depth to <strong>Water</strong><br />
October 2008<br />
20<br />
40
10<br />
10<br />
-20<br />
0<br />
-10<br />
0<br />
20<br />
-10<br />
10<br />
20<br />
0<br />
0<br />
0<br />
0<br />
0<br />
-10<br />
-10<br />
10<br />
-20<br />
0<br />
-10<br />
0<br />
<strong>San</strong> Juan Bautista<br />
0<br />
Hollister<br />
10<br />
0<br />
0<br />
0<br />
10<br />
0<br />
30<br />
50<br />
70<br />
Legend<br />
10-foot groundwater elevation change contour<br />
Generalized Calaveras Fault<br />
Major streams<br />
N<br />
Groundwater Elevation Change<br />
High: 50<br />
0<br />
Low: -50<br />
Scale in Feet<br />
12,000<br />
10<br />
0<br />
December 2008 Figure 16<br />
TODD ENGINEERS<br />
Alameda, California<br />
Tres Pinos<br />
Groundwater<br />
Elevation Change<br />
From October 2007<br />
to October 2008
Table 5. Change in Storage during <strong>Water</strong> Year 2008 for Zone 6<br />
Subbasin<br />
Area<br />
(acres)<br />
Average Change in<br />
Groundwater Height<br />
(feet)<br />
Average<br />
Subbasin<br />
Storativity<br />
<strong>San</strong> Juan 11,708 0.30 0.05 174<br />
Hollister West 6,059 3.33 0.05 1,009<br />
Tres Pinos 4,735 -0.67 0.05 -158<br />
Pacheco 7,290 -1.36 0.03 -298<br />
Hollister East 15,367 -0.87 0.03 -403<br />
Bolsa SE 2,690 11.54 0.08 2,483<br />
TOTAL ZONE 6 2,807<br />
Change in<br />
Storage (af)<br />
In recent years, the volume of managed percolation has been decreased in response to high<br />
water levels. The recent annual quantities of managed percolation are very small in comparison<br />
to the peak volumes from the late 1990s. Because managed recharge has been greatly reduced,<br />
storage fluctuations caused by pumping and other sources of recharge can be seen more clearly.<br />
When groundwater levels are high, upward fluctuations in storage are limited because excess<br />
groundwater tends to leak into streams rather than accumulate in storage. Conversely, when<br />
groundwater levels decline, groundwater discharge into streams is affected almost immediately.<br />
Figure 17 illustrates long term changes in groundwater levels in the basin. <strong>Water</strong> elevations in<br />
key wells from each subbasin for each monitoring event were averaged to produce<br />
representative hydrographs for each subbasin. These key wells are shown on the map in Figure<br />
17. It should be noted that these subbasin hydrographs represent average conditions in each<br />
subbasin and illustrate long term trends, but do not show localized variations in water levels.<br />
Over the past five years, water levels have remained fairly constant in most subbasins. This<br />
includes an interruption in the long-term rising trends seen from 1994 to 2006 in the Hollister<br />
East and Bolsa Southeast (SE) subbasins, where average water levels remained fairly stable<br />
between 2007 and 2008. The increasing trend was related to reduced groundwater pumping and<br />
increased CVP delivery for both agricultural and M&I uses. <strong>Water</strong> levels in all subbasins show<br />
a seasonal variation with the lowest water levels occurring in the fall and the highest in the<br />
spring. The Bolsa subbasin shows the most variation: 20 to 50 feet of elevation change between<br />
seasons.<br />
<strong>Water</strong> levels continue to remain generally near their historic highs in most parts of the basin.<br />
Based on these water levels and the stable management of the basin, there was no overdraft in<br />
2008 and overdraft is unlikely to occur in 2009.<br />
Annual Groundwater Report for <strong>Water</strong> Year 2008 December 2008<br />
<strong>San</strong> <strong>Benito</strong> <strong>County</strong> <strong>Water</strong> <strong>District</strong> 32
400<br />
350<br />
Hollister East<br />
Hollister West<br />
<strong>San</strong> Juan<br />
Tres Pinos<br />
Bolsa<br />
Bolsa SE<br />
Pacheco<br />
Pacheco Valley<br />
300<br />
GW Elevation (ft msl)<br />
250<br />
200<br />
150<br />
Bolsa<br />
Pacheco<br />
Pacheco Valley<br />
100<br />
50<br />
Hollister East<br />
0<br />
1976 1978 1980 1982 1984 1986 1988 1990 1992 1994 1996 1998 2000 2002 2004 2006 2008<br />
250<br />
<strong>San</strong> Juan<br />
Hollister West<br />
GW Elevation (ft msl)<br />
200<br />
150<br />
100<br />
Tres Pinos<br />
50<br />
0<br />
1976 1978 1980 1982 1984 1986 1988 1990 1992 1994 1996 1998 2000 2002 2004 2006 2008<br />
December 2008<br />
TODD ENGINEERS<br />
Alameda, California<br />
Figure 17<br />
Hydrographs of<br />
Key Wells
WATER BALANCE<br />
Annual reports prepared prior to 2006 included annual water balances to illustrate the state of<br />
the groundwater basin. Because water balances often do not change significantly from year to<br />
year, the <strong>District</strong> decided to include a special section on the groundwater balance in the Annual<br />
Report every three years. The water balances were prepared for the past three water years<br />
(2006, 2007, and 2008), employing a similar methodology as past annual reports for<br />
consistency. Detailed information about the methodologies used to estimate each water balance<br />
element is presented in Appendix E.<br />
The water balance provides a quantitative view of the state of the basin, providing estimates for<br />
the specific inflows and outflows of the basin or subbasins. While many of the values presented<br />
in the table are estimates, the relative magnitude of each water balance element helps illustrate<br />
the mechanisms at work in the basin. This detailed understanding of the groundwater system<br />
can serve as a basis to compare changes in the basin over time and provide valuable tools for<br />
groundwater basin management. The basic concept of the water balance is to show the<br />
difference between inflows and outflows and estimated change in storage. In addition to<br />
computing the net difference between the estimated total inflows and outflows, change in<br />
storage is estimated independently based on water level changes and aquifer storativity values.<br />
The water balance is prepared for each water year and for each subbasin. The results of the<br />
subbasin water balances are shown in Tables 6 through 8 and a summary of the 2006, 2007,<br />
and 2008 Zone 6 water balances is shown on Figure 18. Figure 18 also shows the water<br />
balance for 2005, the most recent wet year, for comparative purposes.<br />
INFLOWS<br />
There are six major sources of inflow to the subbasins in Zone 6 and surrounding areas. These<br />
include natural stream percolation, percolation of reservoir releases, percolation of CVP water,<br />
deep percolation (from rainfall and/or irrigation), percolation of reclaimed water, and<br />
subsurface groundwater inflow. Many of the basin inflows are controlled by hydrologic<br />
conditions. Natural stream percolation and deep percolation from rainfall are directly related to<br />
the volume and distribution of rainfall. Inflow to reservoirs is controlled by stream flow and<br />
releases are partly a function of current inflow and storage. Because they are related to rainfall,<br />
these three inflows are generally higher in wet years and lower in dry years. While water year<br />
2006 had average rainfall, both 2007 and 2008 were dry.<br />
Natural stream percolation occurs in every subbasin except the Bolsa Southeast subbasin and is<br />
most significant in subbasins with larger streams, Pacheco, Hollister West and <strong>San</strong> Juan.<br />
Stream percolation can vary considerably from year to year depending on rainfall and<br />
groundwater levels. For example, stream percolation in Zone 6 was an order of magnitude less<br />
in water year 2007 (a dry year) than in water year 2005(the most recent wet year): 1,241 af<br />
to11,540 af respectively (see Figure 18). In addition, relatively high groundwater levels in<br />
2007 and 2008 may have also contributed to “rejected recharge” or the decrease in percolation<br />
due to insufficient subsurface storage capacity.<br />
Annual Groundwater Report for <strong>Water</strong> Year 2008 December 2008<br />
<strong>San</strong> <strong>Benito</strong> <strong>County</strong> <strong>Water</strong> <strong>District</strong> 34
Reservoir releases from Hernandez and Paicines Reservoir flow to Zone 6 via the <strong>San</strong> <strong>Benito</strong><br />
River. The river percolation in the Tres Pinos, Hollister West, and <strong>San</strong> Juan subbasins from<br />
natural flow and from reservoir releases are estimated separately. Natural percolation is greater<br />
in wet year than in dry years. In 2007, additional reservoir releases occurred to allow<br />
maintenance activities at the reservoirs. These releases resulted in more flow and stream<br />
percolation in the <strong>San</strong> <strong>Benito</strong> River than would be otherwise expected. In 2008, releases were<br />
reduced.<br />
In previous years, the active percolation of imported CVP water by discharging it to local<br />
streams was an important tool for managing groundwater levels in many of the Zone 6<br />
subbasins. In recent years, much less percolation of CVP imports has occurred because of<br />
rising groundwater levels and decreased CVP allocations. The percolation that does occur is<br />
limited to the Hollister West and Tres Pinos subbasins.<br />
Deep percolation from the root zone to the water table is estimated separately for rainfall<br />
percolation and irrigation percolation. Rainfall percolation varies significantly on an annual<br />
basis, while irrigation percolation remains relatively steady. Rainfall deep percolation is<br />
dependent on the volume of rainfall, temporal and areal distribution of rainfall, crop type/land<br />
cover, and soil type. More percolation from rainfall can occur if rainfall occurs in a short period<br />
of time when soils are already at field capacity, than if rainfall is evenly distributed over the<br />
season and subject to continual evapotranspiration. While 2005 was a wet year and water year<br />
2008 was a dry year, the volume of rainfall percolation was similar (see Figure 18), because of<br />
the large amount of rainfall that occurred in a short period of time in January 2008. Also as the<br />
volume of deep percolation accounts for the area of land, subbasins with the largest areas tend<br />
to have the largest amount of deep percolation (e.g. <strong>San</strong> Juan and Bolsa). Since land use and<br />
soil type do not change significantly from year to year, the relative volume of deep percolation<br />
(the portion of the total volume from an individual subbasin) also does not change significantly.<br />
Percolation of reclaimed water from wastewater disposal ponds occurs in three subbasins<br />
(Hollister West, Tres Pinos, and <strong>San</strong> Juan) at facilities operated by the City of Hollister,<br />
Sunnyslope, and Tres Pinos <strong>County</strong> <strong>Water</strong> <strong>District</strong>. Over the past four years, reclaimed water<br />
percolation has remained the same or has decreased slightly because of residential and<br />
industrial water conservation measures (Wittry, 2007).<br />
Groundwater can also flow between adjacent subbasins. While there is a large amount of<br />
uncertainty in calculating the subsurface flow, water level gradients were used to help quantify<br />
the volume of flow. As groundwater flow directions and levels have not changed significantly<br />
over the past few years, estimated groundwater inflow and outflow also have not changed<br />
significantly. Groundwater inflow may also include some component of baseflow in streams,<br />
which is difficult to accurately quantify. This component has not been specifically estimated<br />
and may be refined in future water balance calculations.<br />
OUTFLOWS<br />
The major outflows from the subbasins in Zone 6 and surrounding areas are groundwater<br />
pumping (agricultural and M&I plus domestic) and subsurface outflow (see Figure 18).<br />
Annual Groundwater Report for <strong>Water</strong> Year 2008 December 2008<br />
<strong>San</strong> <strong>Benito</strong> <strong>County</strong> <strong>Water</strong> <strong>District</strong> 35
Agricultural groundwater pumping is measured directly in Zone 6 and is estimated for the<br />
surrounding areas based on the soil moisture balance and crop water demands. The amount of<br />
agricultural pumping is dependent on the volume of CVP imports and the amount and<br />
distribution of rainfall, as growers in the area often rely on both groundwater and CVP imports<br />
for water supply.<br />
Agricultural groundwater pumping increased slightly. From 12,056 af in 2005 to 14,796 af in<br />
2008. Subbasins with the largest areal extent also have the largest amount of agricultural<br />
pumping (e.g., <strong>San</strong> Juan and the Bolsa). The relative amount of agricultural pumping per<br />
subbasin remains the same year to year.<br />
Domestic, municipal, and industrial pumping remained about the same during water years 2005<br />
through 2008. Municipal pumping is largely concentrated in the Hollister West, Hollister East,<br />
and Tres Pinos subbasins.<br />
Groundwater subsurface outflow was calculated along with subsurface inflow. As with<br />
subsurface inflow, volumes did not change significantly over time. Groundwater outflow may<br />
include baseflow in streams, which difficult to accurately quantify. This component has not<br />
been specifically estimated and may be refined in future water balance calculations.<br />
CHANGE IN STORAGE<br />
The water balance tables (Tables 6 through 8) include two estimates of storage change; the<br />
difference between inflows and outflows and the previously decribed estimate based on<br />
changes in measured water levels. In general, during wet and average years, the basin shows a<br />
net increase in groundwater storage and during dry years the basin shows a net decrease in the<br />
change in storage. These changes are also estimated on the subbasin level. The magnitude of<br />
the change in storage in the recent years has been smaller than those observed in previous<br />
years, as shown in Figure 19. The increased reliance on CVP imports has stabilized<br />
groundwater pumping in the basin. However, as a result of recent CVP allocation reductions,<br />
groundwater storage may once again vary widely as groundwater becomes a major water<br />
supply source.<br />
WATER BALANCE CONCLUSIONS<br />
As illustrated on Figure 18, groundwater outflows in Zone 6 have remained fairly constant in<br />
recent years while inflows have varied in response to annual hydrologic conditions. The district<br />
should continue to manage groundwater levels (and therefore groundwater storage) by<br />
augmenting inflows when water is available through managed percolation or other methods.<br />
Active management of the groundwater basin can help ensure that water supply is available<br />
when needed.<br />
Annual Groundwater Report for <strong>Water</strong> Year 2008 December 2008<br />
<strong>San</strong> <strong>Benito</strong> <strong>County</strong> <strong>Water</strong> <strong>District</strong> 36
Table 6. <strong>Water</strong> Balance for <strong>Water</strong> Year 2006<br />
Bolsa<br />
Southeast<br />
Hollister<br />
West<br />
Hollister<br />
East<br />
Zone 6<br />
Subtotal Bolsa Paicines<br />
Tres Pinos<br />
Creek<br />
Valley<br />
Pacheco<br />
<strong>San</strong> Juan<br />
Tres Pinos<br />
Inflows<br />
Stream percolation<br />
Natural streamflow* 1,659 0 1,410 1,134 2,681 378 7,263 500 238 2,521 10,522<br />
Reservoir releases 0 0 587 1,222 0 407 2,217 0 0 0 2,217<br />
CVP Percolation 0 0 0 451 0 1 452 0 0 0 452<br />
Deep percolation through soils<br />
Rainfall+ 1,763 699 5,499 1,396 2,859 842 13,059 3,853 451 110 17,472<br />
Irrigation 447 252 1,262 194 953 100 3,207 623 102 32 3,964<br />
Reclaimed water percolation 0 0 2,402 606 0 249 3,257 0 0 0 3,257<br />
Groundwater inflow 4,000 3,750 500 2,750 1,250 4,000 16,250 6,000 500 500 23,250<br />
Total 7,869 4,700 11,660 7,753 7,743 5,978 45,704 10,976 1,290 3,162 61,133<br />
Outflows<br />
Wells<br />
Agricultural 1,029 1,856 5,822 1,422 1,263 842 12,234 6,234 1,016 316 19,800<br />
Domestic and M &I 180 8 919 3,211 1,292 1,645 7,255 0 0 49 7,304<br />
Groundwater outflow 4,250 2,000 2,000 3,750 1,500 2,750 16,250 5,250 500 500 22,500<br />
Total 5,458 3,864 8,741 8,383 4,055 5,238 35,739 11,484 1,516 865 49,603<br />
Storage change<br />
Inflows - outflows 2,411 837 2,919 (630) 3,688 741 9,965 (508) (225) 2,298 11,530<br />
<strong>Water</strong> level change 410 245 442 770 1,539 409 3,815 1,195 0 0 5,010<br />
*Rejected recharge was assumed to be 50 % for Pacheco; natural percolation in <strong>San</strong> Juan subbasin was also decreased by 50 percent to represent rejected recharge.<br />
+Deep percolation from rainfall was decreased by 20 percent to account for additional runoff and rejected recharge during wet times.<br />
Grand<br />
Total
Table 7. <strong>Water</strong> Balance for <strong>Water</strong> Year 2007<br />
Bolsa<br />
Southeast<br />
Hollister<br />
West<br />
Hollister<br />
East<br />
Zone 6<br />
Subtotal Bolsa Paicines<br />
Tres Pinos<br />
Creek<br />
Valley<br />
Pacheco<br />
<strong>San</strong> Juan<br />
Tres Pinos<br />
Inflows<br />
Stream percolation<br />
Natural streamflow* 799 0 25 73 319 24 1,241 500 34 2,673 4,448<br />
Reservoir releases 0 0 767 2,297 0 766 3,830 0 0 0 3,830<br />
CVP Percolation 0 0 0 216 0 88 304 0 0 0 304<br />
Deep percolation through soils<br />
Rainfall 378 179 1,166 287 402 66 2,478 759 96 17 3,350<br />
Irrigation 457 257 1,218 214 1,069 95 3,311 709 116 35 4,170<br />
Reclaimed water percolation 0 0 2,354 614 0 158 3,126 0 0 0 3,126<br />
Groundwater inflow 4,500 3,000 250 3,000 1,250 3,000 15,000 6,000 500 500 22,000<br />
Total 6,135 3,436 5,781 6,701 3,040 4,197 29,290 7,968 746 3,224 41,228<br />
Outflows<br />
Wells<br />
Agricultural 810 1,998 6,562 1,662 2,366 849 14,247 7,086 1,156 350 22,839<br />
Domestic and M &I 224 7 1,096 3,456 1,501 2,013 8,297 0 0 46 8,343<br />
Groundwater outflow 4,250 2,000 500 2,750 1,500 1,250 12,250 1,500 500 500 14,750<br />
Total 5,284 4,005 8,158 7,868 5,367 4,112 34,794 8,586 1,656 896 45,932<br />
Storage change<br />
Inflows - outflows 851 (569) (2,377) (1,168) (2,327) 85 (5,504) (618) (910) 2,328 (4,703)<br />
<strong>Water</strong> level change (958) (1,466) (2,530) (400) (2,909) (220) (8,482) (862) 0 0 (9,344)<br />
* No rejected recharge removed.<br />
Grand<br />
Total
Table 8. <strong>Water</strong> Balance for <strong>Water</strong> Year 2008<br />
Bolsa<br />
Southeast<br />
Hollister<br />
West<br />
Hollister<br />
East<br />
Zone 6<br />
Subtotal Bolsa Paicines<br />
Tres Pinos<br />
Creek<br />
Valley<br />
Pacheco<br />
<strong>San</strong> Juan<br />
Tres Pinos<br />
Inflows<br />
Stream percolation<br />
Natural streamflow* 1,131 0 496 275 726 92 2,719 500 146 2,669 6,035<br />
Reservoir releases 0 0 412 564 0 188 1,164 0 0 0 1,164<br />
CVP Percolation 0 0 0 6 0 0 6 0 0 0 6<br />
Deep percolation through soils<br />
Rainfall 1,111 556 4,414 898 2,150 594 9,723 2,928 224 41 12,916<br />
Irrigation 322 233 958 151 801 66 2,531 789 126 37 3,483<br />
Reclaimed water percolation 0 0 2,209 629 0 158 2,996 0 0 0 2,996<br />
Groundwater inflow 4,750 4,000 250 3,000 1,000 3,500 16,500 7,000 500 500 24,500<br />
Total 7,314 4,790 8,739 5,522 4,678 4,597 35,639 11,217 996 3,247 51,099<br />
Outflows<br />
Wells<br />
Agricultural 1,703 2,001 6,744 1,143 2,639 567 14,796 7,889 1,255 372 24,313<br />
Domestic and M &I 197 13 1,053 3,232 1,323 2,130 7,947 0 0 47 7,993<br />
Groundwater outflow 5,500 1,250 250 3,500 1,500 2,500 14,500 1,250 500 500 16,750<br />
Total 7,400 3,264 8,046 7,875 5,462 5,197 37,243 9,139 1,755 919 49,056<br />
Storage change<br />
Inflows - outflows (85) 1,525 693 (2,353) (784) (600) (1,604) 2,078 (759) 2,328 2,043<br />
<strong>Water</strong> level change (298) 2,483 174 1,009 (403) (158) 2,807 1,796 0 0 4,603<br />
* No rejected recharge removed.<br />
Grand<br />
Total
60,000<br />
<strong>Water</strong> Balance Element Contribution (AFY)<br />
40,000<br />
20,000<br />
0<br />
Inflows<br />
Groundwater Inflow<br />
Reclaimed Wastewater<br />
Deep Perc - Irrigation<br />
Deep Perc - Rainfall<br />
Percolation of Reservoir releases<br />
Percolation of CVP releases<br />
Percolation of Natural streamflow<br />
Outflows<br />
Pumping - Agricultural<br />
Pumping - Domestic and M&I<br />
Groundwater Outflow<br />
(-20,000)<br />
(-40,000)<br />
2005 2006 2007 2008<br />
<strong>Water</strong> Year<br />
December 2008<br />
TODD ENGINEERS<br />
Alameda, California<br />
Figure 18<br />
Summary of Zone 6<br />
<strong>Water</strong> Balances<br />
2005 - 2008
40,000<br />
<strong>Water</strong> Balance Element Contribution (AFY)<br />
30,000<br />
20,000<br />
10,000<br />
0<br />
-10,000<br />
-20,000<br />
-30,000<br />
1975 1980 1985 1990 1995 2000 2005 2010<br />
<strong>Water</strong> Year<br />
December 2008<br />
TODD ENGINEERS<br />
Alameda, California<br />
Figure 19<br />
Change in Storage<br />
1978 - 2008
REVENUES AND CHARGES<br />
DISTRICT REVENUES<br />
The <strong>District</strong> derives its revenue from two primary sources: charges levied on landowners and<br />
water users, and income from property taxes. Income from charges on water users is classified<br />
as operating revenue and varies with the amount of water sold. Non-operating revenue is not a<br />
function of the volume of water sales or purchases, and consists primarily of property taxes,<br />
interest, standby and availability charges, and grants. Within each of these two categories, the<br />
accounting is further subdivided by zone of benefit. Zone 3 relates to the operation of<br />
Hernandez and Paicines reservoirs, and Zone 6 relates to the importation and distribution of<br />
CVP water. The Zone 6 budget is by far the larger of the two, and revenues during fiscal year<br />
2008 totaled $12.0 million. Approximately 21 percent of that amount was operating revenue<br />
from sales of CVP water and 53 percent was from property taxes. The remaining 26 percent<br />
came from interest, grants and other sources.<br />
DISTRICT CHARGES<br />
Some of the revenue received by the <strong>District</strong> stems from charges that are set by the <strong>District</strong> and<br />
adjusted annually in March. These include a standby and availability charge, water service<br />
charges for CVP water, power charges, and groundwater charges. The power charge reflects<br />
the energy cost of pumping CVP water to each subsystem of the distribution network, with<br />
higher charges for high-elevation subsystems. The current charges are shown in Table 9 and<br />
historical charges are tabulated in Appendix F, Table F-1. Charges for CVP water users were<br />
increased slightly from 2007.<br />
The standby and availability charge is a uniform per-acre charge assessed on all parcels that<br />
presently have access to CVP water (an active or idle turnout from the distribution system).<br />
The charge has remained at $6 per acre for over 10 years, which is the maximum charge<br />
allowed under the <strong>District</strong>’s formation act.<br />
<strong>Water</strong> service charges vary by type of user, reflecting the user categories established by the<br />
U.S. Bureau of Reclamation (USBR) for all CVP contractors. The water service charges consist<br />
of USBR fixed and variable costs that are assigned differently to agricultural users and M&I<br />
users, as itemized in Appendix F, Table F-2. In March 2007, the <strong>District</strong>’s contract with<br />
USBR was renegotiated to remove existing capital costs from the unit purchase cost of water.<br />
A separate repayment plan was established for existing capital cost.<br />
Annual Groundwater Report for <strong>Water</strong> Year 2008 December 2008<br />
<strong>San</strong> <strong>Benito</strong> <strong>County</strong> <strong>Water</strong> <strong>District</strong> 42
The groundwater rate basis reflects the cost of purchasing CVP water for percolation along<br />
local creeks and rivers and power charges associated with percolation. The per-acre-foot charge<br />
is determined by dividing these costs by the amount of anticipated percolation based on<br />
historical practice. In addition, <strong>District</strong> costs associated with groundwater monitoring and<br />
management are divided by the volume of groundwater usage. The groundwater charges are<br />
shown in Appendix F, Table F-3. The groundwater charge for 2009 is recommended to<br />
increase to $2.50/af and $22.50/af, for agriculture and M&I respectively.<br />
Table 9. Charges for Zone 6 <strong>Water</strong> Users, March 2008 - February 2009<br />
Agricultural<br />
Non--Full Full Municipal<br />
Charge Unit Cost Cost (1)<br />
&<br />
Industrial<br />
Standby and<br />
Availability dollars/acre $6.00 $6.00 $6.00<br />
Groundwater dollars/acre-foot $1.50 $1.50 $21.50<br />
CVP (Blue Valve)<br />
<strong>Water</strong> charge (2) dollars/acre-foot $100.00 $220.00 $170.00<br />
Power charge<br />
Subsystem 2 dollars/acre-foot $17.25 $17.25 $17.25<br />
Subsystem 6H dollars/acre-foot $19.40 $19.40 $19.40<br />
Subsystem 9H dollars/acre-foot $62.75 $62.75 $62.75<br />
Subsystem 9L dollars/acre-foot $32.60 $32.60 $32.60<br />
All other<br />
subsystems dollars/acre-foot $14.85 $14.85 $14.85<br />
Full-cost rates for agricultural users apply to landholders who have exceeded the respective nonfull-cost<br />
entitlement. There are two full-cost rates:<br />
1. Section 202(3) - the lower full-cost rate, which applies to qualified recipients leasing in excess of their<br />
960-acre entitlement, limited recipients that received USBR irrigation water on or before October 1,<br />
1981, and extended recordable contracts. There are currently no Zone 6 full-cost users under this section.<br />
2. Section 205(a)(3) - the higher full-cost rate, which applies to prior law recipients leasing in excess of<br />
their applicable nonfull-cost entitlement, and limited recipients that did not receive USBR irrigation<br />
water on or before October 1, 1981 See Section 202(3) or 205(a)(3) of RRA Rules and Regulations for<br />
further nonfull-cost definitions.<br />
For parcels 10 acres or smaller in size the water charge is $31.00 bi-monthly for all use categories. Bimonthly<br />
charges include annual minimum quantity (Agricultural at 2 acre-feet per year and M&I at 1<br />
acre-foot per year), with water use above the annual minimum charged at applicable Agricultural or Non-<br />
Agricultural water rate.<br />
Annual Groundwater Report for <strong>Water</strong> Year 2008 December 2008<br />
<strong>San</strong> <strong>Benito</strong> <strong>County</strong> <strong>Water</strong> <strong>District</strong> 43
CONDITIONS EXPECTED FOR WATER YEAR 2009<br />
<strong>Water</strong> supply for 2009 will depend on factors including rainfall, local surface water storage,<br />
groundwater storage, and CVP operations and storage. Next year, water supply will continue to<br />
be impacted by recent court decisions on the Delta smelt, Longfin smelt, and salmonoids.<br />
In May 2007, the U.S. <strong>District</strong> Court in Fresno ruled that the existing 2005 biological opinion<br />
for Delta smelt (issued by the U.S. Fish and Wildlife Service) was not in compliance with the<br />
Endangered Species Act. The biological opinion guides pumping operations for the CVP (and<br />
State <strong>Water</strong> Project) in the Delta with the intent of doing no harm to the endangered Delta<br />
smelt. In August of 2007, the Court also ordered interim actions to protect the smelt. For 2008<br />
allocations were 40 percent for agriculture and 75 percent of historical use based on the<br />
Bureau’s M&I shortage policy.<br />
While there is still considerable uncertainty about the percentage of allocation that is expected<br />
to be delivered in 2009, some reduction from 2008 may be anticipated. The amount of Delta<br />
pumping (and degree of water supply reductions) will depend not only on rainfall and storage<br />
in CVP reservoirs, but also on the amount and direction of <strong>San</strong> Joaquin River flows in the Delta<br />
and the abundance and distribution of Delta smelt as they occur next spring.<br />
The <strong>San</strong> Luis & Delta Mendota <strong>Water</strong> Authority have already forecasted a low CVP allocation<br />
based on relatively low storage in Northern California CVP reservoirs. As of November 6,<br />
2008, storage in major Northern California CVP reservoirs (Trinity, Shasta, and Folsom) was<br />
27 percent of capacity and 48 percent of the 15-year average. While long-range weather<br />
forecasts are not particularly reliable, the climate predictions indicate a weak La Niña condition<br />
in the Pacific Ocean, which is expected to continue into early 2009 (DWR 2009 California<br />
Winter Outlook Workshop, November 21, 2008). In response, much of California is expected<br />
to be drier than normal, although precipitation may be higher than normal in Northern<br />
California, where key CVP reservoirs are located.<br />
In 2008, the reduction in CVP imports did not result in an increase in groundwater pumping to<br />
meet the total water demand as expected. Instead total water demand decreased by 25 percent.<br />
The decrease could be attributed to several factors including the lack of groundwater<br />
infrastructure to meet demand, changes in crops and agricultural water use, and the fallowing<br />
of fields. These factors suggest that the decrease is short term and that groundwater pumping<br />
will increase significantly in 2009 to compensate for the lack of CVP imports.<br />
Total water demand in 2009 is expected to increase to the levels observed in 2007. Assuming<br />
CVP import allocations are decreased to similar levels as water year 2008, groundwater<br />
pumping in 2009 is expected to increase by about 8,300 af and 2,700 af for agricultural use and<br />
M&I use respectively. The expected total groundwater pumping (33,800 af) is still significantly<br />
lower than the historic high of 41,617 af (1991).<br />
Annual Groundwater Report for <strong>Water</strong> Year 2008 December 2008<br />
<strong>San</strong> <strong>Benito</strong> <strong>County</strong> <strong>Water</strong> <strong>District</strong> 44
Storage in local surface water reservoirs is generally higher than last year. Storage in<br />
Hernandez Reservoir was increased to 2,693 af by the end of water year 2008, up from the low<br />
of 590 af at the end of 2007 that was the result of maintenance activities. However, this is only<br />
16 percent of the reservoir’s capacity. Storage in Paicines Reservoir (capacity 2,870 af) was<br />
300 af, reduced from 800 af at the same time last year. This represents 10 percent of capacity.<br />
<strong>San</strong> Justo Reservoir stored 7,691 af as of September 2008, essentially the same as in September<br />
2007. In addition, since groundwater levels increased slightly from October 2007, groundwater<br />
levels and storage as of October 2008 were near historical highs over much of the basin.<br />
The reduction in CVP water availability following the U.S. <strong>District</strong> Court decision regarding<br />
Delta smelt protection is likely to decrease the average annual importation of CVP water by the<br />
<strong>District</strong>. Furthermore, municipal groundwater pumping is expected to increase as the City of<br />
Hollister implements a plan to meet future increases in water demand with demineralized<br />
groundwater. Both of these actions will tend to shift the groundwater balance in a negative<br />
direction, but it is not clear that the extent of the shift will create problems in the short term.<br />
The shift will be partially offset by increased recharge from stream percolation and decreased<br />
groundwater discharge to streams and agricultural drains. Current groundwater storage is<br />
sufficient to accommodate several successive dry years with negative water budgets, and the<br />
capacity for groundwater recovery in subsequent wet years is sufficient to balance moderate<br />
increases in groundwater pumping without causing long-term overdraft.<br />
Annual Groundwater Report for <strong>Water</strong> Year 2008 December 2008<br />
<strong>San</strong> <strong>Benito</strong> <strong>County</strong> <strong>Water</strong> <strong>District</strong> 45
RECOMMENDATIONS<br />
This annual report is required under Section 70-7.6 of the State <strong>Water</strong> Code to include<br />
recommendations regarding groundwater production, groundwater replenishment, CVP<br />
imports, and water charges in water year 2009.<br />
In 2009, the <strong>District</strong> continues to face an uncertain imported water supply as the ramifications<br />
of the May 2007 Court decision on Delta smelt and the July 2008 Court decision on the Delta<br />
salmonoids are materialized over the upcoming months. While CVP allocations are expected to<br />
remain similar to those observed in water year 2008, groundwater use is expected to increase as<br />
groundwater infrastructure is put in place to meet growing demand and users adjust their<br />
cropping and irrigation practices to rely more heavily on groundwater. However, in past years<br />
the <strong>District</strong> has accumulated substantial reserves in the groundwater basin that can now be<br />
relied upon for water supply.<br />
GROUNDWATER PRODUCTION AND REPLENISHMENT<br />
Groundwater levels increased slightly over the past year and groundwater storage in most<br />
subbasins is near historic highs. Groundwater storage is adequate to meet water demands in<br />
2009 and years thereafter. As a matter of perspective, groundwater pumping over the four<br />
drought years of 1988 through 1991 averaged 34,456 afy, similar to the amount estimated for<br />
2009. These pumping rates resulted—as expected—in temporary groundwater level declines<br />
(see Figure 17). The recommended amount of groundwater production for 2009 is the<br />
amount—in conjunction with available CVP water—that meets agricultural, M&I, and<br />
domestic water demands, assuming efficient water management practices.<br />
Historically, the <strong>District</strong> conducted extensive percolation operations that ultimately reversed<br />
overdraft and then accumulated a substantial water supply reserve. <strong>District</strong> management of<br />
groundwater storage in conjunction with surface water is currently being refined to avoid<br />
excessively high or low water levels both on a temporal and geographic basis. In 2009, storage<br />
in Hernandez Reservoir should be replenished and percolation of available local water supplies<br />
should be focused on areas exhibiting declines in response to drought and increased pumping.<br />
In the longer term, the <strong>District</strong> should consider the ramifications for groundwater management<br />
of increasingly unreliable CVP supply. While overall groundwater storage is substantial,<br />
increasing use of groundwater is likely to result in localized declines. Such potential problems<br />
can be minimized with groundwater management planning that addresses the distribution of<br />
groundwater pumping relative to areas of historical high groundwater and to areas of historical<br />
and existing percolation activities. The percolation capabilities of the latter areas (including<br />
<strong>District</strong> access, permeable surficial sediments, and flat channel area for water spreading) may<br />
need protection in light of intensifying and potentially competing land uses.<br />
Annual Groundwater Report for <strong>Water</strong> Year 2008 December 2008<br />
<strong>San</strong> <strong>Benito</strong> <strong>County</strong> <strong>Water</strong> <strong>District</strong> 46
CVP IMPORTS<br />
For 2009, it is recommended that—insofar as reduced allocations allow—the <strong>District</strong> should<br />
continue providing CVP water requested by agricultural customers up to the base allocation<br />
and to apply restrictive measures only to additional amounts. Under the Court decisions<br />
mentioned above, the overall availability of CVP water for percolation is likely to be limited in<br />
2009. However, the ramifications of the Court ruling may vary from month to month, providing<br />
temporary opportunities that should be evaluated in the context of managing local groundwater<br />
levels.<br />
GROUNDWATER INFRASTRUCTURE<br />
Given the current predictions for CVP delivery in 2009 and beyond, it is likely that use of<br />
groundwater will be increased to meet the water demands of most of the water users in the<br />
basin. A key component of a transition to large scale groundwater use is rehabilitation and<br />
maintenance of wells and pumping equipment. This report should serve as an additional alert<br />
to existing CVP customers that delivery may continue to be reduced and that individual<br />
groundwater users may wish to take stock of their groundwater infrastructure, which could<br />
make this transition smoother.<br />
GROUNDWATER MONITORING<br />
The network of wells used for monitoring groundwater levels has developed a gap in the<br />
western <strong>San</strong> Juan Valley due to the destruction or capping of several wells that were formerly<br />
in the network. To enhance the existing network, the <strong>District</strong> should consider adding several<br />
wells in that area that can be added to the monitoring network. It is also recommended the<br />
<strong>District</strong> continue to monitor all available wells in the monitoring network quarterly to identify<br />
seasonal changes.<br />
GROUNDWATER CHARGES<br />
In 2006, the <strong>District</strong> revised its methodology for determining groundwater charges. This new<br />
methodology is straightforward, reasonable and justifiable. Based on this method, the 2009<br />
groundwater charge of $2.50 is recommended for agricultural use in Zone 6 and a groundwater<br />
charge of $22.50 is recommended for M&I use in Zone 6.<br />
While the revised method is justifiable and reasonable, it is recommended that the <strong>District</strong><br />
consider a longer term rate plan with a broader justification for groundwater charges. This plan<br />
may be predicated on completion of a comprehensive financial plan and rate review. It also<br />
could include consideration of funding CVP percolation activities when needed from a reserve<br />
fund, modifying groundwater charges to encourage groundwater use in specified locales (for<br />
example, with high groundwater problems), and use of water transfers to minimize payment for<br />
unused <strong>District</strong> CVP M&I allocation.<br />
Annual Groundwater Report for <strong>Water</strong> Year 2008 December 2008<br />
<strong>San</strong> <strong>Benito</strong> <strong>County</strong> <strong>Water</strong> <strong>District</strong> 47
CONSIDERATIONS FOR FUTURE STUDIES<br />
Model Update and Documentation – A numerical model was developed for the <strong>District</strong> by<br />
Gus Yates to simulate regional groundwater flow. The numerical model is a powerful tool that<br />
allows simulation of management scenarios, prediction of future impacts to the basin, and<br />
quantitative assessment of the basin water balance. The model-simulated water balance and the<br />
analytical water balance methods presented in the annual report should be compared to identify<br />
inconsistencies and focus on reducing the uncertainty of both the analytical and numerical<br />
methods. The model should be updated to reflect the hydrologic conditions in recent years and<br />
tested to ensure that the conceptual and numerical model are still reasonable. Documentation of<br />
the model should be prepared for the <strong>District</strong> so the model objective and limitations are<br />
understood.<br />
Surface <strong>Water</strong>/Groundwater Interaction – Stream percolation, both natural and managed,<br />
has been a critical component of groundwater basin management. As water users in the basin<br />
transition from CVP imports to increased groundwater use, managed percolation will once<br />
again be a tool to help manage groundwater levels. An updated literature review, assessment of<br />
available data, and new field studies can refine the methodology used to estimate surface water<br />
contributions to the groundwater system and to better understand the groundwater-surface<br />
water interaction. This analysis would assist the <strong>District</strong> in increasing the efficiency of<br />
managed percolation, which could be beneficial in light of decreased CVP deliveries.<br />
Pending Developments – Several large developments have been proposed in the basin beyond<br />
existing urban limits and could significantly increase total water demand in some areas. While<br />
the Urban <strong>Water</strong> Management Plan (UWMP) documents future water demand for the Hollister<br />
Urban Area, there is no planning vehicle that examines future water demand of the entire basin.<br />
<strong>Water</strong> Supply Assessments (WSA) prepared for these projects, the Hollister Urban Area<br />
UWMP, and other water demand estimates should be reviewed by the <strong>District</strong> and incorporated<br />
in a comprehensive analysis of future basin-wide water demand.<br />
CONSIDERATIONS FOR FUTURE ANNUAL REPORTS<br />
For each of the past three water years, a special topic has been identified for further<br />
consideration. Recent topics have included: a detailed look at water rates in water year 2006, an<br />
update of water quality in water year 2007, and an update of the water balance in water year<br />
2008. It is recommended that the water quality analysis and the water balance continue to be<br />
updated every three years. The next water quality update and water balance update would be<br />
performed in water year 2010 and 2011, respectively. It is recommended that the 2009 Annual<br />
Report include a comprehensive review and evaluation of the current groundwater basin<br />
management activities.<br />
Annual Groundwater Report for <strong>Water</strong> Year 2008 December 2008<br />
<strong>San</strong> <strong>Benito</strong> <strong>County</strong> <strong>Water</strong> <strong>District</strong> 48
REFERENCES<br />
Allen, R.G., L.S. Pereira, D. Taes and M. Smith. 1999. Crop evapotranspiration. Irrigation and<br />
Drainage Paper No. 56, United Nations Food and Agriculture Organization, Rome, Italy.<br />
Blaney, H.F., P.R. Nixon, G.P. Lawless and E.J. Wiedman. 1963. Utilization of the waters of<br />
the <strong>San</strong>ta Ynez River basin for agriculture in southern <strong>San</strong>ta Barbara <strong>County</strong>, California. U.S.<br />
Dept. of Agriculture, Agricultural Research Service.<br />
Bookman-Edmonston/GEI, Occurrence and Management of High Groundwater, Report to <strong>San</strong><br />
<strong>Benito</strong> <strong>County</strong> <strong>Water</strong> <strong>District</strong>, 2006.<br />
California Department of <strong>Water</strong> Resources, Vegetative <strong>Water</strong> Use in California, Bulletin. 113-<br />
3, 1975, Published. 1979.<br />
Department of <strong>Water</strong> Resources, 2009 Winter Outlook Workshop, Webcast, November 21,<br />
2008.<br />
Draft report prepared for <strong>San</strong> <strong>Benito</strong> <strong>County</strong> <strong>Water</strong> <strong>District</strong>, January 16, 2006.<br />
Dunne, T. and L.B. Leopold. 1978. <strong>Water</strong> in Environmental Planning. W.H. Freeman and<br />
Company, <strong>San</strong> Francisco, CA.<br />
GEI Bookman-Edmonston, Occurrence and Management of High Groundwater, North Area,<br />
HDR, Hollister Urban Area <strong>Water</strong> and Wastewater Master Plan¸ Draft report prepared for <strong>San</strong><br />
<strong>Benito</strong> <strong>County</strong> <strong>Water</strong> <strong>District</strong>, February 2007<br />
Hydroscience Engineers, City of Hollister Long-Term Wastewater Management Program for the<br />
DWTP and IWTP, December 2005. Accessed November 27, 2006 at<br />
http://www.hollister.ca.gov/Site/html/gov/office/engr_wwtp.asp<br />
RMC, Pajaro River <strong>Water</strong>shed Groundwater Desalination Feasibility Study, Draft Report,<br />
September 5, 2007.<br />
RMC, Sunnyslope <strong>County</strong> <strong>Water</strong> <strong>District</strong> Long-Term Wastewater Management Plan, Executive<br />
Summary, January 2006.<br />
Rosskamp, Dale, <strong>San</strong> <strong>Benito</strong> <strong>County</strong> <strong>Water</strong> <strong>District</strong>, Personal Communication, November 6,<br />
2008.<br />
Annual Groundwater Report for <strong>Water</strong> Year 2008 December 2008<br />
<strong>San</strong> <strong>Benito</strong> <strong>County</strong> <strong>Water</strong> <strong>District</strong> 49
<strong>San</strong> <strong>Benito</strong> <strong>County</strong> <strong>Water</strong> <strong>District</strong>, Pajaro Valley <strong>Water</strong> Management Agency, and <strong>San</strong>ta Clara<br />
Valley <strong>Water</strong> <strong>District</strong>, Pajaro River <strong>Water</strong>shed Integrated Regional <strong>Water</strong> Management Plan –<br />
Executive Summary, May 2007.<br />
<strong>San</strong> Luis & Delta Mendota <strong>Water</strong> Authority (SLDMWA), September Project Operations<br />
Update, Memorandum from Tom Boardman, <strong>Water</strong> Resources Engineer, to Dan Nelson,<br />
Executive Director, September 5, 2007.<br />
<strong>San</strong> Luis & Delta-Mendota <strong>Water</strong> Authority (SLDMWA), Central Valley Project Operations<br />
Status And Forecast Report For Week Ending 11-14-08, November 14, 2008,<br />
http://www.sldmwa.org/pdf_documents/sldmwareport11-14-08.pdf<br />
<strong>San</strong> Luis & Delta-Mendota <strong>Water</strong> Authority (SLDMWA), Central Valley Project Operations<br />
Status And Forecast Report For Week Ending 11-14-08, November 14, 2008,<br />
http://www.sldmwa.org/pdf_documents/Reclamation%20<strong>Water</strong>%20Allocation%20June%202%<br />
202008.pdf<br />
Smith, Richard, U.C. Cooperative Extension, Personal Communication to Gus Yates, 2001.<br />
State <strong>Water</strong> Resources Control Board, GAMA - Groundwater Ambient Monitoring &<br />
Assessment Program, http://www.swrcb.ca.gov/gama/, Last Accessed November 21,2008.<br />
Todd Engineers, Annual Groundwater Report for <strong>Water</strong> Year 2006, Prepared for <strong>San</strong> <strong>Benito</strong><br />
<strong>County</strong> <strong>Water</strong> <strong>District</strong>, December 18, 2006.<br />
Todd Engineers, Annual Groundwater Report for <strong>Water</strong> Year 2007, Prepared for <strong>San</strong> <strong>Benito</strong><br />
<strong>County</strong> <strong>Water</strong> <strong>District</strong>, December 10, 2007.<br />
Todd Engineers, Development of a <strong>Water</strong> Quality Monitoring Program, Prepared for <strong>San</strong><br />
<strong>Benito</strong> <strong>County</strong> <strong>Water</strong> <strong>District</strong>, June 2004.<br />
U.S. Geological Survey, GAMA - Groundwater Ambient Monitoring & Assessment Program ,<br />
http://ca.water.usgs.gov/gama/, Last Accessed November 21,2008.<br />
U.S. Geological Survey, National <strong>Water</strong> Information System (NWIS), Last accessed:<br />
November 2008.<br />
United Nations Food and Agriculture Organization, FAO Irrigation and Drainage Paper No. 56,<br />
Crop Evapotranspiration, February 2006.<br />
United States Bureau of Reclamation, Reclamation Updates the Central Valley Project <strong>Water</strong><br />
Supply Allocation, June 2, 2008,<br />
http://www.sldmwa.org/pdf_documents/Reclamation%20<strong>Water</strong>%20Allocation%20June%202%2<br />
02008.pdf<br />
University of California, Davis, Orchard Facts, April 2000, Accessed December 11, 2006 at<br />
http://fruitsandnuts.ucdavis.edu/newsletters/glenn4-00.pdf.<br />
Annual Groundwater Report for <strong>Water</strong> Year 2008 December 2008<br />
<strong>San</strong> <strong>Benito</strong> <strong>County</strong> <strong>Water</strong> <strong>District</strong> 50
Wittry, Steve, City of Hollister, Personal communication, November 30, 2007.<br />
Yates, G. and C-M Zhang. 2001. Groundwater flow and solute transport models for the <strong>San</strong><br />
<strong>Benito</strong> <strong>County</strong> portion of the Gilroy-Hollister groundwater basin. May 11. Davis, CA, and<br />
Denver, CO. Prepared for <strong>San</strong> <strong>Benito</strong> <strong>County</strong> <strong>Water</strong> <strong>District</strong> and <strong>San</strong> <strong>Benito</strong> <strong>County</strong> Planning<br />
Department, Hollister, CA.<br />
Yates, Gus, Personal Communication, November 2008.<br />
Yates, Gus. Annual Groundwater Report for <strong>Water</strong> Year 2005, Prepared for <strong>San</strong> <strong>Benito</strong> <strong>County</strong><br />
<strong>Water</strong> <strong>District</strong>, December 19, 2005<br />
Annual Groundwater Report for <strong>Water</strong> Year 2008 December 2008<br />
<strong>San</strong> <strong>Benito</strong> <strong>County</strong> <strong>Water</strong> <strong>District</strong> 51
Appendix A<br />
Reporting Requirements and Previous Annual Reports<br />
The <strong>San</strong> <strong>Benito</strong> <strong>County</strong> <strong>Water</strong> <strong>District</strong> Act (1953) is codified in California <strong>Water</strong> Code<br />
Appendix 70. Section 70-7.6 authorizes the <strong>District</strong> Board of Directors to require the <strong>District</strong> to<br />
prepare an annual groundwater report; this report addresses groundwater conditions of the<br />
<strong>District</strong> and its zones of benefit for the water year, October 1 of the preceding year through<br />
September 30 of the current year. The Board has consistently ordered preparation of annual<br />
reports, with the requirements specified by Section 70-7.6:<br />
• An estimate of the annual overdraft for the current water year and for the ensuing<br />
water year<br />
• Information for the consideration of the Board in its determination of the annual<br />
overdraft and accumulated overdraft as of September 30 of the current year<br />
• A report as to the total production of water from the groundwater supplies of the<br />
<strong>District</strong> and its zones as of September 30 of the current year<br />
• Information for the consideration of the Board in its determination of the estimated<br />
amount of agricultural water and the estimated amount of water other than agricultural<br />
water to be withdrawn from the groundwater supplies of the <strong>District</strong> and its zones<br />
• The amount of water the <strong>District</strong> is obligated to purchase during the ensuing water<br />
year<br />
• A recommendation as to the quantity of water needed for surface delivery and for<br />
replenishment of the groundwater supplies of the <strong>District</strong> and its zones during the<br />
ensuing water year<br />
• A recommendation as to whether or not a groundwater charge should be levied in any<br />
zone(s) of the <strong>District</strong> in the ensuing water year and if so, a rate per acre-foot for all<br />
water other than agricultural water for such zone(s)<br />
• Any other information the Board requires.<br />
The full text of Appendix 70, Section 70-7.6 through 7.8 is enclosed at the end of this<br />
appendix.<br />
Each water year a special topic is identified for further consideration. These topics have<br />
included water quality, salt loading, shallow wells, and others. Additional analyses and<br />
documentation provided in previous annual reports are summarized in the following table.<br />
Annual Groundwater Report for <strong>Water</strong> Year 2008 December 2008<br />
<strong>San</strong> <strong>Benito</strong> <strong>County</strong> <strong>Water</strong> <strong>District</strong>
Table A-1. Special Discussions in Previous Annual Reports<br />
Annual Report<br />
Additional Analyses and Reporting<br />
<strong>Water</strong> Year<br />
1996 Inclusion of Paicines and Tres Pinos sub-basins and sub-basin water budgets<br />
1997 Seasonal water use, irrigation water duties, long-term water quality trends<br />
1998 Irrigation water duties, contamination sites, management plan summary<br />
1999 Wastewater dischargers, management strategies for sub-basin water budgets<br />
2000 Methodology to calculate water supply benefits of Zone 3 and 6 operations<br />
2001 Preliminary salt balance<br />
2002 Investigation of individual salt loading sources<br />
2003 Documentation of nitrate in supply wells, drains, monitor wells, <strong>San</strong> Juan Ck.<br />
2004 Documentation of depth to groundwater in shallow wells<br />
2005 Tabulation of waste discharger permit conditions and recent water quality<br />
monitoring results<br />
2006 Rate study<br />
2007 <strong>Water</strong> quality update<br />
2008 <strong>Water</strong> budget update<br />
Annual Groundwater Report for <strong>Water</strong> Year 2008 December 2008<br />
<strong>San</strong> <strong>Benito</strong> <strong>County</strong> <strong>Water</strong> <strong>District</strong>
App. 70- 7.6<br />
70- 7.6. Groundwater; investigation and report: recommendations <strong>San</strong> <strong>Benito</strong> <strong>County</strong><br />
Sec. 7.6. the board by resolution require the district to annually prepare an investigation and<br />
report on groundwater conditions of the district and the zones thereof, for the period from<br />
October 1 of the preceding calendar year through September 30 of the current year and on<br />
activities of the district for protection and augmentation of the water supplies of the district and<br />
the zones thereof. The investigation and report shall include all of the following information:<br />
(a) Information for the consideration of the board in its determination of the annual overdraft.<br />
(b) Information for the consideration of the board in its determination of the accumulated<br />
overdraft as of September 30 of the current calendar year.<br />
(c) A report as to the total production of water from the groundwater supplies of the district and<br />
the zones thereof as of September 30 of the current calendar year.<br />
(d) An estimate of the annual overdraft for the current water year and for the ensuing water<br />
year.<br />
(e) Information for the consideration of the board in its determination of the estimated amount<br />
of agricultural water and the estimated amount of water other than agricultural water to be<br />
withdrawn from the groundwater supplies of the district and the zones thereof for the ensuing<br />
water year.<br />
(f) The amount of water the district is obligated to purchase during the ensuing water year.<br />
(g) A recommendation as to the quantity of water needed for surface delivery and for<br />
replenishment of the groundwater supplies of the district and the zones thereof the ensuing<br />
water year.<br />
(h) A recommendation as to whether or not a groundwater charge should be levied in any zone<br />
or zones of the district during the ensuing year.<br />
(i) If any groundwater charge is recommended, a proposal of a rate per acre-foot for<br />
agricultural water and a rate per acre-foot for all water other than agricultural water for such<br />
zone or zones.<br />
(j) Any other information the board requires.<br />
(Added by Stats. 1965,c. 1798,p.4167, 7. Amended by Stats.1967,c.934, 5, eff. July27,1967;<br />
Stats. 1983, c. 402, 1; Stats. 1998, c. 219 (A.B.2135), 1.)<br />
70-7.7. Receipt of report; notice of hearing; contents; hearing<br />
Sec. 7.7. (a) On the third Monday in December of each year, the groundwater report shall be<br />
delivered to the clerk of the board in writing. The clerk shall publish, pursuant to Section 6061 of<br />
Annual Groundwater Report for <strong>Water</strong> Year 2008 December 2008<br />
<strong>San</strong> <strong>Benito</strong> <strong>County</strong> <strong>Water</strong> <strong>District</strong>
the Government Code, a notice of the receipt of the report and of a public hearing to be held on<br />
the second Monday of January of the following year in a newspaper of general circulation<br />
printed and published within the district, at least 10 days prior to the date at which the public<br />
hearing regarding the groundwater report shall be held. The notice shall include, but is not<br />
limited to, an invitation to all operators of water producing facilities within the district to call at<br />
the offices of the district to examine the groundwater report.<br />
(b) The board shall hold, on the second Monday of January of each year, a public hearing, at<br />
which time any operator of a water-producing facility within the district, or any person interested<br />
in the condition of the groundwater supplies or the surface water supplies of the district, may in<br />
person, or by representative, appear and submit evidence concerning the groundwater conditions<br />
and the surface water supplies of the district. Appearances also may be made supporting or<br />
protesting the written groundwater report, including, but not limited to, the engineer's<br />
recommended groundwater charge.<br />
(Added by Stats. 1965, c. 1798, p. 4167, 8. Amended by Stats. 1983, c. 02,2; Stats. 1998, c. 219<br />
(A.B.2135,2.)<br />
70-7.8. Determination of groundwater charge; establishment of rates; zones; maximum<br />
charge; clerical errors<br />
Sec. 7.8. (a) Prior to the end of the water year in which a hearing is held pursuant to subdivision<br />
(b) of Section 7.7, the board shall hold a public hearing, noticed pursuant to Section 6061 of the<br />
government Code, to determine if a groundwater charge should be levied, it shall levy, assess,<br />
and affix such a charge or charges against all persons operating groundwater- producing<br />
facilities within the zone or zones during the ensuing water year. The charge shall be computed<br />
at fixed and uniform rate per acre-foot for agricultural water, and at a fixed and uniform rate per<br />
acre-foot for all water other than agricultural water. Different rates may be established in<br />
different zones. However, in each zone, the rate for agricultural water shall be fixed and uniform<br />
and the rate for water other than agricultural water shall be fixed and uniform. The rate for<br />
agricultural water shall not exceed one-third of the rate for all water other than agricultural<br />
water.<br />
(b) The groundwater charge in any year shall not exceed the costs reasonably borne by the<br />
district in the period of the charge in providing the water supply service authorized by this act in<br />
the district or a zone or zones thereof.<br />
(c) Any groundwater charge levied pursuant to this section shall be in addition to any general tax<br />
or assessment levied within the district or any zone or zones thereof.<br />
(d) Clerical errors occurring or appearing in the name of any person or in the description of the<br />
water-producing facility where the production of water there from is other wise properly<br />
charged, or in the making or extension of any charge upon the records which do not affect the<br />
substantial rights of the assessee or assesses, shall not invalidate the groundwater charge.<br />
(Added by Stats. 1965, c. 1798, p. 4168, 9. Amended by Stats. 1983, c. 402, 3; Stats.1983, c. 402, 3;<br />
Stats. 1998, c. 219 (A.B.2135), 3.)<br />
Annual Groundwater Report for <strong>Water</strong> Year 2008 December 2008<br />
<strong>San</strong> <strong>Benito</strong> <strong>County</strong> <strong>Water</strong> <strong>District</strong>
Appendix B<br />
Local Climate Data<br />
Annual Groundwater Report for <strong>Water</strong> Year 2008 December 2008<br />
<strong>San</strong> <strong>Benito</strong> <strong>County</strong> <strong>Water</strong> <strong>District</strong>
35<br />
30<br />
25<br />
Precipitation (in)<br />
20<br />
15<br />
Average = 13.03”<br />
10<br />
5<br />
0<br />
1875 1885 1895 1905 1915 1925 1935 1945 1955 1965 1975 1985 1995 2005<br />
<strong>Water</strong> Year<br />
December 2008<br />
TODD ENGINEERS<br />
Alameda, California<br />
Figure B-1<br />
Annual Precipitation<br />
Hollister<br />
1875-2007
Table B-1a. Monthly Precipitation at the SBCWD CIMIS Station (inches)<br />
<strong>Water</strong><br />
Year<br />
OCT NOV DEC JAN FEB MAR APR MAY JUN JUL AUG SEP TOTAL<br />
1995 3.26 5.35 1.96 15.2 3.16 5.7 1.84 0.56 0.43 0.02 0 0 37.5<br />
1996 0.12 0.01 2.21 4.38 4.52 1.56 1.33 1.32 0 0.01 0 0 15.5<br />
1997 0.96 3.16 4.26 6.84 0.21 0.09 0.19 0.02 0.1 0 0 0.03 15.9<br />
1998 0.16 3.78 2.59 4.94 9.06 2.7 2.31 2.4 0.09 0.02 0 0.08 28.1<br />
1999 0.54 1.93 0.79 2.54 2.49 1.52 0.67 0.06 0.07 0 0 0 10.6<br />
2000 0.14 0.98 0.11 4.05 4.53 0.68 0.4 0.45 0.1 0 0 0.02 11.5<br />
2001 3.54 0.8 0.23 2.86 2.77 0.62 2.2 0.01 0.01 0.03 0.02 0 13.1<br />
2002 0.7 11.48 11.93 0.66 1.15 1.57 0.37 0.28 0 0 0 0 28.1<br />
2003 0 1.67 5.04 0.77 1.41 1.06 3.05 0.06 0 0 0.06 0 13.1<br />
2004 0.2 0.6 5.25 1.31 4.21 0.59 0.27 0.08 0.01 0 0 0.01 12.5<br />
2005 1.95 0.54 3.46 2.49 2.89 3.42 0.83 0.64 0.43 0 0 0.04 16.7<br />
2006 0.07 0.27 3.08 1.49 1.01 4.96 1.73 0.39 0.01 0 0.02 0.01 13.0<br />
2007 0.2 0.73 1.69 0.57 2.22 0.29 0.55 0.02 0 0.02 0 0.43 6.7<br />
2008 0.71 0.67 0.92 4.56 2.06 0.09 0.06 0 0 0 0 0 9.1<br />
AVG 0.9 2.3 3.1 3.8 3.0 1.8 1.1 0.4 0.1 0.0 0.0 0.0 16.5<br />
*2007 monthly data were revised from WY2007 Annual Report to include data from the <strong>San</strong> <strong>Benito</strong> station, not the <strong>San</strong> Juan station as originally reported.<br />
Table B-1b. Reference Evaporation at the SBCWD CIMIS Station (inches)<br />
<strong>Water</strong><br />
Year<br />
OCT NOV DEC JAN FEB MAR APR MAY JUN JUL AUG SEP TOTAL<br />
1995 3.54 1.55 0.96 1.25 1.72 2.82 4.09 4.72 6.33 7.17 6.71 5.02 45.9<br />
1996 3.88 2.24 1.22 1.48 1.88 3.67 5.1 6.06 6.73 7.39 6.68 4.71 51.0<br />
1997 3.84 1.84 1.37 1.38 2.48 4.27 5.84 7.51 7.13 7.18 6.71 5.67 55.2<br />
1998 3.85 1.84 1.52 1.29 1.38 2.82 4.26 4.53 5.27 6.91 6.83 4.72 45.2<br />
1999 3.51 1.73 1.52 1.54 1.84 3.01 4.72 5.8 6.66 6.92 5.91 4.67 47.8<br />
2000 4 1.98 1.89 1.22 1.62 3.69 5.14 6.04 6.73 6.74 6.19 4.74 50.0<br />
2001 2.91 1.71 1.47 1.47 1.81 3.07 3.9 6.15 6.54 6.02 6.23 4.75 46.0<br />
2002 3.51 1.91 1.24 1.53 2.26 3.66 4.21 6.37 7.05 7.24 6.14 5.39 50.5<br />
2003 3.57 1.94 1.25 1.56 1.8 3.87 3.79 6 6.47 7.29 6.15 5.07 48.8<br />
2004 4.11 1.73 1.24 1.32 1.72 3.98 5.19 6.38 6.71 6.63 5.98 5.32 50.3<br />
2005 3.08 1.69 1.44 1.3 1.69 2.95 4.38 5.74 6.36 6.86 6.13 4.55 46.2<br />
2006 3.59 2 1.19 1.43 2.18 2.43 3 5.49 6.41 7.02 5.6 4.38 44.7<br />
2007 3.28 1.69 1.37 1.77 1.77 4.11 4.76 6.29 6.89 6.79 6.46 4.65 49.8<br />
2008 3.48 2.21 1.44 1.25 2.03 3.76 5.17 5.97 6.88 6.74 6.31 5 50.2<br />
AVG 3.6 1.8 1.4 1.4 1.9 3.4 4.5 5.9 6.6 6.9 6.3 4.9 48.6<br />
*2007 monthly data were revised from WY2007 Annual Report to include data from the <strong>San</strong> <strong>Benito</strong> station, not the <strong>San</strong> Juan station as originally reported.<br />
B-1. Monthy ET and Precip<br />
Todd Engineers 11/26/2008
Appendix C<br />
Local Streamflow and Groundwater Levels<br />
Annual Groundwater Report for <strong>Water</strong> Year 2008 December 2008<br />
<strong>San</strong> <strong>Benito</strong> <strong>County</strong> <strong>Water</strong> <strong>District</strong>
4E 5E 6E<br />
Surface <strong>Water</strong> Monitoring Locations<br />
11S 12 S 13S<br />
1<br />
1. Tres Pinos Cr - Southside Road Bridge (West)<br />
2. <strong>San</strong> <strong>Benito</strong> River - KT Road bridge<br />
3. <strong>San</strong> <strong>Benito</strong> River - Hospital Road<br />
4. <strong>San</strong> <strong>Benito</strong> River - Cienega Road<br />
5. <strong>San</strong> <strong>Benito</strong> River - Nash Road<br />
6. <strong>San</strong> <strong>Benito</strong> River - Old Highway 156<br />
7. <strong>San</strong> <strong>Benito</strong> River - near Mitchell Road<br />
8. <strong>San</strong> <strong>Benito</strong> River - near Flint Road<br />
9. <strong>San</strong> <strong>Benito</strong> River - upstream of Bixby Road<br />
10. <strong>San</strong> <strong>Benito</strong> River - Y Road<br />
11. <strong>San</strong> Juan Creek - - Highway 156<br />
12. <strong>San</strong> Juan Creek - Anzar Road<br />
13. <strong>San</strong> Juan Creek - 2000 ft downstream of Highway101<br />
14. Pacheco Creek - Walnut Avenue<br />
15. Pacheco Creek - Highway 156<br />
16. Pacheco Creek - Lovers Lane<br />
17. Arroyo de las Viboras - Hawkins Ranch driveway<br />
18. Arroyo de las Viboras - Fairview Road<br />
19. Arroyo Dos Picachos - Fallon Road<br />
20. Arroyo Dos Picachos - Aquistapace Road<br />
21. <strong>San</strong>ta Ana Creek - Fairview Road<br />
22. <strong>San</strong>ta Ana Creek - Fallon Road<br />
23. Tequisquita Sough - <strong>San</strong> Felipe Road<br />
24. Millers Canal - 2000 ft downstream of <strong>San</strong> Felipe Lake<br />
25. Arroyo Dos Picachos - Lone Tree Road<br />
26. Pajaro River - above Millers Canal<br />
27. Pajaro River - Highway 25<br />
28. Pajaro River - below Carnadaro Creek<br />
29. Carnadero Creek - above Pajaro River<br />
30. Tres Pinos Creek - Bolado Park<br />
December 2008<br />
TODD ENGINEERS<br />
Alameda, California<br />
Legend<br />
<strong>County</strong> boundary<br />
SBCWD subbasin<br />
Monitoring well<br />
Surface water monitoring location<br />
Township Range line<br />
0 10,000<br />
N<br />
Figure C-1<br />
Monitoring Locations<br />
Scale in Feet
9<br />
8<br />
13<br />
6<br />
1<br />
2<br />
7<br />
4<br />
Legend<br />
USGS Gage Station<br />
10<br />
Active<br />
Inactive<br />
Subbasin boundary<br />
0<br />
N<br />
30,000<br />
3<br />
11<br />
Scale in Feet<br />
Table C-1 USGS Gages<br />
12 5<br />
December 2008<br />
TODD ENGINEERS<br />
Alameda, California<br />
Table C-1 and Figure C-2<br />
USGS Stream Gage<br />
Locations
140<br />
140<br />
220<br />
120<br />
200<br />
220<br />
80<br />
240<br />
160<br />
260<br />
120<br />
120<br />
180<br />
280<br />
300<br />
320<br />
120<br />
140<br />
100<br />
100<br />
120<br />
340<br />
360<br />
380<br />
160<br />
180<br />
180<br />
200<br />
420<br />
200<br />
220<br />
Legend<br />
Monitored wells<br />
Flowing artesian wells<br />
20-foot groundwater elevation contours<br />
Approximate area of flowing wells N<br />
Generalized Calaveras Fault<br />
Highways<br />
0<br />
12,000<br />
Secondary roads<br />
Major streams<br />
Scale in Feet<br />
240<br />
260<br />
280<br />
300<br />
400<br />
December 2008<br />
420<br />
TODD ENGINEERS<br />
Alameda, California<br />
440<br />
Figure C-3<br />
Groundwater<br />
Elevations<br />
October 2007
Table C-2. Miscellaneous Streamflow Measurements during <strong>Water</strong> Year 2008<br />
Flow (cfs)<br />
Streamflow Measurement Site<br />
10/11/2007 2/5/2008 5/6/2008 7/8/2008 10/1/2008<br />
1 Tres Pinos Cr - Southside Road Bridge (~) dry 32.64 dry dry dry<br />
2 <strong>San</strong> <strong>Benito</strong> River - KT Road Bridge 0.78 108.90 3.31 dry dry<br />
3 <strong>San</strong> <strong>Benito</strong> River - Hospital Road dry 120.00 1.36 dry dry<br />
4 <strong>San</strong> <strong>Benito</strong> River - Cienega Road dry<br />
5 <strong>San</strong> <strong>Benito</strong> River - Nash Road dry<br />
6 <strong>San</strong> <strong>Benito</strong> River - old Highway 156 dry est120.2 dry dry dry<br />
7 <strong>San</strong> <strong>Benito</strong> River - near Flint Road dry 63.92 dry<br />
8 <strong>San</strong> <strong>Benito</strong> River - near Mitchell Road dry<br />
9 <strong>San</strong> <strong>Benito</strong> River - upstream of Bixby Road dry<br />
10 <strong>San</strong> <strong>Benito</strong> River - Y Road dry est144.4 0.77 est 45gpm pooled<br />
11 <strong>San</strong> Juan Creek - <strong>San</strong> Juan-Hollister Road dry<br />
12 <strong>San</strong> Juan Creek - Highway 156 pooled 2.29 0.46 0.75 pooled<br />
13 <strong>San</strong> Juan Creek - Anzar Road est 0.3 11.98 1.58 1.25 pooled<br />
14 <strong>San</strong> Juan Creek - 2000 ft downstream of HWY 101 pooled<br />
15 Pacheco Creek - Walnut Avenue dry 33.82 dry dry dry<br />
16 Pacheco Creek - Highway 156 dry 23.17 0.09 dry dry<br />
17 Pacheco Creek - Lovers Lane 0.73 est 20 0.90 0.23 pooled<br />
18 Arroyo de las Viboras - Hawkins Ranch driveway dry 2.59 dry dry<br />
19 Arroyo de las Viboras - Fairview Road dry Dry dry dry<br />
26 Arroyo Dos Picachos - Lone Tree Road dry 1.20 dry<br />
20 Arroyo Dos Picachos - Fallon Road dry 4.97 dry dry<br />
21 Arroyo Dos Picachos - Aquistapace Road pooled 2.94 pooled pooled 5gpm<br />
22 <strong>San</strong>ta Ana Creek - Fairview Road dry dry<br />
23 <strong>San</strong>ta Ana Creek - Fallon Road pooled 16gpm pooled pooled dry<br />
24 Tequisquita Slough - <strong>San</strong> Felipe Road pooled 2.50 pooled pooled pooled<br />
25 Millers Canal - 2000 ft downstream of <strong>San</strong> Felipe Lake 2.99 est59.375 3.76 0.21 pooled<br />
27 Pajaro River - above Millers Canal 4.20<br />
28 Pajaro River - Highway 25 13.02<br />
29 Pajaro River - below Carnadero Cr 23.31<br />
30 Carnadero Cr - above Pajaro River 8.05<br />
Notes:<br />
See Figure 3 for numbered site locations<br />
~ = streamflow estimated visually or by relatively inaccurate methods (e.g., width x depth x estimated centerline surface velocity)<br />
Some sites were measured on the day before or after the indicated date.<br />
However, most sites along any individual creek or river were measured on the same day.<br />
Todd Engineers<br />
11/26/2008
Table C-3. Groundwater Elevations October 2007 through October 2008<br />
Depth to Top of<br />
Screens<br />
(feet)<br />
Ground Surface<br />
Elevation<br />
(feet MSL)<br />
Groundwater Elevations (feet MSL)<br />
Well Number<br />
Well Depth<br />
(feet)<br />
Subbasin<br />
Index<br />
Well<br />
Oct 07 Jan 08 Apr 08 Jul 08 Oct 08<br />
Pacheco<br />
11-5-26N2 232 95 198 P * 166.82 167.90 168.82 166.16 165.64<br />
11-5-26R3 225 65 208 P * 183.81 184.00 185.64 182.88 181.68<br />
11-5-35C1 180 198 P * 174.94 175.40 176.58 174.71 173.82<br />
11-5-35G1 230 206 P * 182.98 183.10 185.12 183.52 184.55<br />
11-5-35Q3 203 P * 178.88 181.30 180.61 171.05 168.81<br />
11-5-36C1 98 223 P * 192.86 196.60 198.11 194.05 193.64<br />
11-5-36M1 223 P * 184.82 157.30 186.88 183.82 184.55<br />
11-6-31M2 188 155 284 P * 218.85 222.20 221.07 215.55 210.58<br />
12-5-01G2 300 215 P 186.87 185.20 185.39 183.55 182.15<br />
12-5-02H5 128 42 210 P 191.55 192.20 191.49 190.57 188.60<br />
12-5-02L2 170 202 P 197.92 198.10 197.99 196.05 195.88<br />
12-5-03B1 128 100 182 P * 182.00 182.00 182.00 182.00 182.00<br />
12-6-06K1 260 16 260 P 260.00 260.00 260.00 260.00 260.00<br />
12-6-06L4 235 50 248 P 226.78 226.54 225.70 224.15 224.20<br />
Pacheco Creek<br />
11-5-12E1 103 52 277 PC * 224.03 221.70 222.82 226.62 224.69<br />
11-5-13D1 125 258 PC * 223.01 221.62 222.48 223.51 221.05<br />
11-5-23R2 118 43 230 PC * 202.86 203.60 205.17 203.69 202.68<br />
11-5-24C1 134 244 PC * 228.60 229.20 227.62 226.85<br />
11-5-24C2 165 70 249 PC * 218.15 219.60 221.64 219.57 217.77<br />
11-5-24L1 70 234 PC * 202.06 204.20 206.11 204.92 205.44<br />
11-5-25G1 225 243 PC * 198.59 200.20 203.04 197.37 95.64<br />
Bolsa<br />
11-4-25H2 631 216 148 B * 94.39 117.20 117.98 114.66 111.72<br />
11-4-26B1 642 149 143 B * 125.58 134.10 133.52 132.89 130.88<br />
11-4-34A1 100 142 B * 128.88 135.19 139.24 139.51 135.89<br />
11-5-20N1 300 150 B * 103.72 122.11 116.27 113.42 112.57<br />
11-5-21E2 220 100 155 B 155.00 155.00 155.00 155.00 155.00<br />
11-5-27P2 331 67 185 B 169.81 159.80 160.88 157.27 156.86<br />
11-5-28B1 198 125 168 B 168.00 168.00 168.00 168.00 168.00<br />
11-5-28P4 140 80 165 B 165.00 165.00 165.00 165.00 165.00<br />
11-5-31F1 515 312 159 B * 60.70 103.60 98.18 95.72 94.82<br />
11-5-33B1 125 169 B 169.00 169.00 169.00 169.00 169.00<br />
12-5-05G1 500 150 175 B 109.52 128.40 127.52 125.64 125.45<br />
12-5-05M1 175 B 66.11 98.62 98.11 95.67 94.59<br />
12-5-06L1 177 B * 82.64 107.40 105.54 101.58 100.68<br />
12-5-07P1 750 360 204 B 72.02<br />
12-5-17D1 950 314 217 B 73.75 88.54 86.66 80.75 77.67<br />
Bolsa South East<br />
12-5-09M1 240 105 207 BSE * 129.68 140.07 140.51 138.52 137.57<br />
12-5-21Q1 500 260 BSE * 150.05 156.04 155.31 153.05 151.46<br />
12-5-22N1 372 250 265 BSE * 88.46 118.86<br />
<strong>San</strong> Juan<br />
12-4-17L20 140 SJ 111.77 111.54 109.86 106.86 104.19<br />
12-4-18J1 150 SJ 118.87 131.26 126.74 124.84 123.71<br />
12-4-20C3 155 SJ 118.86 124.51 123.11 122.89 120.77<br />
12-4-21M1 250 170 SJ * 141.79 145.39 135.62 129.86 129.47<br />
12-4-26G1 876 240 210 SJ * 171.87 176.81 173.59 172.86 171.51<br />
12-4-34H1 387 120 199 SJ * 161.86 183.88 181.11 180.55 179.77<br />
12-4-35A1 325 110 216 SJ 185.70 190.64 188.82 187.82 186.45<br />
12-4-36D2 219 SJ 189.88 195.87 192.26 191.57 188.87<br />
12-4-36N1 556 153 214 SJ * 176.61 195.82 190.86 188.71 186.42<br />
12-5-30H1 240 250 SJ 207.64 212.86 208.88 204.84 203.82<br />
12-5-30R1 199 87 240 SJ 212.04 216.81 214.62 213.67 214.07<br />
12-5-31H1 248 SJ 207.87 209.36 207.86 206.58 207.88<br />
13-4-01K1 209 223 SJ 212.88 214.88 213.64 211.88 209.88<br />
13-4-03H1 312 168 207 SJ 181.75 189.89 186.16 185.90 184.15<br />
13-4-04A3 195 48 210 SJ 186.88 193.19 191.82 190.67 188.64<br />
13-4-1K1 223 SJ 214.88 213.64 211.88 209.88<br />
Golf course (SJ Oaks) 353 SJ 333.97 335.16 334.38 333.67 334.58<br />
<strong>San</strong> Justo (TELEDYNE) 323 SJ 290.12 293.84 290.07 288.84 286.46<br />
<strong>San</strong> Justo 3 (BRIGANTINO) 384 SJ 312.84 294.00 304.44 302.88<br />
Hollister West<br />
12-5-27E1 175 270 HW * 207.16 209.19<br />
12-5-28J1 220 276 HW * 218.35 219.88 224.38 218.11 216.80<br />
12-5-28L1 425 275 HW * 216.36 220.62 221.71 214.87 213.14<br />
12-5-28N1 408 168 254 HW 228.46 226.58 228.65 224.24 220.81<br />
12-5-33E2 121 81 266 HW * 223.07 223.60 224.61 218.72 219.22<br />
C-3 - 2008 GWE Summary<br />
Todd Engineers 11/26/2008
Table C-3. Groundwater Elevations October 2007 through October 2008<br />
Depth to Top of<br />
Screens<br />
(feet)<br />
Ground Surface<br />
Elevation<br />
(feet MSL)<br />
Groundwater Elevations (feet MSL)<br />
Well Number<br />
Well Depth<br />
(feet)<br />
Subbasin<br />
Index<br />
Well<br />
Oct 07 Jan 08 Apr 08 Jul 08 Oct 08<br />
12-5-34P1 195 153 294 HW * 228.57 229.60 230.35 227.63 225.54<br />
12-5-35N2 612 288 305 HW * 234.36 233.14 234.66 231.35 230.11<br />
13-5-03H1 189 121 302 HW 244.66 245.83 247.17 244.68 243.36<br />
13-5-03L1 126 303 HW * 232.92 238.90 239.11 237.07 236.68<br />
13-5-04G1 320 100 281 HW 225.09<br />
13-5-10B1 305 HW * 232.88 233.24 234.27 231.54 230.15<br />
13-5-10L1 252 52 312 HW 243.58 244.81 246.69 243.67 242.29<br />
13-5-11E1 309 HW 288.61 288.39 289.42 284.69 284.88<br />
<strong>San</strong> Justo 4 (INDART) 318 HW 277.02 278.37 277.20 275.64 272.69<br />
<strong>San</strong> Justo 6 (ROSE) 338 HW 247.44 247.88 246.05 244.86 242.37<br />
<strong>San</strong> Justo 5 (INDART WINDMILL) 320 HW 280.84<br />
Hollister East<br />
12-5-09K1 195 88 200 HE * 185.13 186.40 185.64 182.57 183.47<br />
12-5-12R1 350 150 237 HE *<br />
12-5-14N1 229 HE * 190.51 189.90 190.63 188.69 186.62<br />
12-5-22C1 237 102 236 HE 188.81 198.30 197.46 196.77 190.04<br />
12-5-22J2 355 120 250 HE * 203.55 202.70 203.11 201.51 200.07<br />
12-5-23A20 862 178 239 HE * 186.53 184.30 183.04 182.68 181.92<br />
12-5-24N1 300 182 270 HE * 186.74 187.30 189.11 185.84 183.69<br />
12-5-36B20 500 430 315 HE 199.41 199.30 201.97 197.58 196.20<br />
12-6-07P1 147 266 HE 235.40<br />
12-6-18G1 198 70 303 HE 268.61 265.48 268.96 264.86 263.58<br />
12-6-19E5 160 116 279 HE * 233.92 234.40 233.97 231.61 230.61<br />
12-6-19N1 300 HE * 234.75 234.20 235.17 231.88 234.20<br />
12-6-30E1 375 HE 352.90 353.60 354.33 351.59 351.69<br />
13-6-06E1 471 443 460 HE 344.57 354.60 355.11 352.62 352.04<br />
13-6-07D2 500 HE 332.50 332.50 333.40 330.35 335.40<br />
Tres Pinos<br />
13-5-11Q1 178 61 324 TP 285.5555 286.8787 287.62 285.44 284.8888<br />
13-5-12D4 360 TP 198.50 101.00 261.00 229.00<br />
13-5-12K1 440 TP 316.00 319.00 325.00 320.00 309.00<br />
13-5-12N20 352 301 332 TP * 319.16 319.40 319.59 316.82 315.90<br />
13-5-13F1 134 30 348 TP * 331.85 332.19 333.88 330.88 331.16<br />
13-5-13H1 252 112 400 TP * 334.02 335.64 336.31 333.22 333.11<br />
13-5-13J2 180 375 TP * 343.64 345.19 345.92 343.58 342.15<br />
13-5-13Q1 185 44 360 TP * 333.58 334.40 336.35 333.45 332.68<br />
13-5-14C1 365 TP 289.04 296.30 297.73 295.37 294.27<br />
13-6-19J1 340 128 450 TP 431.26 433.41 434.69 431.77 430.20<br />
13-6-19K1 211 422 TP * 368.15 369.40 370.11 367.09 366.77<br />
13-6-20K1 440 TP 427.05 429.20 428.66 427.88 426.90<br />
LEMOS (Ridgemark) 522 TP 353.31 356.44 353.64 350.15 347.88<br />
POSEY (Ridgemark) 521 TP 352.26 349.54 345.67 343.41<br />
Tres Pinos Creek Valley and Pacines<br />
BERTUCCIO 4 753 TPCV 720.87 706.47 715.59 712.86<br />
DONATI 2 696 TPCV 650.18 657.77 651.04 649.55 648.88<br />
HARDWICK 3 755 TPCV<br />
P. Bertuccio #4 753 TPCV 714.94<br />
RON COKE 1 708 TPCV 675.69 679.39<br />
<strong>San</strong> Justo 5 (WINDMILL) 320 TPCV 281.06<br />
WILDLIFE CENTER 5 766 TPCV 729.81 733.66 722.08 727.87<br />
DONATI 6 694 Paicines 645.06 650.81 649.59 644.17 645.07<br />
OAK HILL RANCH 1 745 Paicines 673.77 681.86 680.02 674.14 679.63<br />
RFP Vineyard 3 (FRANCHIONI) 705 Paicines 666.85 669.66 675.21<br />
RIDGEMARK 5 668 Paicines 649.60 650.69 649.57<br />
RIDGEMARK 7 692 Paicines 641.15 644.31 642.53 640.68<br />
SCHIELDS 2 737 Paicines<br />
SCHIELDS 4 (vineyard) 682 Paicines 645.87 649.67 646.00<br />
Llagas (SCVWD)<br />
11S04E02D008 229 L 141.85 154.77 136.20<br />
11S04E02N001 175 L 139.04 151.80 124.25<br />
11S04E03J002 196 L 132.45 149.51 145.10 118.14 112.1<br />
11S04E08K002 178 L 140.84 149.72 148.51<br />
11S04E10D004 170 L 134.56 151.21 153.06 122.67 124.34<br />
11S04E15J002 144 L 131.58 143.35 126.54<br />
11S04E17N004 180 L 137.77 146.89 151.25<br />
11S04E21P003 155 L 132.53 141.14 126.83<br />
11S04E21P004 155 L<br />
11S04E22N001 150 L 128.42 137.28 123.99<br />
11S04E32R002 140 L 123.33 130.36 121.25<br />
C-3 - 2008 GWE Summary<br />
Todd Engineers 11/26/2008
Appendix D<br />
Managed Percolation Data<br />
Annual Groundwater Report for <strong>Water</strong> Year 2008 December 2008<br />
<strong>San</strong> <strong>Benito</strong> <strong>County</strong> <strong>Water</strong> <strong>District</strong>
Table D-1. Reservoir <strong>Water</strong> Budgets for <strong>Water</strong> Year 2008 (acre-feet)<br />
Hernandez Paicines <strong>San</strong> Justo<br />
Inflows<br />
Rainfall 275 n.a. 174<br />
<strong>San</strong> <strong>Benito</strong> River 10,387 2,029 n.a.<br />
Hernandez-Paicines transfer n.a. 0 n.a.<br />
<strong>San</strong> Felipe Project n.a. n.a. 3,663<br />
Total Inflows 10,662 2,029 3,837<br />
Outflows<br />
Hernandez spills 0 n.a. n.a.<br />
Hernandez-Paicines transfer 0 n.a. n.a.<br />
Tres Pinos Creek percolation releases n.a. 495 n.a.<br />
<strong>San</strong> <strong>Benito</strong> River percolation releases 7,646 0 n.a.<br />
<strong>San</strong> Felipe Project n.a. n.a. 2,747<br />
Evaporation and seepage 1,215 1,638 1,203<br />
Total Outflows 8,861 2,133 3,950<br />
Storage Change<br />
Reservoir capacity 17,200 2,870 11,000<br />
Maximum storage 9,497 1,652 7,816<br />
Minimum storage 550 300 6,698<br />
Net water year storage change 2,103 -500 265<br />
Unaccounted for <strong>Water</strong> 302 -396 378<br />
* The total operating capacity was reduced to 7,000 af in 2006. The previous total capacity was 11,000 af.<br />
D-1 Reservoir <strong>Water</strong> Budget<br />
Todd Engineers 11/26/2008
Table D-2. Releases of CVP <strong>Water</strong> for Percolation in Local Streams and the <strong>San</strong> <strong>Benito</strong> River during <strong>Water</strong> Year 2008 (acre-feet)<br />
Arroyo de las Viboras<br />
Arroyo Dos Picachos<br />
<strong>San</strong>ta Ana Creek<br />
John Tres <strong>San</strong><br />
Pacheco Fallon Jarvis Smith Maranatha Airline Ridge- Pinos <strong>Benito</strong><br />
Creek Road Creek 1 Creek 2 Road Lane Creek Road Road Highway mark Creek River Total<br />
Oct. 0 0 0 0 0 0 0 0 0 0 0 0 2 2<br />
Nov. 0 0 0 0 0 0 0 0 0 0 0 0 0 0<br />
Dec. 0 0 0 0 0 0 0 0 0 0 0 0 0 0<br />
Jan. 0 0 0 0 0 0 0 0 0 0 0 0 0 0<br />
Feb. 0 0 0 0 0 0 0 0 0 0 0 0 4.1 4<br />
March 0 0 0 0 0 0 0 0 0 0 0 0 0 0<br />
April 0 0 0 0 0 0 0 0 0 0 0 0 0 0<br />
May 0 0 0 0 0 0 0 0 0 0 0 0 0 0<br />
June 0 0 0 0 0 0 0 0 0 0 0 0 0 0<br />
July 0 0 0 0 0 0 0 0 0 0 0 0 0 0<br />
Aug. 0 0 0 0 0 0 0 0 0 0 0 0 0 0<br />
Sept. 0 0 0 0 0 0 0 0 0 0 0 0 0 0<br />
Total 0 0 0 0 0 0 0 0 0 0 0 0 6 6<br />
D-2 2008 stream perc<br />
Todd Engineers 11/26/2008
Table D-3. Percolation of Municipal Wastewater during <strong>Water</strong> Year 2008<br />
Effluent<br />
Pond Area Discharge Evaporation Percolation<br />
(acres) (acre-feet) (acre-feet) (acre-feet)<br />
Hollister -- domestic 92.9 1,927 347 1,580<br />
Hollister -- industrial 39.0 1,403 146 1,257<br />
Ridgemark Estates I & II 7.2 156 17 139<br />
Tres Pinos 1.8 26 7 19<br />
Total 140 3,486 510 2,977<br />
Notes:<br />
n.a. = not applicable. Average annual evaporation = 56 inches (DWR Bulletin 73-79)<br />
Assumes 80% of total pond area in use at any time (Rose, pers. comm.). Hollister pond areas are from Dickson and Kenneth D. Schmidt and Associates (1999) and include<br />
treatment ponds in addition to percolation ponds at the domestic wastewater treatment plant.<br />
The <strong>San</strong> Juan Bautista plant is not included because the unnamed tributary of <strong>San</strong> Juan Creek that receives its effluent usually gains flow along the affected reach and is on the<br />
southwest side of the <strong>San</strong> Andreas Fault. These conditions prevent the effluent from recharging the <strong>San</strong> Juan Subbasin.<br />
Flow data are accurate to a maximum of two significant digits. All digits are shown to avoid rounding small numbers to zero and to preserve correct column totals.<br />
D-3 Percolation of Wastewater<br />
Todd Engineers 11/26/2008
Appendix E<br />
<strong>Water</strong> Balance Methodology<br />
Annual Groundwater Report for <strong>Water</strong> Year 2008 December 2008<br />
<strong>San</strong> <strong>Benito</strong> <strong>County</strong> <strong>Water</strong> <strong>District</strong> E-1
WATER BALANCE METHODOLOGY<br />
As part of the 2008 Annual report, water balances for 2006, 2007, and 2008 were prepared. A<br />
water balance provides a quantitative view of the state of the basin, providing estimates for the<br />
specific inflows and outflows of the basin as a whole and by subbasin. While many of the<br />
values presented in the table are estimates, the relative magnitude of each water balance<br />
element helps illustrate the mechanisms at work in the basin. This detailed understanding of the<br />
groundwater system can serve as a basis to compare changes in the basin over time and provide<br />
valuable tools for groundwater basin management. The end goal of the water balance is to<br />
estimate inflows and outflows to each subbasin and then compare these to calculate a water<br />
balance change in storage. In addition to comparing the estimated total inflows and outflows,<br />
changes in storage by subbasin are estimated independently using water level changes and<br />
aquifer storavity values.<br />
The water balance is prepared for each water year and for each subbasin. The results of the<br />
water balances are shown in Tables 6 through 8 in the report. For each element, the methods<br />
of estimation used in past annual reports (water years 2005 and earlier) were repeated to allow<br />
for direct comparison. While these methods have been documented in previous annual reports,<br />
they are summarized here to provide complete documentation. Several areas of the water<br />
balance analysis could be updated with additional data; these have been noted for future<br />
consideration.<br />
INFLOWS<br />
There are six major sources of inflow to the subbasins in Zone 6 and surrounding areas. These<br />
include natural stream percolation, Hernandez/Paicines releases, percolation of CVP water,<br />
deep percolation (from rainfall and/or irrigation), percolation of reclaimed water, and<br />
subsurface groundwater inflow.<br />
Stream Percolation<br />
Natural stream percolation accounts for the volume of flow that recharges the groundwater<br />
system from natural flow in rivers and creeks in the area. The basic concept of estimating<br />
percolation is to determine the natural flow in the waterway, the distance that the waterway<br />
transverses a subbasin, and an estimated rate of percolation based on flow and length. Because<br />
many of the streams in the area are not continuously gauged, flow loss rates are based on<br />
occasional field measurements and extrapolation of data from reference streams. These<br />
estimated values are shown in Table E-1. Percolation rates, also shown in Table E-1, were<br />
derived from synoptic surveys completed in the late 1990’s (Yates, 2008). In addition, local<br />
high water levels have resulted in a reduction of the amount of percolation occurring from<br />
natural streams, contributing to the uncertainty of the percolation estimate. This “rejected<br />
recharge” is difficult to determine and may vary by waterway over time.<br />
Annual Groundwater Report for <strong>Water</strong> Year 2008 December 2008<br />
<strong>San</strong> <strong>Benito</strong> <strong>County</strong> <strong>Water</strong> <strong>District</strong> E-2
Table E-1. Estimated parameters for stream percolation.<br />
Annual<br />
Precipitation<br />
Length Maximum<br />
Name<br />
<strong>Water</strong>shed<br />
Area (ac) (in) Calibration+ Subbasin<br />
of Perc<br />
(mi)<br />
Perc Rate<br />
(cfs/mi)<br />
Pacheco Creek 145.0 18 1 Pacheco 2 5.34<br />
Arroyo de las<br />
Viboras 22.1 22 1 Pacheco 2.28 6.29<br />
Arroyo Dos<br />
Picachos 16.2 20 1 Hollister East 1.31 1.02<br />
<strong>San</strong>ta Ana<br />
Creek 36.5 19 1 Hollister East 7.58 6<br />
Hollister West, Tres<br />
Bird Creek*+ 15.0 18 0.15<br />
Pinos<br />
-- --<br />
Pescadero<br />
Hollister West, Tres<br />
Creek*+ 38.3 18 0.15<br />
Pinos<br />
-- --<br />
Tres Pinos<br />
-- --<br />
Creek*<br />
1 Tres Pinos<br />
-- --<br />
<strong>San</strong> <strong>Benito</strong> -- --<br />
<strong>San</strong> Juan, Hollister -- --<br />
River*<br />
1 West, Tres Pinos<br />
*Percolation along these streams is calculated using a combination of USGS gage data and Hernandez/Paicines<br />
release information<br />
+Pescadero and Bird Creek flows were reduced by a calibration factor to remain consistent with observed flows<br />
Daily flows in ungaged streams are estimated from gaged flows in four reference streams<br />
outside the basin. These streams are listed in Table E-2. For each of these streams, a daily unit<br />
flow was determined by normalizing stream flow by watershed area and annual average<br />
precipitation. The unit flows of the four streams were averaged to determine a reference unit<br />
flow per day that could be applied to streams within the basin. The unit flow was multiplied by<br />
each stream’s watershed area and annual average precipitation, Table E-1, to develop a daily<br />
estimate of flow. The maximum portion of estimated daily flow that could result in recharge<br />
was determined by multiplying the length of the percolation reach in the subbasin by the<br />
maximum percolation rate in cfs per mile.<br />
Annual Groundwater Report for <strong>Water</strong> Year 2008 December 2008<br />
<strong>San</strong> <strong>Benito</strong> <strong>County</strong> <strong>Water</strong> <strong>District</strong> E-3
Table E-2. Reference streams used to estimate daily flow on ungaged streams.<br />
Annual<br />
Precip<br />
(in)<br />
Name<br />
<strong>Water</strong>shed<br />
Area (ac)<br />
USGS<br />
Station ID Location Lat Long<br />
Gabilan<br />
Creek 36.7 18 11152600 Salinas, CA 36.755792 -121.610501<br />
<strong>San</strong> Joaquin<br />
Cantua Creek 46.4 11 11253310 Valley 36.402174 -120.43349<br />
Los Gatos<br />
Coalinga,<br />
Creek 95.8 16 11224500 CA 36.2146772 -120.470712<br />
Corralitos<br />
Creek 27.8 35 11159200<br />
Watsonville,<br />
CA 36.9393968 -121.770507<br />
The portion of percolation that occurs in Tres Pinos Creek Valley is determined through a<br />
water budget based on estimated values for deep percolation of rainfall and irrigation, pumping,<br />
change in storage, and subsurface outflow. The percolation amount is estimated as the volume<br />
needed to balance inflow, outflows, and change in storage.<br />
Percolation on the <strong>San</strong> <strong>Benito</strong> River can be estimated using two available USGS gages and<br />
available percolation rate data from synoptic surveys. However, flow in the river at these gages<br />
consists of a combination of natural sources and reservoir releases. In order to estimate the<br />
contribution of each source on the streamflow percolation, a more detailed analysis is required<br />
and described in the Reservoir Releases section below.<br />
Because of recent high groundwater levels, the percolation rate and the length of the stream<br />
recharging groundwater have decreased. Thus not all of the percolation calculated by the above<br />
method actually percolates to the groundwater aquifer. In past annual reports, this rejected<br />
recharge was roughly estimated between 0 and 50 percent. For percolation along the <strong>San</strong><br />
<strong>Benito</strong> River, 50 percent of estimated percolation was considered to be rejected. For Pacheco<br />
Creek, percolation estimates for water year 2006 were also decreased by 50 percent. However,<br />
Pacheco creek recharge in water years 2007 and 2008 were not decreased as the estimated<br />
streamflow was low and subsurface storage was considered sufficient for the total to percolate.<br />
For consistency, the same percent of rejected recharge was used in this report; approximately<br />
50 percent of recharge is rejected for streams in the Pacheco subbasin and 50 percent for flows<br />
along the <strong>San</strong> <strong>Benito</strong> River.<br />
The uncertainty of the natural percolation estimate can be reduced by updating the percolation<br />
rates and variables to reflect current groundwater conditions. Synoptic surveys of local streams,<br />
along with additional monitoring or additional continuous gages, can measure many of these<br />
variables in the field. In addition, streamflow data for one reference stream, Cantua Creek, was<br />
not available for water year 2008. It is not clear if this site is still monitored by the USGS. If no<br />
longer monitored, a new reference stream will need to be identified for future application of<br />
this method.<br />
Annual Groundwater Report for <strong>Water</strong> Year 2008 December 2008<br />
<strong>San</strong> <strong>Benito</strong> <strong>County</strong> <strong>Water</strong> <strong>District</strong> E-4
Reservoir Releases<br />
<strong>San</strong> <strong>Benito</strong> River and Tres Pinos Creek flows are augmented by releases from the upstream<br />
Hernandez and Paicines Reservoirs. The flow from natural sources (e.g., rainfall) and from<br />
reservoir releases must be apportioned to determine the contribution of flow by source. For the<br />
<strong>San</strong> <strong>Benito</strong> River, the USGS has continuous gages at two locations, Willow Creek School and<br />
Old Highway 156. Since reservoir releases from Hernandez and flow at Willow Creek School<br />
are both observed, the contribution of the releases to the total flow can be determined by<br />
assuming any flow up to the volume of the release is from a reservoir release. The remaining<br />
flow can be considered the natural flow component. This simple analysis sometimes leads to a<br />
more variable natural flow than expected under the current conceptual model. To smooth the<br />
estimated flow during the spring and summer months, flow is estimated using a recession<br />
analysis. The recession is applied beginning just after the last significant rainfall runoff peak in<br />
spring and is represented by:<br />
Q(t) = Qo K t<br />
in which Q(t) is the flow t days after the start of the recession, Qo is the flow the day before the<br />
recession, K is the recession constant, and exponent t is elapsed time in days. The rate of<br />
recession, K, is a calibrated value of 0.964 based on historical regressions when Hernandez<br />
releases were not occurring. The estimated recession flows also make it possible to continue<br />
the curve separation into summer, when Hernandez releases exceed the natural flow but when it<br />
is almost certain that a natural flow component is present. This approach and the above<br />
constant rate have been used in past annual reports to partition total flow at Willow Creek<br />
School into natural and released components (Yates 2008). The recession is only an<br />
approximation of natural flow at Willow Creek School and varies based on the disturbution of<br />
Hernandez releases. The method used to determine the portion of natural flow from reservoir<br />
releases should further be refined in summer months.<br />
The general area along the <strong>San</strong> <strong>Benito</strong> River where the percolation occurs and the volume can<br />
be determined by examining the stream flow loss between the two <strong>San</strong> <strong>Benito</strong> River gages<br />
(Willow Creek and Highway 156). The difference between these gages is calculated, taking<br />
into account additional flow from Pescadero and Bird Creeks (estimated by the reference<br />
stream method discussed above).<br />
Total percolation is the total flow loss between the two gages after correcting for tributary<br />
inflows. Percolation is assumed to first be satisfied by natural flow. If the percolation is greater<br />
than the natural flow, the remainder is made up from the Hernandez released flow. Flow past<br />
the Highway 156 gage is assumed to percolate at a maximum rate of 8 cfs based on synoptic<br />
surveys performed in the late 1990’s (Yates, 2008).<br />
Both natural flow and Hernandez releases are apportioned to each subbasin by the same<br />
method. Percolation that occurs upstream of the Highway 156 bridge is considered to recharge<br />
Paicines Valley, Tres Pinos, Hollister West, or <strong>San</strong> Juan subbasins. Percolation that occurs<br />
downstream of the Highway 156 gage is considered to recharge only the <strong>San</strong> Juan subbasin.<br />
The portion of percolation that occurs in Paicines Valley is determined through a water budget<br />
Annual Groundwater Report for <strong>Water</strong> Year 2008 December 2008<br />
<strong>San</strong> <strong>Benito</strong> <strong>County</strong> <strong>Water</strong> <strong>District</strong> E-5
ased on estimated values for deep percolation of rainfall and irrigation, pumping, change in<br />
storage, and subsurface outflow. The percolation amount is estimated as the volume needed to<br />
balance inflow, outflows, and change in storage. The remaining percolation upstream of the<br />
Highway 156 gage is reduced by rejected recharge and divided among the three other<br />
subbasins. For water years 2006-2008, the assumed percolation proportions were the same as<br />
for water year 2005: an estimated 50 percent of recharge is rejected, 10 percent recharges Tres<br />
Pinos, 30 percent recharges Hollister West, and 10 percent (and any percolation downstream of<br />
the Highway 156 gage) recharges <strong>San</strong> Juan subbasin.<br />
Managed CVP Percolation<br />
In the past, the <strong>District</strong> has used surplus CVP imported water to recharge the groundwater<br />
basin. <strong>Water</strong> was released to streams and allowed to percolate. In recent years, this practice has<br />
been greatly reduced but still occurs on limited scales. The volume and location of these<br />
managed percolation activities are directly measured. For the water balance, any CVP water<br />
reported to percolate in the <strong>San</strong> <strong>Benito</strong> River occurred in the Hollister West basin and any<br />
percolation activity along Tres Pinos Creek occurred in the Tres Pinos subbasin.<br />
Deep Percolation<br />
Deep percolation refers to the portion of water applied to the basin (either through precipitation<br />
or irrigation) that percolates through the soil to the groundwater aquifer. A soil moisture budget<br />
was prepared to examine the portion of the daily volume of precipitation and irrigation that<br />
percolates to the aquifer. A soil moisture budget takes several factors into account including<br />
daily precipitation, amount and efficiency of applied irrigation, soil moisture storage, seasonal<br />
evapotranspiration of overlying land cover and crops, and potential runoff. The basic concept<br />
of a soil moisture budget is that deep percolation is expected to occur only when the maximum<br />
moisture-holding capacity of the soil is reached. The budget calculations update soil moisture<br />
storage and deep percolation on a daily time step for each zone.<br />
As in previous years, one-dimensional recharge rates were calculated for 27 combinations of<br />
crop type/land cover and soil type using appropriate values for the soil moisture budget<br />
variables. Table E-3 (located at the end of the section) shows the variables by zone along with<br />
global variables used in all zones. The global variables are assumptions that apply to all soil<br />
zones including irrigation efficiency, the fraction of soil moisture when irrigation is applied,<br />
and the fraction of soil moisture when AET depletion occurs. These are discussed in more<br />
detail below. The daily soil moisture capacity can be expressed as:<br />
Soil Moisture Storage = Precipitation– Runoff –ET demands + Irrigation + Previous Day’s Soil<br />
Moisture Storage<br />
If the calculated soil moisture storage is greater than the maximum, then deep percolation<br />
occurs:<br />
Deep Percolation = Soil Moisture Capacity – Maximum Soil Moisture Capacity<br />
Annual Groundwater Report for <strong>Water</strong> Year 2008 December 2008<br />
<strong>San</strong> <strong>Benito</strong> <strong>County</strong> <strong>Water</strong> <strong>District</strong> E-6
Each of the variables and how they are estimated are discussed below:<br />
Precipitation – Daily rainfall (in inches) is downloaded from the California Irrigation<br />
Management Information System (CIMIS) for the <strong>San</strong> <strong>Benito</strong> station located at the <strong>District</strong>’s<br />
offices (Station # 126).<br />
Runoff – The amount of rainfall that results in runoff is estimated using a linear equation. The<br />
slope and intercept of the runoff equation varies by soil type and were obtained through model<br />
calibration (Yates, 2008). The variables used in the runoff equation for each zone are shown in<br />
Table E-3.<br />
ET Demands – The evapotranspiration needs of an area vary over time and based on crop<br />
type/land cover. The measured daily reference evapotranspiration (ETo) was downloaded from<br />
CIMIS for the <strong>San</strong> <strong>Benito</strong> station. Monthly ET crop coefficients (Kco) for each crop type were<br />
adapted from several sources. Table E-4 (located at the end of the section) shows the crop<br />
coefficients and their sources. The coefficient (Kco) and the reference ET (ETo) are multiplied<br />
along with an Etc factor to determine the potential ET of the land cover. Potential ET refers to<br />
the amount of water a plant or type of land cover could consume given sufficient water at all<br />
times. Actual ET is limited by the amount of water available from precipitation and soil<br />
moisture. During the winter months, rainfall often exceeds potential ET, so the plant’s water<br />
needs are fully satisfied and actual ET is equal to potential ET. Actual ET is also controlled by<br />
the global variable, AET depression. This variable limits the amount of water that can be used<br />
to satisfy the ET needs of the overlying land cover, as a fraction of the maximum soil moisture<br />
capacity.<br />
Irrigation – Some of the soil moisture zones represent crop types that are often irrigated. The<br />
irrigation water combines with the natural precipitation and contributes to soil moisture storage<br />
and deep percolation. The rate of applied irrigation is determined based on the potential ET of<br />
the crop and an irrigation efficiency of 90 percent. The irrigation efficiency indicates that the<br />
ET demands of the crop consume 90 percent of the water applied, and that the remaining 10<br />
percent infiltrates and becomes soil moisture or deep percolation. Irrigation is not expected to<br />
occur when soils are saturated. The global variable, soil moisture irrigation threshold, is the<br />
fraction of maximum soil moisture storage when irrigation occurs. If the soil moisture is greater<br />
than the threshold, no irrigation occurs.<br />
Soil Moisture Capacity - The maximum soil moisture capacity is the total amount of water<br />
that can be stored in the root zone of a specific soil with a given land cover. Any additional<br />
water results in deep percolation to the aquifer. Maximum soil moisture capacity is derived<br />
from the available capacity of a soil (the moisture range between field capacity and permanent<br />
wilting point, in inches per inch) and the rooting depth of the land cover/crop. The rooting<br />
depths were compiled from a variety of sources including Blaney and others (1963) for native<br />
vegetation, United Nations FAO Irrigation and Drainage Paper No. 56 for crops (2006), and<br />
Dunne and Leopold (1978) for bare soils. The available water capacity was based on Natural<br />
Resources Conservation Service hydrologic soil groups. The ending soil moisture for each soil<br />
moisture zone of the analysis performed for previous water years was used as the initial soil<br />
moisture balance for water years 2006 through 2008.<br />
Annual Groundwater Report for <strong>Water</strong> Year 2008 December 2008<br />
<strong>San</strong> <strong>Benito</strong> <strong>County</strong> <strong>Water</strong> <strong>District</strong> E-7
As in previous water years, Zone 6 was divided into 15 recharge zones by area, shown on<br />
Figure E-1. Each recharge zone is made up of one or more soil moisture zone. While each<br />
recharge zone contains only one soil type, it consists of one or more crop/land covers. The<br />
resulting deep percolation of the recharge zone is based on a weighted average of the soil<br />
moisture zones. The proportions of various crop/soil combinations in a recharge zone can vary<br />
seasonally to reflect growing seasons. For example, recharge zone 4 is comprised of four soil<br />
moisture zone, native vegetation, fallow land, irrigated truck crops, and deciduous orchard. In<br />
the summer months, 40 percent of the zone is covered by irrigated truck crops. This decreases<br />
to 10 percent in the winter months when the previously irrigated land is not cultivated. In<br />
addition, two recharge zones (zones 12 and 13) incorporate large areas of impervious urban<br />
land. In order to reflect the decreased ET demands and deep percolation of runoff from<br />
impervious surfaces, a fraction of the rainfall on the impervious portion is assumed to go<br />
directly to deep percolation. Table E-5 (located at the end of the section) shows the proportions<br />
of crop/soil combinations in each recharge zone. Deep percolation can be further analyzed by<br />
subbasin based on the percent of subbasin area in each recharge zone, shown in Table E-5.<br />
For the purposes of the water balance, deep percolation from natural and irrigation sources are<br />
reported separately. Because irrigation water use is measured directly in Zone 6, irrigation<br />
percolation can be estimated as 10 percent of the applied water (total irrigation water multiplied<br />
by 1 – the irrigation efficiency). The remaining deep percolation calculated by the above<br />
method is considered natural percolation. For areas outside of Zone 6, irrigation percolation is<br />
considered to equal total percolation for irrigated areas. The deep percolation from rainfall and<br />
irrigation by subbasin is shown in Tables 6 through 8.<br />
The soil moisture balance could be further improved with additional data and testing. Based on<br />
previous sensitivity analyses of the large number of variables used in the analysis, some are<br />
known to strongly influence the calculated deep percolation. In areas of natural vegetation, root<br />
depth is a particularly influential variable and is one for which reliable, spatially averaged data<br />
are difficult to obtain. The parameters used to calculate rainfall runoff also have a large effect,<br />
and runoff data from relatively flat, purely agricultural watersheds are also difficult to find.<br />
Runoff parameters are also highly influenced by tillage practices and cover crops. Runoff<br />
parameters may underestimate runoff during wet times, thus overestimating the total<br />
percolation. In 2006, deep percolation estimates were reduced by 20 percent to refine the<br />
overall water budget balance. The “bathtub” conceptual model of the root zone also ignores the<br />
slow but sustained deep percolation that occurs under drier unsaturated conditions. In addition,<br />
changes in crop and land cover may have changed the percolation distribution of the basin.<br />
Recent land use maps and irrigation practices should be used to update the composition and<br />
areas of the recharge zones. Each of these aspects of the soil moisture budget could potentially<br />
be improved through additional data, model refinement and testing.<br />
Annual Groundwater Report for <strong>Water</strong> Year 2008 December 2008<br />
<strong>San</strong> <strong>Benito</strong> <strong>County</strong> <strong>Water</strong> <strong>District</strong> E-8
Reclaimed <strong>Water</strong> Percolation<br />
Several municipalities have wastewater treatment plants (WWTPs) within the basin, including<br />
the Tres Pinos, Cielo Vista, and <strong>San</strong> Juan Bautista WWTPs, two sites operated by Sunnyslope<br />
<strong>County</strong> <strong>Water</strong> <strong>District</strong> near Ridgemark, and the City of Hollister domestic and industrial plants<br />
(DWTP and IWTP, respectively). Tres Pinos, Sunnyslope and the City of Hollister have<br />
percolation ponds where treated wastewater is allowed to percolate to the groundwater aquifer.<br />
The total volume percolated is reported by facility in Appendix D for <strong>Water</strong> Years 2006<br />
through 2008. The percolation from each facility is assigned to one or more subbasins. The<br />
distribution of reclaimed water percolation is shown in Table E-6. The proportions of recharge<br />
percolating each subbasin are estimated and may be further refined with additional study.<br />
Subsurface Inflow<br />
Table E-6. Percent of WW percolating in each subbasin<br />
<strong>San</strong><br />
Juan<br />
Hollister<br />
West<br />
Tres<br />
Pinos<br />
Hollister -- domestic 100<br />
Hollister -- industrial 50 50<br />
Ridgemark Estates I & II 100<br />
Tres Pinos 100<br />
Subsurface inflows and outflows of individual subbasins can be estimated using Darcy’s Law.<br />
Darcy’s Law can be expressed by:<br />
Q = K * A * dh/dL<br />
Where Q represents the volume of flow, K represents the hydraulic conductivity of the local<br />
aquifer, A is the cross-sectional area of flow, and dh/dL is the gradient of water levels (change<br />
in head over the change in distance). While many of the variables are estimates, Darcy’s Law<br />
allows a reasonable estimate of the direction and magnitude of flow. Each subbasin is directly<br />
adjacent to one or more other subbasins and has the potential for both inflow and outflow. For<br />
each point of contact between subbasins, the basic variables (hydraulic conductivity and crosssectional<br />
area) were estimated, as shown in Table E-7 (located at the end of the section). The<br />
gradient of flow changes on seasonal basis and can be estimated from the groundwater level<br />
contours presented in each annual report. To simplify the analysis, only water levels from<br />
October were used to calculate the gradient. In addition, to seasonal and spatial variation of the<br />
water levels boundary conditions can also be controlled by surface water bodies. For example,<br />
the outflow from the Bolsa subbasin is generally considered to contribute to baseflow of the<br />
Pajaro River. These surface water groundwater interactions are not taken into account in this<br />
simple analysis and could be used to better refine the methodology. Because this method results<br />
in only a rough estimate of inflow and outflow, flows were rounded to the nearest 250 af.<br />
Annual Groundwater Report for <strong>Water</strong> Year 2008 December 2008<br />
<strong>San</strong> <strong>Benito</strong> <strong>County</strong> <strong>Water</strong> <strong>District</strong> E-9
OUTFLOWS<br />
The major outflows from the subbasins in Zone 6 and surrounding areas are groundwater<br />
pumping (agricultural and M&I plus domestic) and subsurface outflow.<br />
Pumping<br />
Groundwater pumping in Zone 6 is metered and read three times per water year in early spring,<br />
summer, and early fall. Groundwater meters are categorized as agriculture use, domestic use, or<br />
municipal use. Monthly data for municipal wells are also received directly from the City of<br />
Hollister, Sunnyslope, the City of <strong>San</strong> Juan Bautista, and Tres Pinos <strong>Water</strong> <strong>District</strong>. For areas<br />
outside of Zone 6 (Bolsa, Pacheco, Tres Pinos Creek Valley), agricultural pumping is estimated<br />
using the soil moisture budget. The irrigation needs of the subbasins are based on land use,<br />
crop evapotranspiration coefficient, and irrigation efficiency. Domestic and municipal use in<br />
the Bolsa, and Pacheco subbasins are assumed negligible. Municipal wells of Tres Pinos <strong>Water</strong><br />
<strong>District</strong> are located within the Tres Pinos Creek Valley and represent the total domestic and<br />
municipal water use for that area.<br />
Groundwater Outflow<br />
Subsurface outflow is determined by the same method as groundwater inflow, using Darcy’s<br />
law with available water level data. Table E-7 shows the variables used in the analysis.<br />
CHANGE IN STORAGE<br />
The change in groundwater storage can be estimated two ways. The first is simply:<br />
Inflows- Outflows = Change in Storage<br />
The second method, described in detail in the groundwater levels section of the report, involves<br />
analysis of the change in water levels and the regional storavitiy values.<br />
CONCLUSION<br />
The water balance analysis provides independent estimation of each element with consistent<br />
methodology, and thereby provides a useful check on the current basin conceptualization. The<br />
water balance can be used to help illustrate and document changes in groundwater basin<br />
conditions, and can pinpoint changes in groundwater use, hydrologic conditions, or<br />
groundwater management. The water balance should continue to be updated regularly. In<br />
addition, estimation of selected water balance elements can be improved with further data and<br />
analysis as described in the previous section.<br />
Annual Groundwater Report for <strong>Water</strong> Year 2008 December 2008<br />
<strong>San</strong> <strong>Benito</strong> <strong>County</strong> <strong>Water</strong> <strong>District</strong> E-10
Legend<br />
Zones<br />
Subbasin<br />
December 2008<br />
TODD ENGINEERS<br />
Alameda, California<br />
Figure E-1<br />
Recharge<br />
Zones
Table E-3a. Properties of Soil Moisture Zone 1-13<br />
Zone Number 1 2 3 4 5 6 7 8 9 10 11 12 13<br />
crop Native Native Native Native Native Bare Bare Bare Bare Pasture Pasture Pasture Non-irrig.<br />
soil I II III IV V I II III IV II III IV III<br />
Root depth (inches) 48 48 30 30 18 12 12 12 12 36 36 36 30<br />
Available water capacity (in/in) 0.08 0.19 0.18 0.15 0.13 0.08 0.19 0.18 0.15 0.19 0.18 0.15 0.18<br />
Max. soil moisture storage (in.) 3.84 9.12 5.40 4.50 2.34 0.96 2.28 2.16 1.80 6.84 6.48 5.40 5.40<br />
Runoff equation slope (in/in) 0.72 0.8 0.85 0.9 0.85 0.75 0.8 0.85 0.95 0.8 0.85 0.95 0.85<br />
Runoff equation intercept (in.) 0.48 0.36 0.32 0.3 0.32 0.48 0.36 0.32 0.2 0.36 0.32 0.2 0.32<br />
Irrigation switch (1=yes, 0=no) 0 0 0 0 0 0 0 0 0 1 1 1 0<br />
Initial soil moisture storage (in.)* 0.01 0.50 0.06 0.02 0.00 0.05 0.60 0.53 0.31 6.48 4.87 3.67 0.12<br />
Etc factor (decimal) 0.6 0.6 0.6 0.6 0.6 0.6 0.6 0.6 0.6 0.6 0.6 0.6 0.6<br />
* Ending Soil Moisture of Previous Annual Reports <strong>Water</strong> Balance<br />
Table E-3b. Properties of Soil Moisture Zone 14-27<br />
Zone Number 14 15 16 17 18 19 20 21 22 23 24 25 26 27<br />
crop Non-irrig. Irrig. Irrig. Irrig. Truck Truck Truck Truck Orchard Orchard Orchard Turf Turf Pasture<br />
soil IV II III IV I II III IV I II III II IV IV<br />
Root depth (inches) 30 30 30 30 24 24 24 24 72 72 72 12 12 36<br />
Available water capacity (in/in) 0.15 0.19 0.18 0.15 0.08 0.19 0.18 0.15 0.08 0.19 0.18 0.19 0.15 0.15<br />
Max. soil moisture storage (in.) 450 4.50 5.70 570 5.40 540 4.50 450 1.92 192 4.56 456 4.32 432 3.60 360 5.76 576 13.68 12.96 2.28 228 1.80 180 5.40 540<br />
Runoff equation slope (in/in) 0.9 0.8 0.85 0.9 0.75 0.8 0.85 0.95 0.75 0.8 0.85 0.8 0.95 0.95<br />
Runoff equation intercept (in.) 0.2 0.36 0.32 0.2 0.48 0.36 0.32 0.2 0.48 0.36 0.32 0.36 0.2 0.2<br />
Irrigation switch (1=yes, 0=no) 0 1 1 1 1 1 1 1 1 1 1 1 1 1<br />
Initial soil moisture storage (in.)* 0.04 5.32 4.23 3.16 1.44 3.79 2.47 2.84 3.15 9.69 8.24 1.15 1.72 3.10<br />
Etc factor (decimal) 0.6 0.6 0.6 0.6 0.6 0.6 0.6 0.6 0.6 0.6 0.6 1 1 1.3<br />
* Ending Soil Moisture of Previous Annual Reports <strong>Water</strong> Balance<br />
Table E-3c. Properties of Soil Moisture Zones<br />
Global Variables<br />
Irrigation efficiency (%) 0.9<br />
Soil moisture irrigation threshold (fraction<br />
of max. moisture) 0.5<br />
AET depression from soil moisture<br />
depletion begins at this threshold (fraction<br />
of max. moisture) 0.9
Table E-4. Crop Coefficients Used in Soil Moisture Budget<br />
Grain/field<br />
Non-<br />
Month Native Bare Pasture Irrigation Truck Orchard Turf<br />
Jan 1.00 0.28 1.00 0.94 0.80 0.73 1.00<br />
Feb 1.00 0.24 1.00 1.05 0.69 0.59 1.00<br />
Mar 1.00 0.21 1.00 1.06 0.77 0.66 1.00<br />
Apr 0.98 0.15 0.98 0.65 0.88 0.80 1.00<br />
May 0.96 0.16 0.96 0.42 0.99 0.91 1.00<br />
Jun 0.94 0.20 0.94 0.61 1.06 0.98 1.00<br />
Jul 0.92 0.10 0.92 1.21 0.92 1.04 1.00<br />
Aug 0.94 0.12 0.94 1.08 0.83 0.99 1.00<br />
Sep 0.96 0.09 0.96 0.65 0.86 1.02 1.00<br />
Oct 0.98 0.12 0.98 0.12 0.81 1.00 1.00<br />
Nov 1.00 0.19 1.00 0.19 0.72 0.96 1.00<br />
Dec 1.00 0.30 1.00 0.40 0.52 0.74 1.00<br />
Source: Blaney et al. Blaney et al. Blaney et al. Bulletin 113-3 Richard Smith Richard Smith Ref ET
Table E-5. Description of Area, Soil, and Land Cover of Recharge Zones.<br />
Recharge zone 1 2 3 4 5 6 7 8 9 10 11 12 13 14 15<br />
Area of zone (acres) 3,477 6,112 22,269 587 4,213 2,113 8,765 8,487 1,872 3,241 1,287 5,347 4,451 9,787 1,022<br />
Soil group I II V I III III IV IV IV III III II III II II<br />
Vegetation types (%)<br />
Native vegetation 60 10 100 10 10 100 10 10 10 10 25 30 10 20<br />
Fallow/bare 40 40-10 40-10 40-10 50-10 40-10 50-10 50-10<br />
Pasture/turf/alfalfa 40 20 30<br />
Irrigated grain/field 20 20<br />
Nonirrigated<br />
grain/field 20 90 100<br />
Truck 10-40 10-40 10-40 20-60 10-40 20-60 20-60<br />
Deciduous orchard 40 40 40 20 30 80<br />
Impervious 35 10
Table E-7. Approximate Groundwater Inflow and Outflow Darcy Calculations<br />
Assumed<br />
Boundary Identifier Length Saturated<br />
Thickness<br />
Assumed<br />
Boundary<br />
Area<br />
2<br />
INFLOW<br />
K<br />
(ft/day)<br />
2006<br />
Slope<br />
(ft/ft)<br />
2006 Flow Across 2007 2007 Flow Across 2008 2008 Flow Across<br />
2006 Totals (AF) 2007 Totals (AF) 2008 Totals (AF)<br />
Boundary Slope Boundary Slope Boundary<br />
(ft3/day) (AF/yr) (ft/ft) (ft3/day) (AF/yr) (ft/ft) (ft3/day) (AF/yr) Inflow Outflow Inflow Outflow Inflow Outflow<br />
Hollister East Tres Pinos Creek Valley -- 3,853 -- 3,082 -- 3,596<br />
In to Hollister East - East Boundary (1) 16,142 280 4,519,722 1.5 0.0100 67,796 568 0.0100 67,796 568 0.0120 81,355 682 Tres Pinos 3,853 2,621 3,082 3,058 3,596 2,621<br />
In to Hollister East - East Boundary (2) 15,526 200 3,105,230 0.8 0.0100 24,842 208 0.0100 24,842 208 0.0050 12,421 104 Hollister West 2,678 3,883 3,112 2,848 2,652 3,883<br />
In to Hollister East - East Boundary (3) 5,032 140 704,530 8.0 0.0100 56,362 472 0.0100 56,362 472 0.0050 28,181 236 Hollister East 1,249 1,619 1,249 1,619 1,022 1,619<br />
Total in to Hollister East 149,000 1,249 149,000 1,249 121,957 1,022 Pacheco 4,086 4,167 4,497497 4,167 4,703 5,556556<br />
Hollister West Bolsa South East 3,883 1,985 2,848 1,985 3,883 1,323<br />
In to Hollister West from outside basin 18,977 240 4,554,575 0.1 0.0150 6,832 57 0.0140 6,376 53 0.0080 3,644 31 Bolsa 6,152 5,358 6,152 1,339 6,879 1,206<br />
In to Hollister West from Tres Pinos 8,021 500 4,010,601 26.0 0.0030 312,827 2,621 0.0035 364,965 3,058 0.0030 312,827 2,621 <strong>San</strong> Juan 236 21 264 21 283 37<br />
Total in to Hollister West 319,659 2,678 371,341 3,112 316,471 2,652 Total 22,137 23,507 21,203 18,120 23,017 19,841<br />
Pacheco<br />
In to Pacheco from outside basin (1) 11,344 200 2,268,782 20.0 0.0060 272,254 2,281 0.0070 317,629 2,661 0.0075 340,317 2,852<br />
In to Pacheco from outside basin (2) 9,844 250 2,460,923 1.5 0.0060 22,148 186 0.0070 25,840 217 0.0075 27,685 232<br />
In to Pacheco from Hollister East across northeast Boundary 7,973 500 3,986,603 0.8 0.0000 0 0 0.0000 0 0 0.0000 0 0<br />
In to Pacheco from Hollister East across northwest Boundary 21,469 500 10,734,258 12.0 0.0015 193,217 1,619 0.0015 193,217 1,619 0.0015 193,217 1,619<br />
Total in to Pacheco 487,619 4,086 536,686 4,497 561,219 4,703<br />
<strong>San</strong> Juan<br />
In To <strong>San</strong> Juan across northern southeast boundary (outside basin) 9,143 250 2,285,774 0.1 0.0125 2,857 24 0.0140 3,200 27 0.0150 3,429 29<br />
In To <strong>San</strong> Juan across southern southeast boundary (outside basin) 20,207 100 2,020,657 1.0 0.0125 25,258 212 0.0140 28,289 237 0.0150 30,310 254<br />
Ttli Total in to <strong>San</strong> Juan 28,115 236 31,489 264 33,739 283<br />
Tres Pinos<br />
In To Tres Pinos from TPCV 7,663 500 3,831,650 8.0 0.0150 459,798 3,853 0.0120 367,838 3,082 0.0140 429,145 3,596<br />
Bolsa<br />
In to Bolsa from Pacheco (NE Boundary) 7,037 700 4,926,240 20.0 0.0030 295,574 2,477 0.0030 295,574 2,477 0.0040 394,099 3,302<br />
In to Bolsa from Pacheco (SW Boundary) 9,604 700 6,722,894 10.0 0.0030 201,687 1,690 0.0030 201,687 1,690 0.0040 268,916 2,253<br />
In to Bolsa from Bolsa SE 17,949 550 9,871,760 4.0 0.0060 236,922 1,985 0.0060 236,922 1,985 0.0040 157,948 1,323<br />
Total in to Bolsa 734,183 6,152 734,183 6,152 820,963 6,879<br />
Bolsa SE<br />
In to Bolsa SE from Hollister West 8,828 700 6,179,446 5.0 0.0150 463,458 3,883 0.0110 339,870 2,848 0.0150 463,458 3,883<br />
OUTFLOW<br />
Bolsa<br />
Out of Bolsa 32,623 700 22,836,309 7.0 0.0040 639,417 5,358 0.0010 159,854 1,339 0.0009 143,869 1,206<br />
<strong>San</strong> Juan<br />
Out of <strong>San</strong> Juan 12,613 500 6,306,702 0.1 0.0040 2,523 21 0.0040 2,523 21 0.0070 4,415 37
Appendix F<br />
Charges, Revenues and Expenditures<br />
Annual Groundwater Report for <strong>Water</strong> Year 2008 December 2008<br />
<strong>San</strong> <strong>Benito</strong> <strong>County</strong> <strong>Water</strong> <strong>District</strong>
Table F-1. Historical and Current <strong>San</strong> <strong>Benito</strong> <strong>County</strong> <strong>Water</strong> <strong>District</strong> <strong>Water</strong> Charges<br />
CVP (Blue Valve) <strong>Water</strong> Rates (dollars/af)<br />
Standby &<br />
Availability<br />
<strong>Water</strong> Charge<br />
Power Charge<br />
Groundwater Charge (dollars/af)<br />
Charge<br />
Municipal<br />
Distribution Subsystem<br />
Municipal<br />
Year (dollars/acre) Agricultural & Industrial 2 6H 9H 9L Others Agricultural & Industrial<br />
1987 $8.00 $34.00 n.c. $5.00 (2) $25.00 (2)<br />
1988 $2.00 $34.00 n.c. $5.00 (2) $25.00 (2)<br />
1989 $2.00 $34.00 $90.00 $0.00 $0.00<br />
1990 $4.00 $34.00 $90.00 $6.25 $22.00<br />
1991 $4.00 $38.00 $113.00 $6.25 $22.00<br />
1992 $4.00 $45.00 $120.00 $2.00 $10.00<br />
1993 $4.50 $45.00 $120.00 $1.00 $15.00 (3)<br />
$55.00 (1) $146.00 (1) $1.00 $5.00<br />
1994 $4.50 $77.61 $168.92 $1.00 $5.00<br />
1995 $4.50 $77.61 $168.92 $1.00 $15.75 First 100 af<br />
$36.70 Next 500 af<br />
$54.60 Over 600 af<br />
1996 $6.00 $75.00 $150.00 $1.50 $33.00<br />
1997 $6.00 $75.00 $157.00 $1.50 $33.00<br />
1998 $6.00 $75.00 $155.00 $1.50 $33.00<br />
1999 $6.00 $75.00 $155.00 $1.50 $33.00<br />
2000 $6.00 $75.00 $155.00 $1.50 $11.50<br />
2001 $6.00 $75.00 $155.00 $1.50 $25.00<br />
2002 $6.00 $75.00 $150.00 $40.00 $50.00 $30.00 $15.00 (4) $1.50 $25.00<br />
2003 $6.00 $75.00 $150.00 $19.00 $35.00 $46.80 $22.70 $9.40 $1.50 $20.00<br />
2004 $6.00 $75.00 $150.00 $24.30 $46.75 $53.70 $25.05 $15.25 $1.50 $10.00<br />
2005 $6.00 $80.00 $150.00 $26.15 $49.40 $66.90 $35.00 $17.10 $1.50 $21.50<br />
2006 $6.00 $85.00 $160.00 $23.60 $36.05 $65.75 $34.70 $18.40 $1.50 $21.50<br />
2007 $6.00 $85.00 $160.00 $23.60 $36.05 $65.75 $34.70 $18.40 $1.50 $21.50<br />
2008 $6.00 $100.00 $170.00 $17.25 $19.25 $62.75 $32.60 $14.85 $1.50 $21.50<br />
Notes:<br />
af = acre-feet.<br />
n.c. = no classification.<br />
All rates effective March 1 through following February.<br />
(1) Revised August 1993.<br />
(2) Never implemented.<br />
(3) Amended, but never implemented.<br />
(4) First implemented in 2002<br />
F-1 Historical SB Charges Todd Engineers 12/7/2008
Table F-2. U.S. Bureau of Reclamation Charges per Acre-Foot for CVP <strong>Water</strong>, 1996-2008<br />
User Category and<br />
Cost Item 1996 1997 1998 1999 2000 2001 2002 2003 2004 2005 2006 2007 2008<br />
Irrigation (1)<br />
Cost of service (2) $65.63 $69.57 $61.58 $60.30 $64.24 $69.50 $68.71 $72.20 $74.52 $77.10 $91.13 $93.53 $28.12 (6)(7)<br />
Restoration fund (3) $6.53 $6.70 $6.88 $6.98 $7.10 $7.28 $7.54 $7.69 $7.82 $7.93 $8.24 $8.58 $8.79<br />
SLDMWA (4) n.a. n.a. $5.00 $2.73 $6.43 $2.65 $6.61 $5.46 $6.61 $7.99 $9.31 $9.99 $10.95<br />
Total $72.16 $76.27 $73.46 $70.01 $77.77 $79.43 $82.86 $85.35 $88.95 $93.02 $108.68 $112.10 $47.86<br />
Contract rate (5) $27.46 $27.46 $27.46 $27.46 $27.46 $27.46 $24.30 $24.30 $24.30 $24.30 $30.93 $30.93 $30.93<br />
Municipal & Industrial<br />
Cost of service (2) $127.40 $143.27 $130.88 $127.91 $129.59 $129.40 $130.32 $129.07 $134.86 $132.01 $214.41 $215.32 $33.34 -7<br />
Restoration fund (3) $13.06 $13.39 $13.76 $13.96 $14.20 $14.56 $15.08 $15.38 $15.64 $15.87 $16.49 $17.15 $17.57<br />
SLDMWA (4) n.a. n.a. $5.00 $2.73 $6.43 $4.15 $6.61 $5.46 $6.61 $7.99 $9.31 $9.99 $10.95<br />
Total $140.46 $156.66 $149.64 $144.60 $150.22 $148.11 $152.01 $149.91 $157.11 $155.87 $240.21 $242.46 $61.68<br />
Contract rate (5) $85.86 $85.86 $85.86 $85.86 $85.86 $85.86 $79.13 $79.13 $79.13 $79.13 $77.12 $80.08 $33.34<br />
Notes:<br />
(1) The irrigation rates shown here are for non-full cost users, which include almost all agricultural users in Zone 6<br />
(2) Cost-of-service for agricultural and municipal and industrial users includes a capital repayment rate and an operation and maintenanc<br />
(O&M) rate. For municipal and industrial customers, cost-of-service also includes a deficit charge, which includes interest on unpai<br />
O&M and interest on capital and on unpaid deficit. Cost-of-service rates apply March 1 through the end of the following February<br />
(3) Restoration fund charges apply October 1 through September 30<br />
(4) Beginning in 1998, the <strong>San</strong> Luis-Delta Mendota <strong>Water</strong> Authority instituted this charge to "self-fund" costs associated with maintainin<br />
the Delta-Mendota Canal and certain other facilities, which were formerly funded directly by the Bureau of Reclamation. SLDMWA issues<br />
preliminary rates in October for the upcoming contract year (March-February). These rates are used for rate-setting purposes; actual<br />
rates may vary.<br />
(5) The contract rate is shown for comparison. It is the minimum rate CVP contractors are allowed to pay. To the extent that the contract rate<br />
does not cover interest plus actual operation and maintenance costs, a contractor deficit is accumulated that is charged interest at the<br />
current-year treasury borrowing rate.<br />
F-2 USBR Charges Todd Engineers 12/7/2008
Table F-3. 2006/2007 Recommended Groundwater Revenue Requirement/Charges<br />
REVENUE REQUIREMENTS<br />
Rate<br />
Component<br />
($/AF)<br />
Quantity 1<br />
Rates 2<br />
(af) Amount Ag M & I<br />
(per A/F) (per A/F)<br />
Source of Supply<br />
Ag Source of Supply Costs 7.36 12,449 91,666 $ 7.36<br />
M&I Source of Supply Costs 22.31 7,687 171,528 $ 22.31<br />
Percolation Costs<br />
Ag CVP <strong>Water</strong> Rate 3 123.89 180 22,300 $ 1.79<br />
M&I CVP <strong>Water</strong> Rate 3 198.23 250 49,558 $ 6.45<br />
Ag Power Charge for Percolation 17.49 180 3,148 $ 0.25<br />
M&I Power Charge for Percolation 17.49 250 4,373 $ 0.57<br />
TOTAL $ 9.40 $ 21.50<br />
Current Groundwater Charge 4 (per acre foot) $ 1.50 $ 21.50<br />
RECOMMENDED CHARGES (per acre foot) $ 2.50 $ 22.50<br />
1 Assumed Volumes<br />
Percolation (based on average of past 3 years)<br />
Ag volume<br />
180<br />
M&I volume<br />
250<br />
Groundwater Usuage (based on average of past 3 years)<br />
Ag usage<br />
12,449<br />
M&I usage<br />
7,687<br />
2 Rates=Revenue Requirement/projected usage<br />
3 CVP water rate basis for 2008-2009 water year<br />
4 Groundwater charge adopted by <strong>San</strong> <strong>Benito</strong> <strong>County</strong> <strong>Water</strong> <strong>District</strong> Board<br />
of Directors in Feburary 2006, effective March 2007<br />
Note: Section 70-7.8 (a) of the <strong>District</strong> Act states that the agricultural rate shall not exceed one-third of<br />
the rates for all water other than agricultural water.<br />
Tables08.xls F-3 Recommended Charges
Appendix G<br />
List of Acronyms<br />
Annual Groundwater Report for <strong>Water</strong> Year 2008 December 2008<br />
<strong>San</strong> <strong>Benito</strong> <strong>County</strong> <strong>Water</strong> <strong>District</strong>
LIST OF ACRONYMS<br />
af ....................................................................................................................................................................... acre-foot<br />
af/yr ..................................................................................................................................................... acre-foot per year<br />
CDHS ........................................................................................................... California Department of Health Services<br />
cfs .................................................................................................................................................. cubic feet per second<br />
CIMIS ....................................................................................... California Irrigation Management Information System<br />
COC ............................................................................................................................................. constituent of concern<br />
CVP ............................................................................................................................................. Central Valley Project<br />
<strong>District</strong> or SBCWD .................................................................................................... <strong>San</strong> <strong>Benito</strong> <strong>County</strong> <strong>Water</strong> <strong>District</strong><br />
DWR ........................................................................................................... California Department of <strong>Water</strong> Resources<br />
DWTP .................................................................................................................... domestic wastewater treatment plant<br />
EIR ..................................................................................................................................... environmental impact report<br />
ET ...................................................................................................................................................... evapotranspiration<br />
ft ................................................................................................................................................................................. feet<br />
gpd .......................................................................................................................................................... gallons per day<br />
IRWMP .................................................................................................... Integrated Regional <strong>Water</strong> Management Plan<br />
IWTP .................................................................................................................... industrial wastewater treatment plant<br />
MGD ........................................................................................................................................... million gallons per day<br />
mg/l ................................................................................................................................................... milligrams per liter<br />
M&I .......................................................................................................................................... municipal and industrial<br />
PVWMA ...................................................................................................... Pajaro Valley <strong>Water</strong> Management Agency<br />
USBR .................................................................................................................................. U.S. Bureau of Reclamation<br />
RWQCB ............................................................................................................ Regional <strong>Water</strong> Quality Control Board<br />
SCVWD ..................................................................................................................... <strong>San</strong>ta Clara Valley <strong>Water</strong> <strong>District</strong><br />
SEIR ............................................................................................................ supplemental environmental impact report<br />
SLDMWA ................................................................................................ <strong>San</strong> Luis & Delta-Mendota <strong>Water</strong> Authority<br />
Sunnyslope CWD ..................................................................................................... Sunnyslope <strong>County</strong> <strong>Water</strong> <strong>District</strong><br />
TDS ................................................................................................................................................ total dissolved solids<br />
WRA ............................................................................................. <strong>Water</strong> Resources Association of <strong>San</strong> <strong>Benito</strong> <strong>County</strong><br />
Annual Groundwater Report for <strong>Water</strong> Year 2008 December 2008<br />
<strong>San</strong> <strong>Benito</strong> <strong>County</strong> <strong>Water</strong> <strong>District</strong>