

okd9zlo
okd9zlo
okd9zlo

Create successful ePaper yourself
Turn your PDF publications into a flip-book with our unique Google optimized e-Paper software.
CONTINUING EDUCATION<br />
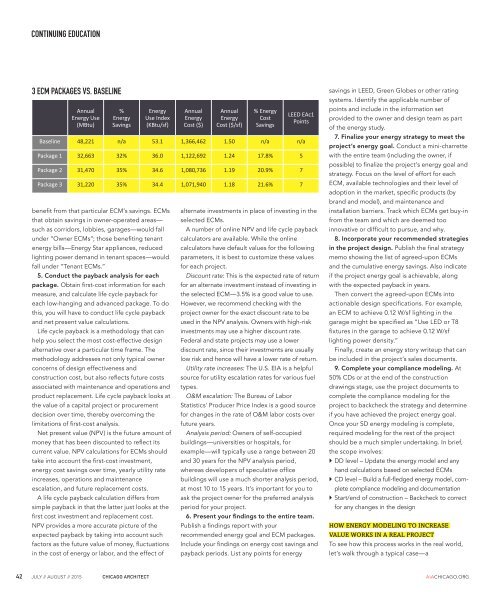
3 ECM PACKAGES VS. BASELINE<br />
Annual<br />
Energy Use<br />
(MBtu)<br />
%<br />
Energy<br />
Savings<br />
Energy<br />
Use Index<br />
(KBtu/sf)<br />
benet from that particular ECM’s savings. ECMs<br />
that obtain savings in owner-operated areas—<br />
such as corridors, lobbies, garages—would fall<br />
under “Owner ECMs”; those beneting tenant<br />
energy bills—Energy Star appliances, reduced<br />
lighting power demand in tenant spaces—would<br />
fall under “Tenant ECMs.”<br />
5. Conduct the payback analysis for each<br />
package. Obtain rst-cost information for each<br />
measure, and calculate life cycle payback for<br />
each low-hanging and advanced package. To do<br />
this, you will have to conduct life cycle payback<br />
and net present value calculations.<br />
Life cycle payback is a methodology that can<br />
help you select the most cost-effective design<br />
alternative over a particular time frame. The<br />
methodology addresses not only typical owner<br />
concerns of design effectiveness and<br />
construction cost, but also reects future costs<br />
associated with maintenance and operations and<br />
product replacement. Life cycle payback looks at<br />
the value of a capital project or procurement<br />
decision over time, thereby overcoming the<br />
limitations of rst-cost analysis.<br />
Net present value (NPV) is the future amount of<br />
money that has been discounted to reect its<br />
current value. NPV calculations for ECMs should<br />
take into account the rst-cost investment,<br />
energy cost savings over time, yearly utility rate<br />
increases, operations and maintenance<br />
escalation, and future replacement costs.<br />
A life cycle payback calculation differs from<br />
simple payback in that the latter just looks at the<br />
rst cost investment and replacement cost.<br />
NPV provides a more accurate picture of the<br />
expected payback by taking into account such<br />
factors as the future value of money, uctuations<br />
in the cost of energy or labor, and the effect of<br />
Annual<br />
Energy<br />
Cost ($)<br />
Annual<br />
Energy<br />
Cost ($/sf)<br />
% Energy<br />
Cost<br />
Savings<br />
LEED EAc1<br />
Points<br />
Baseline 48,221 n/a 53.1 1,366,462 1.50 n/a n/a<br />
Package 1 32,663 32% 36.0 1,122,692 1.24 17.8% 5<br />
Package 2 31,470 35% 34.6 1,080,736 1.19 20.9% 7<br />
Package 3 31,220 35% 34.4 1,071,940 1.18 21.6% 7<br />
alternate investments in place of investing in the<br />
selected ECMs.<br />
A number of online NPV and life cycle payback<br />
calculators are available. While the online<br />
calculators have default values for the following<br />
parameters, it is best to customize these values<br />
for each project.<br />
Discount rate: This is the expected rate of return<br />
for an alternate investment instead of investing in<br />
the selected ECM—3.5% is a good value to use.<br />
However, we recommend checking with the<br />
project owner for the exact discount rate to be<br />
used in the NPV analysis. Owners with high-risk<br />
investments may use a higher discount rate.<br />
Federal and state projects may use a lower<br />
discount rate, since their investments are usually<br />
low risk and hence will have a lower rate of return.<br />
Utility rate increases: The U.S. EIA is a helpful<br />
source for utility escalation rates for various fuel<br />
types.<br />
O&M escalation: The Bureau of Labor<br />
Statistics’ Producer Price Index is a good source<br />
for changes in the rate of O&M labor costs over<br />
future years.<br />
Analysis period: Owners of self-occupied<br />
buildings—universities or hospitals, for<br />
example—will typically use a range between 20<br />
and 30 years for the NPV analysis period,<br />
whereas developers of speculative ofce<br />
buildings will use a much shorter analysis period,<br />
at most 10 to 15 years. It’s important for you to<br />
ask the project owner for the preferred analysis<br />
period for your project.<br />
6. Present your ndings to the entire team.<br />
Publish a ndings report with your<br />
recommended energy goal and ECM packages.<br />
Include your ndings on energy cost savings and<br />
payback periods. List any points for energy<br />
savings in LEED, Green Globes or other rating<br />
systems. Identify the applicable number of<br />
points and include in the information set<br />
provided to the owner and design team as part<br />
of the energy study.<br />
7. Finalize your energy strategy to meet the<br />
project’s energy goal. Conduct a mini-charrette<br />
with the entire team (including the owner, if<br />
possible) to nalize the project’s energy goal and<br />
strategy. Focus on the level of effort for each<br />
ECM, available technologies and their level of<br />
adoption in the market, specic products (by<br />
brand and model), and maintenance and<br />
installation barriers. Track which ECMs get buy-in<br />
from the team and which are deemed too<br />
innovative or difcult to pursue, and why.<br />
8. Incorporate your recommended strategies<br />
in the project design. Publish the nal strategy<br />
memo showing the list of agreed-upon ECMs<br />
and the cumulative energy savings. Also indicate<br />
if the project energy goal is achievable, along<br />
with the expected payback in years.<br />
Then convert the agreed-upon ECMs into<br />
actionable design specications. For example,<br />
an ECM to achieve 0.12 W/sf lighting in the<br />
garage might be specied as “Use LED or T8<br />
xtures in the garage to achieve 0.12 W/sf<br />
lighting power density.”<br />
Finally, create an energy story writeup that can<br />
be included in the project’s sales documents.<br />
9. Complete your compliance modeling. At<br />
50% CDs or at the end of the construction<br />
drawings stage, use the project documents to<br />
complete the compliance modeling for the<br />
project to backcheck the strategy and determine<br />
if you have achieved the project energy goal.<br />
Once your SD energy modeling is complete,<br />
required modeling for the rest of the project<br />
should be a much simpler undertaking. In brief,<br />
the scope involves:<br />
DD level – Update the energy model and any<br />
hand calculations based on selected ECMs<br />
CD level – Build a full-edged energy model, complete<br />
compliance modeling and documentation<br />
Start/end of construction – Backcheck to correct<br />
for any changes in the design<br />
HOW ENERGY MODELING TO INCREASE<br />
VALUE WORKS IN A REAL PROJECT<br />
To see how this process works in the real world,<br />
let’s walk through a typical case—a<br />
42 JULY // AUGUST // 2015 CHICAGO ARCHITECT AIACHICAGO.ORG