Crime Scene Investigator PCR Basics⢠Kit
Crime Scene Investigator PCR Basics⢠Kit
Crime Scene Investigator PCR Basics⢠Kit

You also want an ePaper? Increase the reach of your titles
YUMPU automatically turns print PDFs into web optimized ePapers that Google loves.
<strong>Crime</strong> <strong>Scene</strong> <strong>Investigator</strong> <strong>PCR</strong> Basics <strong>Kit</strong><br />
This curriculum was developed in collaboration with Dr. Linda Strausbaugh, Director of the<br />
Center for Applied Genetics and Technology at the University of Connecticut-Storrs. This<br />
<strong>Crime</strong> <strong>Scene</strong> <strong>Investigator</strong> <strong>PCR</strong> Basics kit allows students to conduct state-of-the-art DNA profiling<br />
techniques and to develop an understanding of how these techniques are performed in<br />
real-world forensic science labs. Bio-Rad is grateful for Dr. Strausbaugh’s guidance and<br />
mentorship.<br />
How can DNA evidence solve crimes? DNA profiling is the use of molecular genetic methods<br />
to determine the exact genotype of a DNA sample to distinguish one human being from<br />
another. This powerful tool is now routinely used around the world for investigations of crime<br />
scenes, missing persons, mass disasters, human rights violations, and paternity testing.<br />
<strong>Crime</strong> scenes often contain biological evidence (such as blood, semen, hairs, saliva, bones,<br />
pieces of skin) from which DNA can be extracted. If the DNA profile obtained from evidence<br />
discovered at the scene of a crime matches the DNA profile of a suspect, the individual is<br />
included as a potentially guilty person; if the two DNA profiles do not match, the individual is<br />
excluded from the suspect pool.<br />
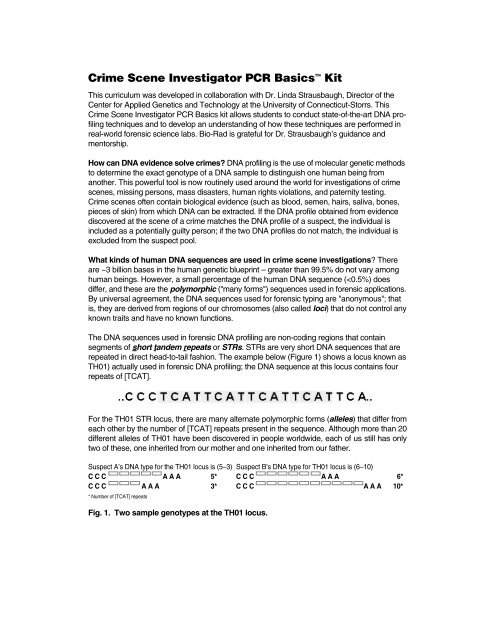
What kinds of human DNA sequences are used in crime scene investigations? There<br />
are ~3 billion bases in the human genetic blueprint – greater than 99.5% do not vary among<br />
human beings. However, a small percentage of the human DNA sequence (
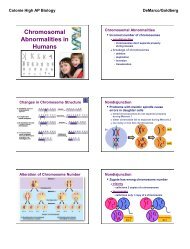
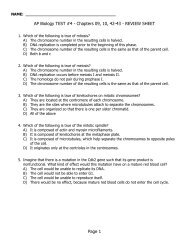
Two sample TH01 genotypes<br />
Suspect A’s DNA type for the TH01 locus is (5–3) Suspect B’s DNA type for TH01 locus is (6–10)<br />
C C C A A A 5* C C C A A A 6*<br />
C C C A A A 3* C C C A A A 10*<br />
* Number of [TCAT] repeats<br />
Fig. 2. Sample TH01 genotypes<br />
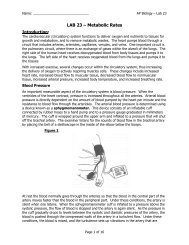
A schematic diagram of the results for TH01 typing for suspect A and suspect B is<br />
illustrated in Figure 3. In this example, <strong>PCR</strong> has been performed on DNA from the 2 suspects<br />
using primers specific for the TH01 locus. Following gel electrophoresis, the pattern of<br />
resulting bands are compared to the Allele Ladder to identify the alleles present in the<br />
samples.<br />
Fig. 3. Illustration of sample TH01 genotypes following gel electrophoresis.<br />
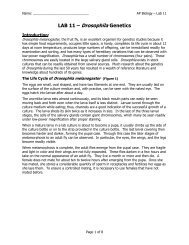
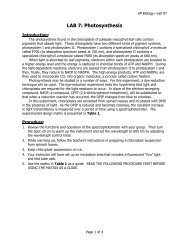
Now it just so happens that allele frequencies don't follow regular mathematical patterns.<br />
In fact, allele frequencies change according to the population under study. To illustrate this<br />
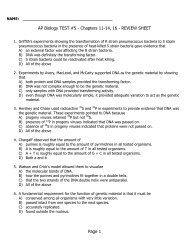
point, take a look at the following graph (Figure 4).<br />
9
% total population<br />
45<br />
40<br />
35<br />
30<br />
25<br />
20<br />
15<br />
10<br />
5<br />
0<br />
6 7 8 9 9.3 10<br />
TH01 alleles<br />
Caucasians (N=427)<br />
African American (N=414)<br />
Hispanics (N=414)<br />
Fig. 4. TH01 allele frequencies among different ethnic groups.<br />
According to the data at the TH01 locus, Caucasians are more likely to have either<br />
allele 6 or allele 9.3, but hardly ever have allele10. Similarly, most African Americans have<br />
allele 7 at this locus, but almost never have allele 10.<br />
Because of how chromosomes are inherited (described by Mendel's Law of<br />
Independent Assortment), the frequency of each allele can be multiplied together to give<br />
you a genotype frequency. First, let's look at the D3S1358 locus, another locus used in<br />
DNA profiling in addition to TH01. Let's say that at the D3S1358 locus suspect A has a<br />
copy of allele 16 (allele frequency = 0.253 for Caucasians) and a copy of allele 17 (allele<br />
frequency = 0.215 in Caucasians). At this locus, this particular combination of alleles is<br />
seen fairly frequently in Caucasians, and the allele frequency of this combination of alleles<br />
works out to 2 x (0.253) x (0.215) = 0.109, or about 1 out of every 10 Caucasians. If you<br />
were investigating this crime, and these particular genotypes were found at the crime<br />
scene, that's not very good news for your case! That means that many Caucasians could<br />
have been involved in the crime. The essential job of investigating a crime is ruling out, or<br />
excluding, suspects. How does DNA profiling make that happen?<br />
It does so by examining many different loci at the same time. Now, in addition to<br />
D3S1358, let's examine the TH01 locus. At the TH01 locus, suspect A has two copies of<br />
TH01 allele 10. For Caucasians, the allele frequency of a single copy of allele 10 is 0.008.<br />
For a Caucasian person with two copies of allele 10, the total allele frequency at the TH01<br />
locus is then (0.008) x (0.008) = 0.000064, which works out to 1 out of every approximately<br />
15,600 Caucasians. If you combine the TH01 allele frequency for this person with that of<br />
the D3S1358 allele frequency, that works out to a combine allele frequency of (0.109) x<br />
(0.000064) = 0.000007, or 1 out of every 150,000 or so Caucasians. So, the more loci you<br />
add to your analysis, the better the power of discrimination becomes. Or, put another way,<br />
the smaller your suspect pool becomes.<br />
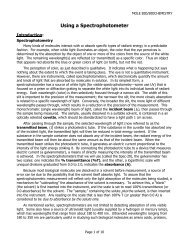
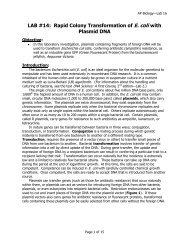
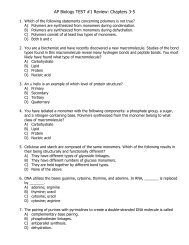
To think of this another way, examine figure 5, where you have a pool of 13 potential<br />
suspects (stars) implicated in a crime. Using STR analysis, you discover that 6 of the<br />
potential suspects have the THO1 genotype of 6-3, which is a genotype found at the scene<br />
of the crime. The other 7 samples have a different genotype at the TH01 locus. So, in the<br />
10
analysis of this one allele, you were able to exclude 7 suspects. However, you still have<br />
6 possible suspects. Were they all present at the scene of the crime? To answer this<br />
question, you also analyze the D3S1358 locus. Here, you find that 7 suspects have the<br />
D3S1358 genotype 16-17, a genotype which is also present at the crime scene. Of those<br />
7 suspects, 4 of them also have a TH01 genotype of 6-3. By combining these two genotypes,<br />
you can exclude 2 more suspects, and increase your power of discrimination. To be able to<br />
tell if all 4 of the remaining suspects were present at the crime scene, you also look at the<br />
FGA locus, and discover that the 21-23 genotype is found at the crime scene. In your pool<br />
of suspects, 7 people have that genotype at that locus. However, when combined with the<br />
results from the TH01 allele and the D3S1358 allele, you find that only one of your<br />
13 suspects has the same genotype as was found at the crime scene. Now, after analyzing<br />
3 different loci, you can exclude all but one of your suspects.<br />
Fig. 5. The Power of Discrimination increases as the number of loci tested increases.<br />
As illustrated in these examples, the power of discrimination changes depending on the<br />
loci and the ethnicity of the samples involved in an investigation. This phenomenon presents<br />
special challenges for any investigation! This topic is addressed in more detail in<br />
Appendices B and C.<br />
11
Imagine the following scenario:<br />
<strong>Scene</strong>: The Highway Motel, #1 Dark Highway, Nowhere<br />
Setting: Room #13.<br />
The motel manager hears loud voices, a woman screams, and a shot rings out. The<br />
manager runs to the window in time to see the receding lights of a car leaving in a hurry. The<br />
door to room # 13 hangs open. The manager runs to the open door, to see a man lying face<br />
down in a pool of blood. He calls 911. The police arrive, and begin to examine the crime<br />
scene. An apparent homicide, but with no obvious clues as to who committed the crime.<br />
Or…?<br />
A forensic specialist is called in to examine the crime scene and collect evidence. Even<br />
though it looks like the people involved left no evidence behind, the specialist can use<br />
laboratory tests that can tell who was at the crime scene from a single drop of blood or a<br />
lone hair. Is this a science fiction story, or reality?<br />
Very much a reality. Testing is routinely done in forensic testing labs across the US and<br />
in many other parts of the world from only a single cell, and sometimes from samples that<br />
are decades old. The reason this is possible is because of DNA. To be able to perform<br />
laboratory tests, the specialist needs biological material to work with. Often, there is very little<br />
material left at the scene of a crime, and not in quantities that will allow analysis. To get<br />
around this problem, the specialist takes advantage of a process that each and every cell in<br />
your body uses to divide.<br />
The most important part of any cell's life is when it commits to reproducing itself and<br />
dividing. The basic result of any cell division is the creation of two identical daughter cells<br />
from one original cell. To ensure that this happens, DNA replication must have a high degree<br />
of specificity and accuracy, that is, it must copy DNA exactly. To do so, the enzymes<br />
involved in DNA replication use the information already contained in the existing strands to<br />
make new DNA copies. This basic idea - the exact copying of DNA from a template - is the<br />
basis for a new technology that has revolutionized many areas of science, medicine, and the<br />
courts.<br />
<strong>PCR</strong> allows the forensic specialist to specifically amplify, or copy, any region of DNA that<br />
he or she is interested in. <strong>PCR</strong> is the basis for DNA testing that is currently used in nearly all<br />
forensic analysis.<br />
In this experiment, you will perform <strong>PCR</strong> analysis on a single locus, the BXP007 locus,<br />
using template DNAs obtained from a simulated crime scene and a victim. Following <strong>PCR</strong>,<br />
you will run an agarose gel to separate the <strong>PCR</strong> products, visualize the <strong>PCR</strong> products,<br />
compare them to a simulated ladder of possible alleles for this locus, and assign a genotype<br />
for the templates. You will then look to see if any of the suspects' genotype match the crime<br />
scene, and see whether you can determine whodunit!<br />
Let's examine the DNA evidence and find out who pulled the trigger.<br />
33
Student Questions – Introduction<br />
1. What kinds of materials obtained from a crime scene might contain DNA?<br />
2. Why do you need to perform <strong>PCR</strong> on DNA obtained from a <strong>Crime</strong> <strong>Scene</strong>?<br />
3. What might you see if you ran a DNA sample extracted from evidence on a gel before<br />
<strong>PCR</strong>?<br />
4. What is a genotype?<br />
5. What is the difference between an allele and a locus?<br />
6. Why do forensic labs analyse non-coding DNA and not genes?<br />
34
Lesson 1 <strong>PCR</strong> Amplification<br />
<strong>PCR</strong> amplification is DNA replication in a test tube. The portion of the DNA you want to<br />
make copies of is called the target sequence. The sample of DNA obtained at a crime<br />
scene and the suspect's DNA samples contain the target sequence.<br />
<strong>PCR</strong> relies on three principles of molecular biology<br />
1. Denaturation - melting double stranded DNA template into single stands<br />
2. Annealing - complementary DNA strand hybridization via DNA primers<br />
3. Extension - DNA strand synthesis via DNA polymerase<br />
Denaturation. Before new DNA synthesis can begin the double stranded DNA template<br />
must be unwound and separated into single strands. In cells this is carried out by a family<br />
of enzymes. In <strong>PCR</strong>, heat is used to melt apart – or denature – the double stranded DNA<br />
template.<br />
Annealing. Before a target region of DNA can be amplified, one must determine short<br />
sequences of DNA upstream (at the 5' end) and downstream (at the 3' end) of the target<br />
loci region of interest. These areas are then used to make short pieces of DNA, called<br />
primers or oligonucleotides, which are complementary to regions upstream and downstream<br />
of the target loci region (Figure 11). Primers serve as start and stop points for amplifying<br />
the target region of the DNA to be copied.<br />
Fig. 11. Primers annealed to a target DNA sequence during <strong>PCR</strong>.<br />
In <strong>PCR</strong>, complementary strand hybridization takes place when oligonucleotide primers<br />
anneal, or bind, to their respective complementary base pair sequences on the template.<br />
Hybridization is the process that describes the binding of the oligonucleotide primer to the<br />
template DNA. The two strands anneal to each other, forming a 'hybrid'. Like bookends, the<br />
two primers are designed and synthesized in the laboratory with a specific sequence of<br />
nucleotides so they will anneal at the opposite ends and on the opposite strands bracketing<br />
the target stretch of double-stranded DNA (template strand) to be amplified. Therefore, the<br />
target sequence is determined by the location that the primers anneal to.<br />
Extension. Primers are needed because the DNA polymerase requires an already<br />
existing nucleotide chain to bind and add nucleotides to one at a time. Once the<br />
polymerase locates and binds to template DNA and the primer, it initiates the addition of<br />
nucleotides and synthesizes new copies of the double stranded template DNA by adding<br />
nucleotides onto the primer and extending it. Therefore, primers provide a starting point for<br />
the DNA polymerase.<br />
These 3 steps – denaturation, annealing, and extension together make up one <strong>PCR</strong><br />
cycle. A complete <strong>PCR</strong> reaction involves many repetitious of a single <strong>PCR</strong> cycle. In this<br />
experiment, your <strong>PCR</strong> reactions will cycle 35 times.<br />
35
The enzyme used in <strong>PCR</strong> – DNA polymerase – must be thermally stable because<br />
<strong>PCR</strong> cycles between temperatures of 52°C and 94°C. The thermostable DNA polymerase<br />
that performs the polymerization was isolated from a thermophilic bacterium, Thermus<br />
aquaticus (Taq), which lives in high-temperature steam vents such as those found in<br />
Yellowstone National Park.<br />
Two template strands are created from the original template after each complete cycle<br />
of the strand synthesis reaction – denaturation, annealing, and extension. It is called the<br />
polymerase chain reaction because exponential growth of the number of template<br />
molecules occurs after each cycle is complete, i.e., the number of DNA copies doubles at<br />
each cycle. Therefore, after 35 cycles there will be 2 35 times more copies than at the<br />
beginning. After 35 cycles, the DNA of interest has been amplified sufficiently to be visualized<br />
using gel electrophoresis and DNA stains. This allows researchers to determine the presence<br />
or absence of the desired <strong>PCR</strong> products.<br />
In order for <strong>PCR</strong> to happen efficiently, several components are needed. In addition to<br />
the template, the oligonucleotide primers, and the enzyme (Taq DNA polymerase), a special<br />
reaction buffer is also required, called a master mix. The master mix contains all of the<br />
components for <strong>PCR</strong> to occur, including the individual building blocks of DNA (nucleotides,<br />
or dNTPs), a special buffer to maintain optimum pH, salts, and MgCl 2<br />
. Salts and magnesium<br />
ions (also known as cofactors) are needed for the Taq DNA polymerase to perform optimally.<br />
In this experiment, your instructor will provide you with a master mix that comes prepared<br />
with all of the ingredients listed above, but also includes colored primers and Taq polymerase<br />
mixed in. For this reason, it's important to keep the master mix cold before use, so that the<br />
enzyme doesn't start to work before you add your DNA templates.<br />
In this part of the experiment, you will obtain DNA samples which have been collected<br />
from a crime scene and four individuals suspected of being involved in the crime. Your task<br />
is to amplify the region of interest (the BXP007 locus, a polymorphic allele) from the DNA<br />
samples. Once complete, you will analyze your <strong>PCR</strong> products using gel electrophoresis to<br />
determine the genotypes of the samples at the BXP007 locus and match the crime scene<br />
DNA to one of the suspects.<br />
36
Student Questions: Lesson 1<br />
<strong>PCR</strong> Student Questions<br />
1. What does <strong>PCR</strong> allow you to do with DNA?<br />
2. What components do you need to perform <strong>PCR</strong>?<br />
3. What is in the master mix and why do you need each component?<br />
4. Why do you need to perform <strong>PCR</strong> on DNA evidence from a crime scene?<br />
5. What steps make up a <strong>PCR</strong> cycle, and what happens at each step?<br />
37
Student Protocol – Lesson One<br />
Student Workstations<br />
Material<br />
Quantity<br />
Ice bath containing tubes of DNA (as below) 1<br />
Master Mix + primers (MMP, blue liquid) 1<br />
<strong>Crime</strong> <strong>Scene</strong> and Suspect A - D DNAs<br />
5 (one of each tube indicated)<br />
<strong>PCR</strong> tubes 5<br />
<strong>PCR</strong> adaptors 5<br />
Marking pen 1<br />
2–20 µl adjustable micropipet or fixed volume 20 µl micropipet 1<br />
2–20 µl pipet tips, aerosol barrier 1 rack<br />
1. You will have 6 tubes on ice, and 5 x 0.2 ml <strong>PCR</strong> tubes in a rack at your workstation.<br />
In the ice, you should have -<br />
One yellow tube labeled MMP containing blue liquid.<br />
5 tubes labeled CS (purple tube), A (green tube), B (blue tube), C (orange tube), and D<br />
(pink tube).<br />
Label <strong>PCR</strong> tubes CS, A, B, C, and D and include your group name or initials as well.<br />
The labels correspond to the following tube contents:<br />
Master mix + primers<br />
<strong>PCR</strong> tubes labelled DNA templates (blue liquid)<br />
CS + your initials 20 µl <strong>Crime</strong> <strong>Scene</strong> DNA (purple tube) 20 µl MMP (yellow tube)<br />
A + your initials 20 µl Suspect A DNA (green tube) 20 µl MMP (yellow tube)<br />
B + your initials 20 µl Suspect B DNA (blue tube) 20 µl MMP (yellow tube)<br />
C + your initials 20 µl Suspect C DNA (orange tube) 20 µl MMP (yellow tube)<br />
D + your initials 20 µl Suspect D DNA (pink tube) 20 µl MMP (yellow tube)<br />
<strong>PCR</strong> tube<br />
2. Keep tubes on ice during the procedure.<br />
Capless<br />
tube<br />
3. Using aerosol barrier pipet tips and either an adjustable micropipet set to 20 µl, or a<br />
fixed-volume 20 µl micropipet, add 20 µl DNA to each tube as indicated in the table<br />
above. For example, for the <strong>Crime</strong> <strong>Scene</strong> DNA, transfer 20 µl of the template into your<br />
'CS' labeled <strong>PCR</strong> tube. Important: use a fresh pipet tip for each DNA.<br />
4. Using aerosol barrier pipet tips and either an adjustable micropipet set to 20 µl, or a<br />
fixed-volume 20 µl micropipet, add 20 µl of the Master Mix + primers to each tube as<br />
indicated in the table above. Mix the contents of your <strong>PCR</strong> tubes by gently pipetting up<br />
and down. Important: use a fresh pipet tip each time. Once you’ve added MMP to a<br />
tube, close the cap. The solution in your <strong>PCR</strong> tubes should be blue. If it’s not blue, talk<br />
to your instructor.<br />
38
Master mix + primers (MMP)<br />
5. Place your capped <strong>PCR</strong> tubes in their adaptors on ice.<br />
6. When instructed to do so, place your tubes in the thermal cycler.<br />
39
Lesson Two Electrophoresis of <strong>PCR</strong> Products<br />
You have completed your <strong>PCR</strong> amplification. However, at this point, you can't actually<br />
tell whether or not you have <strong>PCR</strong> products. To do this, you must sort your <strong>PCR</strong> products<br />
using gel electrophoresis and then visualize them using a DNA stain. Since DNA is negatively<br />
charged, it can be separated using an electric current. In fact, electrophoresis means "carry<br />
with current". In agarose gel electrophoresis, DNA is placed in solidified agarose, which<br />
forms sieves containing pores that vary in size depending on the concentration of the<br />
agarose. The higher the concentration of agarose, the smaller the pore size, and the longer<br />
it takes for larger molecules to move through. This is particularly useful when you want to<br />
compare DNA molecules of different sizes contained in the same sample. Movement<br />
through the gel occurs when an electric current is applied across the gel. Since the gel is<br />
immersed in buffer, the current will travel through the buffer and gel, carrying the negatively<br />
charged DNA with it toward the positive anode.<br />
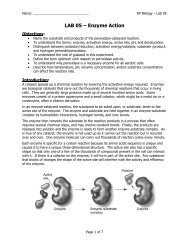
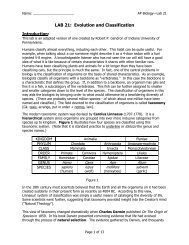
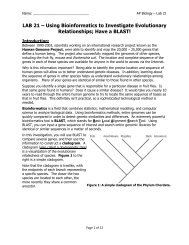
In addition to your <strong>PCR</strong> products, you will also be running a DNA Allele Ladder that<br />
represents all of the possible alleles at the BXP007 locus. This is a reference, or marker,<br />
that you can compare your <strong>PCR</strong> reactions to so you can judge their relative sizes and their<br />
identities. In the following drawing of a gel, the samples, or bands, seen in the first track, or<br />
lane, all come from the BXP007 Allele Ladder. These are the standard sizes of all the alleles<br />
know to occur at this locus. There are 8 possible alleles, with the largest at the top of the<br />
gel and the smallest at the bottom. The sizes are, from top to bottom, 1500, 1000, 700,<br />
500, 400, 300, 200, and 100 base pairs (bps). Allele names are indicated in the figure. In<br />
the next several lanes, we see <strong>PCR</strong> products that come from DNA samples that have been<br />
tested for what alleles they carry at this particular locus. As shown in figure 12, the sample<br />
in the lane next to the Allele Ladder, the <strong>Crime</strong> <strong>Scene</strong> Sample (CS) has a genotype that<br />
corresponds to alleles 5 and 2 on the allele ladder. We would say that the genotype for this<br />
sample is 5-2. For the next sample, the genotype would be 7-4, and so on.<br />
Fig. 12. A cartoon of potential <strong>Crime</strong> <strong>Scene</strong> <strong>Investigator</strong> <strong>PCR</strong> Basics kit results at the BXP007 locus.<br />
40
Student Questions – Lesson Two<br />
1. Why does DNA move through an agarose gel?<br />
2. What are the two techniques used to create a DNA profile in this experiment? What<br />
function does each perform?<br />
3. What is an Allele Ladder? What is its function in DNA profiling?<br />
4. What is required to visualize DNA following electrophoresis?<br />
41
Student Protocol – Lesson Two<br />
Student Workstation<br />
Material<br />
Quantity<br />
3% agarose gel 1<br />
<strong>PCR</strong> Samples from previous lab 5<br />
1X TAE running buffer<br />
300–350 ml<br />
Orange G loading dye (LD; orange liquid) 60 µl<br />
<strong>Crime</strong> <strong>Scene</strong> <strong>Investigator</strong> Allele Ladder (orange liquid) 25 µl<br />
Note: Do not confuse these two tubes of orange liquid.<br />
They contain different compounds.<br />
2–20 µl adjustable volume pipet or fixed volume 20 µl micropipet 1<br />
1–20 µl pipet tips, aerosol barrier 1 rack<br />
Gel electrophoresis chamber (may be shared by 2 workstations) 1<br />
Power supply (may be shared by multiple workstations) 1<br />
Fast Blast DNA stain (at common workstation) 1<br />
Gel staining tray 1<br />
Protocol<br />
1. Set up your gel electrophoresis apparatus as instructed.<br />
2. Obtain your 5 <strong>PCR</strong> reactions from the previous lesson, place them into a capless tube<br />
adaptor and into a rack.<br />
3. Using aerosol barrier pipet tips and either an adjustable micropipet set to 10 µl, or a<br />
fixed-volume 10 µl micropipet, add 10 µl of Orange G loading dye (from the tube<br />
labeled 'LD') to each <strong>PCR</strong> reaction tube and mix well. Important: use a fresh tip each<br />
time.<br />
4. Using the table below as a guide, load 20 µl of the allele ladder and 20 µl each sample<br />
into your gel in the order indicated below.<br />
Lane Sample Load volume<br />
1 Allele Ladder 20 µl<br />
2 <strong>Crime</strong> <strong>Scene</strong> 20 µl<br />
3 Suspect A 20 µl<br />
4 Suspect B 20 µl<br />
5 Suspect C 20 µl<br />
6 Suspect D 20 µl<br />
5. Run your gel at 100 V for 30 minutes. Do not let the orange dye front migrate out of the<br />
gel.<br />
42
6. Stain in Fast Blast DNA stain as directed by your instructor and described below.<br />
–<br />
+<br />
Staining of Agarose Gels<br />
1. When electrophoresis is complete, turn off the power and remove the lid from the gel<br />
box. Carefully remove the gel tray and the gel from the gel box. Be careful, the gel is<br />
very slippery. Nudge the gel off the gel tray with your thumb and carefully slide it into a<br />
container for staining.<br />
2. There are two protocols for staining your gel. Your instructor will inform you which one<br />
you will use.<br />
Protocol 1: Overnight staining (Recommended)<br />
a. Add 120 ml of 1x Fast Blast DNA stain to your staining tray (2 gels per tray).<br />
b. Let the gels stain for approximately 4–24 hours with gentle shaking for best results. No<br />
destaining is required.<br />
c. The next day, pour off the stain into a waste beaker.<br />
d. Place the gel on a light background and record your result. With a permanent marker,<br />
trace the wells and band patterns onto a clear sheet of plastic or acetate sheet.<br />
43
f. Trim away any empty lanes of the gel with a knife or razor blade.<br />
g. To obtain a permanent record, air-dry the gel between cellophane sheets (your<br />
instructor will show you how). Tape the dried gel into your lab notebook. Avoid exposure<br />
of the stained gel to direct light, since it will cause the bands to fade.<br />
Protocol 2: Quick staining (requires approximately 20 minutes) – This method will<br />
allow you to see bands quickly (within 15 minutes), but may require extensive destaining to<br />
obtain optimal band-to-background intensity. Note: it is important to use warm tap water for<br />
the destaining steps of this protocol.<br />
a. Immerse your gel in 100x Fast Blast.<br />
b. Stain the gel for 5 minutes with gentle agitation. Save the used stain for future use.<br />
Stain can be reused at least 7 times.<br />
c. Transfer the gels into a large washing container and rinse with warm (40–55°) tap<br />
water for approximately 10 seconds.<br />
d. Destain by washing three times in warm tap water for 5 minutes each, with gentle<br />
shaking for best results. You should be able to see bands after 10 minutes with light<br />
coming up through the bottom of the staining tray. If necessary, keep destaining in<br />
warm water until the desired contrast is reached.<br />
44
e. Place the gel on a light background and record your result. With a permanent marker,<br />
trace the wells and band patterns onto a clear sheet of plastic or acetate sheet.<br />
g. Trim away any empty lanes of the gel with a knife or razor blade.<br />
h. To obtain a permanent record, air-dry the gel on cellophane sheets (your instructor will<br />
show you how). Tape the dried gel onto your lab notebook. Avoid exposure of the<br />
stained gel to direct light, since it will cause the bands to fade.<br />
45
Procedure<br />
Step 1:<br />
Step 2:<br />
Step 3:<br />
Step 4:<br />
Step 5:<br />
Wet two pieces of cellophane in a large volume of water, approximately 500 ml.<br />
Place one sheet of cellophane over a plastic container. Pull the cellophane taut<br />
so that it makes a flat surface over the top of the container, and use a rubber<br />
band to secure the sheet in place.<br />
Place a gel onto the cellophane. Remove any air bubbles that are under or<br />
around the gel. Flooding the surface of the cellophane around the gel with water<br />
will aid in the removal of bubbles.<br />
Place the second sheet of wetted cellophane over the gel, being careful not to<br />
trap any bubbles. Secure the second sheet of cellophane to the box with a second<br />
rubber band.<br />
Allow gel to dry for several days in a well-ventilated area.<br />
Analysis of results<br />
Although it is possible to analyze the dried gels, be aware that higher percentage<br />
agarose gels may be difficult to dry flat. In addition, exposure of the stained gel to light will<br />
cause the stain to fade. It is therefore recommended that analysis and determination of<br />
genotypes be done on wet gels.<br />
Once the gels have been stained with Fast Blast DNA stain, it is time to determine the<br />
alleles present in each sample, and assign a DNA profile (genotype). For each <strong>PCR</strong><br />
reaction, compare the bands obtained in each lane to the Allele Ladder run in lane #1. See<br />
page 40 for representative results, sizes of the ladder bands, and labeling of the alleles in<br />
the ladder. Assign each band in each <strong>PCR</strong> reaction with an allele assignment according to<br />
the band of corresponding size in the allele ladder. The bands in the allele ladder are<br />
numbered from top to bottom starting with the largest allele, #15, at the top. The sizes of<br />
the bands are indicated in the table below. In the example shown in figure 8 (page 26), the<br />
allele assignment for the sample in lane 2 is 3-7, since there is one allele 7 and one allele 3<br />
in that lane. Write down the genotype for each of your samples in the chart below.<br />
Number of What BXP007 alleles<br />
Lane Sample Bands? are present?<br />
1 BXP007 Allele Ladder<br />
2 <strong>Crime</strong> <strong>Scene</strong> DNA<br />
3 Suspect A DNA<br />
4 Suspect B DNA<br />
5 Suspect C DNA<br />
6 Suspect D DNA<br />
47
1. Did your samples all generate <strong>PCR</strong> products? If not, give reasons to explain why.<br />
2. What is the genotype of each of your samples?<br />
3. Does the <strong>Crime</strong> <strong>Scene</strong> DNA sample have a genotype that matches any of the suspects?<br />
If so, which one matches?<br />
4. What does this result tell you about which suspects are included in the investigation?<br />
excluded? Explain your answer.<br />
5. Imagine that each allele at the BXP007 locus is found at exactly the same frequency in<br />
a population. Since there are 8 possible alleles at the BXP007 locus, what is the<br />
frequency of any one allele from this locus in this population?<br />
6. Given Mendel's Law of Independent Assortment and the assumption above, what is the<br />
frequency of the genotype of the <strong>Crime</strong> <strong>Scene</strong> sample?<br />
7. If you had a pool of 13 suspects, and only one suspect had a genotype that matched<br />
the BXP007 locus found at the crime scene, would you be satisfied that you had<br />
identified the perpetrator based only on the genotype frequency calculated for the<br />
BXP007 locus? Why or why not? Explain your answer.<br />
48
Appendix A<br />
DNA and <strong>PCR</strong> in detail<br />
DNA: A Detailed Look<br />
A DNA molecule is a long polymer consisting of four different components called<br />
nucleotides. It is the various combinations of these four bases or nucleotides that create a<br />
unique DNA code or sequence (also genotype, gene, and allele).<br />
Nucleotides are comprised of three different components:<br />
• Nitrogen base<br />
• Deoxyribose sugar<br />
• Phosphate group<br />
Each nucleotide contains the same ribose sugar and the phosphate group. What<br />
makes each nucleotide unique is its nitrogen base. There are four nitrogen bases:<br />
Adenine (A)<br />
Thymine (T)<br />
Guanine (G)<br />
Cytosine (C)<br />
A DNA nucleotide chain is created by the connection of the phosphate group to the<br />
ribose sugar of the next nucleotide. This connection creates the “backbone” of the DNA<br />
molecule. To designate the different ends of this single-stranded chain, biochemistry<br />
terminology is used, in which the carbons on any sugar group are numbered. The sugar of<br />
a nucleotide contains 5 carbons. The phosphate group (PO 4<br />
) of a given nucleotide is connected<br />
to the 5' carbon of the sugar. A hydroxyl group (OH) is attached to the 3' carbon of the<br />
sugar, and this 3' OH group connects to the phosphate group of the next nucleotide in the<br />
chain.<br />
Thus, the end of a single-strand DNA molecule that has a free phosphate group (i.e.,<br />
not attached to another nucleotide) is called the 5' end, and the end of the DNA molecule<br />
with a free hydroxyl group (with no subsequent nucleotide attached) is called the 3' end<br />
(see Figures 13 and 14).<br />
It has become standard that a single-stranded DNA molecule is written with the 5' end<br />
on the left and the 3' end on the right. Therefore, a single-stranded DNA chain's sequence<br />
is represented from left to right, starting on the left with the 5' nucleotide and moving to the<br />
right until the 3' nucleotide is last. Most DNA sequences are read 5' to 3'.<br />
5’-phosphate<br />
O<br />
O<br />
CH 3<br />
P O<br />
O<br />
Nitrogen<br />
base<br />
CH 2<br />
O<br />
Ribose<br />
sugar<br />
N<br />
O<br />
O<br />
N<br />
H<br />
OH<br />
3’-hydroxyl<br />
Fig. 13. Structure of one nucleotide of deoxyribonucleic acid.<br />
49
The long DNA molecules or chains that comprise the chromosomes are not singlestranded<br />
molecules. From X-ray crystallography patterns of DNA generated by Rosalind<br />
Franklin, and some imaginative molecular model building, Watson and Crick deduced that<br />
DNA is in fact a double-stranded molecule with the two single strands of DNA held<br />
together by hydrogen bonds between the nitrogen bases (A, T, G, and C). This<br />
double-stranded molecule is often called a duplex (Figures 14 and 15). There are several<br />
important properties of double-stranded DNA molecules:<br />
• Chromosomal (also called genomic) DNA is double-stranded<br />
• The overall structure is that of a helix with two strands intertwined<br />
• The structure can be viewed as a twisted ladder<br />
• The phosphate-deoxyribose backbones are the sides of the ladder<br />
• The nitrogen bases (A, T, G, and C) hydrogen bonded to each other are the rungs<br />
• Only the nitrogen bases A & T and C & G can form hydrogen bonds to each other.<br />
When A binds to T or C binds to G this is considered base pairing. Neither C and T,<br />
nor A and G form hydrogen bonds<br />
• The two strands are antiparallel; that is, the strands are oriented in opposite directions.<br />
This means that the ladder runs 5' to 3' in one direction for one strand and 5' to 3' in the<br />
opposite direction for the other strand<br />
5'-phosphate<br />
O<br />
O<br />
O<br />
P<br />
O<br />
CH 3<br />
O<br />
N<br />
H<br />
H<br />
N<br />
N<br />
H<br />
N<br />
N<br />
3'-hydroxyl<br />
OH<br />
Thymine<br />
Cytosine<br />
Guanine<br />
Adenine<br />
CH 2<br />
O<br />
N<br />
CH 2<br />
H<br />
O<br />
O<br />
N H O<br />
N<br />
CH O<br />
2<br />
N<br />
O<br />
N<br />
O P O<br />
O<br />
O<br />
N<br />
H N<br />
N O P O<br />
CH O<br />
2<br />
N<br />
N<br />
O<br />
O<br />
H N<br />
H<br />
O<br />
O<br />
N<br />
O<br />
H N<br />
CH 2<br />
O P O<br />
O<br />
O<br />
N<br />
N H H<br />
O P O<br />
CH O<br />
2<br />
N<br />
O<br />
N<br />
N H<br />
O<br />
H<br />
H<br />
O<br />
O<br />
N<br />
N H<br />
O CH 3<br />
CH 2<br />
O P O<br />
O<br />
O<br />
N<br />
N H N<br />
O P O<br />
O<br />
O<br />
3'-hydroxyl<br />
Phosphate-deoxyribose<br />
backbone<br />
Fig. 14. Molecular structure of a portion of a double-stranded DNA molecule.<br />
O<br />
Hydrogen-bonded<br />
base pairs<br />
50<br />
N<br />
O<br />
O<br />
P<br />
O<br />
O<br />
CH 2<br />
5'-phosphate<br />
O<br />
Phosphate-deoxyribose<br />
backbone<br />
Adenine<br />
Guanine<br />
Cytosine<br />
Thymine
DNA Structure Conclusions<br />
• Because A only binds to T, and G only binds to C, the two strands will have exactly the<br />
opposite, or complementary, sequence running in opposite directions (one strand 5' to<br />
3' in one direction, the other 5' to 3' in the other direction).<br />
• These two complementary strands anneal or hybridize to each other through hydrogen<br />
bonds between the bases.<br />
• A new strand of DNA can be synthesized using its complementary strand as the template<br />
for new synthesis.<br />
• Each strand carries the potential to deliver and code for information.<br />
The length of any double-stranded DNA molecule is given in terms of base pairs (bp). If<br />
a DNA strand contains over a thousand base pairs, the unit of measure is kilobases (1 kb =<br />
1,000 bp). If there are over one million base pairs in a strand the unit of measure is<br />
megabases (1 Mb = 1,000 kb).<br />
Least detail<br />
Most detail<br />
Fig. 15. DNA (deoxyribonucleic acid) — A long chainlike molecule that stores genetic information. DNA is<br />
graphically represented in a number of different ways, depending on the amount of detail desired.<br />
DNA Replication — Strand Synthesis<br />
New strands are synthesized by enzymes called DNA polymerases. New strands are<br />
always synthesized in the 5' to 3' direction. For a new strand of DNA to be synthesized,<br />
another single strand is necessary. The single strand of DNA that will be used to synthesize<br />
its complementary strand is called the template strand.<br />
In order for DNA polymerase to start synthesizing a new complementary strand, a short<br />
stretch of nucleotides (approximately 20 base pairs long) called a primer (sometimes also<br />
called an oligonucleotide, for "few nucleotides") must be present for the polymerase to start<br />
the reaction. This primer is complementary to the template where synthesis will begin. The<br />
primer must have a free 3' hydroxyl group (OH) for DNA polymerase to attach the 5'<br />
phosphate group of the next nucleotide.<br />
51
The DNA polymerase grabs free (single) nucleotides from the surrounding environment<br />
and joins the 5' phosphate of the new nucleotide to the 3' hydroxyl group (OH) of the new<br />
complementary strand. This 5' to 3' joining process creates the backbone of the new DNA<br />
strand.<br />
The newly synthesized strand maintains its complementarity with the template strand<br />
because the DNA polymerase only joins two nucleotides during new strand synthesis if the<br />
new nucleotide has its complement on the template strand. For example, the DNA<br />
polymerase will only join a G to the 3' end of the newly synthesized strand if there is the C<br />
counterpart on the template strand. Guanine will not be joined to the new strand if A, T, or<br />
G is the opposite nucleotide on the template strand.<br />
DNA polymerase and strand synthesis allow DNA to replicate during mitosis. Both new<br />
DNA strands are synthesized simultaneously from the two original DNA template strands<br />
during mitotic DNA replication.<br />
DNA, RNA, and proteins are closely tied to each other. DNA directs the expression of<br />
RNA, which directs the expression of proteins, which carry out most of the biological<br />
functions that make up an organism. Thus, you can begin to understand why researchers,<br />
in an attempt to understand the mechanisms behind the various life processes, must study<br />
nucleotides to get complete answers about the flow of information carried in the genetic<br />
code. In the last 20 years, many gains in the areas of nucleic acid techniques have finally<br />
allowed researchers the means to study the roles of nucleic acids in life processes.<br />
Individual discoveries by many scientists have contributed the pieces that have begun<br />
to solve one of the most mysterious puzzles of life — understanding the hereditary code. In<br />
1985, enough pieces of the puzzle were in place for a major breakthrough to occur. This<br />
understanding of how the necessary molecular components interact to faithfully replicate<br />
DNA within living cells led to the development of a technique for creating DNA in a test<br />
tube. This technique is called the polymerase chain reaction, or <strong>PCR</strong>.<br />
<strong>PCR</strong>: A closer look<br />
<strong>PCR</strong> Makes Use of Two Basic Processes in Molecular Genetics<br />
1. Complementary DNA strand hybridization<br />
2. DNA strand synthesis via DNA polymerase<br />
In <strong>PCR</strong>, complementary strand hybridization takes place when two different primers<br />
anneal to each of their respective complementary base pair sequences on the template.<br />
The two primers are designed and synthesized in the laboratory with a specific sequence of<br />
nucleotides such that they can anneal at the opposite ends and on the opposite strands of<br />
the stretch of double-stranded DNA (template strand) to be amplified.<br />
Before a region of DNA can be amplified, one must identify and determine the<br />
sequence of a piece of DNA upstream and downstream of the region of interest. These<br />
areas are then used to determine the sequence of oligonucleotide primers that will be<br />
synthesized and used as starting points for DNA replication. Primers are complementary to<br />
the up- and downstream regions of the sequence to be amplified, so they stick, or anneal,<br />
to those regions. Primers are needed because DNA polymerases can only add nucleotides<br />
to the end of a preexisting chain.<br />
The DNA polymerase used in <strong>PCR</strong> must be a thermally stable polymerase because the<br />
polymerase chain reaction cycles between temperatures of 52°C and 94°C. The thermostable<br />
DNA polymerase used in <strong>PCR</strong> was isolated from a thermophilic bacterium, Thermus<br />
aquaticus (Taq), which lives in high-temperature steam vents such as those found in<br />
Yellowstone National Park.<br />
52
Two new template strands are created from the original double-stranded template on<br />
each complete cycle of the strand synthesis reaction. This causes exponential growth of<br />
the number of template molecules, i.e., the number of DNA strands doubles at each cycle.<br />
Therefore, after 35 cycles there will be 3.4 x 10 10 , or over 30 billion, times more copies than<br />
at the beginning. Once the template has been sufficiently amplified, it can be visualized.<br />
This allows researchers to determine the presence or absence of the desired <strong>PCR</strong><br />
products and determine the similarities and differences between the DNA of individuals.<br />
Depending on the DNA sequence analyzed, differences among individuals can be as great<br />
as hundreds of base pairs or as small as a single base pair or single point mutation.<br />
<strong>PCR</strong> Step by Step<br />
<strong>PCR</strong> involves a repetitive series of cycles, each of which consists of template<br />
denaturation, primer annealing, and extension of the annealed primer by Taq DNA<br />
polymerase. Before beginning DNA amplification, template DNA is prepared from evidence.<br />
Following sample preparation, the template DNA, oligonucleotide primers, thermostable<br />
DNA polymerase (Taq), the four deoxynucleotides (A, T, G, C), and reaction buffer are<br />
mixed in a single micro test tube. The tube is placed into the thermal cycler. Thermal<br />
cyclers contain an aluminum block that holds the samples and can be rapidly heated and<br />
cooled across extreme temperature differences. The rapid heating and cooling of this<br />
thermal block is called temperature cycling or thermal cycling.<br />
The first step of the <strong>PCR</strong> temperature cycling procedure involves heating the sample to<br />
94°C. At this high temperature, the template strands separate (denature). This is called the<br />
denaturation step.<br />
The thermal cycler then rapidly cools to 52°C to allow the primers to anneal to the<br />
separated template strands. This is called the annealing step. The two original template<br />
strands may reanneal to each other or compete with the primers for the primers'<br />
complementary binding sites. However, the primers are added in excess such that the<br />
primers actually out-compete the original DNA strands for the primers' complementary<br />
binding sites.<br />
Lastly, the thermal cycler heats the sample to 72°C for Taq DNA polymerase to extend<br />
the primers and make complete copies of each template DNA strand. This is called the<br />
extension step. Taq polymerase works most efficiently at this temperature. Two new copies<br />
of each complementary strand are created. There are now two sets of double-stranded<br />
DNA (dsDNA). These two sets of dsDNA can now be used as templates for another cycle<br />
and subsequent strand synthesis.<br />
At this stage, a complete temperature cycle (thermal cycle) has been completed (Figure 16).<br />
Temperature cycle = denaturation step + annealing step + extension step<br />
53
5'<br />
3'<br />
3'<br />
5'<br />
Denature strands at 94°C<br />
5'<br />
3'<br />
3'<br />
Anneal primers at 52°C<br />
(Taq polymerase recognizes 3' ends<br />
of primers)<br />
5'<br />
5'<br />
Primer<br />
5'<br />
Taq polymerase<br />
5'<br />
3'<br />
Primer<br />
3'<br />
5'<br />
Extend at 72°C<br />
(Synthesize new strand)<br />
5'<br />
3'<br />
3'<br />
5'<br />
5'<br />
3'<br />
3'<br />
5'<br />
Repeat cycle 35 times<br />
Fig. 16. A complete cycle of <strong>PCR</strong>.<br />
Usually, thermal cycling continues for about 35 cycles. After each thermal cycle, the<br />
number of template strands doubles, resulting in an exponential increase in the number of<br />
template DNA strands. After 35 cycles there will be 3.4 x 10 10 more copies of the original<br />
number of template DNA molecules.<br />
<strong>PCR</strong> generates DNA of a precise length and sequence. On the first cycle, the two<br />
primers anneal to the original genomic template DNA strands at opposite ends and on<br />
opposite strands. After the first complete temperature cycle, two new strands are generated<br />
that are shorter than the original template strands but still longer than the length of the DNA<br />
that the researcher wants to amplify. It isn't until the third thermal cycle that fragments of<br />
the precise length are generated (Figure 17).<br />
54
C<br />
Y<br />
C<br />
L<br />
E<br />
1<br />
5'<br />
3'<br />
3'<br />
Extension step cycle 1<br />
Denature at 94°C<br />
5'<br />
3'<br />
3'<br />
5'<br />
C<br />
Y<br />
C<br />
L<br />
E<br />
2<br />
3'<br />
3'<br />
5'<br />
New intermediate templates<br />
5'<br />
5'<br />
3'<br />
Anneal primers at 52°C<br />
3'<br />
5'<br />
5'<br />
Extend new strands at 72°C<br />
5'<br />
3'<br />
3'<br />
5'<br />
3'<br />
5'<br />
5'<br />
3'<br />
5'<br />
3'<br />
3'<br />
Denature at 94°C<br />
3'<br />
5'<br />
Precise length fragments<br />
5' 3'<br />
C<br />
Y<br />
C<br />
L<br />
E<br />
3<br />
3'<br />
5'<br />
3'<br />
5'<br />
Anneal primers at 52°C<br />
Extend new strands at 72°C<br />
Total 35 cycles<br />
5'<br />
5'<br />
3'<br />
5'<br />
3'<br />
5'<br />
3'<br />
Fig. 17. Generation of precise-length fragments.<br />
It is the template strands of the precise length that are amplified exponentially (X n ,<br />
where X = the number of original template strands and n = the number of cycles). There is<br />
always one set of original long-template DNA molecules that are never fully duplicated.<br />
After each thermal cycle, two intermediate-length strands are produced, but because they<br />
can only be generated from the original template strands, the intermediate strands are not<br />
exponentially amplified. It is the precise-length strands generated from the intermediate<br />
strands that are amplified exponentially at each cycle. Therefore, if 20 thermal cycles were<br />
conducted from one double-stranded DNA molecule, there would be 1 set of original<br />
genomic template DNA strands, 20 sets of intermediate template strands, and 1,048,576<br />
sets of precise-length template strands (Figure 18). After 35 cycles, there would be 1 set of<br />
original genomic template DNA strands, 35 sets of intermediate template strands, and<br />
3.4 x 10 10 sets of precise-length template strands.<br />
55
Start Cycle 1 Cycle 2 Cycle 3 Cycle 4 Cycle 5 Cycle 6<br />
Final Count After 20 Cycles<br />
Template DNA<br />
Intermediate DNA<br />
Precise Length DNA<br />
1<br />
20<br />
1,048,576<br />
Fig. 18. Schematic of <strong>PCR</strong> amplification of DNA fragments.<br />
56