Crime Scene Investigator PCR Basics⢠Kit
Crime Scene Investigator PCR Basics⢠Kit
Crime Scene Investigator PCR Basics⢠Kit

Create successful ePaper yourself
Turn your PDF publications into a flip-book with our unique Google optimized e-Paper software.
Procedure<br />
Step 1:<br />
Step 2:<br />
Step 3:<br />
Step 4:<br />
Step 5:<br />
Wet two pieces of cellophane in a large volume of water, approximately 500 ml.<br />
Place one sheet of cellophane over a plastic container. Pull the cellophane taut<br />
so that it makes a flat surface over the top of the container, and use a rubber<br />
band to secure the sheet in place.<br />
Place a gel onto the cellophane. Remove any air bubbles that are under or<br />
around the gel. Flooding the surface of the cellophane around the gel with water<br />
will aid in the removal of bubbles.<br />
Place the second sheet of wetted cellophane over the gel, being careful not to<br />
trap any bubbles. Secure the second sheet of cellophane to the box with a second<br />
rubber band.<br />
Allow gel to dry for several days in a well-ventilated area.<br />
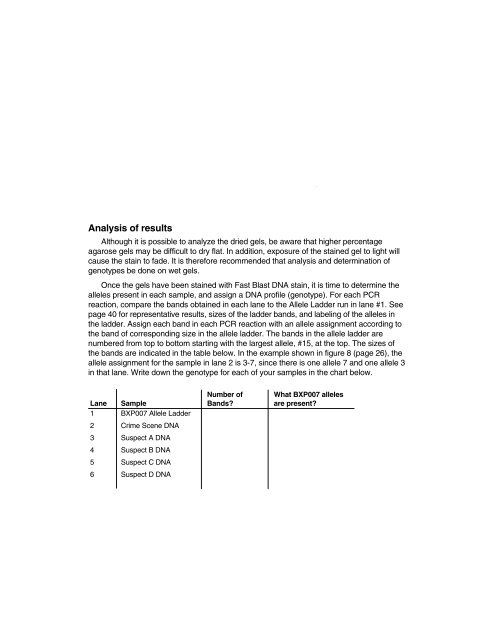
Analysis of results<br />
Although it is possible to analyze the dried gels, be aware that higher percentage<br />
agarose gels may be difficult to dry flat. In addition, exposure of the stained gel to light will<br />
cause the stain to fade. It is therefore recommended that analysis and determination of<br />
genotypes be done on wet gels.<br />
Once the gels have been stained with Fast Blast DNA stain, it is time to determine the<br />
alleles present in each sample, and assign a DNA profile (genotype). For each <strong>PCR</strong><br />
reaction, compare the bands obtained in each lane to the Allele Ladder run in lane #1. See<br />
page 40 for representative results, sizes of the ladder bands, and labeling of the alleles in<br />
the ladder. Assign each band in each <strong>PCR</strong> reaction with an allele assignment according to<br />
the band of corresponding size in the allele ladder. The bands in the allele ladder are<br />
numbered from top to bottom starting with the largest allele, #15, at the top. The sizes of<br />
the bands are indicated in the table below. In the example shown in figure 8 (page 26), the<br />
allele assignment for the sample in lane 2 is 3-7, since there is one allele 7 and one allele 3<br />
in that lane. Write down the genotype for each of your samples in the chart below.<br />
Number of What BXP007 alleles<br />
Lane Sample Bands? are present?<br />
1 BXP007 Allele Ladder<br />
2 <strong>Crime</strong> <strong>Scene</strong> DNA<br />
3 Suspect A DNA<br />
4 Suspect B DNA<br />
5 Suspect C DNA<br />
6 Suspect D DNA<br />
47