Crime Scene Investigator PCR Basics⢠Kit
Crime Scene Investigator PCR Basics⢠Kit
Crime Scene Investigator PCR Basics⢠Kit

Create successful ePaper yourself
Turn your PDF publications into a flip-book with our unique Google optimized e-Paper software.
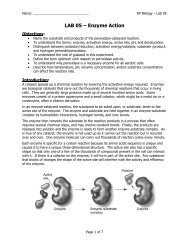
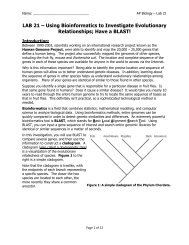
% total population<br />
45<br />
40<br />
35<br />
30<br />
25<br />
20<br />
15<br />
10<br />
5<br />
0<br />
6 7 8 9 9.3 10<br />
TH01 alleles<br />
Caucasians (N=427)<br />
African American (N=414)<br />
Hispanics (N=414)<br />
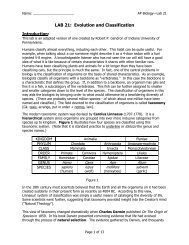
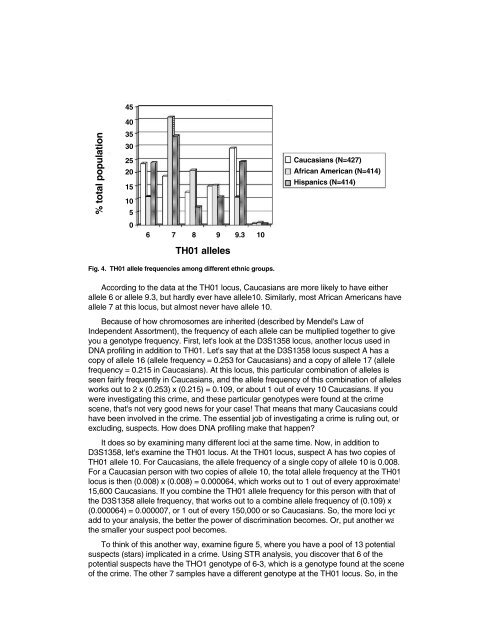
Fig. 4. TH01 allele frequencies among different ethnic groups.<br />
According to the data at the TH01 locus, Caucasians are more likely to have either<br />
allele 6 or allele 9.3, but hardly ever have allele10. Similarly, most African Americans have<br />
allele 7 at this locus, but almost never have allele 10.<br />
Because of how chromosomes are inherited (described by Mendel's Law of<br />
Independent Assortment), the frequency of each allele can be multiplied together to give<br />
you a genotype frequency. First, let's look at the D3S1358 locus, another locus used in<br />
DNA profiling in addition to TH01. Let's say that at the D3S1358 locus suspect A has a<br />
copy of allele 16 (allele frequency = 0.253 for Caucasians) and a copy of allele 17 (allele<br />
frequency = 0.215 in Caucasians). At this locus, this particular combination of alleles is<br />
seen fairly frequently in Caucasians, and the allele frequency of this combination of alleles<br />
works out to 2 x (0.253) x (0.215) = 0.109, or about 1 out of every 10 Caucasians. If you<br />
were investigating this crime, and these particular genotypes were found at the crime<br />
scene, that's not very good news for your case! That means that many Caucasians could<br />
have been involved in the crime. The essential job of investigating a crime is ruling out, or<br />
excluding, suspects. How does DNA profiling make that happen?<br />
It does so by examining many different loci at the same time. Now, in addition to<br />
D3S1358, let's examine the TH01 locus. At the TH01 locus, suspect A has two copies of<br />
TH01 allele 10. For Caucasians, the allele frequency of a single copy of allele 10 is 0.008.<br />
For a Caucasian person with two copies of allele 10, the total allele frequency at the TH01<br />
locus is then (0.008) x (0.008) = 0.000064, which works out to 1 out of every approximately<br />
15,600 Caucasians. If you combine the TH01 allele frequency for this person with that of<br />
the D3S1358 allele frequency, that works out to a combine allele frequency of (0.109) x<br />
(0.000064) = 0.000007, or 1 out of every 150,000 or so Caucasians. So, the more loci you<br />
add to your analysis, the better the power of discrimination becomes. Or, put another way,<br />
the smaller your suspect pool becomes.<br />
To think of this another way, examine figure 5, where you have a pool of 13 potential<br />
suspects (stars) implicated in a crime. Using STR analysis, you discover that 6 of the<br />
potential suspects have the THO1 genotype of 6-3, which is a genotype found at the scene<br />
of the crime. The other 7 samples have a different genotype at the TH01 locus. So, in the<br />
10