The Hotel Price Index™ - Expedia
The Hotel Price Index™ - Expedia
The Hotel Price Index™ - Expedia

You also want an ePaper? Increase the reach of your titles
YUMPU automatically turns print PDFs into web optimized ePapers that Google loves.
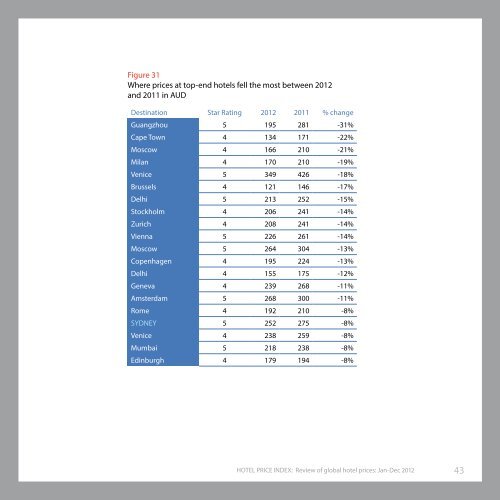
Figure 31<br />
Where prices at top-end hotels fell the most between 2012<br />
and 2011 in AUD<br />
Destination Star Rating 2012 2011 % change<br />
Guangzhou 5 195 281 -31%<br />
Cape Town 4 134 171 -22%<br />
Moscow 4 166 210 -21%<br />
Milan 4 170 210 -19%<br />
Venice 5 349 426 -18%<br />
Brussels 4 121 146 -17%<br />
Delhi 5 213 252 -15%<br />
Stockholm 4 206 241 -14%<br />
Zurich 4 208 241 -14%<br />
Vienna 5 226 261 -14%<br />
Moscow 5 264 304 -13%<br />
Copenhagen 4 195 224 -13%<br />
Delhi 4 155 175 -12%<br />
Geneva 4 239 268 -11%<br />
Amsterdam 5 268 300 -11%<br />
Rome 4 192 210 -8%<br />
SYDNEY 5 252 275 -8%<br />
Venice 4 238 259 -8%<br />
Mumbai 5 218 238 -8%<br />
Edinburgh 4 179 194 -8%<br />
HOTEL PRICE INDEX: Review of global hotel prices: Jan-Dec 2012<br />
43