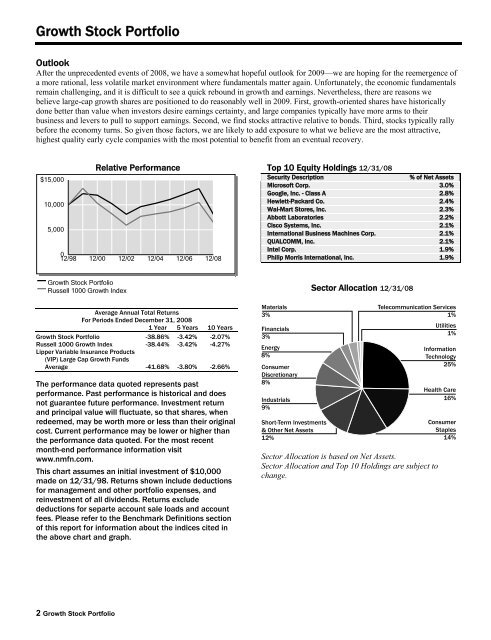
Growth Stock Portfolio Outlook After the unprecedented events of 2008, we have a somewhat hopeful outlook for 2009—we are hoping for the reemergence of a more rational, less volatile market environment where fundamentals matter again. Unfortunately, the economic fundamentals remain challenging, and it is difficult to see a quick rebound in growth and earnings. Nevertheless, there are reasons we believe large-cap growth shares are positioned to do reasonably well in 2009. First, growth-oriented shares have historically done better than value when investors desire earnings certainty, and large companies typically have more arms to their business and levers to pull to support earnings. Second, we find stocks attractive relative to bonds. Third, stocks typically rally before the economy turns. So given those factors, we are likely to add exposure to what we believe are the most attractive, highest quality early cycle companies with the most potential to benefit from an eventual recovery. Relative Performance $15,000 10,000 5,000 0 12/98 12/00 12/02 12/04 12/06 12/08 Top 10 Equity Holdings 12/31/08 Security Description % of Net Assets Microsoft Corp. 3.0% Google, Inc. - Class A 2.8% Hewlett-Packard Co. 2.4% Wal-Mart Stores, Inc. 2.3% Abbott Laboratories 2.2% Cisco Systems, Inc. 2.1% International Business Machines Corp. 2.1% QUALCOMM, Inc. 2.1% Intel Corp. 1.9% Philip Morris International, Inc. 1.9% Growth Stock Portfolio Russell 1000 Growth Index Average <strong>Annual</strong> Total Returns For Periods Ended December 31, 2008 1 Year 5 Years 10 Years Growth Stock Portfolio Russell 1000 Growth Index -38.86% -3.42% -38.44% -3.42% -2.07% -4.27% Lipper Variable Insurance Products (VIP) Large Cap Growth Funds Average -41.68% -3.80% -2.66% The performance data quoted represents past performance. Past performance is historical and does not guarantee future performance. Investment return and principal value will fluctuate, so that shares, when redeemed, may be worth more or less than their original cost. Current performance may be lower or higher than the performance data quoted. For the most recent month-end performance information visit www.nmfn.com. This chart assumes an initial investment of $10,000 made on 12/31/98. Returns shown include deductions for management and other portfolio expenses, and reinvestment of all dividends. Returns exclude deductions for separte account sale loads and account fees. Please refer to the Benchmark Definitions section of this report for information about the indices cited in the above chart and graph. Materials 3% Financials 3% Energy 8% Consumer Discretionary 8% Industrials 9% Short-Term Investments & Other Net Assets 12% Sector Allocation 12/31/08 Telecommunication Services 1% Sector Allocation is based on Net Assets. Sector Allocation and Top 10 Holdings are subject to change. Utilities 1% Information Technology 25% Health Care 16% Consumer Staples 14% 2 Growth Stock Portfolio
Growth Stock Portfolio <strong>Northwestern</strong> <strong>Mutual</strong> Series Fund, Inc. Schedule of Investments December 31, 2008 Common Stocks (88.2%) Shares/ $ Par Consumer Discretionary (8.3%) Value $ (000's) Abercrombie & Fitch Co. - Class A 63,000 1,453 * Amazon.com, Inc. 28,000 1,436 Comcast Corp. - Class A 290,150 4,898 Johnson Controls, Inc. 158,800 2,884 * Kohl's Corp. 128,500 4,652 Lowe's Cos., Inc. 137,700 2,963 McDonald's Corp. 57,800 3,594 The McGraw-Hill Cos., Inc. 129,200 2,996 NIKE, Inc. - Class B 78,700 4,014 Omnicom Group, Inc. 97,100 2,614 Target Corp. 78,900 2,724 Total 34,228 Consumer Staples (13.8%) Avon Products, Inc. 134,100 3,222 The Coca-Cola Co. 136,900 6,198 CVS Caremark Corp. 250,129 7,189 * Energizer Holdings, Inc. 47,200 2,555 * Hansen Natural Corp. 125,500 4,208 The Kroger Co. 212,000 5,599 PepsiCo, Inc. 122,900 6,731 Philip Morris International, Inc. 183,800 7,997 The Procter & Gamble Co. 62,400 3,858 Wal-Mart Stores, Inc. 172,300 9,659 Total 57,216 Energy (8.1%) * Cameron International Corp. 59,800 1,226 Diamond Offshore Drilling, Inc. 32,500 1,916 Exxon Mobil Corp. 82,734 6,605 Halliburton Co. 117,000 2,127 Hess Corp. 37,300 2,001 * National-Oilwell Varco, Inc. 138,400 3,382 Occidental Petroleum Corp. 72,100 4,325 * SandRidge Energy, Inc. 25,400 156 Schlumberger, Ltd. 102,400 4,335 * Southwestern Energy Co. 89,300 2,587 * Transocean, Ltd. 27,600 1,304 XTO Energy, Inc. 103,550 3,652 Total 33,616 Financials (2.7%) American Express Co. 59,100 1,096 CME Group, Inc. 7,000 1,457 The Goldman Sachs Group, Inc. 19,800 1,671 Common Stocks (88.2%) Shares/ $ Par Value $ (000's) Financials continued Prudential Financial, Inc. 51,300 1,552 State Street Corp. 85,500 3,363 T. Rowe Price Group, Inc. 54,013 1,914 Total 11,053 Health Care (15.7%) Abbott Laboratories 173,700 9,270 Allergan, Inc. 83,200 3,355 Baxter International, Inc. 143,800 7,706 Bristol-Myers Squibb Co. 39,600 921 * Celgene Corp. 114,100 6,307 * Genentech, Inc. 53,500 4,436 * Genzyme Corp. 67,000 4,447 * Gilead Sciences, Inc. 135,800 6,945 Johnson & Johnson 44,300 2,651 * Medco Health Solutions, Inc. 176,100 7,380 * St. Jude Medical, Inc. 69,200 2,281 Teva Pharmaceutical Industries, Ltd., ADR 113,300 4,823 * Thermo Fisher Scientific, Inc. 53,000 1,806 UnitedHealth Group, Inc. 98,100 2,609 Total 64,937 Industrials (9.6%) Danaher Corp. 69,100 3,912 Deere & Co. 57,800 2,215 FedEx Corp. 50,200 3,220 * First Solar, Inc. 17,600 2,428 * Foster Wheeler, Ltd. 78,600 1,838 Honeywell International, Inc. 138,300 4,540 Lockheed Martin Corp. 28,000 2,354 Norfolk Southern Corp. 78,000 3,670 Raytheon Co. 62,600 3,195 * Spirit AeroSystems Holdings, Inc. - Class A 180,700 1,838 Textron, Inc. 114,100 1,583 Union Pacific Corp. 86,300 4,125 United Technologies Corp. 86,700 4,647 Total 39,565 Information Technology (25.1%) Accenture, Ltd. - Class A 123,311 4,043 * Apple, Inc. 82,000 6,999 Applied Materials, Inc. 80,300 814 * Broadcom Corp. - Class A 174,650 2,964 * Cisco Systems, Inc. 540,100 8,804 Common Stocks (88.2%) Shares/ $ Par Value $ (000's) Information Technology continued Corning, Inc. 200,500 1,911 * eBay, Inc. 165,700 2,313 * Electronic Arts, Inc. 93,200 1,495 * Google, Inc. - Class A 37,842 11,642 Hewlett-Packard Co. 270,800 9,827 Intel Corp. 546,000 8,004 International Business Machines Corp. 104,400 8,786 Intersil Corp. - Class A 60,700 558 KLA-Tencor Corp. 30,100 656 MasterCard, Inc. 5,500 786 * MEMC Electronic Materials, Inc. 85,800 1,225 Microsoft Corp. 630,000 12,247 * Oracle Corp. 376,600 6,677 QUALCOMM, Inc. 242,600 8,692 * Research In Motion, Ltd. 43,900 1,782 * Varian Semiconductor Equipment Associates, Inc. 43,400 786 Visa, Inc. - Class A 33,900 1,778 * Yahoo!, Inc. 85,200 1,040 Total 103,829 Materials (3.0%) Ecolab, Inc. 50,300 1,768 Freeport-McMoRan Copper & Gold, Inc. 55,500 1,356 Monsanto Co. 92,300 6,493 Praxair, Inc. 47,300 2,808 Total 12,425 Telecommunication Services (1.3%) * American Tower Corp. - Class A 114,400 3,354 * NII Holdings, Inc. 120,000 2,182 Total 5,536 Utilities (0.6%) Exelon Corp. 43,600 2,425 Total 2,425 Total Common Stocks (Cost: $474,244) 364,830 Short-Term Investments (10.0%) Federal Government & Agencies (1.7%) (b)Federal Home Loan Bank, 0.15%, 3/13/09 1,000,000 1,000 Federal Home Loan Bank, 0.47%, 3/13/09 2,000,000 2,000 Federal Home Loan Bank, 0.65%, 3/13/09 4,000,000 4,000 Total 7,000 The Accompanying Notes are an Integral Part of the Financial Statements. Growth Stock Portfolio 3
- Page 1 and 2: December 31, 2008 THE NORTHWESTERN
- Page 3 and 4: Contents Northwestern Mutual Series
- Page 5 and 6: Annual Report December 31, 2008 Nor
- Page 7 and 8: Northwestern Mutual Series Fund, In
- Page 9 and 10: Expense Examples Beginning Account
- Page 11: Growth Stock Portfolio Objective: P
- Page 15 and 16: Focused Appreciation Portfolio Obje
- Page 17 and 18: Focused Appreciation Portfolio Nort
- Page 19 and 20: Large Cap Core Stock Portfolio Outl
- Page 21 and 22: Large Cap Core Stock Portfolio Comm
- Page 23 and 24: Large Cap Blend Portfolio companies
- Page 25 and 26: Large Cap Blend Portfolio Common St
- Page 27 and 28: Index 500 Stock Portfolio massive g
- Page 29 and 30: Index 500 Stock Portfolio Common St
- Page 31 and 32: Index 500 Stock Portfolio Common St
- Page 33 and 34: Large Company Value Portfolio Objec
- Page 35 and 36: Large Company Value Portfolio North
- Page 37 and 38: Domestic Equity Portfolio Objective
- Page 39 and 40: Domestic Equity Portfolio Northwest
- Page 41 and 42: Equity Income Portfolio Objective:
- Page 43 and 44: Equity Income Portfolio Northwester
- Page 45 and 46: Equity Income Portfolio * Non-Incom
- Page 47 and 48: Mid Cap Growth Stock Portfolio Outl
- Page 49 and 50: Mid Cap Growth Stock Portfolio * No
- Page 51 and 52: Index 400 Stock Portfolio greater d
- Page 53 and 54: Index 400 Stock Portfolio Common St
- Page 55 and 56: Index 400 Stock Portfolio Common St
- Page 57 and 58: Mid Cap Value Portfolio Sub-Adviser
- Page 59 and 60: Mid Cap Value Portfolio Common Stoc
- Page 61 and 62: Small Cap Growth Stock Portfolio Re
- Page 63 and 64:
Small Cap Growth Stock Portfolio Co
- Page 65 and 66:
Index 600 Stock Portfolio Objective
- Page 67 and 68:
Index 600 Stock Portfolio Northwest
- Page 69 and 70:
Index 600 Stock Portfolio Common St
- Page 71 and 72:
Index 600 Stock Portfolio Common St
- Page 73 and 74:
Small Cap Value Portfolio Objective
- Page 75 and 76:
Small Cap Value Portfolio Northwest
- Page 77 and 78:
Small Cap Value Portfolio Common St
- Page 79 and 80:
International Growth Portfolio expe
- Page 81 and 82:
International Growth Portfolio Fore
- Page 83 and 84:
International Growth Portfolio Shor
- Page 85 and 86:
Research International Core Portfol
- Page 87 and 88:
Research International Core Portfol
- Page 89 and 90:
International Equity Portfolio Outl
- Page 91 and 92:
International Equity Portfolio Fore
- Page 93 and 94:
Emerging Markets Equity Portfolio O
- Page 95 and 96:
Emerging Markets Equity Portfolio N
- Page 97 and 98:
Emerging Markets Equity Portfolio F
- Page 99 and 100:
Money Market Portfolio Outlook As t
- Page 101 and 102:
Money Market Portfolio Money Market
- Page 103 and 104:
Short-Term Bond Portfolio A key pos
- Page 105 and 106:
Short-Term Bond Portfolio Northwest
- Page 107 and 108:
Short-Term Bond Portfolio Structure
- Page 109 and 110:
Select Bond Portfolio Outlook We re
- Page 111 and 112:
Select Bond Portfolio Northwestern
- Page 113 and 114:
Select Bond Portfolio Corporate Bon
- Page 115 and 116:
Select Bond Portfolio Corporate Bon
- Page 117 and 118:
Select Bond Portfolio Governments (
- Page 119 and 120:
Select Bond Portfolio Structured Pr
- Page 121 and 122:
Select Bond Portfolio (a) (b) At De
- Page 123 and 124:
Long-Term U.S. Government Bond Port
- Page 125 and 126:
Long-Term U.S. Government Bond Port
- Page 127 and 128:
Long-Term U.S. Government Bond Port
- Page 129 and 130:
Inflation Protection Portfolio Obje
- Page 131 and 132:
Inflation Protection Portfolio Top
- Page 133 and 134:
Inflation Protection Portfolio Gove
- Page 135 and 136:
High Yield Bond Portfolio Objective
- Page 137 and 138:
High Yield Bond Portfolio Top 10 Fi
- Page 139 and 140:
High Yield Bond Portfolio Bonds (88
- Page 141 and 142:
High Yield Bond Portfolio Bonds (88
- Page 143 and 144:
Multi-Sector Bond Portfolio Objecti
- Page 145 and 146:
Multi-Sector Bond Portfolio The Por
- Page 147 and 148:
Multi-Sector Bond Portfolio Corpora
- Page 149 and 150:
Multi-Sector Bond Portfolio Municip
- Page 151 and 152:
Multi-Sector Bond Portfolio (a) (b)
- Page 153 and 154:
Balanced Portfolio Objective: Portf
- Page 155 and 156:
Balanced Portfolio Top 5 Equity Hol
- Page 157 and 158:
Balanced Portfolio Domestic Common
- Page 159 and 160:
Balanced Portfolio Domestic Common
- Page 161 and 162:
Balanced Portfolio Foreign Common S
- Page 163 and 164:
Balanced Portfolio Foreign Common S
- Page 165 and 166:
Balanced Portfolio Shares/ $ Par Va
- Page 167 and 168:
Balanced Portfolio Shares/ $ Par Va
- Page 169 and 170:
Balanced Portfolio Structured Produ
- Page 171 and 172:
Balanced Portfolio Shares/ $ Par Va
- Page 173 and 174:
Balanced Portfolio Short-Term Inves
- Page 175 and 176:
Balanced Portfolio CounterParty JPM
- Page 177 and 178:
Asset Allocation Portfolio Outlook
- Page 179 and 180:
Asset Allocation Portfolio Northwes
- Page 181 and 182:
Asset Allocation Portfolio Domestic
- Page 183 and 184:
Asset Allocation Portfolio Domestic
- Page 185 and 186:
Asset Allocation Portfolio Foreign
- Page 187 and 188:
Asset Allocation Portfolio Shares/
- Page 189 and 190:
Asset Allocation Portfolio Shares/
- Page 191 and 192:
Asset Allocation Portfolio Structur
- Page 193 and 194:
Asset Allocation Portfolio Shares/
- Page 195 and 196:
Asset Allocation Portfolio Shares/
- Page 197 and 198:
Benchmark Definitions The following
- Page 199 and 200:
Benchmark Definitions S&P 500 Index
- Page 201 and 202:
Large Company Value Portfolio Domes
- Page 203 and 204:
Short-Term Bond Portfolio Select Bo
- Page 205 and 206:
Northwestern Mutual Series Fund, In
- Page 207 and 208:
Northwestern Mutual Series Fund, In
- Page 209 and 210:
Large Cap Blend Portfolio Index 500
- Page 211 and 212:
Mid Cap Value Portfolio For the Yea
- Page 213 and 214:
Emerging Markets Equity Portfolio F
- Page 215 and 216:
Multi-Sector Bond Portfolio Balance
- Page 217 and 218:
Total Return (d) Net Assets, End of
- Page 219 and 220:
Total Return (d) Net Assets, End of
- Page 221 and 222:
Total Return (d) Net Assets, End of
- Page 223 and 224:
Total Return (d) Net Assets, End of
- Page 225 and 226:
Notes to Financial Statements Portf
- Page 227 and 228:
Notes to Financial Statements futur
- Page 229 and 230:
Notes to Financial Statements maxim
- Page 231 and 232:
Notes to Financial Statements Level
- Page 233 and 234:
Notes to Financial Statements First
- Page 235 and 236:
Notes to Financial Statements may a
- Page 237 and 238:
Notes to Financial Statements Portf
- Page 239 and 240:
Notes to Financial Statements The P
- Page 241 and 242:
Proxy Voting and Portfolio Holdings
- Page 243 and 244:
Director and Officer Information (U
- Page 245 and 246:
Approval and Continuance of Investm
- Page 247 and 248:
Approval and Continuance of Investm
- Page 249 and 250:
Approval and Continuance of Investm
- Page 251 and 252:
VIP Mid Cap Initial Class S&P MidC
- Page 253 and 254:
VIP Mid Cap Initial Class S&P MidC
- Page 255 and 256:
VIP Mid Cap Initial Class S&P MidC
- Page 257 and 258:
VIP Mid Cap Initial Class S&P MidC
- Page 259 and 260:
VIP Mid Cap Initial Class S&P MidC
- Page 261 and 262:
VIP Mid Cap Initial Class S&P MidC
- Page 263 and 264:
VIP Mid Cap Initial Class S&P MidC
- Page 265 and 266:
VIP Mid Cap Initial Class S&P MidC
- Page 267 and 268:
VIP Mid Cap Initial Class S&P MidC
- Page 269 and 270:
VIP Mid Cap Initial Class S&P MidC
- Page 271 and 272:
VIP Mid Cap Initial Class S&P MidC
- Page 273 and 274:
VIP Mid Cap Initial Class S&P MidC
- Page 275 and 276:
VIP Mid Cap Initial Class S&P MidC
- Page 277 and 278:
ÁÁÁÁÁÁÁÁÁÁÁÁÁÁÁÁÁ
- Page 279 and 280:
ÁÁÁÁÁÁÁÁÁÁÁÁÁÁÁÁÁ
- Page 281 and 282:
ÁÁÁÁÁÁÁÁÁÁÁÁÁÁÁÁÁ
- Page 283 and 284:
ÁÁÁÁÁÁÁÁÁÁÁÁÁÁÁÁÁ
- Page 285:
ÁÁÁÁÁÁÁÁÁÁÁÁÁÁÁÁÁ
- Page 289 and 290:
ÁÁÁÁÁÁÁÁÁÁÁÁÁÁÁÁÁ
- Page 291 and 292:
VIP Contrafund Initial Class S&P 5
- Page 293 and 294:
VIP Contrafund Initial Class S&P 5
- Page 295 and 296:
VIP Contrafund Initial Class S&P 5
- Page 297 and 298:
VIP Contrafund Initial Class S&P 5
- Page 299 and 300:
VIP Contrafund Initial Class S&P 5
- Page 301 and 302:
VIP Contrafund Initial Class S&P 5
- Page 303 and 304:
VIP Contrafund Initial Class S&P 5
- Page 305 and 306:
VIP Contrafund Initial Class S&P 5
- Page 307 and 308:
VIP Contrafund Initial Class S&P 5
- Page 309 and 310:
VIP Contrafund Initial Class S&P 5
- Page 311 and 312:
VIP Contrafund Initial Class S&P 5
- Page 313 and 314:
VIP Contrafund Initial Class S&P 5
- Page 315 and 316:
VIP Contrafund Initial Class S&P 5
- Page 317 and 318:
ÁÁÁÁÁÁÁÁÁÁÁÁÁÁÁÁÁ
- Page 319 and 320:
ÁÁÁÁÁÁÁÁÁÁÁÁÁÁÁÁÁ
- Page 321 and 322:
ÁÁÁÁÁÁÁÁÁÁÁÁÁÁÁÁÁ
- Page 323 and 324:
ÁÁÁÁÁÁÁÁÁÁÁÁÁÁÁÁÁ
- Page 328 and 329:
ÁÁÁÁÁÁÁÁÁÁÁÁÁÁÁÁÁ
- Page 330 and 331:
Socially Responsive Portfolio Manag
- Page 332 and 333:
Endnotes 1 “Total Return” inclu
- Page 334 and 335:
Schedule of Investments Socially Re
- Page 336 and 337:
Notes to Schedule of Investments So
- Page 338 and 339:
Statement of Assets and Liabilities
- Page 340 and 341:
Statements of Changes in Net Assets
- Page 342 and 343:
transactions. Net unrealized foreig
- Page 344 and 345:
Net income from the lending program
- Page 346 and 347:
Note D—Fund Share Transactions: S
- Page 348 and 349:
Financial Highlights Socially Respo
- Page 350 and 351:
Notes to Financial Highlights Socia
- Page 352 and 353:
Trustee and Officer Information The
- Page 354 and 355:
Name, (Year of Birth), Position and
- Page 356 and 357:
Name, (Year of Birth), Position and
- Page 358 and 359:
Information about the Officers of t
- Page 360 and 361:
Name, (Year of Birth), Position and
- Page 362 and 363:
potential economies of scale for th
- Page 364 and 365:
and/or new Sub-Advisory Agreement w
- Page 366 and 367:
[THIS PAGE INTENTIONALLY LEFT BLANK
- Page 368 and 369:
Russell Investment Funds Russell In
- Page 370 and 371:
Russell Investment Funds Copyright
- Page 372 and 373:
Russell Investment Funds Market Sum
- Page 374 and 375:
Russell Investment Funds services s
- Page 376 and 377:
Russell Investment Funds impact on
- Page 378 and 379:
Russell Investment Funds Multi-Styl
- Page 380 and 381:
Russell Investment Funds Multi-Styl
- Page 382 and 383:
Russell Investment Funds Multi-Styl
- Page 384 and 385:
Russell Investment Funds Multi-Styl
- Page 386 and 387:
Russell Investment Funds Multi-Styl
- Page 388 and 389:
Russell Investment Funds Aggressive
- Page 390 and 391:
Russell Investment Funds Aggressive
- Page 392 and 393:
Russell Investment Funds Aggressive
- Page 394 and 395:
Russell Investment Funds Aggressive
- Page 396 and 397:
Russell Investment Funds Aggressive
- Page 398 and 399:
Russell Investment Funds Aggressive
- Page 400 and 401:
Russell Investment Funds Aggressive
- Page 402 and 403:
Russell Investment Funds Aggressive
- Page 404 and 405:
Russell Investment Funds Non-U.S. F
- Page 406 and 407:
Russell Investment Funds Non-U.S. F
- Page 408 and 409:
Russell Investment Funds Non-U.S. F
- Page 410 and 411:
Russell Investment Funds Non-U.S. F
- Page 412 and 413:
Russell Investment Funds Non-U.S. F
- Page 414 and 415:
Russell Investment Funds Non-U.S. F
- Page 416 and 417:
Russell Investment Funds Non-U.S. F
- Page 418 and 419:
Russell Investment Funds Non-U.S. F
- Page 420 and 421:
Russell Investment Funds Core Bond
- Page 422 and 423:
Russell Investment Funds Core Bond
- Page 424 and 425:
Russell Investment Funds Core Bond
- Page 426 and 427:
Russell Investment Funds Core Bond
- Page 428 and 429:
Russell Investment Funds Core Bond
- Page 430 and 431:
Russell Investment Funds Core Bond
- Page 432 and 433:
Russell Investment Funds Core Bond
- Page 434 and 435:
Russell Investment Funds Core Bond
- Page 436 and 437:
Russell Investment Funds Core Bond
- Page 438 and 439:
Russell Investment Funds Core Bond
- Page 440 and 441:
Russell Investment Funds Core Bond
- Page 442 and 443:
Russell Investment Funds Core Bond
- Page 444 and 445:
Russell Investment Funds Core Bond
- Page 446 and 447:
Russell Investment Funds Core Bond
- Page 448 and 449:
Russell Investment Funds Real Estat
- Page 450 and 451:
Russell Investment Funds Real Estat
- Page 452 and 453:
Russell Investment Funds Real Estat
- Page 454 and 455:
Russell Investment Funds Real Estat
- Page 456 and 457:
Russell Investment Funds Notes to S
- Page 458 and 459:
Russell Investment Funds Statements
- Page 460 and 461:
Russell Investment Funds Statements
- Page 462 and 463:
Russell Investment Funds Financial
- Page 464 and 465:
Russell Investment Funds Notes to F
- Page 466 and 467:
Russell Investment Funds Notes to F
- Page 468 and 469:
Russell Investment Funds Notes to F
- Page 470 and 471:
Russell Investment Funds Notes to F
- Page 472 and 473:
Russell Investment Funds Notes to F
- Page 474 and 475:
Russell Investment Funds Notes to F
- Page 476 and 477:
Russell Investment Funds Notes to F
- Page 478 and 479:
Russell Investment Funds Notes to F
- Page 480 and 481:
Russell Investment Funds Notes to F
- Page 482 and 483:
Report of Independent Registered Pu
- Page 484 and 485:
Russell Investment Funds Basis for
- Page 486 and 487:
Russell Investment Company Basis fo
- Page 488 and 489:
Russell Investment Funds Shareholde
- Page 490 and 491:
Russell Investment Funds Disclosure
- Page 492 and 493:
Russell Investment Funds Disclosure
- Page 494 and 495:
Russell Investment Funds 909 A Stre
- Page 496 and 497:
Russell Investment Funds Russell In
- Page 498 and 499:
Russell Investment Funds - LifePoin
- Page 500 and 501:
Russell Investment Funds Market Sum
- Page 502 and 503:
Russell Investment Funds services s
- Page 504 and 505:
Russell Investment Funds impact on
- Page 506 and 507:
Russell Investment Funds Moderate S
- Page 508 and 509:
Russell Investment Funds Moderate S
- Page 510 and 511:
Russell Investment Funds Moderate S
- Page 512 and 513:
Russell Investment Funds Balanced S
- Page 514 and 515:
Russell Investment Funds Balanced S
- Page 516 and 517:
Russell Investment Funds Balanced S
- Page 518 and 519:
Russell Investment Funds Growth Str
- Page 520 and 521:
Russell Investment Funds Growth Str
- Page 522 and 523:
Russell Investment Funds Growth Str
- Page 524 and 525:
Russell Investment Funds Equity Gro
- Page 526 and 527:
Russell Investment Funds Equity Gro
- Page 528 and 529:
Russell Investment Funds Equity Gro
- Page 530 and 531:
Russell Investment Funds LifePoints
- Page 532 and 533:
Russell Investment Funds LifePoints
- Page 534 and 535:
Russell Investment Funds LifePoints
- Page 536 and 537:
Russell Investment Funds LifePoints
- Page 538 and 539:
Russell Investment Funds LifePoints
- Page 540 and 541:
Russell Investment Funds LifePoints
- Page 542 and 543:
Russell Investment Funds LifePoints
- Page 544 and 545:
Report of Independent Registered Pu
- Page 546 and 547:
Russell Investment Funds LifePoints
- Page 548 and 549:
Russell Investment Funds LifePoints
- Page 550 and 551:
Russell Investment Funds LifePoints
- Page 552 and 553:
Russell Investment Funds LifePoints
- Page 554 and 555:
Russell Investment Funds LifePoints
- Page 556 and 557:
Russell Investment Funds 909 A Stre
- Page 558 and 559:
Northwestern Mutual Series Fund, In
- Page 560 and 561:
THE NORTHWESTERN MUTUAL LIFE INSURA
- Page 562 and 563:
Northwestern Mutual Series Fund, In
- Page 564 and 565:
Small Cap Value Portfolio Effective
- Page 566:
Northwestern Mutual Series Fund, In


