Annual Reports - Northwestern Mutual
Annual Reports - Northwestern Mutual
Annual Reports - Northwestern Mutual

You also want an ePaper? Increase the reach of your titles
YUMPU automatically turns print PDFs into web optimized ePapers that Google loves.
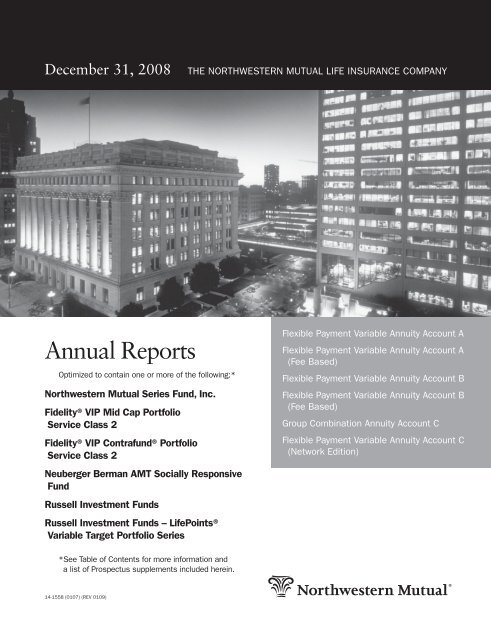
December 31, 2008<br />
THE NORTHWESTERN MUTUAL LIFE INSURANCE COMPANY<br />
<strong>Annual</strong> <strong>Reports</strong><br />
Optimized to contain one or more of the following:*<br />
<strong>Northwestern</strong> <strong>Mutual</strong> Series Fund, Inc.<br />
Fidelity® VIP Mid Cap Portfolio<br />
Service Class 2<br />
Fidelity® VIP Contrafund® Portfolio<br />
Service Class 2<br />
Neuberger Berman AMT Socially Responsive<br />
Fund<br />
Russell Investment Funds<br />
Russell Investment Funds – LifePoints®<br />
Variable Target Portfolio Series<br />
Flexible Payment Variable Annuity Account A<br />
Flexible Payment Variable Annuity Account A<br />
(Fee Based)<br />
Flexible Payment Variable Annuity Account B<br />
Flexible Payment Variable Annuity Account B<br />
(Fee Based)<br />
Group Combination Annuity Account C<br />
Flexible Payment Variable Annuity Account C<br />
(Network Edition)<br />
*See Table of Contents for more information and<br />
a list of Prospectus supplements included herein.<br />
14-1558 (0107) (REV 0109)
How To Get More Information<br />
<strong>Northwestern</strong> <strong>Mutual</strong> Express:<br />
1-800-519-4665<br />
For eligible owners, get up-to-date information about your contract<br />
at your convenience with your Contract number and your Personal<br />
Identification Number (PIN). Call toll-free to review contract<br />
values and unit values, transfer among investment options, change<br />
the allocation and obtain fund performance information.<br />
Information on the internet:<br />
<strong>Northwestern</strong> <strong>Mutual</strong> Financial Network<br />
WWW.NMFN.COM<br />
For information about <strong>Northwestern</strong> <strong>Mutual</strong> visit us on our<br />
Website. Included is fund performance information (which can be<br />
found at nmfn.com > Investment Products > Annuities > Fund<br />
Information > Performance History), forms for routine service, and<br />
daily unit values for contracts you own with your User ID and<br />
password. Eligible owners may also transfer invested assets among<br />
funds and change the allocation of future contributions online.<br />
For further information, contact either your <strong>Northwestern</strong> <strong>Mutual</strong><br />
Financial Representative or The <strong>Northwestern</strong> <strong>Mutual</strong> Life<br />
Insurance Company, 720 East Wisconsin Avenue, Milwaukee,<br />
Wisconsin 53202; 1-888-455-2232.<br />
Mason Street Advisors, LLC is the principal investment adviser for<br />
all the Portfolios of the <strong>Northwestern</strong> <strong>Mutual</strong> Series Fund, Inc.<br />
Mason Street Advisors has engaged and oversees sub-advisers who<br />
provide day-to-day management for certain of the Series Fund<br />
Portfolios. Each sub-adviser may be replaced without the approval<br />
of shareholders. Please see the Series Fund prospectus for more<br />
information.
Contents<br />
<strong>Northwestern</strong> <strong>Mutual</strong> Series Fund, Inc. - <strong>Annual</strong> Report<br />
Fidelity ® VIP Mid Cap Portfolio - <strong>Annual</strong> Report<br />
(This report follows the end of the <strong>Northwestern</strong> <strong>Mutual</strong> Series Fund, Inc.)<br />
Fidelity ® VIP Contrafund ® Portfolio - <strong>Annual</strong> Report<br />
(This report follows the end of the Fidelity ® VIP Mid Cap Portfolio)<br />
Neuberger Berman Socially Responsive Portfolio -<br />
<strong>Annual</strong> Report<br />
(This report follows the end of the Fidelity ® VIP Contrafund ® Portfolio)<br />
Russell Investment Funds - <strong>Annual</strong> Report<br />
(This report follows the end of the Neuberger Berman Portfolio)<br />
Russell Investment Funds - LifePoints ® Variable Target<br />
Portfolio Series - <strong>Annual</strong> Report<br />
(This report follows the end of the Russell Investment Funds Portfolio)<br />
Prospectus Supplements<br />
The performance data quoted represents past performance.<br />
Past performance is historical and does not guarantee future<br />
performance. Investment return and principal value will<br />
fluctuate, so that shares, when redeemed, may be worth more<br />
or less than their original cost. Current performance may be<br />
lower or higher than the performance data quoted. For the<br />
most recent month-end performance information visit<br />
www.nmfn.com.
[THIS PAGE INTENTIONALLY LEFT BLANK]
<strong>Annual</strong> Report December 31, 2008<br />
<strong>Northwestern</strong> <strong>Mutual</strong> Series Fund, Inc.<br />
A Series Fund Offering 27 Portfolios<br />
Š Growth Stock Portfolio<br />
Š Focused Appreciation Portfolio<br />
Š Large Cap Core Stock Portfolio<br />
Š Large Cap Blend Portfolio<br />
Š Index 500 Stock Portfolio<br />
Š Large Company Value Portfolio<br />
Š Domestic Equity Portfolio<br />
Š Equity Income Portfolio<br />
Š Mid Cap Growth Stock Portfolio<br />
Š Index 400 Stock Portfolio<br />
Š Mid Cap Value Portfolio<br />
Š Small Cap Growth Stock Portfolio<br />
Š Index 600 Stock Portfolio<br />
Š Small Cap Value Portfolio<br />
Š International Growth Portfolio<br />
Š Research International Core Portfolio<br />
Š International Equity Portfolio<br />
Š Emerging Markets Equity Portfolio<br />
Š Money Market Portfolio<br />
Š Short-Term Bond Portfolio<br />
Š Select Bond Portfolio<br />
Š Long-Term U.S. Government Bond Portfolio<br />
Š Inflation Protection Portfolio<br />
Š High Yield Bond Portfolio<br />
Š Multi-Sector Bond Portfolio<br />
Š Balanced Portfolio<br />
Š Asset Allocation Portfolio
Letter to Clients<br />
December 31, 2008<br />
Financial markets and economies around the world benefited<br />
in recent years from the confluence of two powerful<br />
currents—the ready acceptance of risk and an abundance of<br />
cheap, borrowed capital. The story of 2008 is the wrenching<br />
change brought about as these tides reversed. Consider the<br />
economic and financial distance we’ve covered as<br />
represented in these pairings—from record home ownership<br />
to record foreclosures; from record high commodity prices to<br />
the worst year in commodity market history; from easy credit<br />
to no credit; and from record low risk premiums to extreme<br />
risk aversion.<br />
The tally in terms of financial loss is staggering. Looked at<br />
from the consumer’s viewpoint, the unprecedented decline in<br />
home prices is estimated to have erased $4 trillion in wealth.<br />
From the late-2007 peak to the November 2008 trough, stock<br />
market losses totaled roughly $10 trillion. For some context,<br />
the Federal Reserve’s latest estimate of total U.S. household<br />
net worth stands at a little more than $56 trillion.<br />
You can assess the harm to Wall Street from the abuse of<br />
leverage in terms of institutions—Fannie Mae and Freddie<br />
Mac, insurer AIG, every one of the major independent U.S.<br />
investment banks, Wachovia, Washington <strong>Mutual</strong>, etc.—that<br />
were either taken over, bailed out, sold at steep discounts, or<br />
forced to alter their corporate structure to stay afloat. A<br />
measure of the magnitude of the crisis can be found in the<br />
government’s response—Congress passed a $700 billion<br />
bailout, while the Fed slashed interest rates to 0% and took<br />
dramatic steps to support banks and debt markets. As one<br />
industry analyst noted, it took the Fed 40 years to grow its<br />
balance sheet to $1 billion, but it ballooned from $1 to $2<br />
trillion in one 30-day stretch in 2008.<br />
Finally, look at the markets themselves: the S&P 500 ® Stock<br />
Index ended 2008 down about 37%, while the S&P MidCap<br />
400 and SmallCap 600 Indices finished with losses of 36%<br />
and 31%, respectively. Nor did international markets provide<br />
solace. The MSCI EAFE Index fell 43%, as deleveraging and<br />
the resulting economic and financial stresses disabused<br />
investors of the notion of “decoupling”, often cited in the<br />
hope that international economies and markets could<br />
withstand a U.S. slowdown. In fixed income markets, the<br />
Citigroup U.S. Broad Investment Grade Bond Index rose 7%<br />
for the year, driven entirely by gains in Treasury and<br />
government-backed agency and mortgage bonds; corporate<br />
securities actually had negative returns.<br />
have in supporting the economy and returning financial<br />
markets to some semblance of normalcy. What’s more, there<br />
is considerable fuel for market gains—the Fed estimates U.S.<br />
consumers hold almost $9 trillion in cash in bank deposits<br />
and brokerage accounts, representing a record 75% of the<br />
total capitalization of the U.S. stock market.<br />
We should close by saying a word about diversification. In a<br />
year when virtually every asset outside of Treasuries<br />
produced negative returns, there are those who argue that<br />
diversification did not work. But we must not mistake<br />
direction of market movement for magnitude. While all loss<br />
hurts, we continue to believe that it pays to attempt to<br />
minimize those losses through diversification.<br />
Diversification—that is, using a measured approach to spread<br />
your assets within and across asset classes—remains the best<br />
way we know to maximize risk-adjusted performance over<br />
time. And systematic rebalancing to established targets<br />
consistent with your investment goals and objectives<br />
enforces a disciplined buy low, sell high strategy that is<br />
central to a sound investment plan.<br />
Patricia L. Van Kampen<br />
President of <strong>Northwestern</strong> <strong>Mutual</strong> Series Fund, Inc.<br />
Vice President of Mason Street Advisors, LLC<br />
This breathtaking tally of loss begs the question: what sort of<br />
financial landscape can we expect in a world where access to<br />
credit is highly constrained? While the economic<br />
environment is challenging, we are hopeful about the role<br />
that massive fiscal stimulus and innovative Fed policies can
<strong>Northwestern</strong> <strong>Mutual</strong> Series Fund, Inc.<br />
Table of Contents<br />
Expense Examples ................................................................ i<br />
Series Fund Overview and Schedules of Investments:<br />
Growth Stock Portfolio ........................................................ 1<br />
Focused Appreciation Portfolio .................................................. 5<br />
Large Cap Core Stock Portfolio ................................................. 8<br />
Large Cap Blend Portfolio ...................................................... 12<br />
Index 500 Stock Portfolio ...................................................... 16<br />
Large Company Value Portfolio ................................................. 23<br />
Domestic Equity Portfolio ...................................................... 27<br />
Equity Income Portfolio ....................................................... 31<br />
Mid Cap Growth Stock Portfolio ................................................ 36<br />
Index 400 Stock Portfolio ...................................................... 40<br />
Mid Cap Value Portfolio ....................................................... 46<br />
Small Cap Growth Stock Portfolio ............................................... 50<br />
Index 600 Stock Portfolio ...................................................... 55<br />
Small Cap Value Portfolio ...................................................... 63<br />
International Growth Portfolio .................................................. 68<br />
Research International Core Portfolio ............................................. 74<br />
International Equity Portfolio ................................................... 78<br />
Emerging Markets Equity Portfolio .............................................. 83<br />
Money Market Portfolio ....................................................... 88<br />
Short-Term Bond Portfolio ..................................................... 92<br />
Select Bond Portfolio ......................................................... 98<br />
Long-Term U.S. Government Bond Portfolio ....................................... 112<br />
Inflation Protection Portfolio .................................................... 119<br />
High Yield Bond Portfolio ..................................................... 125<br />
Multi-Sector Bond Portfolio .................................................... 133<br />
Balanced Portfolio ............................................................ 143<br />
Asset Allocation Portfolio ...................................................... 166<br />
Benchmark Definitions ............................................................ 187<br />
Statements of Assets and Liabilities .................................................. 190<br />
Statements of Operations ........................................................... 194<br />
Statements of Changes in Net Assets ................................................. 198<br />
Financial Highlights .............................................................. 206<br />
Notes to Financial Statements ....................................................... 214<br />
Report of Independent Registered Public Accounting Firm ................................ 230<br />
Proxy Voting and Portfolio Holdings ................................................. 231<br />
Director and Officer Information .................................................... 232<br />
Approval and Continuance of Investment Sub-Advisory Agreements ........................ 234<br />
Mason Street Advisors, LLC, adviser to the <strong>Northwestern</strong> <strong>Mutual</strong> Series Fund, Inc., is a wholly owned subsidiary of<br />
The <strong>Northwestern</strong> <strong>Mutual</strong> Life Insurance Company.<br />
The views expressed in the portfolio manager commentaries set forth in the following pages reflect those of the<br />
portfolio managers only through the end of the period covered by this report and do not necessarily represent the views<br />
of any affiliated organization. These views are subject to change at any time based upon market conditions or other<br />
events and should not be relied upon as investment advice. Mason Street Advisors, LLC, disclaims any responsibility to<br />
update these views.
Expense Examples<br />
Example<br />
As a shareholder of each Portfolio, you incur two types of costs: (1) transaction costs and (2) ongoing costs, including<br />
management fees and other Portfolio expenses. This Example is intended to help you understand your ongoing costs (in<br />
dollars) of investing in the Portfolios and to compare these costs with the ongoing costs of investing in other mutual funds.<br />
The Example is based on an investment of $1,000 invested at the beginning of the period and held for the entire period (July 1,<br />
2008 to December 31, 2008).<br />
Actual Expenses<br />
The first line of the table below provides information about actual account values and actual expenses. You may use the<br />
information in this line, together with the amount you invested, to estimate the expenses that you paid over the period. Simply<br />
divide your account value by $1,000 (for example, an $8,600 account value divided by $1,000 = 8.6), then multiply the result<br />
by the number in the first line under the heading entitled “Expenses Paid During Period” to estimate the expenses you paid on<br />
your account during this period.<br />
Hypothetical Example for Comparison Purposes<br />
The second line of the table below provides information about hypothetical account values and hypothetical expenses based on<br />
each Portfolio’s actual expense ratio and an assumed rate of return of 5% per year before expenses, which is not the Portfolios’<br />
actual return. The hypothetical account values and expenses may not be used to estimate the actual ending account balance or<br />
expenses you paid for the period. You may use this information to compare the ongoing costs of investing in a Portfolio and<br />
other funds. To do so, compare this 5% hypothetical example with the 5% hypothetical examples that appear in the<br />
shareholder reports of the other funds.<br />
Please note that the expenses shown in the table are meant to highlight your ongoing costs only and do not reflect any<br />
transactional costs or separate account charges. Therefore, the second line of the table is useful in comparing ongoing costs<br />
only, and will not help you determine the relative total costs of owning different funds. In addition, if these transactional costs<br />
or separate account charges were included, your costs would have been higher.<br />
Beginning Account Value<br />
July 1, 2008<br />
Ending Account Value<br />
December 31, 2008<br />
Expenses Paid During<br />
Period July 1, 2008 to<br />
December 31, 2008*<br />
<strong>Annual</strong>ized<br />
Expense Ratio<br />
Growth Stock Portfolio<br />
Actual $1,000.00 $ 678.50 $1.86 0.44%<br />
Hypothetical (5% return before<br />
expenses) 1,000.00 1,022.92 2.24 0.44<br />
Focused Appreciation Portfolio<br />
Actual 1,000.00 597.86 3.17 0.79<br />
Hypothetical (5% return before<br />
expenses) 1,000.00 1,021.17 4.01 0.79<br />
Large Cap Core Stock Portfolio<br />
Actual 1,000.00 689.94 1.91 0.45<br />
Hypothetical (5% return before<br />
expenses) 1,000.00 1,022.87 2.29 0.45<br />
Large Cap Blend Portfolio<br />
Actual 1,000.00 694.36 3.62 0.85<br />
Hypothetical (5% return before<br />
expenses) 1,000.00 1,020.86 4.32 0.85<br />
Index 500 Stock Portfolio<br />
Actual 1,000.00 716.15 0.86 0.20<br />
Hypothetical (5% return before<br />
expenses) 1,000.00 1,024.13 1.02 0.20<br />
i Expense Examples
Expense Examples<br />
Beginning Account Value<br />
July 1, 2008<br />
Ending Account Value<br />
December 31, 2008<br />
Expenses Paid During<br />
Period July 1, 2008 to<br />
December 31, 2008*<br />
<strong>Annual</strong>ized<br />
Expense Ratio<br />
Large Company Value Portfolio<br />
Actual $1,000.00 $ 737.19 $3.49 0.80%<br />
Hypothetical (5% return before<br />
expenses) 1,000.00 1,021.11 4.06 0.80<br />
Domestic Equity Portfolio<br />
Actual 1,000.00 751.09 2.55 0.58<br />
Hypothetical (5% return before<br />
expenses) 1,000.00 1,022.22 2.95 0.58<br />
Equity Income Portfolio<br />
Actual 1,000.00 742.20 2.93 0.67<br />
Hypothetical (5% return before<br />
expenses) 1,000.00 1,021.77 3.40 0.67<br />
Mid Cap Growth Stock Portfolio<br />
Actual 1,000.00 667.86 2.22 0.53<br />
Hypothetical (5% return before<br />
expenses) 1,000.00 1,022.47 2.69 0.53<br />
Index 400 Stock Portfolio<br />
Actual 1,000.00 664.28 1.09 0.26<br />
Hypothetical (5% return before<br />
expenses) 1,000.00 1,023.83 1.32 0.26<br />
Mid Cap Value Portfolio<br />
Actual 1,000.00 692.57 3.79 0.89<br />
Hypothetical (5% return before<br />
expenses) 1,000.00 1,020.66 4.52 0.89<br />
Small Cap Growth Stock Portfolio<br />
Actual 1,000.00 658.85 2.42 0.58<br />
Hypothetical (5% return before<br />
expenses) 1,000.00 1,022.22 2.95 0.58<br />
Index 600 Stock Portfolio<br />
Actual 1,000.00 740.11 1.53 0.35<br />
Hypothetical (5% return before<br />
expenses) 1,000.00 1,023.38 1.78 0.35<br />
Small Cap Value Portfolio<br />
Actual 1,000.00 730.14 3.78 0.87<br />
Hypothetical (5% return before<br />
expenses) 1,000.00 1,020.76 4.42 0.87<br />
International Growth Portfolio<br />
Actual 1,000.00 601.78 3.34 0.83<br />
Hypothetical (5% return before<br />
expenses) 1,000.00 1,020.96 4.22 0.83<br />
Research International Core Portfolio<br />
Actual 1,000.00 635.96 4.73 1.15<br />
Hypothetical (5% return before<br />
expenses) 1,000.00 1,019.36 5.84 1.15<br />
International Equity Portfolio<br />
Actual 1,000.00 656.60 2.75 0.66<br />
Hypothetical (5% return before<br />
expenses) 1,000.00 1,021.82 3.35 0.66<br />
Expense Examples ii
Expense Examples<br />
Beginning Account Value<br />
July 1, 2008<br />
Ending Account Value<br />
December 31, 2008<br />
Expenses Paid During<br />
Period July 1, 2008 to<br />
December 31, 2008*<br />
<strong>Annual</strong>ized<br />
Expense Ratio<br />
Emerging Markets Equity Portfolio<br />
Actual $1,000.00 $ 491.66 $5.62 1.50%<br />
Hypothetical (5% return before<br />
expenses) 1,000.00 1,017.60 7.61 1.50<br />
Money Market Portfolio<br />
Actual 1,000.00 1,011.68 1.67 0.33<br />
Hypothetical (5% return before<br />
expenses) 1,000.00 1,023.48 1.68 0.33<br />
Short-Term Bond Portfolio<br />
Actual 1,000.00 1,003.08 2.01 0.40<br />
Hypothetical (5% return before<br />
expenses) 1,000.00 1,023.13 2.03 0.40<br />
Select Bond Portfolio<br />
Actual 1,000.00 1,015.98 1.52 0.30<br />
Hypothetical (5% return before<br />
expenses) 1,000.00 1,023.63 1.53 0.30<br />
Long-Term U.S. Government Bond<br />
Portfolio<br />
Actual 1,000.00 1,190.49 3.36 0.61<br />
Hypothetical (5% return before<br />
expenses) 1,000.00 1,022.07 3.10 0.61<br />
Inflation Protection Portfolio<br />
Actual 1,000.00 955.84 3.05 0.62<br />
Hypothetical (5% return before<br />
expenses) 1,000.00 1,022.02 3.15 0.62<br />
High Yield Bond Portfolio<br />
Actual 1,000.00 794.41 2.17 0.48<br />
Hypothetical (5% return before<br />
expenses) 1,000.00 1,022.72 2.44 0.48<br />
Multi-Sector Bond Portfolio<br />
Actual 1,000.00 945.79 4.30 0.88<br />
Hypothetical (5% return before<br />
expenses) 1,000.00 1,020.71 4.47 0.88<br />
Balanced Portfolio<br />
Actual 1,000.00 815.32 1.37 0.30<br />
Hypothetical (5% return before<br />
expenses) 1,000.00 1,023.63 1.53 0.30<br />
Asset Allocation Portfolio<br />
Actual 1,000.00 750.13 2.42 0.55<br />
Hypothetical (5% return before<br />
expenses) 1,000.00 1,022.37 2.80 0.55<br />
* Expenses are equal to the Portfolio's annualized expense ratio, multiplied by the average account value<br />
over the period, multiplied by 184/366 (to reflect the one-half year period).<br />
iii Expense Examples
Growth Stock Portfolio<br />
Objective: Portfolio Strategy: Net Assets:<br />
Long-term growth of capital. Income is Invest in well-established companies with above-average $414 million<br />
a secondary objective.<br />
potential for earnings growth.<br />
Portfolio Overview<br />
Mason Street Advisors acts as the investment adviser for the Growth Stock Portfolio. The Portfolio seeks long-term growth of<br />
capital with income as a secondary objective. The Portfolio seeks to achieve this objective by investing primarily in the equity<br />
securities of well-established, medium and large capitalization companies that are selected for their above-average earnings<br />
growth potential, with an emphasis on high quality companies that have strong financial characteristics. Companies are<br />
identified using a “top down” approach that involves considering the economic outlook, identifying growth-oriented industries<br />
based on that outlook, and evaluating individual companies considering factors such as management product outlook, global<br />
exposure, industry leadership position and financial characteristics.<br />
Market Overview<br />
Financial markets endured a brutal 2008, which saw the failure of a number of leading financial institutions, credit markets<br />
freeze up, and the U.S. government take a series of extraordinary steps to support the economy and financial system. The crisis<br />
was a result of the ongoing sub-prime mortgage meltdown, which spread rapidly through the domestic financial sector and into<br />
virtually every segment of global financial markets. Economic conditions deteriorated sharply over the course of the year, as<br />
unemployment jumped above 7% and the economy entered its first recession since 2002. For all of 2008, returns for large-,<br />
medium- and small-sized companies were –37.60%, –41.46% and –33.79%, as measured by the Russell 1000, Russell MidCap<br />
and Russell 2000 Stock Indices, respectively. No sector of the market had positive returns for the year, and value-oriented<br />
stocks held up modestly better than growth stocks, as measured by the Russell style indices.<br />
Portfolio Results<br />
The Growth Stock Portfolio returned –38.86% for the twelve months ended December 31, 2008. By comparison, the Russell<br />
1000 Growth Index returned –38.44%. (The Index is unmanaged, cannot be invested in directly, and does not include<br />
administrative expenses or sales charges.) The Large-Cap Growth Funds peer group had an average return of –41.68%,<br />
according to Lipper Analytical Services, Inc., an independent mutual fund ranking agency.<br />
The Portfolio’s absolute return reflected the unprecedented turmoil affecting the economy and financial markets in what was<br />
the worst year for stocks since the Great Depression. In that environment, no sector contributed positively to results. Despite<br />
the difficult investing climate, the Portfolio performed in line with its Index and held up better than many of its peers. We<br />
believe the Portfolio outperformed the peer group average return because it tended to be underrepresented in economically<br />
sensitive shares, and because our process favored reasonably priced growers, rather than pure growth and momentum names,<br />
which generally lagged.<br />
Relative to the Index, stock selection in the Information Technology sector detracted most from relative results, led by<br />
positioning in the internet software and services, semiconductor and software industry segments. The largest detractor was<br />
MEMC Electronic Materials, which provides silicon wafers to computer chip makers and solar panel manufacturers. The<br />
dramatic downturn in economic growth in the second half of the year weighed heavily on demand and prices for its products.<br />
Another source of weakness was positioning in the Industrials sector. The leading detractors were manufacturers and parts<br />
suppliers tied to the market for commercial airliners and business jets. These were Textron and Spirit AeroSystems Holdings.<br />
We liked the backlog and book of business these companies touted; nevertheless, investors worried that slower economic<br />
growth would throttle demand for commercial jets.<br />
At the other end of the spectrum, our stock selection was most effective in the Health Care sector, behind positioning in the<br />
biotechnology segment. The leading contributors were Gilead Sciences and Celgene. Gilead is the dominant player in the<br />
market for AIDS drugs, while Celgene offers best-in-class cancer drugs gaining approval for new applications. Selection and<br />
allocation decisions in the health care providers and health care equipment industry segments were also key contributors to<br />
relative results.<br />
In Energy, the Portfolio benefited from stock selection among oil, gas and consumable fuels names. The leading contributor<br />
was oil and gas exploration and production firm EOG Resources, which performed very well early in the year as energy prices<br />
surged to record highs. We traded out of that stock into Southwestern Energy—whose valuation, growth profile and balance<br />
sheet we liked better—which held up well.<br />
Growth Stock Portfolio 1
Growth Stock Portfolio<br />
Outlook<br />
After the unprecedented events of 2008, we have a somewhat hopeful outlook for 2009—we are hoping for the reemergence of<br />
a more rational, less volatile market environment where fundamentals matter again. Unfortunately, the economic fundamentals<br />
remain challenging, and it is difficult to see a quick rebound in growth and earnings. Nevertheless, there are reasons we<br />
believe large-cap growth shares are positioned to do reasonably well in 2009. First, growth-oriented shares have historically<br />
done better than value when investors desire earnings certainty, and large companies typically have more arms to their<br />
business and levers to pull to support earnings. Second, we find stocks attractive relative to bonds. Third, stocks typically rally<br />
before the economy turns. So given those factors, we are likely to add exposure to what we believe are the most attractive,<br />
highest quality early cycle companies with the most potential to benefit from an eventual recovery.<br />
Relative Performance<br />
$15,000<br />
10,000<br />
5,000<br />
0<br />
12/98 12/00 12/02 12/04 12/06 12/08<br />
Top 10 Equity Holdings 12/31/08<br />
Security Description<br />
% of Net Assets<br />
Microsoft Corp. 3.0%<br />
Google, Inc. - Class A 2.8%<br />
Hewlett-Packard Co. 2.4%<br />
Wal-Mart Stores, Inc. 2.3%<br />
Abbott Laboratories 2.2%<br />
Cisco Systems, Inc. 2.1%<br />
International Business Machines Corp. 2.1%<br />
QUALCOMM, Inc. 2.1%<br />
Intel Corp. 1.9%<br />
Philip Morris International, Inc. 1.9%<br />
Growth Stock Portfolio<br />
Russell 1000 Growth Index<br />
Average <strong>Annual</strong> Total Returns<br />
For Periods Ended December 31, 2008<br />
1 Year 5 Years 10 Years<br />
Growth Stock Portfolio<br />
Russell 1000 Growth Index<br />
-38.86% -3.42%<br />
-38.44% -3.42%<br />
-2.07%<br />
-4.27%<br />
Lipper Variable Insurance Products<br />
(VIP) Large Cap Growth Funds<br />
Average -41.68% -3.80% -2.66%<br />
The performance data quoted represents past<br />
performance. Past performance is historical and does<br />
not guarantee future performance. Investment return<br />
and principal value will fluctuate, so that shares, when<br />
redeemed, may be worth more or less than their original<br />
cost. Current performance may be lower or higher than<br />
the performance data quoted. For the most recent<br />
month-end performance information visit<br />
www.nmfn.com.<br />
This chart assumes an initial investment of $10,000<br />
made on 12/31/98. Returns shown include deductions<br />
for management and other portfolio expenses, and<br />
reinvestment of all dividends. Returns exclude<br />
deductions for separte account sale loads and account<br />
fees. Please refer to the Benchmark Definitions section<br />
of this report for information about the indices cited in<br />
the above chart and graph.<br />
Materials<br />
3%<br />
Financials<br />
3%<br />
Energy<br />
8%<br />
Consumer<br />
Discretionary<br />
8%<br />
Industrials<br />
9%<br />
Short-Term Investments<br />
& Other Net Assets<br />
12%<br />
Sector Allocation 12/31/08<br />
Telecommunication Services<br />
1%<br />
Sector Allocation is based on Net Assets.<br />
Sector Allocation and Top 10 Holdings are subject to<br />
change.<br />
Utilities<br />
1%<br />
Information<br />
Technology<br />
25%<br />
Health Care<br />
16%<br />
Consumer<br />
Staples<br />
14%<br />
2 Growth Stock Portfolio
Growth Stock Portfolio<br />
<strong>Northwestern</strong> <strong>Mutual</strong> Series Fund, Inc.<br />
Schedule of Investments<br />
December 31, 2008<br />
Common Stocks (88.2%)<br />
Shares/<br />
$ Par<br />
Consumer Discretionary (8.3%)<br />
Value<br />
$ (000's)<br />
Abercrombie & Fitch<br />
Co. - Class A 63,000 1,453<br />
* Amazon.com, Inc. 28,000 1,436<br />
Comcast Corp. - Class A 290,150 4,898<br />
Johnson Controls, Inc. 158,800 2,884<br />
* Kohl's Corp. 128,500 4,652<br />
Lowe's Cos., Inc. 137,700 2,963<br />
McDonald's Corp. 57,800 3,594<br />
The McGraw-Hill Cos.,<br />
Inc. 129,200 2,996<br />
NIKE, Inc. - Class B 78,700 4,014<br />
Omnicom Group, Inc. 97,100 2,614<br />
Target Corp. 78,900 2,724<br />
Total 34,228<br />
Consumer Staples (13.8%)<br />
Avon Products, Inc. 134,100 3,222<br />
The Coca-Cola Co. 136,900 6,198<br />
CVS Caremark Corp. 250,129 7,189<br />
* Energizer Holdings, Inc. 47,200 2,555<br />
* Hansen Natural Corp. 125,500 4,208<br />
The Kroger Co. 212,000 5,599<br />
PepsiCo, Inc. 122,900 6,731<br />
Philip Morris<br />
International, Inc. 183,800 7,997<br />
The Procter & Gamble<br />
Co. 62,400 3,858<br />
Wal-Mart Stores, Inc. 172,300 9,659<br />
Total 57,216<br />
Energy (8.1%)<br />
* Cameron International<br />
Corp. 59,800 1,226<br />
Diamond Offshore<br />
Drilling, Inc. 32,500 1,916<br />
Exxon Mobil Corp. 82,734 6,605<br />
Halliburton Co. 117,000 2,127<br />
Hess Corp. 37,300 2,001<br />
* National-Oilwell Varco,<br />
Inc. 138,400 3,382<br />
Occidental Petroleum<br />
Corp. 72,100 4,325<br />
* SandRidge Energy, Inc. 25,400 156<br />
Schlumberger, Ltd. 102,400 4,335<br />
* Southwestern Energy<br />
Co. 89,300 2,587<br />
* Transocean, Ltd. 27,600 1,304<br />
XTO Energy, Inc. 103,550 3,652<br />
Total 33,616<br />
Financials (2.7%)<br />
American Express Co. 59,100 1,096<br />
CME Group, Inc. 7,000 1,457<br />
The Goldman Sachs<br />
Group, Inc. 19,800 1,671<br />
Common Stocks (88.2%)<br />
Shares/<br />
$ Par<br />
Value<br />
$ (000's)<br />
Financials continued<br />
Prudential Financial, Inc. 51,300 1,552<br />
State Street Corp. 85,500 3,363<br />
T. Rowe Price Group,<br />
Inc. 54,013 1,914<br />
Total 11,053<br />
Health Care (15.7%)<br />
Abbott Laboratories 173,700 9,270<br />
Allergan, Inc. 83,200 3,355<br />
Baxter International, Inc. 143,800 7,706<br />
Bristol-Myers Squibb<br />
Co. 39,600 921<br />
* Celgene Corp. 114,100 6,307<br />
* Genentech, Inc. 53,500 4,436<br />
* Genzyme Corp. 67,000 4,447<br />
* Gilead Sciences, Inc. 135,800 6,945<br />
Johnson & Johnson 44,300 2,651<br />
* Medco Health Solutions,<br />
Inc. 176,100 7,380<br />
* St. Jude Medical, Inc. 69,200 2,281<br />
Teva Pharmaceutical<br />
Industries, Ltd., ADR 113,300 4,823<br />
* Thermo Fisher<br />
Scientific, Inc. 53,000 1,806<br />
UnitedHealth Group,<br />
Inc. 98,100 2,609<br />
Total 64,937<br />
Industrials (9.6%)<br />
Danaher Corp. 69,100 3,912<br />
Deere & Co. 57,800 2,215<br />
FedEx Corp. 50,200 3,220<br />
* First Solar, Inc. 17,600 2,428<br />
* Foster Wheeler, Ltd. 78,600 1,838<br />
Honeywell International,<br />
Inc. 138,300 4,540<br />
Lockheed Martin Corp. 28,000 2,354<br />
Norfolk Southern Corp. 78,000 3,670<br />
Raytheon Co. 62,600 3,195<br />
* Spirit AeroSystems<br />
Holdings, Inc. - Class A 180,700 1,838<br />
Textron, Inc. 114,100 1,583<br />
Union Pacific Corp. 86,300 4,125<br />
United Technologies<br />
Corp. 86,700 4,647<br />
Total 39,565<br />
Information Technology (25.1%)<br />
Accenture, Ltd. - Class<br />
A 123,311 4,043<br />
* Apple, Inc. 82,000 6,999<br />
Applied Materials, Inc. 80,300 814<br />
* Broadcom Corp. - Class<br />
A 174,650 2,964<br />
* Cisco Systems, Inc. 540,100 8,804<br />
Common Stocks (88.2%)<br />
Shares/<br />
$ Par<br />
Value<br />
$ (000's)<br />
Information Technology continued<br />
Corning, Inc. 200,500 1,911<br />
* eBay, Inc. 165,700 2,313<br />
* Electronic Arts, Inc. 93,200 1,495<br />
* Google, Inc. - Class A 37,842 11,642<br />
Hewlett-Packard Co. 270,800 9,827<br />
Intel Corp. 546,000 8,004<br />
International Business<br />
Machines Corp. 104,400 8,786<br />
Intersil Corp. - Class A 60,700 558<br />
KLA-Tencor Corp. 30,100 656<br />
MasterCard, Inc. 5,500 786<br />
* MEMC Electronic<br />
Materials, Inc. 85,800 1,225<br />
Microsoft Corp. 630,000 12,247<br />
* Oracle Corp. 376,600 6,677<br />
QUALCOMM, Inc. 242,600 8,692<br />
* Research In Motion, Ltd. 43,900 1,782<br />
* Varian Semiconductor<br />
Equipment Associates,<br />
Inc. 43,400 786<br />
Visa, Inc. - Class A 33,900 1,778<br />
* Yahoo!, Inc. 85,200 1,040<br />
Total 103,829<br />
Materials (3.0%)<br />
Ecolab, Inc. 50,300 1,768<br />
Freeport-McMoRan<br />
Copper & Gold, Inc. 55,500 1,356<br />
Monsanto Co. 92,300 6,493<br />
Praxair, Inc. 47,300 2,808<br />
Total 12,425<br />
Telecommunication Services (1.3%)<br />
* American Tower Corp. -<br />
Class A 114,400 3,354<br />
* NII Holdings, Inc. 120,000 2,182<br />
Total 5,536<br />
Utilities (0.6%)<br />
Exelon Corp. 43,600 2,425<br />
Total 2,425<br />
Total Common Stocks<br />
(Cost: $474,244) 364,830<br />
Short-Term Investments (10.0%)<br />
Federal Government & Agencies (1.7%)<br />
(b)Federal Home Loan<br />
Bank, 0.15%, 3/13/09 1,000,000 1,000<br />
Federal Home Loan<br />
Bank, 0.47%, 3/13/09 2,000,000 2,000<br />
Federal Home Loan<br />
Bank, 0.65%, 3/13/09 4,000,000 4,000<br />
Total 7,000<br />
The Accompanying Notes are an Integral Part of the Financial Statements.<br />
Growth Stock Portfolio 3
Growth Stock Portfolio<br />
Short-Term<br />
Shares/ Value<br />
Investments (10.0%) $ Par $ (000's)<br />
Finance Services (7.2%)<br />
Alpine Securitization<br />
Corp., 1.25%, 1/8/09 10,000,000 9,998<br />
Ciesco LLC,<br />
0.20%, 1/12/09 10,000,000 9,999<br />
Gemini Securitization<br />
Corp. LLC,<br />
0.70%, 1/15/09 10,000,000 9,997<br />
Total 29,994<br />
Oil and Gas (1.1%)<br />
Devon Energy Corp.,<br />
1.15%, 1/2/09 4,500,000 4,500<br />
Total 4,500<br />
Total Short-Term Investments<br />
(Cost: $41,487) 41,494<br />
Total Investments (98.2%)<br />
(Cost: $515,731)(a) 406,324<br />
Other Assets, Less<br />
Liabilities (1.8%) 7,477<br />
Net Assets (100.0%) 413,801<br />
* Non-Income Producing<br />
ADR after the name of a security represents—American Depositary Receipt.<br />
(a)<br />
(b)<br />
At December 31, 2008 the aggregate cost of securities for federal tax purposes (in thousands) was $515,822 and the net unrealized depreciation of<br />
investments based on that cost was $109,498 which is comprised of $21,055 aggregate gross unrealized appreciation and $130,553 aggregate gross<br />
unrealized depreciation.<br />
All or a portion of the securities have been committed as collateral for open futures positions or when-issued securities. Information regarding open futures<br />
contracts as of period end is summarized below.<br />
Unrealized<br />
Appreciation/<br />
Number of<br />
(Depreciation)<br />
Issuer (000's)<br />
Contracts Expiration Date (000's)<br />
S&P 500 Index Futures (Long) (Total Notional Value at December 31, 2008, $37,875) 166 3/09 $ (522)<br />
The Accompanying Notes are an Integral Part of the Financial Statements.<br />
4 Growth Stock Portfolio
Focused Appreciation Portfolio<br />
Objective: Portfolio Strategy: Net Assets:<br />
Long-term growth of capital.<br />
Invest in equity securities selected for their growth potential. $172 million<br />
Portfolio Overview<br />
Mason Street Advisors, the investment adviser for the Focused Appreciation Portfolio, has engaged Janus Capital<br />
Management LLC to act as sub-adviser for the Portfolio. The Portfolio seeks long-term growth of capital through investments<br />
in the equities of companies selected for their growth potential. The Portfolio is managed using a “bottom-up” approach,<br />
which means that the holdings are selected by examining individual securities, rather than focusing on broad economic trends<br />
or industry sectors. The Portfolio may invest in companies of any size, from large, well-established companies to smaller,<br />
emerging growth companies. Although the Portfolio is diversified, the Portfolio may hold larger positions in a smaller number<br />
of companies than more diversified funds.<br />
Market Overview<br />
Financial markets endured a brutal 2008, which saw the failure of a number of leading financial institutions, credit markets<br />
freeze up, and the U.S. government take a series of extraordinary steps to support the economy and financial system. The crisis<br />
was a result of the ongoing sub-prime mortgage meltdown, which spread rapidly through the domestic financial sector and into<br />
virtually every segment of global financial markets. For all of 2008, returns for large-, medium- and small-sized companies<br />
were –37.60%, –41.46% and –33.79%, as measured by the Russell 1000, Russell MidCap and Russell 2000 Stock Indices,<br />
respectively. Looking at returns by style, value-oriented shares held up better than growth stocks, as measured by the Russell<br />
style indices.<br />
Portfolio Performance<br />
For the twelve months ended December 31, 2008, the Portfolio underperformed its benchmark, the Russell 1000 Growth<br />
Index. The Portfolio posted a return of –40.01%, compared with the –38.44% return of the benchmark. (The Index is<br />
unmanaged, cannot be invested in directly and does not include administrative expenses or sales charges.) The average return<br />
for the Portfolio’s peer group, Large-Cap Growth Funds, was –41.68%, according to Lipper Analytical Services, Inc., an<br />
independent mutual fund rating agency.<br />
Holdings within the Information Technology, consumer-related sectors and Financials were among the detractors during the<br />
year. In terms of contributors, stock selection within Health Care and Energy aided comparable results.<br />
The Portfolio’s top individual detractor was Apple. The company declined in the period due to concerns that the economic<br />
slowdown would negatively impact sales of its key computer, iPhone and iPod products. While we recognized that sales could<br />
be impacted in the short term, we continued to hold the position, believing the continued success of the iPhone and further<br />
market share gains in its core computer division will be the key drivers of Apple’s future growth.<br />
Lehman Brothers was a top detractor amid turmoil in the credit markets and a bankruptcy protection filing in September. Our<br />
thesis on Lehman centered on the premise that it had sufficient liquidity to weather the market storms. In fact, we evaluated the<br />
downside risk through multiple scenario analyses. Unfortunately, we did not appropriately anticipate the dramatic decline in<br />
the values of residential mortgages, commercial mortgages and whole loans would have on Lehman’s balance sheet. What we<br />
believe should have been a liquidity issue became a solvency issue and the company filed for bankruptcy protection. After an<br />
extremely frustrating turn of events, we exited the position.<br />
One other notable detractor was Google. Concerns that advertising revenues could decline amid the economic slowdown<br />
provided a negative backdrop for the Internet company. However, we favored the company because we thought it had the<br />
potential to take market share in online search and in other areas given some of its new products. In addition, while we<br />
recognized its sensitivity to the economy, long term we found its potential in mobile search and international markets<br />
appealing.<br />
At the other end of the spectrum, a number of the Portfolio’s leading contributors came from the Health Care sector. Gilead<br />
Sciences benefited from studies that showed better results for patients who began using its HIV drug, Truvada, earlier in<br />
treatment, suggesting a larger addressable market. Celgene received a mid-year boost from a strong European rollout of its<br />
cancer-fighting drug Revlimid. We think the company is on track to continue to dominate the multiple myeloma (bone marrow<br />
cancer) market with Revlimid.<br />
Genentech was another top contributor during the period after receiving a takeout bid from Swiss-based Roche, which already<br />
owned a majority share of Genentech. We trimmed our position and used the shares as a source of cash.<br />
Outlook<br />
In terms of positioning, the Portfolio was overweight Health Care and Materials and underweight Energy and consumerrelated<br />
sectors relative to the benchmark at the end of the period. Looking ahead, it is difficult to determine how deep or<br />
Focused Appreciation Portfolio 5
Focused Appreciation Portfolio<br />
protracted this recession will be or the pace of the recovery. Credit availability, employment growth and the housing market<br />
represent major headwinds to a quick recovery in our view. Given the high degree of uncertainty in the markets at period end,<br />
we were favoring companies with recurring revenue streams that we think have great valuations and growth prospects. We<br />
want to own companies that can deliver solid results, even in a tough economy, and have the potential to gain market share<br />
from weaker competitors.<br />
Relative Performance<br />
$25,000<br />
20,000<br />
15,000<br />
10,000<br />
5,000<br />
0<br />
5/03 12/03 12/04 12/05 12/06 12/07 12/08<br />
Top 10 Equity Holdings 12/31/08<br />
Security Description<br />
% of Net Assets<br />
Celgene Corp. 9.4%<br />
Apple, Inc. 8.3%<br />
Gilead Sciences, Inc. 7.5%<br />
CVS Caremark Corp. 5.3%<br />
Oracle Corp. 5.0%<br />
Cisco Systems, Inc. 4.4%<br />
Research In Motion, Ltd. 4.1%<br />
Precision Castparts Corp. 3.7%<br />
Monsanto Co. 3.3%<br />
Google, Inc. - Class A 3.1%<br />
Focused Appreciation Portfolio<br />
Russell 1000 Growth Index<br />
Average <strong>Annual</strong> Total Returns<br />
For Periods Ended December 31, 2008<br />
1 Year 5 Years<br />
Since<br />
Inception*<br />
Focused Appreciation Portfolio<br />
Russell 1000 Growth Index<br />
-40.01% 2.25%<br />
-38.44% -3.42%<br />
5.30%<br />
0.45%<br />
Lipper Variable Insurance Products<br />
(VIP) Large Cap Growth Funds<br />
Average -41.68% -3.80% –<br />
*Inception date of 5/1/03<br />
The performance data quoted represents past<br />
performance. Past performance is historical and does<br />
not guarantee future performance. Investment return<br />
and principal value will fluctuate, so that shares, when<br />
redeemed, may be worth more or less than their original<br />
cost. Current performance may be lower or higher than<br />
the performance data quoted. For the most recent<br />
month-end performance information visit<br />
www.nmfn.com.<br />
This chart assumes an initial investment of $10,000<br />
made on 5/1/03 (commencement of the Portfolio's<br />
operations). Returns shown reflect fee waivers,<br />
deductions for management and other portfolio<br />
expenses, and reinvestment of all dividends. In the<br />
absence of fee waivers, total return would be reduced.<br />
Returns exclude deductions for separte account sale<br />
loads and account fees. Please refer to the Benchmark<br />
Definitions section of this report for information about<br />
the indices cited in the above chart and graph.<br />
The Portfolio may hold fewer securities than other<br />
diversified portfolios because of its focused investment<br />
strategy. Holding fewer securities increases the risk that<br />
the value of the Portfolio could go down because of the<br />
poor performance of a single investment.<br />
Telecommunication<br />
Services<br />
5%<br />
Industrials<br />
5%<br />
Financials<br />
7%<br />
Consumer<br />
Staples<br />
8%<br />
Short-Term Investments<br />
& Other Net Assets<br />
18%<br />
Sector Allocation 12/31/08<br />
Materials<br />
3%<br />
Consumer Discretionary<br />
2%<br />
Sector Allocation is based on Net Assets.<br />
Sector Allocation and Top 10 Holdings are subject to<br />
change.<br />
Information<br />
Technology<br />
29%<br />
Health Care<br />
23%<br />
6 Focused Appreciation Portfolio
Focused Appreciation Portfolio<br />
<strong>Northwestern</strong> <strong>Mutual</strong> Series Fund, Inc.<br />
Schedule of Investments<br />
December 31, 2008<br />
Common Stocks (82.2%)<br />
Consumer Discretionary (2.1%)<br />
Shares/<br />
$ Par<br />
Value<br />
$ (000's)<br />
Boyd Gaming Corp. 210,825 997<br />
News Corp. - Class A 295,060 2,682<br />
Total 3,679<br />
Consumer Staples (8.2%)<br />
Bunge, Ltd. 95,235 4,930<br />
CVS Caremark Corp. 318,630 9,158<br />
Total 14,088<br />
Financials (7.5%)<br />
ACE, Ltd. 27,365 1,448<br />
CME Group, Inc. 21,550 4,485<br />
The Goldman Sachs Group,<br />
Inc. 15,015 1,267<br />
JPMorgan Chase & Co. 120,845 3,810<br />
Wells Fargo & Co. 60,510 1,784<br />
Total 12,794<br />
Health Care (22.7%)<br />
Alcon, Inc. 37,845 3,375<br />
* Celgene Corp. 292,870 16,190<br />
* Genentech, Inc. 18,095 1,500<br />
* Gilead Sciences, Inc. 251,930 12,884<br />
* Intuitive Surgical, Inc. 16,660 2,116<br />
UnitedHealth Group, Inc. 107,695 2,865<br />
Total 38,930<br />
Industrials (5.0%)<br />
Precision Castparts Corp. 107,735 6,408<br />
United Parcel Service, Inc.<br />
- Class B 40,215 2,218<br />
Total 8,626<br />
Information Technology (28.5%)<br />
* Akamai Technologies, Inc. 111,163 1,677<br />
* Apple, Inc. 166,493 14,210<br />
* Cisco Systems, Inc. 460,100 7,500<br />
Corning, Inc. 321,715 3,066<br />
* Electronic Arts, Inc. 89,900 1,442<br />
* Google, Inc. - Class A 17,415 5,358<br />
* Oracle Corp. 487,100 8,636<br />
* Research In Motion, Ltd. 172,750 7,010<br />
Total 48,899<br />
Materials (3.4%)<br />
Companhia Vale do Rio<br />
Doce, ADR 23,980 291<br />
Monsanto Co. 79,265 5,576<br />
Total 5,867<br />
Telecommunication Services (4.8%)<br />
* America Movil - ADR,<br />
Series L 132,270 4,099<br />
* Crown Castle International<br />
Corp. 109,700 1,928<br />
Common Stocks (82.2%)<br />
Shares/ Value<br />
$ Par $ (000's)<br />
Telecommunication Services continued<br />
* tw telecom, Inc. 256,385 2,172<br />
Total 8,199<br />
Total Common Stocks<br />
(Cost: $184,325) 141,082<br />
Short-Term Investments (17.6%)<br />
Aircraft (0.7%)<br />
Kitty Hawk Funding Corp.,<br />
0.40%, 1/15/09 1,200,000 1,200<br />
Total 1,200<br />
Energy (0.7%)<br />
Sempra Global,<br />
1.50%, 1/13/09 1,200,000 1,199<br />
Total 1,199<br />
Federal Government & Agencies (10.2%)<br />
Federal Home Loan Bank,<br />
0.07%, 1/22/09 4,500,000 4,500<br />
Federal Home Loan Bank,<br />
0.10%, 2/12/09 3,600,000 3,600<br />
Federal Home Loan Bank,<br />
0.10%, 2/13/09 4,300,000 4,299<br />
Federal Home Loan Bank,<br />
0.15%, 3/13/09 1,900,000 1,899<br />
Federal Home Loan Bank,<br />
0.28%, 1/16/09 2,900,000 2,900<br />
Federal Home Loan Bank,<br />
0.38%, 1/15/09 100,000 100<br />
Total 17,298<br />
Finance Lessors (0.7%)<br />
Thunder Bay Funding<br />
LLC, 0.95%, 1/14/09 1,200,000 1,200<br />
Total 1,200<br />
Finance Services (2.9%)<br />
Alpine Securitization<br />
Corp., 1.35%, 1/7/09 1,200,000 1,200<br />
Atlantic Asset<br />
Securitization LLC,<br />
0.80%, 1/12/09 1,400,000 1,399<br />
Barton Capital LLC,<br />
0.30%, 1/9/09 1,200,000 1,200<br />
Gemini Securitization<br />
Corp. LLC,<br />
1.50%, 1/20/09 1,200,000 1,199<br />
Total 4,998<br />
Miscellaneous Business Credit Institutions<br />
(1.7%)<br />
Duke Energy Corp.,<br />
4.00%, 1/5/09 3,000,000 2,999<br />
Total 2,999<br />
Short-Term Investments<br />
(17.6%)<br />
Shares/<br />
$ Par<br />
Personal Credit Institutions (0.7%)<br />
Value<br />
$ (000's)<br />
HSBC Finance Corp.,<br />
1.50%, 1/8/09 1,200,000 1,200<br />
Total 1,200<br />
Total Short-Term Investments<br />
(Cost: $30,093) 30,094<br />
Total Investments (99.8%)<br />
(Cost: $214,418)(a) 171,176<br />
Other Assets, Less<br />
Liabilities (0.2%) 375<br />
Net Assets (100.0%) 171,551<br />
* Non-Income Producing<br />
(a)<br />
(l)<br />
ADR after the name of a security represents<br />
—American Depositary Receipt.<br />
At December 31, 2008 the aggregate cost of<br />
securities for federal tax purposes (in<br />
thousands) was $216,074 and the net<br />
unrealized depreciation of investments based<br />
on that cost was $44,898 which is comprised<br />
of $3,906 aggregate gross unrealized<br />
appreciation and $48,804 aggregate gross<br />
unrealized depreciation.<br />
As of December 31, 2008, portfolio<br />
securities with an aggregate value of<br />
$1,448 (in thousands) were fair valued<br />
under procedures adopted by the Board of<br />
Directors.<br />
The Accompanying Notes are an Integral Part of the Financial Statements.<br />
Focused Appreciation Portfolio 7
Large Cap Core Stock Portfolio<br />
Objective: Portfolio Strategy: Net Assets:<br />
Long-term growth of capital and income. Invest primarily in equity securities of large U.S. companies. $311 million<br />
Portfolio Overview<br />
Mason Street Advisors acts as the investment adviser for the Large Cap Core Stock Portfolio. The Portfolio seeks long-term<br />
growth of capital and income. The Portfolio seeks to achieve these objectives primarily by investing in the equity securities of<br />
companies selected for their high quality and growth potential. The Portfolio’s holdings will consist primarily of equity<br />
securities of large companies that may include both “growth” and “value” stocks. The Portfolio’s strategy is to actively<br />
manage a portfolio of selected equity securities with a goal of outperforming the total return of the S&P 500 ® Index. The<br />
Portfolio attempts to reduce risk by investing in many different economic sectors, industries and companies. The Portfolio’s<br />
manager may underweight or overweight selected economic sectors against the sector weightings of the S&P 500 ® Index to<br />
seek to enhance the Portfolio’s total return or reduce fluctuations in market value relative to the S&P 500 ® Index.<br />
Market Overview<br />
Financial markets endured a brutal 2008, which saw the failure of a number of leading financial institutions, credit markets<br />
freeze up, and the U.S. government take a series of extraordinary steps to support the economy and financial system. The crisis<br />
was a result of the ongoing sub-prime mortgage meltdown, which spread rapidly through the domestic financial sector and into<br />
virtually every segment of global financial markets. For all of 2008, returns for large-, medium- and small-sized companies<br />
were –37.60%, –41.46% and –33.79%, as measured by the Russell 1000, Russell MidCap and Russell 2000 Stock Indices,<br />
respectively. No sector of the market had positive returns for the year, and value-oriented stocks held up modestly better than<br />
growth stocks, as measured by the Russell style indices.<br />
Portfolio Results<br />
The Large Cap Core Stock Portfolio returned –38.74% for all of 2008. By comparison, the S&P 500 ® Index returned –37.00%.<br />
(This Index is unmanaged, cannot be invested in directly, and does not include administrative expenses or sales charges.) The<br />
Portfolio’s Large-Cap Core Funds peer group average return was –38.76%, according to Lipper Analytical Services, Inc., an<br />
independent mutual fund ranking agency.<br />
The Portfolio’s absolute return reflected the unprecedented turmoil affecting the economy and financial markets in what was<br />
the worst year for stocks since the Great Depression. In that environment, no sector contributed positively to results. Relative<br />
to the benchmark, the Portfolio’s underperformance was driven by positioning in the Energy and Industrials sectors. The<br />
leading contribution to relative return by far came from positioning in the Health Care sector.<br />
Relative to the benchmark, Energy shares detracted most, behind an underweight position in the big, integrated oil companies<br />
and an overweight to the equipment and services names. We favor the long-term industry dynamics and structural position of<br />
the service companies relative to the integrateds. Unfortunately, that positioning detracted during 2008, as the diversified oil<br />
companies held up better than the oil services firms. The leading detractors in this space were an underweight position in<br />
Exxon Mobil, and an overweight to equipment and services firm National Oilwell Varco.<br />
Another source of weakness was positioning in the Industrials sector. The leading detractors were manufacturers and parts<br />
suppliers tied to the market for commercial airliners and business jets. These were Textron and Spirit AeroSystems Holdings.<br />
We liked the backlog and book of business these companies touted; nevertheless, investors worried that slower economic<br />
growth would throttle demand for commercial jets.<br />
At the other end of the spectrum, our stock selection was most effective in the Health Care sector, behind positioning in the<br />
biotechnology segment. We favor biotechnology shares over big pharmaceutical names because biotech stocks tend not to<br />
have the same worries as pharma about patent expiries, generic competition, and modest new drug pipelines. The leading<br />
contributors in biotech were Gilead Sciences and Celgene. Gilead is the dominant player in the market for AIDS drugs, while<br />
Celgene offers best-in-class cancer drugs gaining approval for new applications.<br />
However, performance in the Health Care sector would have been better but for our underweight to pharmaceutical shares.<br />
These stocks generally held up well in 2008 because many investors viewed them as large, liquid safe haven plays.<br />
Nevertheless, our stake in Teva Pharmaceutical—a leading generic provider that has the potential to benefit from the<br />
increasing importance of generics in the health care industry—was a key contributor for the year. Selection and allocation<br />
decisions also contributed to relative results in the Telecommunication Services, Utilities, and Materials sectors.<br />
8 Large Cap Core Stock Portfolio
Large Cap Core Stock Portfolio<br />
Outlook<br />
After the unprecedented events of 2008, we have a somewhat hopeful outlook for 2009—we are hoping for the reemergence of<br />
a more rational, less volatile market environment where fundamentals matter again. Unfortunately, the economic fundamentals<br />
remain challenging, and it is difficult to see a quick rebound in growth and earnings. Nevertheless, we believe the dramatic<br />
sell-off has created some tremendous investment opportunities. In that regard, we’re likely to trim our Health Care stake,<br />
which did relatively well, and look for opportunities to put that money to work in the most beaten-up segments of the market.<br />
We will continue to perform careful analysis and selectively add companies in out-of-favor sectors that we feel have the best<br />
potential to position the Portfolio to benefit from an eventual recovery.<br />
Relative Performance<br />
$15,000<br />
10,000<br />
5,000<br />
0<br />
12/98 12/00 12/02 12/04 12/06 12/08<br />
Top 10 Equity Holdings 12/31/08<br />
Security Description<br />
% of Net Assets<br />
Exxon Mobil Corp. 3.6%<br />
Microsoft Corp. 2.3%<br />
Chevron Corp. 2.1%<br />
AT&T, Inc. 2.0%<br />
Wal-Mart Stores, Inc. 1.9%<br />
Baxter International, Inc. 1.9%<br />
JPMorgan Chase & Co. 1.8%<br />
General Electric Co. 1.7%<br />
Wells Fargo & Co. 1.7%<br />
CVS Caremark Corp. 1.7%<br />
Large Cap Core Stock Portfolio<br />
S&P 500 Index<br />
Average <strong>Annual</strong> Total Returns<br />
For Periods Ended December 31, 2008<br />
1 Year 5 Years 10 Years<br />
Large Cap Core Stock Portfolio<br />
S&P 500 Index<br />
-38.74% -2.65%<br />
-37.00% -2.19%<br />
-3.26%<br />
-1.38%<br />
Lipper Variable Insurance Products<br />
(VIP) Large Cap Core Funds<br />
Average -38.76% -2.79% -1.46%<br />
The performance data quoted represents past<br />
performance. Past performance is historical and does<br />
not guarantee future performance. Investment return<br />
and principal value will fluctuate, so that shares, when<br />
redeemed, may be worth more or less than their original<br />
cost. Current performance may be lower or higher than<br />
the performance data quoted. For the most recent<br />
month-end performance information visit<br />
www.nmfn.com.<br />
This chart assumes an initial investment of $10,000<br />
made on 12/31/98. Returns shown include deductions<br />
for management and other portfolio expenses, and<br />
reinvestment of all dividends. Returns exclude<br />
deductions for separte account sale loads and account<br />
fees. Please refer to the Benchmark Definitions section<br />
of this report for information about the indices cited in<br />
the above chart and graph.<br />
Utilities<br />
2%<br />
Telecommunication<br />
Services<br />
4%<br />
Short-Term Investments<br />
& Other Net Assets<br />
7%<br />
Consumer<br />
Discretionary<br />
8%<br />
Industrials<br />
9%<br />
Financials<br />
11%<br />
Sector Allocation 12/31/08<br />
Other Holdings<br />
1%<br />
Information<br />
Technology<br />
17%<br />
Health Care<br />
14%<br />
Sector Allocation is based on Net Assets.<br />
Sector Allocation and Top 10 Holdings are subject to<br />
change.<br />
Materials<br />
2%<br />
Consumer<br />
Staples<br />
13%<br />
Energy<br />
12%<br />
Large Cap Core Stock Portfolio 9
Large Cap Core Stock Portfolio<br />
<strong>Northwestern</strong> <strong>Mutual</strong> Series Fund, Inc.<br />
Schedule of Investments<br />
December 31, 2008<br />
Common Stocks (92.9%)<br />
Shares/<br />
$ Par<br />
Consumer Discretionary (8.0%)<br />
Value<br />
$ (000's)<br />
Abercrombie & Fitch<br />
Co. - Class A 37,500 865<br />
* Amazon.com, Inc. 13,900 713<br />
Comcast Corp. - Class A 282,900 4,775<br />
The Home Depot, Inc. 31,500 725<br />
Johnson Controls, Inc. 88,400 1,605<br />
* Kohl's Corp. 102,000 3,692<br />
Lowe's Cos., Inc. 120,900 2,602<br />
McDonald's Corp. 27,700 1,723<br />
The McGraw-Hill Cos.,<br />
Inc. 99,700 2,312<br />
NIKE, Inc. - Class B 54,700 2,790<br />
Omnicom Group, Inc. 65,800 1,771<br />
Target Corp. 34,400 1,188<br />
Total 24,761<br />
Consumer Staples (12.7%)<br />
Avon Products, Inc. 105,800 2,542<br />
The Coca-Cola Co. 73,200 3,314<br />
CVS Caremark Corp. 185,522 5,332<br />
* Energizer Holdings, Inc. 37,500 2,030<br />
* Hansen Natural Corp. 91,100 3,055<br />
The Kroger Co. 161,800 4,273<br />
PepsiCo, Inc. 57,700 3,160<br />
Philip Morris<br />
International, Inc. 115,500 5,026<br />
The Procter & Gamble<br />
Co. 75,362 4,659<br />
Wal-Mart Stores, Inc. 107,100 6,004<br />
Total 39,395<br />
Energy (11.9%)<br />
* Cameron International<br />
Corp. 64,900 1,331<br />
Chevron Corp. 89,700 6,635<br />
ConocoPhillips 54,888 2,843<br />
Diamond Offshore<br />
Drilling, Inc. 16,900 996<br />
Exxon Mobil Corp. 139,100 11,104<br />
Halliburton Co. 87,300 1,587<br />
Hess Corp. 19,900 1,068<br />
* National-Oilwell Varco,<br />
Inc. 86,700 2,119<br />
Occidental Petroleum<br />
Corp. 22,000 1,320<br />
* SandRidge Energy, Inc. 18,800 116<br />
Schlumberger, Ltd. 46,900 1,985<br />
* Southwestern Energy<br />
Co. 69,700 2,019<br />
* Transocean, Ltd. 21,300 1,006<br />
XTO Energy, Inc. 82,650 2,915<br />
Total 37,044<br />
Financials (10.9%)<br />
American Express Co. 53,900 1,000<br />
Common Stocks (92.9%)<br />
Shares/<br />
$ Par<br />
Value<br />
$ (000's)<br />
Financials continued<br />
Bank of America Corp. 139,357 1,962<br />
The Bank of New York<br />
Mellon Corp. 52,200 1,479<br />
Citigroup, Inc. 166,900 1,120<br />
CME Group, Inc. 7,200 1,498<br />
The Goldman Sachs<br />
Group, Inc. 15,300 1,291<br />
JPMorgan Chase & Co. 180,296 5,684<br />
Merrill Lynch & Co.,<br />
Inc. 154,800 1,802<br />
National City Corp. 671,700 1,216<br />
Prudential Financial, Inc. 65,100 1,970<br />
State Street Corp. 76,500 3,009<br />
T. Rowe Price Group,<br />
Inc. 49,400 1,751<br />
The Travelers<br />
Companies, Inc. 107,800 4,872<br />
Wells Fargo & Co. 181,000 5,336<br />
Total 33,990<br />
Health Care (14.0%)<br />
Abbott Laboratories 97,200 5,188<br />
Aetna, Inc. 63,800 1,818<br />
Allergan, Inc. 63,300 2,552<br />
Baxter International, Inc. 107,000 5,734<br />
Bristol-Myers Squibb<br />
Co. 75,000 1,744<br />
Cardinal Health, Inc. 29,400 1,013<br />
* Celgene Corp. 60,095 3,322<br />
* Express Scripts, Inc. 27,700 1,523<br />
* Genentech, Inc. 10,900 904<br />
* Genzyme Corp. 42,200 2,801<br />
* Gilead Sciences, Inc. 80,600 4,122<br />
Johnson & Johnson 74,400 4,451<br />
* Medco Health Solutions,<br />
Inc. 59,600 2,498<br />
Teva Pharmaceutical<br />
Industries, Ltd., ADR 79,900 3,401<br />
UnitedHealth Group,<br />
Inc. 88,100 2,344<br />
Total 43,415<br />
Industrials (9.2%)<br />
Danaher Corp. 28,200 1,596<br />
Deere & Co. 34,300 1,314<br />
FedEx Corp. 26,800 1,719<br />
* Foster Wheeler, Ltd. 62,500 1,461<br />
General Electric Co. 334,500 5,419<br />
Honeywell International,<br />
Inc. 64,990 2,134<br />
Lockheed Martin Corp. 13,100 1,102<br />
Norfolk Southern Corp. 60,200 2,833<br />
Raytheon Co. 49,200 2,511<br />
* Spirit AeroSystems<br />
Holdings, Inc. - Class A 138,800 1,412<br />
Textron, Inc. 52,300 725<br />
Common Stocks (92.9%)<br />
Shares/<br />
$ Par<br />
Value<br />
$ (000's)<br />
Industrials continued<br />
Union Pacific Corp. 67,100 3,207<br />
United Parcel Service,<br />
Inc. - Class B 19,400 1,070<br />
United Technologies<br />
Corp. 37,800 2,026<br />
Total 28,529<br />
Information Technology (16.9%)<br />
Accenture, Ltd. - Class<br />
A 52,600 1,725<br />
* Apple, Inc. 38,600 3,295<br />
Applied Materials, Inc. 49,300 499<br />
* Broadcom Corp. - Class<br />
A 100,350 1,703<br />
* Cisco Systems, Inc. 245,900 4,008<br />
Corning, Inc. 134,600 1,283<br />
* Electronic Arts, Inc. 64,400 1,033<br />
* Google, Inc. - Class A 14,400 4,430<br />
Hewlett-Packard Co. 140,900 5,113<br />
Intel Corp. 333,400 4,888<br />
International Business<br />
Machines Corp. 63,100 5,311<br />
Intersil Corp. - Class A 61,600 566<br />
* MEMC Electronic<br />
Materials, Inc. 53,600 765<br />
Microsoft Corp. 366,300 7,121<br />
* Oracle Corp. 269,700 4,782<br />
QUALCOMM, Inc. 128,500 4,604<br />
Visa, Inc. - Class A 25,900 1,358<br />
Total 52,484<br />
Materials (2.2%)<br />
Ecolab, Inc. 40,700 1,431<br />
Freeport-McMoRan<br />
Copper & Gold, Inc. 41,800 1,021<br />
Monsanto Co. 38,900 2,737<br />
Praxair, Inc. 25,300 1,502<br />
Total 6,691<br />
Other Holdings (0.9%)<br />
Financial Select Sector<br />
SPDR Fund 120,500 1,521<br />
SPDR KBW Bank 65,000 1,423<br />
Total 2,944<br />
Telecommunication Services (4.0%)<br />
* American Tower Corp. -<br />
Class A 75,600 2,217<br />
AT&T, Inc. 219,900 6,267<br />
Verizon<br />
Communications, Inc. 118,600 4,020<br />
Total 12,504<br />
Utilities (2.2%)<br />
Exelon Corp. 43,100 2,397<br />
The Accompanying Notes are an Integral Part of the Financial Statements.<br />
10 Large Cap Core Stock Portfolio
Large Cap Core Stock Portfolio<br />
Common Stocks (92.9%)<br />
Shares/<br />
$ Par<br />
Value<br />
$ (000's)<br />
Utilities continued<br />
FPL Group, Inc. 89,900 4,524<br />
Total 6,921<br />
Total Common Stocks<br />
(Cost: $368,907) 288,678<br />
Short-Term Investments (7.0%)<br />
Federal Government & Agencies (0.7%)<br />
Federal Home Loan<br />
Bank, 0.15%, 3/13/09 1,000,000 1,000<br />
(b) Federal Home Loan<br />
Bank, 0.47%, 3/13/09 1,000,000 1,000<br />
Total 2,000<br />
Finance Services (3.2%)<br />
Gemini Securitization<br />
Corp. LLC,<br />
0.70%, 1/15/09 10,000,000 9,997<br />
Total 9,997<br />
Oil and Gas (3.1%)<br />
Devon Energy Corp.,<br />
0.95%, 1/2/09 9,700,000 9,700<br />
Total 9,700<br />
Total Short-Term Investments<br />
(Cost: $21,696) 21,697<br />
Total Investments (99.9%)<br />
(Cost: $390,603)(a) 310,375<br />
Other Assets, Less<br />
Liabilities (0.1%) 290<br />
Net Assets (100.0%) 310,665<br />
* Non-Income Producing<br />
ADR after the name of a security represents—American Depositary Receipt.<br />
(a)<br />
(b)<br />
At December 31, 2008 the aggregate cost of securities for federal tax purposes (in thousands) was $392,631 and the net unrealized depreciation of<br />
investments based on that cost was $82,256 which is comprised of $18,466 aggregate gross unrealized appreciation and $100,722 aggregate gross unrealized<br />
depreciation.<br />
All or a portion of the securities have been committed as collateral for open futures positions or when-issued securities. Information regarding open futures<br />
contracts as of period end is summarized below.<br />
Unrealized<br />
Appreciation/<br />
Number of<br />
(Depreciation)<br />
Issuer (000's)<br />
Contracts Expiration Date (000's)<br />
S&P 500 Index Futures (Long) (Total Notional Value at December 31, 2008, $10,724) 47 3/09 $ (148)<br />
The Accompanying Notes are an Integral Part of the Financial Statements.<br />
Large Cap Core Stock Portfolio 11
Large Cap Blend Portfolio<br />
Objective: Portfolio Strategy: Net Assets:<br />
Long-term growth of capital and income. Invest primarily in equity and equity-related securities of $29 million<br />
large U.S. companies.<br />
Portfolio Overview<br />
Mason Street Advisors, the investment adviser for the Large Cap Blend Portfolio, has engaged Capital Guardian Trust<br />
Company to act as sub-adviser for the Portfolio. The Portfolio objectives are long-term growth of capital and income. The<br />
Portfolio seeks to meet these objectives by investing at least 80% of its net assets (plus any borrowing for investment<br />
purposes), in equity and equity-related securities of U.S. large-capitalization companies, defined as those with a market<br />
capitalization range, at the time of investment, equal to that of the Portfolio’s benchmark, the S&P 500 ® Index. In selecting<br />
investments, greater consideration is given to potential appreciation and future dividends than to current income. The Large<br />
Cap Blend portfolio uses a multiple portfolio manager system in managing the Fund’s assets. Under this approach, the<br />
Portfolio is divided into segments managed by individual managers. Each manager’s role is to decide how their respective<br />
segment will be invested by selecting securities within the limits of the Portfolio’s objectives and policies.<br />
Market Overview<br />
Financial markets endured a brutal 2008, which saw the failure of a number of leading financial institutions, credit markets<br />
freeze up and the U.S. government take a series of extraordinary steps to support the economy and financial system. The crisis<br />
was a result of the ongoing sub-prime mortgage meltdown, which spread rapidly through the domestic financial sector and into<br />
virtually every segment of global financial markets. For the twelve months ended December 31, 2008, returns for large-,<br />
medium- and small-sized companies were –37.60%, –41.46% and –33.79%, as measured by the Russell 1000, Russell MidCap<br />
and Russell 2000 Stock Indices, respectively. No sector of the market had positive returns for the year, and value-oriented<br />
stocks held up modestly better than growth stocks, as measured by the Russell style indices.<br />
Portfolio Results<br />
The Large Cap Blend Portfolio returned –40.25% for the twelve months ended December 31, 2008. By comparison, the S&P<br />
500 ® Index returned –37.00%. (This Index is unmanaged, cannot be invested in directly and does not include administrative<br />
expenses or sales charges.) According to Lipper Analytical Services, Inc., an independent mutual fund ranking agency, the<br />
average return of the Large-Cap Core Funds peer group was<br />
–38.76%.<br />
The Portfolio’s absolute return reflected the unprecedented turmoil affecting the economy and financial markets in what was<br />
the worst year for stocks since the Great Depression. In that environment, no sector managed positive results. Relative to the<br />
benchmark, the Portfolio’s underperformance was driven by positioning in the Financials and Consumer Discretionary sectors.<br />
The leading contribution to relative return came from the Health Care sector.<br />
Stock choices in the Financials sector detracted most from relative results, as the Portfolio was hurt by exposure to a number<br />
of companies hit hard by the credit crisis. In past financial crises, high quality, large-cap financials earned their way out of<br />
challenging economic and credit environments, and our analysis of several financial companies suggested the same could<br />
happen this time. Unfortunately, we did not anticipate the depth and speed of the deterioration in fundamentals in the current<br />
crisis. As a result, four of the top five detractors from relative results were Fannie Mae, Freddie Mac, Lehman Brothers and<br />
Wachovia. On a positive note, a number of our stock picks in the sector worked well, as overweight positions in JPMorgan<br />
Chase, Wells Fargo and Hudson City Bancorp were all top ten contributors for the year.<br />
Another source of weakness was stock selection in the Consumer Discretionary sector. Gaming stock Las Vegas Sands, media<br />
giant Gannett and fast food icon McDonald’s were leading detractors. It hurt to be underrepresented in shares of McDonald’s,<br />
which we thought were expensive; nevertheless, the company benefited as tough economic times sent more cost-conscious<br />
diners through its doors. Overweight positions in Las Vegas Sands and Gannett detracted largely because of worries about the<br />
effect of slower economic growth on revenues. Las Vegas Sands faced additional concerns that recent anti-gambling policies<br />
enacted by the Chinese government would hurt business at a key property.<br />
The largest contribution to relative return came from an overweight position and stock selection in the Health Care sector,<br />
particularly biotechnology shares. We favored biotechnology companies because they tend to be dynamic and innovative with<br />
solid growth prospects, in contrast to big pharmaceutical firms, which often face worries about patent expirations and generic<br />
competition. Biotechnology shares benefited from takeover activity as pharmaceutical firms sought to bolster their new drug<br />
pipelines, which explains the outperformance of Genentech, ImClone Systems and Millennium Pharmaceuticals, which were<br />
all either acquired or the subject of buyout offers in 2008.<br />
Outlook<br />
We will continue our focus on leading large-cap companies demonstrating growth potential whose shares are trading at<br />
attractive valuations. One positive lesson from a very difficult 2008 is that we are now finding a great many high quality<br />
12 Large Cap Blend Portfolio
Large Cap Blend Portfolio<br />
companies trading at compelling levels. And while it is impossible to know when economic and market conditions will turn,<br />
we are using this opportunity to attempt to position the Portfolio for outperformance by adding what we believe to be well-run,<br />
attractively valued companies at knock-down prices. Because the Portfolio is built from the bottom up, our sector and industry<br />
allocations reflect where we’re finding the best investment opportunities at a given time. As of December 31, 2008, the largest<br />
sector overweight was in Health Care, while the most notable sector underweight was in Energy.<br />
Relative Performance<br />
$11,000<br />
10,000<br />
9,000<br />
8,000<br />
7,000<br />
6,000<br />
5,000<br />
4/07 12/07 12/08<br />
Top 10 Equity Holdings 12/31/08<br />
Security Description<br />
% of Net Assets<br />
General Electric Co. 2.9%<br />
United Parcel Service, Inc. - Class B 2.7%<br />
Google, Inc. - Class A 2.7%<br />
JPMorgan Chase & Co. 2.6%<br />
PepsiCo, Inc. 2.5%<br />
Baxter International, Inc. 2.4%<br />
Genentech, Inc. 2.3%<br />
Celgene Corp. 2.3%<br />
Philip Morris International, Inc. 2.2%<br />
Kraft Foods, Inc. - Class A 2.2%<br />
Large Cap Blend Portfolio<br />
S&P 500 Index<br />
Average <strong>Annual</strong> Total Returns<br />
For Periods Ended December 31, 2008<br />
1 Year<br />
Since<br />
Inception*<br />
Large Cap Blend Portfolio<br />
S&P 500 Index<br />
-40.25%<br />
-37.00%<br />
-29.42%<br />
-23.95%<br />
Lipper Variable Insurance Products<br />
(VIP) Large Cap Core Funds<br />
Average -38.76% –<br />
*Inception date of 4/30/07<br />
The performance data quoted represents past<br />
performance. Past performance is historical and does<br />
not guarantee future performance. Investment return<br />
and principal value will fluctuate, so that shares, when<br />
redeemed, may be worth more or less than their original<br />
cost. Current performance may be lower or higher than<br />
the performance data quoted. For the most recent<br />
month-end performance information visit<br />
www.nmfn.com.<br />
This chart assumes an initial investment of $10,000<br />
made on 4/30/07 (commencement of the Portfolio's<br />
operations). Returns shown reflect fee waivers,<br />
deductions for management and other portfolio<br />
expenses, and reinvestment of all dividends. In the<br />
absence of fee waivers, total return would be reduced.<br />
Returns exclude deductions for separte account sale<br />
loads and account fees. Please refer to the Benchmark<br />
Definitions section of this report for information about<br />
the indices cited in the above chart and graph.<br />
Other Holdings<br />
1%<br />
Telecommunication<br />
Services<br />
3%<br />
Materials<br />
5%<br />
Energy<br />
10%<br />
Financials<br />
11%<br />
Consumer<br />
Discretionary<br />
12%<br />
Sector Allocation 12/31/08<br />
Utilities<br />
1%<br />
Short-Term Investments<br />
& Other Net Assets<br />
1%<br />
Health Care<br />
17%<br />
Sector Allocation is based on Net Assets.<br />
Sector Allocation and Top 10 Holdings are subject to<br />
change.<br />
Information<br />
Technology<br />
15%<br />
Industrials<br />
12%<br />
Consumer<br />
Staples<br />
12%<br />
Large Cap Blend Portfolio 13
Large Cap Blend Portfolio<br />
<strong>Northwestern</strong> <strong>Mutual</strong> Series Fund, Inc.<br />
Schedule of Investments<br />
December 31, 2008<br />
Common Stocks (96.2%)<br />
Shares/<br />
$ Par<br />
Consumer Discretionary (11.6%)<br />
Value<br />
$ (000's)<br />
* Apollo Group, Inc. - Class<br />
A 2,800 215<br />
Best Buy Co., Inc. 5,100 143<br />
Carnival Corp. 6,100 148<br />
CBS Corp. - Class B 16,600 136<br />
* Coach, Inc. 1,400 29<br />
Comcast Corp. - Class A 5,100 86<br />
Gannett Co., Inc. 8,100 65<br />
* Hanesbrands, Inc. 10,000 127<br />
The Home Depot, Inc. 5,500 127<br />
Honda Motor Co., Ltd.,<br />
ADR 6,100 130<br />
Johnson Controls, Inc. 3,500 64<br />
* Las Vegas Sands Corp. 10,900 65<br />
Lowe's Cos., Inc. 6,700 144<br />
Nordstrom, Inc. 8,300 110<br />
Omnicom Group, Inc. 11,200 302<br />
Target Corp. 18,700 646<br />
* Time Warner Cable, Inc. -<br />
Class A 8,300 178<br />
Time Warner, Inc. 7,700 77<br />
* Urban Outfitters, Inc. 4,800 72<br />
* Viacom, Inc. - Class B 5,500 105<br />
The Walt Disney Co. 15,900 361<br />
* Wynn Resorts, Ltd. 1,800 76<br />
Total 3,406<br />
Consumer Staples (11.8%)<br />
Altria Group, Inc. 17,500 264<br />
The Coca-Cola Co. 3,382 153<br />
Costco Wholesale Corp. 1,800 95<br />
* Energizer Holdings, Inc. 800 43<br />
Kimberly-Clark Corp. 1,400 74<br />
Kraft Foods, Inc. - Class A 24,300 652<br />
PepsiCo, Inc. 13,200 723<br />
Philip Morris International,<br />
Inc. 15,100 657<br />
Sara Lee Corp. 46,100 451<br />
Unilever NV 3,900 96<br />
Wal-Mart Stores, Inc. 4,300 241<br />
Total 3,449<br />
Energy (6.7%)<br />
Anadarko Petroleum Corp. 2,200 85<br />
Baker Hughes, Inc. 1,700 55<br />
Chevron Corp. 4,100 303<br />
ConocoPhillips 3,500 181<br />
EOG Resources, Inc. 800 53<br />
Exxon Mobil Corp. 3,400 271<br />
Kinder Morgan<br />
Management, LLC. 1,532 61<br />
Marathon Oil Corp. 12,200 334<br />
Royal Dutch Shell PLC -<br />
Class A, ADR 3,300 175<br />
Common Stocks (96.2%)<br />
Shares/ Value<br />
$ Par $ (000's)<br />
Energy continued<br />
Royal Dutch Shell PLC -<br />
Class B, ADR 1,100 57<br />
Schlumberger, Ltd. 8,300 351<br />
The Williams Companies,<br />
Inc. 3,100 45<br />
Total 1,971<br />
Financials (11.6%)<br />
ACE, Ltd. 1,700 90<br />
Aflac, Inc. 4,000 183<br />
Astoria Financial Corp. 4,500 74<br />
Bank of America Corp. 2,500 35<br />
* Berkshire Hathaway, Inc. -<br />
Class A 2 193<br />
The Goldman Sachs Group,<br />
Inc. 7,300 616<br />
Hudson City Bancorp, Inc. 27,000 431<br />
JPMorgan Chase & Co. 24,300 766<br />
Mercury General Corp. 400 19<br />
The Progressive Corp. 14,900 221<br />
RenaissanceRe Holdings,<br />
Ltd. 700 36<br />
SunTrust Banks, Inc. 500 15<br />
T. Rowe Price Group, Inc. 2,200 78<br />
Wells Fargo & Co. 21,900 646<br />
Total 3,403<br />
Health Care (17.5%)<br />
Abbott Laboratories 9,100 486<br />
Aetna, Inc. 300 9<br />
Allergan, Inc. 10,300 415<br />
AstraZeneca PLC, ADR 4,400 181<br />
Baxter International, Inc. 13,300 713<br />
* BioMarin Pharmaceutical,<br />
Inc. 2,900 52<br />
Cardinal Health, Inc. 7,900 272<br />
* Celgene Corp. 12,000 663<br />
* Cerner Corp. 5,000 192<br />
* DaVita, Inc. 9,400 466<br />
* Forest Laboratories, Inc. 5,100 130<br />
* Genentech, Inc. 8,300 688<br />
* Gilead Sciences, Inc. 2,500 128<br />
* Health Net, Inc. 1,300 14<br />
Medtronic, Inc. 4,900 154<br />
Pfizer, Inc. 4,800 85<br />
Sanofi-Aventis, ADR 2,700 87<br />
Teva Pharmaceutical<br />
Industries, Ltd., ADR 4,400 187<br />
UnitedHealth Group, Inc. 8,700 231<br />
Total 5,153<br />
Industrials (11.9%)<br />
Cooper Industries, Ltd. -<br />
Class A 1,300 38<br />
Danaher Corp. 1,350 76<br />
Emerson Electric Co. 2,500 92<br />
Common Stocks (96.2%)<br />
Shares/ Value<br />
$ Par $ (000's)<br />
Industrials continued<br />
FedEx Corp. 1,700 109<br />
* First Solar, Inc. 1,200 166<br />
Fluor Corp. 9,100 408<br />
General Electric Co. 52,700 854<br />
Illinois Tool Works, Inc. 7,300 256<br />
* Iron Mountain, Inc. 2,000 49<br />
* Jacobs Engineering Group,<br />
Inc. 1,000 48<br />
* Monster Worldwide, Inc. 6,200 75<br />
Southwest Airlines Co. 13,100 113<br />
Union Pacific Corp. 1,800 86<br />
United Parcel Service, Inc.<br />
- Class B 14,400 794<br />
United Technologies Corp. 6,400 343<br />
Total 3,507<br />
Information Technology (14.8%)<br />
* Adobe Systems, Inc. 5,400 115<br />
* Agilent Technologies, Inc. 7,400 116<br />
* Apple, Inc. 2,800 239<br />
* Brocade Communications<br />
Systems, Inc. 45,900 129<br />
* Cisco Systems, Inc. 31,800 518<br />
* Cognizant Technology<br />
Solutions Corp. - Class A 4,100 74<br />
* Dell, Inc. 7,300 75<br />
* eBay, Inc. 4,400 61<br />
* Flextronics International,<br />
Ltd. 14,500 37<br />
* Google, Inc. - Class A 2,550 785<br />
Hewlett-Packard Co. 3,400 123<br />
Intel Corp. 4,800 70<br />
International Business<br />
Machines Corp. 1,200 101<br />
Jabil Circuit, Inc. 20,100 136<br />
KLA-Tencor Corp. 7,000 153<br />
* Lam Research Corp. 1,900 41<br />
Microchip Technology, Inc. 3,400 66<br />
Microsoft Corp. 13,600 264<br />
* NetApp, Inc. 5,300 74<br />
Nintendo Co., Ltd., ADR 3,500 167<br />
* Oracle Corp. 2,900 51<br />
Paychex, Inc. 10,100 265<br />
* Polycom, Inc. 7,200 97<br />
QUALCOMM, Inc. 10,700 383<br />
Visa, Inc. - Class A 1,000 53<br />
* Yahoo!, Inc. 12,500 153<br />
Total 4,346<br />
Materials (5.3%)<br />
Allegheny Technologies,<br />
Inc. 7,700 196<br />
Barrick Gold Corp. 12,800 471<br />
Celanese Corp. 1,400 17<br />
Cliffs Natural Resources,<br />
Inc. 4,500 115<br />
The Accompanying Notes are an Integral Part of the Financial Statements.<br />
14 Large Cap Blend Portfolio
Large Cap Blend Portfolio<br />
Common Stocks (96.2%)<br />
Shares/ Value<br />
$ Par $ (000's)<br />
Materials continued<br />
Ecolab, Inc. 2,300 81<br />
Monsanto Co. 2,600 183<br />
Nucor Corp. 4,000 185<br />
Potash Corp. of<br />
Saskatchewan, Inc. 1,800 132<br />
Vulcan Materials Co. 2,700 188<br />
Total 1,568<br />
Other Holdings (1.0%)<br />
SPDR Trust Series 1 3,300 298<br />
Total 298<br />
Telecommunication Services (3.1%)<br />
* American Tower Corp. -<br />
Class A 10,700 313<br />
AT&T, Inc. 18,000 513<br />
* tw telecom, Inc. 8,000 68<br />
Total 894<br />
Utilities (0.9%)<br />
Allegheny Energy, Inc. 1,100 37<br />
American Water Works<br />
Co., Inc. 6,600 138<br />
CMS Energy Corp. 3,400 34<br />
Edison International 1,800 58<br />
Total 267<br />
Total Common Stocks<br />
(Cost: $38,795) 28,262<br />
* Non-Income Producing<br />
(a)<br />
(l)<br />
ADR after the name of a security represents<br />
—American Depositary Receipt.<br />
At December 31, 2008 the aggregate cost of<br />
securities for federal tax purposes (in<br />
thousands) was $40,072 and the net unrealized<br />
depreciation of investments based on that cost<br />
was $10,688 which is comprised of $319<br />
aggregate gross unrealized appreciation and<br />
$11,007 aggregate gross unrealized<br />
depreciation.<br />
As of December 31, 2008, portfolio securities<br />
with an aggregate value of $90 (in thousands)<br />
were fair valued under procedures adopted by<br />
the Board of Directors.<br />
Preferred Stocks (0.4%)<br />
Pharmaceutical Preparations (0.4%)<br />
Schering-Plough Corp.,<br />
6.00%, 8/13/10 700 122<br />
Total 122<br />
Total Preferred Stocks<br />
(Cost: $151) 122<br />
Short-Term Investments (3.4%)<br />
Energy (3.4%)<br />
Sempra Global,<br />
1.00%, 1/2/09 1,000,000 1,000<br />
Total 1,000<br />
Total Short-Term Investments<br />
(Cost: $1,000) 1,000<br />
Total Investments (100.0%)<br />
(Cost: $39,946)(a) 29,384<br />
Other Assets, Less<br />
Liabilities (0.0%) (2)<br />
Net Assets (100.0%) 29,382<br />
The Accompanying Notes are an Integral Part of the Financial Statements.<br />
Large Cap Blend Portfolio 15
Index 500 Stock Portfolio<br />
Objective: Portfolio Strategy: Net Assets:<br />
Investment results that approximate the<br />
performance of the S&P 500 ® Index.<br />
Invest in stocks included in the S&P 500 ® Index in<br />
approximately the same proportion as each stock’s<br />
weighting in the Index.<br />
$1.2 billion<br />
Portfolio Overview<br />
Mason Street Advisors acts as the investment adviser for the Index 500 Stock Portfolio. The Portfolio seeks investment results<br />
that approximate the performance of the S&P 500 ® Index. The S&P 500 ® Index is composed of 500 common stocks<br />
representing approximately three-fourths of the total market value of all publicly traded common stocks in the U.S. The<br />
Portfolio’s strategy is to capture broad market performance by investing in a portfolio modeled after a broadly based stock<br />
index. The Index 500 Stock Portfolio is not managed in the traditional sense using economic, financial and market analysis.<br />
The Portfolio invests in stocks included in the S&P 500 ® Index in proportion to their weightings in the Index, and may buy or<br />
sell securities after announced changes in the Index but before or after the effective date of the changes to attempt to achieve<br />
higher correlation with the Index. The Portfolio remains neutral relative to the benchmark in terms of economic sectors,<br />
market capitalization, and the growth and value styles of investing. The Portfolio will, to the extent feasible, remain fully<br />
invested, and may purchase Index futures contracts in an attempt to achieve full replication.<br />
Market Overview<br />
Financial markets endured a brutal 2008, which saw the failure of a number of leading financial institutions, credit markets<br />
freeze up, and the U.S. government take a series of extraordinary steps to support the economy and financial system. Returns<br />
were negative across all market capitalization ranges, sectors, and investment styles. For all of 2008, returns for large-,<br />
medium- and small-sized companies were –37.00%, –36.23% and –31.07%, as measured by the S&P 500 ® , MidCap 400 ® and<br />
SmallCap 600 ® Indices, respectively.<br />
Large-cap stocks suffered most, largely as a result of the fallout from the financial crisis. Indeed, Financials were the poorest<br />
performing sector in the Index, down 57%, as large-cap financial shares were at the epicenter of the credit crisis. Every major<br />
investment bank, mortgage market players Fannie Mae and Freddie Mac, insurance giant AIG, and such big lenders as<br />
Washington <strong>Mutual</strong> and Wachovia either failed, were seized by the government, sold at a steep discount, or fundamentally<br />
altered their corporate structure.<br />
In addition, stocks faced worries about the dramatic global slowdown, weighing on economically sensitive shares. In that<br />
environment, Materials, Information Technology, Industrials, Energy and Consumer Discretionary shares fell 47%, 44%, 42%,<br />
36% and 35%, respectively.<br />
The shares that held up best were Consumer Staples names (–18%), whose earnings have historically been more resilient<br />
during difficult economic periods. Similarly, the traditionally defensive Utilities and Telecommunication Services segments<br />
did better than the Index, down 32% and 34%, respectively. Health Care shares deserve special mention, as these growthoriented<br />
stocks managed the second-best return for the year, down 25%. Positive returns from biotechnology shares and a<br />
resilient performance from big pharmaceutical companies drove the sector’s performance.<br />
Portfolio Results<br />
The Portfolio had a sharply negative return in the worst year for equities since the Great Depression. For the twelve months<br />
ended December 31, 2008, the Portfolio had a total return of –36.94%, compared with –37.00% for the S&P 500 ® Index. (This<br />
Index is unmanaged, cannot be invested in directly, and does not include administrative expenses or sales charges.) The<br />
average return for the Portfolio’s peer group, S&P 500 Index Objective Funds, was –37.20%, according to Lipper Analytical<br />
Services, Inc., an independent mutual fund ranking agency.<br />
As we seek to track the performance and weightings of stocks in the S&P 500 ® Index, we make changes in the Portfolio’s<br />
holding as the Index changes. Standard & Poor’s changes the composition of the Index as companies go public or private,<br />
merge, divest or have major changes in market capitalization. Additionally, Standard & Poor’s adjusts the Index to better<br />
reflect the companies that are most representative of the composition of the U.S. economy. During 2008, 33 companies were<br />
added to the Index, with a like number eliminated during the year. We try to make these adjustments in the Portfolio in a way<br />
that minimizes the cost and market impact of our trading. For example, it is typical for stocks to rise temporarily when they are<br />
initially added to the Index as funds adjust their portfolios to reflect the new benchmark. We have been able to add these<br />
names to the Portfolio in a more efficient, cost-effective way by incorporating them after this temporary price increase<br />
subsides.<br />
Outlook<br />
After the unprecedented events of 2008, we have a somewhat hopeful outlook for 2009—we are hoping for the reemergence of<br />
a more rational, less volatile market environment where fundamentals and diversification matter once again. Unfortunately, the<br />
economic fundamentals remain challenging, though we think it is reasonable to expect some sort of recovery based on the<br />
16 Index 500 Stock Portfolio
Index 500 Stock Portfolio<br />
massive government stimulus likely to come early in the new year. Diversification, too, is likely to matter again, as we see<br />
greater differentiation in returns across and within asset classes. We continue to believe in the potential benefit of investing in<br />
a fund based on a broad market index, such as the Index 500 Stock Portfolio, which provides exposure to both growth and<br />
value styles of investing, as well stocks of companies across the economy.<br />
Relative Performance<br />
$15,000<br />
10,000<br />
5,000<br />
0<br />
12/98 12/00 12/02 12/04 12/06 12/08<br />
Top 10 Equity Holdings 12/31/08<br />
Security Description<br />
% of Net Assets<br />
Exxon Mobil Corp. 5.1%<br />
The Procter & Gamble Co. 2.3%<br />
General Electric Co. 2.1%<br />
AT&T, Inc. 2.1%<br />
Johnson & Johnson 2.1%<br />
Chevron Corp. 1.9%<br />
Microsoft Corp. 1.9%<br />
Wal-Mart Stores, Inc. 1.6%<br />
Pfizer, Inc. 1.5%<br />
JPMorgan Chase & Co. 1.5%<br />
Index 500 Stock Portfolio<br />
S&P 500 Index<br />
Average <strong>Annual</strong> Total Returns<br />
For Periods Ended December 31, 2008<br />
1 Year 5 Years 10 Years<br />
Index 500 Stock Portfolio<br />
S&P 500 Index<br />
-36.94% -2.28%<br />
-37.00% -2.19%<br />
-1.42%<br />
-1.38%<br />
Lipper Variable Insurance Products<br />
(VIP) S&P 500 Index Objective<br />
Funds Average -37.20% -2.54% -1.73%<br />
The performance data quoted represents past<br />
performance. Past performance is historical and does<br />
not guarantee future performance. Investment return<br />
and principal value will fluctuate, so that shares, when<br />
redeemed, may be worth more or less than their original<br />
cost. Current performance may be lower or higher than<br />
the performance data quoted. For the most recent<br />
month-end performance information visit<br />
www.nmfn.com.<br />
This chart assumes an initial investment of $10,000<br />
made on 12/31/98. Returns shown include deductions<br />
for management and other portfolio expenses, and<br />
reinvestment of all dividends. Returns exclude<br />
deductions for separte account sale loads and account<br />
fees. Please refer to the Benchmark Definitions section<br />
of this report for information about the indices cited in<br />
the above chart and graph.<br />
“Standard & Poor’s ® ”, “S&P ® ”, “S&P 500” and<br />
“Standard & Poor’s 500” are trademarks of The<br />
McGraw-Hill Companies, Inc. and have been licensed for<br />
use by The <strong>Northwestern</strong> <strong>Mutual</strong> Life Insurance<br />
Company. The Portfolio is not sponsored, endorsed, sold<br />
or promoted by Standard & Poor’s, and Standard &<br />
Poor’s makes no representation regarding the<br />
advisability of investing in the Portfolio.<br />
Telecommunication Services<br />
4%<br />
Utilities<br />
4%<br />
Consumer<br />
Discretionary<br />
9%<br />
Industrials<br />
11%<br />
Consumer Staples<br />
13%<br />
Sector Allocation 12/31/08<br />
Sector Allocation is based on equities.<br />
Sector Allocation and Top 10 Holdings are subject to<br />
change.<br />
Materials<br />
3%<br />
Information<br />
Technology<br />
15%<br />
Health Care<br />
15%<br />
Energy<br />
13%<br />
Financials<br />
13%<br />
Index 500 Stock Portfolio 17
Index 500 Stock Portfolio<br />
<strong>Northwestern</strong> <strong>Mutual</strong> Series Fund, Inc.<br />
Schedule of Investments<br />
December 31, 2008<br />
Common Stocks (97.7%)<br />
Shares/<br />
$ Par<br />
Consumer Discretionary (8.2%)<br />
Value<br />
$ (000's)<br />
Abercrombie & Fitch Co.<br />
- Class A 13,300 307<br />
* Amazon.com, Inc. 49,200 2,523<br />
* Apollo Group, Inc. -<br />
Class A 16,300 1,249<br />
* AutoNation, Inc. 16,529 163<br />
* AutoZone, Inc. 5,825 812<br />
* Bed Bath & Beyond, Inc. 39,800 1,012<br />
Best Buy Co., Inc. 51,675 1,453<br />
* Big Lots, Inc. 12,600 183<br />
The Black & Decker<br />
Corp. 9,200 385<br />
Carnival Corp. 66,909 1,627<br />
CBS Corp. - Class B 104,124 853<br />
Centex Corp. 19,000 202<br />
* Coach, Inc. 50,100 1,041<br />
Comcast Corp. - Class A 440,905 7,442<br />
D.R. Horton, Inc. 42,200 298<br />
Darden Restaurants, Inc. 21,250 599<br />
* The DIRECTV Group,<br />
Inc. 83,600 1,915<br />
Eastman Kodak Co. 41,083 270<br />
* Expedia, Inc. 32,100 264<br />
Family Dollar Stores, Inc. 21,400 558<br />
* Ford Motor Co. 365,765 838<br />
Fortune Brands, Inc. 22,967 948<br />
* GameStop Corp. - Class<br />
A 25,100 544<br />
Gannett Co., Inc. 34,950 280<br />
The Gap, Inc. 71,375 956<br />
General Motors Corp. 93,427 299<br />
Genuine Parts Co. 24,400 924<br />
* The Goodyear Tire &<br />
Rubber Co. 36,900 220<br />
H&R Block, Inc. 51,900 1,179<br />
Harley-Davidson, Inc. 35,600 604<br />
Harman International<br />
Industries, Inc. 9,000 151<br />
Hasbro, Inc. 18,925 552<br />
The Home Depot, Inc. 259,600 5,976<br />
International Game<br />
Technology 45,100 536<br />
* The Interpublic Group of<br />
Companies, Inc. 73,000 289<br />
J.C. Penney Co., Inc. 34,050 671<br />
Johnson Controls, Inc. 91,000 1,653<br />
Jones Apparel Group, Inc. 12,800 75<br />
KB Home 11,500 157<br />
* Kohl's Corp. 46,667 1,689<br />
Leggett & Platt, Inc. 23,933 364<br />
Lennar Corp. - Class A 21,600 187<br />
Limited Brands, Inc. 41,387 416<br />
Lowe's Cos., Inc. 224,400 4,829<br />
Macy's, Inc. 64,346 666<br />
Common Stocks (97.7%)<br />
Shares/<br />
$ Par<br />
Value<br />
$ (000's)<br />
Consumer Discretionary continued<br />
Marriott International,<br />
Inc. - Class A 44,900 873<br />
Mattel, Inc. 54,888 878<br />
McDonald's Corp. 170,678 10,614<br />
The McGraw-Hill Cos.,<br />
Inc. 48,120 1,116<br />
Meredith Corp. 5,500 94<br />
The New York Times Co.<br />
- Class A 17,870 131<br />
Newell Rubbermaid, Inc. 42,492 416<br />
News Corp. - Class A 352,200 3,201<br />
NIKE, Inc. - Class B 60,100 3,065<br />
Nordstrom, Inc. 24,434 325<br />
* Office Depot, Inc. 42,057 125<br />
Omnicom Group, Inc. 47,600 1,281<br />
Polo Ralph Lauren Corp. 8,600 391<br />
Pulte Homes, Inc. 32,700 357<br />
RadioShack Corp. 19,200 229<br />
Scripps Networks<br />
Interactive - Class A 13,800 304<br />
* Sears Holdings Corp. 8,480 330<br />
The Sherwin-Williams<br />
Co. 15,013 897<br />
Snap-on, Inc. 8,817 347<br />
The Stanley Works 12,050 411<br />
Staples, Inc. 109,250 1,958<br />
* Starbucks Corp. 112,600 1,065<br />
Starwood Hotels &<br />
Resorts Worldwide, Inc. 28,000 501<br />
Target Corp. 115,257 3,980<br />
Tiffany & Co. 18,867 446<br />
Time Warner, Inc. 549,300 5,526<br />
The TJX Companies, Inc. 63,700 1,310<br />
VF Corp. 13,457 737<br />
* Viacom, Inc. - Class B 93,924 1,790<br />
The Walt Disney Co. 283,457 6,432<br />
The Washington Post Co.<br />
- Class B 900 351<br />
Whirlpool Corp. 11,244 465<br />
Wyndham Worldwide<br />
Corp. 27,186 178<br />
* Wynn Resorts, Ltd. 9,400 397<br />
Yum! Brands, Inc. 70,860 2,232<br />
Total 100,912<br />
Consumer Staples (12.6%)<br />
Altria Group, Inc. 315,522 4,752<br />
Archer-Daniels-Midland<br />
Co. 98,203 2,831<br />
Avon Products, Inc. 65,300 1,569<br />
Brown-Forman Corp. -<br />
Class B 15,022 773<br />
Campbell Soup Co. 31,522 946<br />
The Clorox Co. 21,250 1,181<br />
The Coca-Cola Co. 304,675 13,793<br />
Common Stocks (97.7%)<br />
Shares/<br />
$ Par<br />
Value<br />
$ (000's)<br />
Consumer Staples continued<br />
Coca-Cola Enterprises,<br />
Inc. 48,600 585<br />
Colgate-Palmolive Co. 77,322 5,300<br />
ConAgra Foods, Inc. 68,467 1,130<br />
* Constellation Brands, Inc.<br />
- Class A 29,800 470<br />
Costco Wholesale Corp. 66,064 3,468<br />
CVS Caremark Corp. 219,861 6,319<br />
* Dean Foods Co. 23,600 424<br />
* Dr. Pepper Snapple<br />
Group, Inc. 38,800 630<br />
The Estee Lauder<br />
Companies, Inc. - Class<br />
A 17,700 548<br />
General Mills, Inc. 51,167 3,108<br />
H.J. Heinz Co. 48,117 1,809<br />
The Hershey Co. 25,400 882<br />
The J.M. Smucker Co. 18,100 785<br />
Kellogg Co. 38,557 1,691<br />
Kimberly-Clark Corp. 63,356 3,341<br />
Kraft Foods, Inc. - Class<br />
A 224,996 6,041<br />
The Kroger Co. 99,905 2,638<br />
Lorillard, Inc. 25,746 1,451<br />
McCormick & Co., Inc. 19,900 634<br />
Molson Coors Brewing<br />
Co. - Class B 22,800 1,115<br />
The Pepsi Bottling<br />
Group, Inc. 20,700 466<br />
PepsiCo, Inc. 237,830 13,026<br />
Philip Morris<br />
International, Inc. 309,722 13,476<br />
The Procter & Gamble<br />
Co. 457,164 28,262<br />
Reynolds American, Inc. 25,900 1,044<br />
Safeway, Inc. 65,600 1,559<br />
Sara Lee Corp. 108,235 1,060<br />
SUPERVALU, INC. 32,470 474<br />
Sysco Corp. 91,725 2,104<br />
Tyson Foods, Inc. - Class<br />
A 46,300 406<br />
UST, Inc. 22,767 1,580<br />
Walgreen Co. 151,546 3,739<br />
Wal-Mart Stores, Inc. 342,300 19,189<br />
Whole Foods Market,<br />
Inc. 21,500 203<br />
Total 154,802<br />
Energy (13.0%)<br />
Anadarko Petroleum<br />
Corp. 70,324 2,711<br />
Apache Corp. 51,246 3,819<br />
Baker Hughes, Inc. 47,130 1,511<br />
BJ Services Co. 44,700 522<br />
Cabot Oil & Gas Corp. 15,800 411<br />
The Accompanying Notes are an Integral Part of the Financial Statements.<br />
18 Index 500 Stock Portfolio
Index 500 Stock Portfolio<br />
Common Stocks (97.7%)<br />
Shares/<br />
$ Par<br />
Value<br />
$ (000's)<br />
Energy continued<br />
* Cameron International<br />
Corp. 33,600 689<br />
Chesapeake Energy Corp. 82,800 1,339<br />
Chevron Corp. 311,114 23,013<br />
ConocoPhillips 228,238 11,823<br />
CONSOL Energy, Inc. 27,700 792<br />
Devon Energy Corp. 67,600 4,442<br />
El Paso Corp. 107,371 841<br />
ENSCO International,<br />
Inc. 21,700 616<br />
EOG Resources, Inc. 38,220 2,545<br />
Exxon Mobil Corp. 778,856 62,176<br />
Halliburton Co. 136,838 2,488<br />
Hess Corp. 43,400 2,328<br />
Marathon Oil Corp. 108,066 2,957<br />
Massey Energy Co. 13,000 179<br />
Murphy Oil Corp. 29,200 1,295<br />
* Nabors Industries, Ltd. 43,600 522<br />
* National-Oilwell Varco,<br />
Inc. 63,900 1,562<br />
Noble Corp. 40,400 892<br />
Noble Energy, Inc. 26,500 1,304<br />
Occidental Petroleum<br />
Corp. 124,040 7,441<br />
Peabody Energy Corp. 40,800 928<br />
Pioneer Natural<br />
Resources Co. 18,000 291<br />
Range Resources Corp. 23,800 818<br />
Rowan Companies, Inc. 17,350 276<br />
Schlumberger, Ltd. 183,134 7,752<br />
Smith International, Inc. 33,500 767<br />
* Southwestern Energy Co. 52,600 1,524<br />
Spectra Energy Corp. 93,536 1,472<br />
Sunoco, Inc. 17,900 778<br />
Tesoro Corp. 21,200 279<br />
Valero Energy Corp. 79,000 1,710<br />
* Weatherford<br />
International, Ltd. 104,300 1,128<br />
The Williams Companies,<br />
Inc. 88,600 1,283<br />
XTO Energy, Inc. 88,323 3,115<br />
Total 160,339<br />
Financials (13.0%)<br />
Aflac, Inc. 71,350 3,271<br />
The Allstate Corp. 82,028 2,687<br />
American Capital, Ltd. 31,700 103<br />
American Express Co. 177,575 3,294<br />
American International<br />
Group, Inc. 411,730 646<br />
Ameriprise Financial, Inc. 33,155 774<br />
Aon Corp. 41,300 1,887<br />
Apartment Investment &<br />
Management Co. - Class<br />
A 15,546 180<br />
Assurant, Inc. 18,000 540<br />
AvalonBay Communities,<br />
Inc. 11,800 715<br />
Bank of America Corp. 768,247 10,817<br />
Common Stocks (97.7%)<br />
Shares/<br />
$ Par<br />
Value<br />
$ (000's)<br />
Financials continued<br />
The Bank of New York<br />
Mellon Corp. 175,663 4,977<br />
BB&T Corp. 84,600 2,323<br />
Boston Properties, Inc. 18,500 1,017<br />
Capital One Financial<br />
Corp. 59,929 1,911<br />
* CB Richard Ellis Group,<br />
Inc. 34,100 147<br />
The Charles Schwab<br />
Corp. 143,311 2,317<br />
The Chubb Corp. 54,500 2,779<br />
Cincinnati Financial<br />
Corp. 24,875 723<br />
CIT Group, Inc. 43,700 198<br />
Citigroup, Inc. 834,448 5,599<br />
CME Group, Inc. 10,300 2,144<br />
Comerica, Inc. 23,050 458<br />
Developers Diversified<br />
Realty Corp. 18,400 90<br />
Discover Financial<br />
Services 73,456 700<br />
* E*TRADE Financial<br />
Corp. 86,200 99<br />
Equity Residential 41,700 1,243<br />
Federated Investors, Inc. -<br />
Class B 13,600 231<br />
Fifth Third Bancorp 88,434 730<br />
First Horizon National<br />
Corp. 31,136 329<br />
Franklin Resources, Inc. 23,150 1,477<br />
Genworth Financial, Inc.<br />
- Class A 66,300 188<br />
The Goldman Sachs<br />
Group, Inc. 67,700 5,713<br />
The Hartford Financial<br />
Services Group, Inc. 46,150 758<br />
HCP, Inc. 38,700 1,075<br />
Host Hotels & Resorts,<br />
Inc. 80,000 606<br />
Hudson City Bancorp,<br />
Inc. 79,800 1,274<br />
Huntington Bancshares,<br />
Inc. 56,042 429<br />
* IntercontinentalExchange,<br />
Inc. 11,100 915<br />
Invesco, Ltd. 58,900 851<br />
Janus Capital Group, Inc. 24,129 194<br />
JPMorgan Chase & Co. 571,529 18,020<br />
KeyCorp 75,775 646<br />
Kimco Realty Corp. 35,100 642<br />
Legg Mason, Inc. 21,700 475<br />
Leucadia National Corp. 27,100 537<br />
Lincoln National Corp. 39,130 737<br />
Loews Corp. 55,421 1,566<br />
M&T Bank Corp. 11,800 677<br />
Marsh & McLennan<br />
Companies, Inc. 78,680 1,910<br />
Marshall & Ilsley Corp. 39,900 544<br />
* MBIA, Inc. 28,850 117<br />
Merrill Lynch & Co., Inc. 245,200 2,854<br />
Common Stocks (97.7%)<br />
Shares/<br />
$ Par<br />
Value<br />
$ (000's)<br />
Financials continued<br />
MetLife, Inc. 121,474 4,235<br />
Moody's Corp. 29,750 598<br />
Morgan Stanley 162,613 2,608<br />
* The Nasdaq OMX Group,<br />
Inc. 20,800 514<br />
National City Corp. 311,797 564<br />
Northern Trust Corp. 34,150 1,781<br />
NYSE Euronext 40,600 1,112<br />
People's United Financial,<br />
Inc. 53,300 950<br />
Plum Creek Timber Co.,<br />
Inc. 25,500 886<br />
PNC Financial Services<br />
Group, Inc. 53,267 2,610<br />
Principal Financial<br />
Group, Inc. 39,700 896<br />
The Progressive Corp. 103,500 1,533<br />
ProLogis 40,700 565<br />
Prudential Financial, Inc. 64,900 1,964<br />
Public Storage 19,200 1,526<br />
Regions Financial Corp. 105,990 844<br />
Simon Property Group,<br />
Inc. 34,600 1,838<br />
* SLM Corp. 71,542 637<br />
* Sovereign Bancorp, Inc. 83,380 248<br />
State Street Corp. 66,100 2,600<br />
SunTrust Banks, Inc. 54,233 1,602<br />
T. Rowe Price Group,<br />
Inc. 39,600 1,403<br />
Torchmark Corp. 13,050 583<br />
The Travelers<br />
Companies, Inc. 89,510 4,046<br />
U.S. Bancorp 268,621 6,718<br />
Unum Group 50,731 944<br />
Vornado Realty Trust 21,000 1,267<br />
Wachovia Corp. 330,847 1,833<br />
Wells Fargo & Co. 580,260 17,106<br />
XL Capital, Ltd. - Class<br />
A 50,600 187<br />
Zions Bancorporation 17,700 434<br />
Total 159,766<br />
Health Care (14.5%)<br />
Abbott Laboratories 237,550 12,678<br />
Aetna, Inc. 70,608 2,012<br />
Allergan, Inc. 47,134 1,900<br />
AmerisourceBergen<br />
Corp. 23,900 852<br />
* Amgen, Inc. 162,217 9,368<br />
Baxter International, Inc. 95,000 5,091<br />
Becton, Dickinson and<br />
Co. 37,250 2,548<br />
* Biogen Idec, Inc. 44,690 2,129<br />
* Boston Scientific Corp. 229,922 1,780<br />
Bristol-Myers Squibb Co. 303,108 7,047<br />
C.R. Bard, Inc. 15,200 1,281<br />
Cardinal Health, Inc. 55,025 1,897<br />
* Celgene Corp. 70,200 3,881<br />
* Cephalon, Inc. 10,500 809<br />
CIGNA Corp. 42,087 709<br />
The Accompanying Notes are an Integral Part of the Financial Statements.<br />
Index 500 Stock Portfolio 19
Index 500 Stock Portfolio<br />
Common Stocks (97.7%)<br />
Shares/<br />
$ Par<br />
Value<br />
$ (000's)<br />
Health Care continued<br />
* Coventry Health Care,<br />
Inc. 22,800 339<br />
Covidien, Ltd. 77,127 2,795<br />
* DaVita, Inc. 15,900 788<br />
DENTSPLY<br />
International, Inc. 22,800 644<br />
Eli Lilly and Co. 153,206 6,170<br />
* Express Scripts, Inc. 37,900 2,084<br />
* Forest Laboratories, Inc. 46,166 1,176<br />
* Genzyme Corp. 41,400 2,748<br />
* Gilead Sciences, Inc. 140,900 7,206<br />
* Hospira, Inc. 24,465 656<br />
* Humana, Inc. 25,800 962<br />
IMS Health, Inc. 27,867 422<br />
* Intuitive Surgical, Inc. 6,000 762<br />
Johnson & Johnson 424,837 25,418<br />
* King Pharmaceuticals,<br />
Inc. 37,766 401<br />
* Laboratory Corp. of<br />
America Holdings 16,500 1,063<br />
* Life Technologies Corp. 26,380 615<br />
McKesson Corp. 42,205 1,635<br />
* Medco Health Solutions,<br />
Inc. 76,244 3,195<br />
Medtronic, Inc. 171,200 5,379<br />
Merck & Co., Inc. 323,720 9,841<br />
* Millipore Corp. 8,500 438<br />
* Mylan, Inc. 46,700 462<br />
* Patterson Companies, Inc. 14,000 262<br />
PerkinElmer, Inc. 18,100 252<br />
Pfizer, Inc. 1,032,434 18,284<br />
Quest Diagnostics, Inc. 24,300 1,261<br />
Schering-Plough Corp. 248,950 4,240<br />
* St. Jude Medical, Inc. 52,700 1,737<br />
Stryker Corp. 37,100 1,482<br />
* Tenet Healthcare Corp. 63,550 73<br />
Teva Pharmaceutical<br />
Industries, Ltd., ADR 10,348 440<br />
* Thermo Fisher Scientific,<br />
Inc. 64,300 2,191<br />
UnitedHealth Group, Inc. 184,944 4,919<br />
* Varian Medical Systems,<br />
Inc. 19,000 666<br />
* Waters Corp. 15,100 553<br />
* Watson Pharmaceuticals,<br />
Inc. 16,000 425<br />
* WellPoint, Inc. 77,900 3,282<br />
Wyeth 203,829 7,646<br />
* Zimmer Holdings, Inc. 34,337 1,388<br />
Total 178,282<br />
Industrials (10.8%)<br />
3M Co. 106,076 6,104<br />
Avery Dennison Corp. 16,250 532<br />
The Boeing Co. 112,176 4,787<br />
Burlington Northern<br />
Santa Fe Corp. 42,985 3,254<br />
C.H. Robinson<br />
Worldwide, Inc. 25,900 1,425<br />
Caterpillar, Inc. 92,376 4,126<br />
Common Stocks (97.7%)<br />
Shares/<br />
$ Par<br />
Value<br />
$ (000's)<br />
Industrials continued<br />
Cintas Corp. 20,133 468<br />
Cooper Industries, Ltd. -<br />
Class A 26,500 775<br />
CSX Corp. 60,400 1,961<br />
Cummins, Inc. 30,800 823<br />
Danaher Corp. 39,100 2,213<br />
Deere & Co. 65,420 2,507<br />
Dover Corp. 28,467 937<br />
The Dun & Bradstreet<br />
Corp. 8,300 641<br />
Eaton Corp. 25,200 1,253<br />
Emerson Electric Co. 117,400 4,298<br />
Equifax, Inc. 19,300 512<br />
Expeditors International<br />
of Washington, Inc. 32,500 1,081<br />
Fastenal Co. 19,800 690<br />
FedEx Corp. 47,620 3,055<br />
Flowserve Corp. 8,700 448<br />
Fluor Corp. 27,800 1,247<br />
General Dynamics Corp. 59,700 3,438<br />
General Electric Co. 1,608,206 26,053<br />
Goodrich Corp. 18,800 696<br />
Honeywell International,<br />
Inc. 111,250 3,652<br />
Illinois Tool Works, Inc. 60,300 2,114<br />
Ingersoll-Rand Co., Ltd. -<br />
Class A 48,762 846<br />
ITT Corp. 27,800 1,279<br />
* Jacobs Engineering<br />
Group, Inc. 18,800 904<br />
L-3 Communications<br />
Holdings, Inc. 18,300 1,350<br />
Lockheed Martin Corp. 51,008 4,289<br />
The Manitowoc Co., Inc. 20,000 173<br />
Masco Corp. 55,100 613<br />
* Monster Worldwide, Inc. 18,867 228<br />
Norfolk Southern Corp. 56,657 2,666<br />
Northrop Grumman Corp. 50,020 2,253<br />
PACCAR, Inc. 55,515 1,588<br />
Pall Corp. 18,050 513<br />
Parker Hannifin Corp. 24,712 1,051<br />
Pitney Bowes, Inc. 31,537 804<br />
Precision Castparts Corp. 21,300 1,267<br />
R.R. Donnelley & Sons<br />
Co. 31,434 427<br />
Raytheon Co. 63,400 3,236<br />
Republic Services, Inc. 49,207 1,220<br />
Robert Half International,<br />
Inc. 23,740 494<br />
Rockwell Automation,<br />
Inc. 21,650 698<br />
Rockwell Collins, Inc. 24,250 948<br />
Ryder System, Inc. 8,500 330<br />
Southwest Airlines Co. 113,267 976<br />
* Stericycle, Inc. 13,100 682<br />
Textron, Inc. 36,900 512<br />
Tyco International, Ltd. 72,427 1,564<br />
Union Pacific Corp. 77,520 3,705<br />
United Parcel Service,<br />
Inc. - Class B 152,400 8,406<br />
Common Stocks (97.7%)<br />
Shares/<br />
$ Par<br />
Value<br />
$ (000's)<br />
Industrials continued<br />
United Technologies<br />
Corp. 145,534 7,801<br />
W.W. Grainger, Inc. 9,900 781<br />
Waste Management, Inc. 75,085 2,488<br />
Total 133,182<br />
Information Technology (14.9%)<br />
* Adobe Systems, Inc. 81,250 1,730<br />
* Advanced Micro Devices,<br />
Inc. 93,200 201<br />
* Affiliated Computer<br />
Services, Inc. - Class A 14,900 685<br />
* Agilent Technologies,<br />
Inc. 53,637 838<br />
* Akamai Technologies,<br />
Inc. 25,900 391<br />
Altera Corp. 45,511 760<br />
Amphenol Corp. - Class<br />
A 26,900 645<br />
Analog Devices, Inc. 44,557 847<br />
* Apple, Inc. 136,100 11,616<br />
Applied Materials, Inc. 205,400 2,081<br />
* Autodesk, Inc. 34,668 681<br />
Automatic Data<br />
Processing, Inc. 77,750 3,059<br />
* BMC Software, Inc. 28,760 774<br />
* Broadcom Corp. - Class<br />
A 68,000 1,154<br />
CA, Inc. 60,292 1,117<br />
* Ciena Corp. 13,785 92<br />
* Cisco Systems, Inc. 896,500 14,613<br />
* Citrix Systems, Inc. 27,820 656<br />
* Cognizant Technology<br />
Solutions Corp. - Class<br />
A 44,600 805<br />
* Computer Sciences Corp. 23,150 813<br />
* Compuware Corp. 37,757 255<br />
* Convergys Corp. 18,650 120<br />
Corning, Inc. 238,000 2,268<br />
* Dell, Inc. 264,933 2,713<br />
* eBay, Inc. 164,200 2,292<br />
* Electronic Arts, Inc. 49,100 788<br />
* EMC Corp. 312,474 3,272<br />
Fidelity National<br />
Information Services,<br />
Inc. 29,100 473<br />
* Fiserv, Inc. 24,525 892<br />
* Google, Inc. - Class A 36,600 11,260<br />
Harris Corp. 20,600 784<br />
Hewlett-Packard Co. 375,026 13,610<br />
Intel Corp. 851,663 12,485<br />
International Business<br />
Machines Corp. 205,739 17,315<br />
* Intuit, Inc. 49,000 1,166<br />
Jabil Circuit, Inc. 32,267 218<br />
* JDS Uniphase Corp. 33,650 123<br />
* Juniper Networks, Inc. 80,800 1,415<br />
KLA-Tencor Corp. 25,900 564<br />
* Lexmark International,<br />
Inc. - Class A 12,000 323<br />
The Accompanying Notes are an Integral Part of the Financial Statements.<br />
20 Index 500 Stock Portfolio
Index 500 Stock Portfolio<br />
Common Stocks (97.7%)<br />
Shares/<br />
$ Par<br />
Value<br />
$ (000's)<br />
Information Technology continued<br />
Linear Technology Corp. 33,950 751<br />
* LSI Corp. 98,800 325<br />
MasterCard, Inc. 11,100 1,587<br />
* McAfee, Inc. 23,400 809<br />
* MEMC Electronic<br />
Materials, Inc. 34,400 491<br />
Microchip Technology,<br />
Inc. 27,900 545<br />
* Micron Technology, Inc. 116,950 309<br />
Microsoft Corp. 1,171,392 22,772<br />
Molex, Inc. 21,550 312<br />
Motorola, Inc. 346,977 1,537<br />
National Semiconductor<br />
Corp. 29,886 301<br />
* NetApp, Inc. 50,600 707<br />
* Novell, Inc. 52,900 206<br />
* Novellus Systems, Inc. 15,000 185<br />
* NVIDIA Corp. 82,250 664<br />
* Oracle Corp. 599,825 10,635<br />
Paychex, Inc. 49,135 1,291<br />
* QLogic Corp. 19,600 263<br />
QUALCOMM, Inc. 253,434 9,081<br />
* Salesforce.com, Inc. 16,100 515<br />
* SanDisk Corp. 34,600 332<br />
* Sun Microsystems, Inc. 113,049 432<br />
* Symantec Corp. 128,054 1,731<br />
* Tellabs, Inc. 60,992 251<br />
* Teradata Corp. 26,900 399<br />
* Teradyne, Inc. 25,950 110<br />
Texas Instruments, Inc. 198,500 3,081<br />
Total System Services,<br />
Inc. 30,178 422<br />
Tyco Electronics, Ltd. 70,027 1,135<br />
* VeriSign, Inc. 29,700 567<br />
Western Union Co. 109,532 1,571<br />
Xerox Corp. 132,500 1,056<br />
Xilinx, Inc. 41,900 747<br />
* Yahoo!, Inc. 212,500 2,592<br />
Total 183,606<br />
Materials (2.9%)<br />
Air Products and<br />
Chemicals, Inc. 32,067 1,612<br />
AK Steel Holding Corp. 17,200 160<br />
Alcoa, Inc. 122,507 1,379<br />
Allegheny Technologies,<br />
Inc. 14,717 376<br />
Ball Corp. 14,532 604<br />
Bemis Co., Inc. 15,300 362<br />
CF Industries Holdings,<br />
Inc. 8,700 428<br />
The Dow Chemical Co. 141,409 2,134<br />
E.I. du Pont de Nemours<br />
and Co. 138,128 3,495<br />
Eastman Chemical Co. 11,125 353<br />
Ecolab, Inc. 25,700 903<br />
Freeport-McMoRan<br />
Copper & Gold, Inc. 57,788 1,412<br />
International Flavors &<br />
Fragrances, Inc. 12,000 357<br />
Common Stocks (97.7%)<br />
Shares/<br />
$ Par<br />
Value<br />
$ (000's)<br />
Materials continued<br />
International Paper Co. 65,466 772<br />
MeadWestvaco Corp. 26,179 293<br />
Monsanto Co. 83,906 5,903<br />
Newmont Mining Corp. 69,580 2,832<br />
Nucor Corp. 48,032 2,219<br />
* Pactiv Corp. 20,100 500<br />
PPG Industries, Inc. 25,167 1,068<br />
Praxair, Inc. 47,200 2,802<br />
Rohm and Haas Co. 19,080 1,179<br />
Sealed Air Corp. 24,142 361<br />
Sigma-Aldrich Corp. 19,200 811<br />
Titanium Metals Corp. 13,000 115<br />
United States Steel Corp. 17,850 664<br />
Vulcan Materials Co. 16,900 1,176<br />
Weyerhaeuser Co. 32,380 991<br />
Total 35,261<br />
Telecommunication Services (3.7%)<br />
* American Tower Corp. -<br />
Class A 60,700 1,780<br />
AT&T, Inc. 902,275 25,715<br />
CenturyTel, Inc. 15,300 418<br />
Embarq Corp. 21,730 781<br />
Frontier Communications<br />
Corp. 47,700 417<br />
Qwest Communications<br />
International, Inc. 224,335 817<br />
* Sprint Nextel Corp. 437,402 800<br />
Verizon<br />
Communications, Inc. 434,942 14,745<br />
Windstream Corp. 67,292 619<br />
Total 46,092<br />
Utilities (4.1%)<br />
* The AES Corp. 103,000 849<br />
Allegheny Energy, Inc. 25,900 877<br />
Ameren Corp. 32,367 1,076<br />
American Electric Power<br />
Co., Inc. 61,840 2,058<br />
CenterPoint Energy, Inc. 52,662 665<br />
CMS Energy Corp. 34,600 350<br />
Consolidated Edison, Inc. 41,850 1,629<br />
Constellation Energy<br />
Group, Inc. 27,300 685<br />
Dominion Resources, Inc. 88,976 3,189<br />
DTE Energy Co. 24,950 890<br />
Duke Energy Corp. 193,773 2,909<br />
* Dynegy, Inc. - Class A 77,400 155<br />
Edison International 49,920 1,603<br />
Entergy Corp. 29,009 2,411<br />
Equitable Resources, Inc. 20,000 671<br />
Exelon Corp. 100,724 5,601<br />
FirstEnergy Corp. 46,665 2,267<br />
FPL Group, Inc. 62,614 3,151<br />
Integrys Energy Group,<br />
Inc. 11,732 504<br />
Nicor, Inc. 6,950 241<br />
NiSource, Inc. 41,973 460<br />
Pepco Holdings, Inc. 33,100 588<br />
Common Stocks (97.7%)<br />
Shares/<br />
$ Par<br />
Value<br />
$ (000's)<br />
Utilities continued<br />
PG&E Corp. 55,225 2,138<br />
Pinnacle West Capital<br />
Corp. 15,400 495<br />
PPL Corp. 57,468 1,764<br />
Progress Energy, Inc. 40,292 1,606<br />
Public Service Enterprise<br />
Group, Inc. 77,472 2,260<br />
Questar Corp. 26,600 870<br />
Sempra Energy 37,302 1,590<br />
Southern Co. 118,600 4,388<br />
TECO Energy, Inc. 32,600 403<br />
Wisconsin Energy Corp. 17,900 751<br />
Xcel Energy, Inc. 68,720 1,275<br />
Total 50,369<br />
Total Common Stocks<br />
(Cost: $1,333,511) 1,202,611<br />
Short-Term Investments (2.1%)<br />
Asset-Backed Securities (0.8%)<br />
Kitty Hawk Funding<br />
Corp., 0.40%, 1/15/09 10,000,000 9,998<br />
Total 9,998<br />
Energy (0.3%)<br />
Sempra Global,<br />
1.00%, 1/2/09 3,200,000 3,200<br />
Total 3,200<br />
Federal Government & Agencies (0.3%)<br />
(b)Federal Home Loan<br />
Bank, 0.47%, 3/13/09 5,000,000 5,000<br />
Total 5,000<br />
Miscellaneous Business Credit Institutions<br />
(0.5%)<br />
Duke Energy Corp.,<br />
4.00%, 1/5/09 6,100,000 6,097<br />
Total 6,097<br />
Oil and Gas (0.2%)<br />
Devon Energy Corp.,<br />
0.95%, 1/2/09 2,100,000 2,100<br />
Total 2,100<br />
Total Short-Term Investments<br />
(Cost: $26,391) 26,395<br />
Total Investments (99.8%)<br />
(Cost: $1,359,902)(a) 1,229,006<br />
Other Assets, Less<br />
Liabilities (0.2%) 2,604<br />
Net Assets (100.0%) 1,231,610<br />
The Accompanying Notes are an Integral Part of the Financial Statements.<br />
Index 500 Stock Portfolio 21
Index 500 Stock Portfolio<br />
* Non-Income Producing<br />
ADR after the name of a security represents—American Depositary Receipt.<br />
(a)<br />
(b)<br />
At December 31, 2008 the aggregate cost of securities for federal tax purposes (in thousands) was $1,366,581 and the net unrealized depreciation of<br />
investments based on that cost was $137,575 which is comprised of $265,810 aggregate gross unrealized appreciation and $403,385 aggregate gross<br />
unrealized depreciation.<br />
All or a portion of the securities have been committed as collateral for open futures positions or when-issued securities. Information regarding open futures<br />
contracts as of period end is summarized below.<br />
Unrealized<br />
Appreciation/<br />
Number of<br />
(Depreciation)<br />
Issuer (000's)<br />
Contracts Expiration Date (000's)<br />
S&P 500 Index Futures (Long) (Total Notional Value at December 31, 2008, $27,108) 119 3/09 $ (330)<br />
22 Index 500 Stock Portfolio<br />
The Accompanying Notes are an Integral Part of the Financial Statements.
Large Company Value Portfolio<br />
Objective: Portfolio Strategy: Net Assets:<br />
Long-term of capital growth. Income Invest primarily in equity securities of companies<br />
$29 million<br />
is a secondary objective.<br />
comprising the Russell 1000 Index.<br />
Portfolio Overview<br />
Mason Street Advisors, the investment adviser for the Large Company Value Portfolio, has engaged American Century<br />
Investment Management, Inc. to act as sub-adviser for the Portfolio. The Portfolio’s investment objective is to seek long-term<br />
capital growth with income as a secondary objective. The Portfolio invests primarily in large companies. Accordingly, the<br />
Portfolio will normally have at least 80% of its net assets (plus any borrowings for investment purposes) in equity securities of<br />
companies comprising the Russell 1000 Index. The Portfolio seeks to invest in stocks of companies that it believes are<br />
undervalued at the time of purchase. Companies may be undervalued due to market declines, poor economic conditions, actual<br />
or anticipated bad news regarding the issuer or its industry, or because they have been overlooked by the market. The Portfolio<br />
purchases the stocks of these undervalued companies and holds each stock until it has returned to favor in the market and the<br />
price has increased to, or is higher than, a level that is believed to more accurately reflect the fair value of the company.<br />
Market Overview<br />
Extraordinary, if not unprecedented, market conditions characterized the period. Few investors anticipated the scope of the<br />
credit crunch, which grew into a full-blown financial crisis. The U.S. government and the Federal Reserve took extraordinary<br />
steps to provide support for the flagging financial system, with other governments and central banks following suit. In the<br />
stock market, volatility was extreme on a day-to-day basis as investors lost confidence in the financial system and worried<br />
about the government’s ability to remedy the situation. U.S. equity indexes were universally down for the twelve-month<br />
period, though value-oriented shares held up better than growth stocks, as measured by the Russell style indices.<br />
Portfolio Results<br />
The Large Company Value Portfolio returned –37.23% for the twelve months ended December 31, 2008. By comparison, the<br />
Russell 1000 Value Index returned –36.85%. (This Index is unmanaged, cannot be invested in directly and does not include<br />
administrative expenses or sales charges.) According to Lipper Analytical Services, Inc., an independent mutual fund ranking<br />
agency, the average return of the Large-Cap Value Funds peer group was –37.09%.<br />
The Portfolio’s absolute return reflected the unprecedented turmoil affecting the economy and financial markets in what was<br />
the worst year for stocks since the Great Depression. Relative to the benchmark, the Portfolio’s Financials stocks detracted<br />
most, while the key contribution to relative return came from positions in the Health Care and Information Technology sectors.<br />
Despite an underweight position, the Financials sector was the Portfolio’s largest source of underperformance versus the<br />
benchmark. Although the management team sought to approach the sector with caution and selectivity, the best relative values<br />
were the most adversely affected by the financial crisis.<br />
In particular, the Portfolio was hampered by its mix of insurance, mortgage finance and diversified financial services stocks.<br />
Three top detractors were financial giant Citigroup; life, property and casualty insurer Hartford Financial Services Group; and<br />
American International Group (AIG), the leading U.S.-based international insurer. Shares of Citigroup, which declined<br />
dramatically on worries that it had inadequate capital, stabilized only after the announcement of a U.S. government capital<br />
infusion. Hartford’s stock price fell on similar fears, while AIG’s shares lost significant value when the Federal Reserve had to<br />
rescue the company from bankruptcy. The Portfolio’s positions in Hartford and AIG have been eliminated.<br />
An underweight in the Utilities sector also negatively impacted results. The Portfolio was underrepresented in these shares<br />
because the management team believed that Utilities were not reasonably valued. In particular, the Portfolio was hurt by its<br />
lack of multi-utility names. Security selection among electric utilities also diminished relative performance.<br />
The Portfolio’s holdings in the Health Care sector contributed to results. During difficult economic times or periods of stock<br />
market turbulence, investors often regard Health Care stocks as lower risk, defensive investments because they provide<br />
essential services that are sought after regardless of the economic backdrop. Moreover, our preference for large industry<br />
leaders proved advantageous. A significant holding was Abbott Laboratories, which develops and manufactures laboratory<br />
diagnostics, medical devices and pharmaceutical therapies. Abbott reported strong sales across its entire product line,<br />
including Humira (a drug that treats autoimmune diseases).<br />
The Portfolio also benefited from strong security selection in Information Technology, primarily from large leading software<br />
and technology companies. A notable contributor was Hewlett-Packard (HP), a computer and peripheral maker. HP’s<br />
acquisition of outsourcing giant Electronic Data Systems appeared to offer a competitive advantage that we believed could add<br />
value through reorganization and cost-cutting efforts.<br />
The Portfolio’s position in the Materials sector boosted relative performance. For some time, the share prices of metals and<br />
mining firms have been momentum driven; many have not met the management team’s valuation criteria and thus have not<br />
merited sizeable exposure. This limited exposure was particularly beneficial when commodities prices fell during the final<br />
Large Company Value Portfolio 23
Large Company Value Portfolio<br />
months of 2008. For example, the Portfolio did not hold Freeport McMoRan, which is engaged in copper, gold and silver<br />
mining and production. Its stock fell on news that the company would sharply curtail its mining operations.<br />
Within the Consumer Discretionary sector, holding H&R Block helped relative returns as the company closed its subprime<br />
mortgage unit, allowing it to focus on its core tax-preparation services business which is generally perceived as less<br />
economically sensitive.<br />
Outlook<br />
Going forward, we will continue to look for large companies trading at a discount to our estimate of their worth. As a result of<br />
this process, our sector and industry allocations reflect where we are finding the best growth opportunities at a given time. As<br />
of December 31, 2008, some of our largest stakes were in Energy, Financials and Health Care.<br />
$10,000<br />
9,000<br />
8,000<br />
7,000<br />
6,000<br />
Relative Performance<br />
5,000<br />
4/07 12/07 12/08<br />
Large Company Value Portfolio<br />
Russell 1000 Value Index<br />
Average <strong>Annual</strong> Total Returns<br />
For Periods Ended December 31, 2008<br />
1 Year<br />
Since<br />
Inception*<br />
Large Company Value Portfolio<br />
Russell 1000 Value Index<br />
-37.23%<br />
-36.85%<br />
-27.06%<br />
-26.30%<br />
Lipper Variable Insurance Products<br />
(VIP) Large Cap Value Funds<br />
Average -37.09% –<br />
*Inception date of 4/30/07<br />
The performance data quoted represents past<br />
performance. Past performance is historical and does<br />
not guarantee future performance. Investment return<br />
and principal value will fluctuate, so that shares, when<br />
redeemed, may be worth more or less than their<br />
original cost. Current performance may be lower or<br />
higher than the performance data quoted. For the<br />
most recent month-end performance information visit<br />
www.nmfn.com.<br />
This chart assumes an initial investment of $10,000<br />
made on 4/30/07 (commencement of the Portfolio's<br />
operations). Returns shown reflect fee waivers,<br />
deductions for management and other portfolio<br />
expenses, and reinvestment of all dividends. In the<br />
absence of fee waivers, total return would be reduced.<br />
Returns exclude deductions for separte account sale<br />
loads and account fees. Please refer to the Benchmark<br />
Definitions section of this report for information about<br />
the indices cited in the above chart and graph.<br />
Top 10 Equity Holdings 12/31/08<br />
Security Description<br />
% of Net Assets<br />
Exxon Mobil Corp. 5.6%<br />
Chevron Corp. 4.8%<br />
AT&T, Inc. 4.2%<br />
General Electric Co. 4.2%<br />
Pfizer, Inc. 3.2%<br />
Johnson & Johnson 3.0%<br />
JPMorgan Chase & Co. 3.0%<br />
ConocoPhillips 3.0%<br />
Verizon Communications, Inc. 2.6%<br />
Royal Dutch Shell PLC - Class A, ADR 2.4%<br />
Information Technology<br />
6%<br />
Short-Term Investments<br />
& Other Net Assets<br />
6%<br />
Consumer Staples<br />
7%<br />
Telecommunication<br />
Services<br />
8%<br />
Consumer<br />
Discretionary<br />
9%<br />
Sector Allocation 12/31/08<br />
Sector Allocation is based on Net Assets.<br />
Sector Allocation and Top 10 Holdings are subject to<br />
change.<br />
Materials<br />
3%<br />
Utilities<br />
3%<br />
Energy<br />
18%<br />
Financials<br />
16%<br />
Health Care<br />
14%<br />
Industrials<br />
10%<br />
24 Large Company Value Portfolio
Large Company Value Portfolio<br />
<strong>Northwestern</strong> <strong>Mutual</strong> Series Fund, Inc.<br />
Schedule of Investments<br />
December 31, 2008<br />
Common Stocks (94.0%)<br />
Shares/<br />
$ Par<br />
Consumer Discretionary (8.8%)<br />
Value<br />
$ (000's)<br />
Best Buy Co., Inc. 5,800 163<br />
CBS Corp. - Class B 15,600 128<br />
Darden Restaurants, Inc. 3,000 85<br />
Gannett Co., Inc. 10,100 81<br />
The Gap, Inc. 10,600 142<br />
H&R Block, Inc. 11,300 257<br />
The Home Depot, Inc. 9,900 228<br />
* Kohl's Corp. 5,700 206<br />
Newell Rubbermaid, Inc. 14,900 146<br />
Staples, Inc. 11,700 210<br />
* Starbucks Corp. 6,600 62<br />
Time Warner, Inc. 39,300 395<br />
VF Corp. 3,600 197<br />
* Viacom, Inc. - Class B 11,400 217<br />
Total 2,517<br />
Consumer Staples (7.3%)<br />
Altria Group, Inc. 10,600 160<br />
The Coca-Cola Co. 9,800 444<br />
The Kroger Co. 8,900 235<br />
Lorillard, Inc. 3,400 191<br />
The Pepsi Bottling Group,<br />
Inc. 9,700 218<br />
Unilever NV 9,600 236<br />
Walgreen Co. 8,800 217<br />
Wal-Mart Stores, Inc. 7,000 392<br />
Total 2,093<br />
Energy (17.6%)<br />
Apache Corp. 2,000 149<br />
Chevron Corp. 18,700 1,383<br />
ConocoPhillips 16,300 844<br />
Devon Energy Corp. 2,100 138<br />
Exxon Mobil Corp. 20,100 1,604<br />
* National-Oilwell Varco,<br />
Inc. 5,800 142<br />
Occidental Petroleum<br />
Corp. 1,700 102<br />
Royal Dutch Shell PLC -<br />
Class A, ADR 12,800 678<br />
Total 5,040<br />
Financials (16.2%)<br />
The Allstate Corp. 10,500 344<br />
Bank of America Corp. 36,000 507<br />
The Bank of New York<br />
Mellon Corp. 10,100 286<br />
Citigroup, Inc. 49,300 331<br />
Developers Diversified<br />
Realty Corp. 3,300 16<br />
Common Stocks (94.0%)<br />
Shares/ Value<br />
$ Par $ (000's)<br />
Financials continued<br />
Discover Financial<br />
Services 7,300 70<br />
The Goldman Sachs<br />
Group, Inc. 3,000 253<br />
JPMorgan Chase & Co. 27,200 858<br />
Legg Mason, Inc. 2,800 61<br />
Loews Corp. 4,300 122<br />
Merrill Lynch & Co., Inc. 11,500 134<br />
Morgan Stanley 9,500 152<br />
National City Corp. 23,300 42<br />
Torchmark Corp. 4,300 192<br />
The Travelers Companies,<br />
Inc. 8,200 371<br />
U.S. Bancorp 9,200 230<br />
Wells Fargo & Co. 22,700 669<br />
Total 4,638<br />
Health Care (13.7%)<br />
Abbott Laboratories 5,100 272<br />
* Amgen, Inc. 6,300 364<br />
Eli Lilly and Co. 7,500 302<br />
Johnson & Johnson 14,400 861<br />
Medtronic, Inc. 5,700 179<br />
Merck & Co., Inc. 14,400 438<br />
Pfizer, Inc. 51,700 916<br />
Quest Diagnostics, Inc. 3,100 161<br />
Wyeth 11,400 428<br />
Total 3,921<br />
Industrials (10.4%)<br />
Avery Dennison Corp. 4,500 147<br />
Caterpillar, Inc. 5,300 237<br />
Dover Corp. 6,100 201<br />
General Electric Co. 74,200 1,202<br />
Ingersoll-Rand Co., Ltd. -<br />
Class A 8,500 147<br />
Northrop Grumman Corp. 7,100 320<br />
Parker Hannifin Corp. 3,700 157<br />
Pitney Bowes, Inc. 3,100 79<br />
R.R. Donnelley & Sons<br />
Co. 10,000 136<br />
Robert Half International,<br />
Inc. 2,100 44<br />
Tyco International, Ltd. 5,000 108<br />
Waste Management, Inc. 5,900 196<br />
Total 2,974<br />
Information Technology (5.8%)<br />
Applied Materials, Inc. 9,000 91<br />
* Cisco Systems, Inc. 9,300 152<br />
* Fiserv, Inc. 3,200 116<br />
Common Stocks (94.0%)<br />
Shares/ Value<br />
$ Par $ (000's)<br />
Information Technology continued<br />
Hewlett-Packard Co. 7,000 254<br />
Intel Corp. 9,000 132<br />
International Business<br />
Machines Corp. 3,300 278<br />
Microsoft Corp. 12,000 233<br />
Motorola, Inc. 7,300 32<br />
* Oracle Corp. 9,400 167<br />
Texas Instruments, Inc. 3,600 56<br />
Xerox Corp. 18,600 148<br />
Total 1,659<br />
Materials (3.4%)<br />
E.I. du Pont de Nemours<br />
and Co. 10,900 276<br />
International Paper Co. 4,900 58<br />
Nucor Corp. 4,900 226<br />
PPG Industries, Inc. 5,900 250<br />
Weyerhaeuser Co. 4,900 150<br />
Total 960<br />
Telecommunication Services (7.5%)<br />
AT&T, Inc. 42,500 1,211<br />
Embarq Corp. 3,700 133<br />
* Sprint Nextel Corp. 23,100 43<br />
Verizon Communications,<br />
Inc. 21,800 739<br />
Total 2,126<br />
Utilities (3.3%)<br />
Exelon Corp. 8,600 478<br />
* NRG Energy, Inc. 4,600 107<br />
PPL Corp. 11,300 347<br />
Total 932<br />
Total Common Stocks<br />
(Cost: $39,477) 26,860<br />
Preferred Stocks (0.1%)<br />
Financials (0.1%)<br />
Legg Mason, Inc.,<br />
7.00%, 6/30/11 1,500 33<br />
Total 33<br />
Total Preferred Stocks<br />
(Cost: $28) 33<br />
The Accompanying Notes are an Integral Part of the Financial Statements.<br />
Large Company Value Portfolio 25
Large Company Value Portfolio<br />
Short-Term<br />
Shares/ Value<br />
Investments (5.6%) $ Par $ (000's)<br />
Other Holdings (5.6%)<br />
(b) J.P. Morgan Money<br />
Market Fund 1,595,244 1,595<br />
Total 1,595<br />
Total Short-Term Investments<br />
(Cost: $1,595) 1,595<br />
Total Investments (99.7%)<br />
(Cost: $41,100)(a) 28,488<br />
Other Assets, Less<br />
Liabilities (0.3%) 82<br />
Net Assets (100.0%) 28,570<br />
* Non-Income Producing<br />
ADR after the name of a security represents—American Depositary Receipt.<br />
(a)<br />
(b)<br />
At December 31, 2008 the aggregate cost of securities for federal tax purposes (in thousands) was $41,762 and the net unrealized depreciation of<br />
investments based on that cost was $13,274 which is comprised of $123 aggregate gross unrealized appreciation and $13,397 aggregate gross unrealized<br />
depreciation.<br />
All or a portion of the securities have been committed as collateral for open futures positions or when-issued securities. Information regarding open futures<br />
contracts as of period end is summarized below.<br />
Unrealized<br />
Appreciation/<br />
Number of<br />
(Depreciation)<br />
Issuer (000's)<br />
Contracts Expiration Date (000's)<br />
S&P 500 Mini Index Futures (Long) (Total Notional Value at December 31, 2008, $1,085) 24 3/09 $ (5)<br />
The Accompanying Notes are an Integral Part of the Financial Statements.<br />
26 Large Company Value Portfolio
Domestic Equity Portfolio<br />
Objective: Portfolio Strategy: Net Assets:<br />
Long-term growth of capital and income. Invest primarily in U.S. companies that are selling at $282 million<br />
attractive prices relative to their market and peers.<br />
Portfolio Overview<br />
Mason Street Advisors, the investment adviser for the Domestic Equity Portfolio, has engaged Capital Guardian Trust<br />
Company to act as sub-adviser for the Portfolio. The Portfolio seeks long-term growth of capital and income. The Portfolio<br />
seeks to meet this objective by investing primarily in equity securities of U.S. issuers and securities whose principal markets<br />
are in the U.S., including American Depositary Receipts and other U.S.-registered securities. The companies in which the<br />
Portfolio invests will generally have a market capitalization of $1 billion or more at the time of purchase. The Portfolio focuses<br />
on companies selling at attractive prices relative to their market and peers. In selecting investments, the Portfolio stresses<br />
companies with below-market price-to-earnings and price-to-book ratios and above-market dividend yields.<br />
Market Overview<br />
Financial markets endured a brutal 2008, which saw the failure of a number of leading financial institutions, credit markets<br />
freeze up and the U.S. government take a series of extraordinary steps to support the economy and financial system. The crisis<br />
was a result of the ongoing sub-prime mortgage meltdown, which spread rapidly through the domestic financial sector and into<br />
virtually every segment of global financial markets. For the twelve months ended December 31, 2008, returns for large-,<br />
medium- and small-sized companies were –37.60%, –41.46% and –33.79%, as measured by the Russell 1000, Russell MidCap<br />
and Russell 2000 Stock Indices, respectively. No sector of the market had positive returns for the year, and value-oriented<br />
stocks held up modestly better than growth stocks, as measured by the Russell style indices.<br />
Portfolio Results<br />
The Domestic Equity Portfolio returned –38.49% for the twelve months ended December 31, 2008. By comparison, the<br />
Russell 1000 Value Index returned –36.85%. (This Index is unmanaged, cannot be invested in directly and does not include<br />
administrative expenses or sales charges.) According to Lipper Analytical Services, Inc., an independent mutual fund ranking<br />
agency, the average return of the Large-Cap Value Funds peer group was<br />
–37.09%.<br />
The Portfolio’s absolute return reflected the unprecedented turmoil affecting the economy and financial markets in what was<br />
the worst year for stocks since the Great Depression. In that environment, no sector managed positive results. Relative to the<br />
benchmark, the Portfolio’s underperformance was driven by positioning in the Energy and Financials sectors. The key<br />
contribution to relative return came from selection in the Materials sector.<br />
The leading source of underperformance relative to the Index was an underweight position and stock selection in the Energy<br />
sector. In particular, it hurt to be underrepresented in big integrated oil companies Exxon Mobil and Chevron. These large,<br />
liquid stocks were prized for their defensive characteristics and held up much better than the Index as a whole. While we<br />
agreed these were well-run companies with dominant market positions, they failed to clear our value hurdles—which include<br />
relative price-to-earnings, price-to-book and dividend yield measures—necessary for larger weightings in the Portfolio.<br />
Financials was another key area of weakness. In past financial crises, high quality, large-cap financials earned their way out of<br />
challenging economic and credit environments, and our analysis of several financial companies suggested the same could<br />
happen this time. Unfortunately, we did not anticipate the depth and speed of the deterioration in fundamentals in the current<br />
crisis. As a result, four of our top five detractors for the year were thrift and mortgage companies Washington <strong>Mutual</strong> and<br />
Wachovia, insurer XL Capital and investment bank Lehman Brothers. On a positive note, a number of our stock picks in the<br />
sector worked well, as overweight positions in Hudson City Bancorp, JPMorgan Chase and Wells Fargo, and underweight<br />
positions in Citigroup and Bank of America were all top ten contributors to relative results for the year.<br />
At the sector level, our stock selection was most effective in the Materials sector, where the leading contributors were steel<br />
maker Nucor and construction materials firm Vulcan Materials. These stocks were on a wild ride in 2008, surging early in the<br />
year along with commodity prices, then falling as prospects for global growth dimmed, and see-sawing once again in the final<br />
months on prospects for an economic stimulus plan. We tend to be long-term, buy-and-hold investors in shares whose<br />
valuations and business prospects we find compelling. But because of all the volatility in the share prices of these companies<br />
in 2008, these stocks vacillated from being fully valued to undervalued according to our metrics. As a result, we were selling<br />
these stocks near their highs and buying at their lows, which helped performance.<br />
Outlook<br />
Looking at the markets in 2008, it is surprising how little returns were differentiated by earnings quality—the entire market<br />
was painted with the same broad brush. That made for a frustrating year, because “good” and “bad” companies suffered alike.<br />
But the positive outcome is that we are now finding many high quality companies trading at very attractive levels. Indeed, we<br />
Domestic Equity Portfolio 27
Domestic Equity Portfolio<br />
have been able to invest in what we believe to be industry-leading, high-quality companies such as United Parcel Service,<br />
Lowe’s and United Technologies—companies whose stocks almost never meet our value criteria. So while it is impossible to<br />
know when economic and market conditions will turn, we are using this opportunity to attempt to position the Portfolio for<br />
outperformance by adding what we believe to be well-run, attractively valued companies at knock-down prices. As of<br />
December 31, the largest sector overweight was Consumer Staples, while the most notable sector underweight was in Energy.<br />
Relative Performance<br />
$20,000<br />
15,000<br />
10,000<br />
5,000<br />
0<br />
7/01 12/01 12/02 12/03 12/04 12/05 12/06 12/07 12/08<br />
Top 10 Equity Holdings 12/31/08<br />
Security Description<br />
% of Net Assets<br />
Kraft Foods, Inc. - Class A 4.3%<br />
AT&T, Inc. 4.2%<br />
JPMorgan Chase & Co. 3.4%<br />
General Electric Co. 3.3%<br />
Hudson City Bancorp, Inc. 3.3%<br />
The Goldman Sachs Group, Inc. 3.3%<br />
Nucor Corp. 3.2%<br />
Wells Fargo & Co. 3.0%<br />
United Technologies Corp. 2.7%<br />
Sara Lee Corp. 2.5%<br />
Domestic Equity Portfolio<br />
Russell 1000 Value Index<br />
Average <strong>Annual</strong> Total Returns<br />
For Periods Ended December 31, 2008<br />
1 Year 5 Years<br />
Since<br />
Inception*<br />
Domestic Equity Portfolio<br />
Russell 1000 Value Index<br />
-38.49% -3.25%<br />
-36.85% -0.79%<br />
-1.74%<br />
0.16%<br />
Lipper Variable Insurance Products<br />
(VIP) Large Cap Value Funds<br />
Average -37.09% -2.10% –<br />
*Inception date of 7/31/01<br />
The performance data quoted represents past<br />
performance. Past performance is historical and does<br />
not guarantee future performance. Investment return<br />
and principal value will fluctuate, so that shares, when<br />
redeemed, may be worth more or less than their original<br />
cost. Current performance may be lower or higher than<br />
the performance data quoted. For the most recent<br />
month-end performance information visit<br />
www.nmfn.com.<br />
This chart assumes an initial investment of $10,000<br />
made on 7/31/01 (commencement of the Portfolio's<br />
operations). Returns shown reflect fee waivers,<br />
deductions for management and other portfolio<br />
expenses, and reinvestment of all dividends. In the<br />
absence of fee waivers, total return would be reduced.<br />
Returns exclude deductions for separte account sale<br />
loads and account fees. Please refer to the Benchmark<br />
Definitions section of this report for information about<br />
the indices cited in the above chart and graph.<br />
Telecommunication Services<br />
5%<br />
Utilities<br />
5%<br />
Materials<br />
7%<br />
Short-Term<br />
Investments &<br />
Other Net Assets<br />
8%<br />
Consumer<br />
Discretionary<br />
9%<br />
Health Care<br />
9%<br />
Sector Allocation 12/31/08<br />
Information Technology<br />
4%<br />
Sector Allocation is based on Net Assets.<br />
Sector Allocation and Top 10 Holdings are subject to<br />
change.<br />
Financials<br />
15%<br />
Consumer<br />
Staples<br />
15%<br />
Industrials<br />
12%<br />
Energy<br />
11%<br />
28 Domestic Equity Portfolio
Domestic Equity Portfolio<br />
<strong>Northwestern</strong> <strong>Mutual</strong> Series Fund, Inc.<br />
Schedule of Investments<br />
December 31, 2008<br />
Common Stocks (92.4%)<br />
Consumer Discretionary (8.9%)<br />
Shares/<br />
$ Par<br />
Value<br />
$ (000's)<br />
Carnival Corp. 148,600 3,614<br />
Comcast Corp. - Class A 96,400 1,627<br />
Gannett Co., Inc. 127,000 1,016<br />
Harley-Davidson, Inc. 84,600 1,436<br />
* The Interpublic Group of<br />
Companies, Inc. 82 0<br />
* Jarden Corp. 30,400 350<br />
Lowe's Cos., Inc. 205,500 4,422<br />
Nordstrom, Inc. 196,600 2,617<br />
Target Corp. 26,200 905<br />
* Time Warner Cable, Inc. -<br />
Class A 123,900 2,658<br />
Time Warner, Inc. 310,400 3,123<br />
* Viacom, Inc. - Class B 101,600 1,936<br />
The Walt Disney Co. 52,500 1,191<br />
Total 24,895<br />
Consumer Staples (15.4%)<br />
Altria Group, Inc. 412,900 6,218<br />
The Clorox Co. 11,000 611<br />
The Coca-Cola Co. 73,500 3,328<br />
* Energizer Holdings, Inc. 28,300 1,532<br />
Kimberly-Clark Corp. 65,600 3,460<br />
Kraft Foods, Inc. - Class A 446,357 11,985<br />
Lorillard, Inc. 33,100 1,865<br />
PepsiCo, Inc. 10,300 564<br />
Philip Morris International,<br />
Inc. 65,800 2,863<br />
Sara Lee Corp. 731,900 7,165<br />
Unilever NV 158,300 3,886<br />
Total 43,477<br />
Energy (11.0%)<br />
Chevron Corp. 75,846 5,610<br />
ConocoPhillips 122,200 6,330<br />
Exxon Mobil Corp. 26,700 2,131<br />
Marathon Oil Corp. 249,300 6,821<br />
Royal Dutch Shell PLC -<br />
Class A, ADR 82,500 4,368<br />
Royal Dutch Shell PLC -<br />
Class B, ADR 21,028 1,082<br />
Spectra Energy Corp. 110,500 1,739<br />
* Transocean, Ltd. 29,447 1,391<br />
The Williams Companies,<br />
Inc. 106,500 1,542<br />
Total 31,014<br />
Financials (15.5%)<br />
ACE, Ltd. 44,000 2,328<br />
East West Bancorp, Inc. 39,900 637<br />
The Goldman Sachs Group,<br />
Inc. 109,500 9,241<br />
Hudson City Bancorp, Inc. 583,900 9,319<br />
JPMorgan Chase & Co. 307,200 9,686<br />
Common Stocks (92.4%)<br />
Shares/ Value<br />
$ Par $ (000's)<br />
Financials continued<br />
Mercury General Corp. 29,500 1,357<br />
The Progressive Corp. 126,900 1,879<br />
SunTrust Banks, Inc. 22,500 665<br />
Wells Fargo & Co. 285,200 8,408<br />
Total 43,520<br />
Health Care (9.0%)<br />
Aetna, Inc. 95,000 2,707<br />
AstraZeneca PLC, ADR 64,800 2,659<br />
Cardinal Health, Inc. 97,100 3,347<br />
* DaVita, Inc. 54,500 2,702<br />
Merck & Co., Inc. 75,600 2,298<br />
Pfizer, Inc. 293,400 5,196<br />
Sanofi-Aventis, ADR 198,700 6,390<br />
Total 25,299<br />
Industrials (12.1%)<br />
3M Co. 27,300 1,571<br />
Emerson Electric Co. 46,600 1,706<br />
FedEx Corp. 34,300 2,200<br />
General Electric Co. 579,700 9,391<br />
Illinois Tool Works, Inc. 106,700 3,740<br />
* Monster Worldwide, Inc. 128,800 1,557<br />
Parker Hannifin Corp. 14,914 635<br />
Southwest Airlines Co. 204,800 1,765<br />
Tyco International, Ltd. 47,075 1,017<br />
United Parcel Service, Inc.<br />
- Class B 53,800 2,968<br />
United Technologies Corp. 141,200 7,568<br />
Total 34,118<br />
Information Technology (4.4%)<br />
* Affiliated Computer<br />
Services, Inc. - Class A 36,800 1,691<br />
Hewlett-Packard Co. 52,600 1,909<br />
Intel Corp. 78,800 1,155<br />
Jabil Circuit, Inc. 496,900 3,354<br />
KLA-Tencor Corp. 127,400 2,776<br />
Nintendo Co., Ltd., ADR 28,800 1,375<br />
Total 12,260<br />
Materials (6.5%)<br />
Allegheny Technologies,<br />
Inc. 142,700 3,643<br />
The Dow Chemical Co. 44,200 667<br />
Nucor Corp. 193,600 8,945<br />
Vulcan Materials Co. 73,700 5,128<br />
Total 18,383<br />
Telecommunication Services (4.6%)<br />
AT&T, Inc. 410,300 11,694<br />
Verizon Communications,<br />
Inc. 38,000 1,288<br />
Total 12,982<br />
Common Stocks (92.4%)<br />
Utilities (5.0%)<br />
Shares/<br />
$ Par<br />
Value<br />
$ (000's)<br />
American Water Works<br />
Co., Inc. 181,400 3,788<br />
CMS Energy Corp. 178,200 1,802<br />
Edison International 113,900 3,658<br />
Pinnacle West Capital<br />
Corp. 83,600 2,686<br />
Southern Co. 59,800 2,212<br />
Total 14,146<br />
Total Common Stocks<br />
(Cost: $325,417) 260,094<br />
Preferred Stocks (1.7%)<br />
Metals/Mining (0.9%)<br />
Freeport-McMoRan<br />
Copper & Gold, Inc.,<br />
6.75%, 5/1/10 53,900 2,557<br />
Total 2,557<br />
Pharmaceutical Preparations (0.8%)<br />
Schering-Plough Corp.,<br />
6.00%, 8/13/10 12,900 2,251<br />
Total 2,251<br />
Total Preferred Stocks<br />
(Cost: $4,472) 4,808<br />
Convertible Corporate Bonds (0.2%)<br />
Automobiles and Other Motor Vehicles<br />
(0.2%)<br />
Ford Motor Co.,<br />
4.25%, 12/15/36 2,846,000 733<br />
Total 733<br />
Total Convertible Corporate<br />
Bonds<br />
(Cost: $2,911) 733<br />
Short-Term Investments (5.5%)<br />
Energy (1.1%)<br />
Sempra Global,<br />
4.50%, 1/5/09 3,000,000 2,998<br />
Total 2,998<br />
Federal Government & Agencies (1.2%)<br />
Federal Home Loan Bank,<br />
0.28%, 1/16/09 1,000,000 1,000<br />
Federal Home Loan Bank,<br />
0.10%, 2/13/09 2,500,000 2,500<br />
Total 3,500<br />
The Accompanying Notes are an Integral Part of the Financial Statements.<br />
Domestic Equity Portfolio 29
Domestic Equity Portfolio<br />
Short-Term<br />
Investments (5.5%)<br />
Finance Services (2.1%)<br />
Shares/<br />
$ Par<br />
Value<br />
$ (000's)<br />
Atlantic Asset<br />
Securitization LLC,<br />
0.80%, 1/12/09 3,000,000 2,999<br />
Falcon Asset Securitization<br />
Co. LLC, 0.20%, 1/27/09 3,000,000 3,000<br />
Total 5,999<br />
Retail Food and Drug (1.1%)<br />
CVS Corp., 5.55%, 1/8/09 3,000,000 2,997<br />
Total 2,997<br />
Total Short-Term Investments<br />
(Cost: $15,494) 15,494<br />
Total Investments (99.8%)<br />
(Cost: $348,294)(a) 281,129<br />
Other Assets, Less<br />
Liabilities (0.2%) 427<br />
Net Assets (100.0%) 281,556<br />
* Non-Income Producing<br />
ADR after the name of a security represents—American Depositary Receipt.<br />
(a)<br />
(l)<br />
At December 31, 2008 the aggregate cost of securities for federal tax purposes (in thousands) was $348,857 and the net unrealized depreciation of<br />
investments based on that cost was $67,728 which is comprised of $5,948 aggregate gross unrealized appreciation and $73,676 aggregate gross unrealized<br />
depreciation.<br />
As of December 31, 2008, portfolio securities with an aggregate value of $2,328 (in thousands) were fair valued under procedures adopted by the Board of<br />
Directors.<br />
(m) Securities showing zero value represent an amount less than one thousand.<br />
The Accompanying Notes are an Integral Part of the Financial Statements.<br />
30 Domestic Equity Portfolio
Equity Income Portfolio<br />
Objective: Portfolio Strategy: Net Assets:<br />
Long-term growth of capital and income. Invests in commons stocks with a focus on established $152 million<br />
companies paying above-average dividends.<br />
Portfolio Overview<br />
Mason Street Advisors, the investment adviser for the Equity Income Portfolio, has engaged T. Rowe Price Associates, Inc. to<br />
act as sub-adviser for the Portfolio. The objective of the Portfolio is long-term growth of capital and income. Management<br />
seeks to achieve this objective mainly through investment in common stocks with a focus on well-established companies<br />
paying above-average dividends. A value approach is used in selecting investments, with an effort made to identify companies<br />
that appear to be undervalued by various measures but have good prospects for capital appreciation and dividend growth.<br />
Management looks for characteristics such as an established operating history, above-average dividend yield, a low<br />
price/earnings ratio, sound financial condition and a low stock price relative to a company’s underlying value.<br />
Market Overview<br />
Financial markets endured a brutal 2008, which saw the failure of a number of leading financial institutions, credit markets<br />
freeze up and the U.S. government take a series of extraordinary steps to support the economy and financial system. The crisis<br />
was a result of the ongoing sub-prime mortgage meltdown, which spread rapidly through the domestic financial sector and into<br />
virtually every segment of global financial markets.<br />
For the twelve months ended December 31, 2008, returns for large-, medium- and small-sized companies were –37.60%,<br />
–41.46% and –33.79%, as measured by the Russell 1000, Russell MidCap and Russell 2000 Stock Indices, respectively.<br />
Looking at returns by style, value-oriented shares held up better than growth stocks, as measured by the Russell style indices.<br />
No sector in the market provided positive returns. In the large-cap space, the traditionally defensive Consumer Staples and<br />
Health Care sectors held up best, while financials performed worst because these stocks were at the epicenter of the credit<br />
crisis.<br />
Portfolio Results<br />
The Equity Income Portfolio returned –35.81% for the twelve months ended December 31, 2008. By comparison, the Russell<br />
1000 Value Index returned –36.85%. (This Index is unmanaged, cannot be invested in directly and does not include<br />
administrative expenses or sales charges.) The average return of the Equity Income Funds peer group was –35.83%, according<br />
to Lipper Analytical Services, Inc., an independent mutual fund ranking agency.<br />
The Portfolio’s absolute return reflected the unprecedented turmoil affecting the economy and financial markets in what was<br />
the worst year for stocks since the Great Depression. In that environment, no sector contributed positively to results. Relative<br />
to the benchmark, the Portfolio’s outperformance was a result of positioning in the hard-hit Financials sector. At the other end<br />
of the spectrum, Consumer Discretionary shares were the leading detractors from relative results.<br />
Looking at positive contributors to return relative to the benchmark, outperformance was driven by an underweight position in<br />
Financials. Among individual contributors, insurance broker Marsh & McLennan stands out for having shown improvement in<br />
its brokerage business and we believe also stands to benefit when property and casualty pricing stabilizes.<br />
Stock selection made the Consumer Staples sector a leading source of relative strength. These traditionally defensive shares<br />
held up relatively well during an extremely volatile period, helped in part by mergers and acquisition activity. For example,<br />
Anheuser-Busch, which agreed to be acquired by European beverage giant InBev, performed well during the period. Names in<br />
the food products industry were key contributors, as General Mills was able to pass along higher prices to consumers, while<br />
Hershey benefited from discussions of a potential buyout.<br />
At the other end of the spectrum, stock selection made Consumer Discretionary shares a leading detractor from relative<br />
performance. Some of the key detractors were in the media space, as the economic slowdown meant declining profits, writedowns<br />
and layoffs at newspaper and broadcasting company Gannett. In addition, casino operator MGM Mirage saw fewer<br />
patrons and poorer revenues in tough economic times, while tight credit markets meant increased borrowing costs, limiting its<br />
ability to fund planned capital expenditures.<br />
It also hurt to be underrepresented in Energy shares, which benefited from the big run-up in energy prices through July 2008.<br />
A notable detractor was domestic oil company Murphy Oil, which was hurt in the second half of the year by tumbling prices<br />
for oil and gas, to which the stock was highly levered. Murphy was removed from the Russell 1000 Value Index during the<br />
June rebalancing, meaning the Index did not reflect the effect on Murphy’s share price of the precipitous decline in oil.<br />
An overweight position made Information Technology stocks detractors from relative return for the year as these shares<br />
declined along with the outlook for growth and earnings. Telecommunication equipment maker Alcatel-Lucent was hurt by the<br />
global slowdown even as the company continued to work on its turnaround under new management.<br />
Equity Income Portfolio 31
Equity Income Portfolio<br />
Outlook<br />
As we emerge from one of the most challenging market environments in history, we expect some improvement in economic<br />
fundamentals in 2009 and an eventual easing of the crisis of confidence and liquidity in the system. While it is not clear when<br />
markets will recover, we are reasonably optimistic about the prospects for equity returns as we look out over the next couple of<br />
years. In the meantime, we will continue to pursue companies that have good business models and strong balance sheets<br />
trading at what we believe are depressed levels. It is our belief that this approach remains valid and that the market will<br />
ultimately reward those willing to make investments in fundamentally sound companies during times of uncertainty and stress.<br />
Relative Performance<br />
$20,000<br />
15,000<br />
10,000<br />
5,000<br />
0<br />
5/03 12/03 12/04 12/05 12/06 12/07 12/08<br />
Top 10 Equity Holdings 12/31/08<br />
Security Description<br />
% of Net Assets<br />
Exxon Mobil Corp. 3.5%<br />
JPMorgan Chase & Co. 3.3%<br />
Chevron Corp. 3.2%<br />
General Electric Co. 3.0%<br />
AT&T, Inc. 2.5%<br />
Royal Dutch Shell PLC - Class A, ADR 2.2%<br />
Wells Fargo & Co. 2.0%<br />
The Hershey Co. 1.8%<br />
The Home Depot, Inc. 1.6%<br />
3M Co. 1.6%<br />
Equity Income Portfolio<br />
Russell 1000 Value Index<br />
Average <strong>Annual</strong> Total Returns<br />
For Periods Ended December 31, 2008<br />
1 Year 5 Years<br />
Since<br />
Inception*<br />
Equity Income Portfolio<br />
Russell 1000 Value Index<br />
-35.81% -1.07%<br />
-36.85% -0.79%<br />
2.83%<br />
3.39%<br />
Lipper Variable Insurance Products<br />
(VIP) Equity Income Funds<br />
Average -35.83% -0.99% –<br />
*Inception date of 5/1/03<br />
The performance data quoted represents past<br />
performance. Past performance is historical and does<br />
not guarantee future performance. Investment return<br />
and principal value will fluctuate, so that shares, when<br />
redeemed, may be worth more or less than their original<br />
cost. Current performance may be lower or higher than<br />
the performance data quoted. For the most recent<br />
month-end performance information visit<br />
www.nmfn.com.<br />
This chart assumes an initial investment of $10,000<br />
made on 5/1/03 (commencement of the Portfolio's<br />
operations). Returns shown reflect fee waivers,<br />
deductions for management and other portfolio<br />
expenses, and reinvestment of all dividends. In the<br />
absence of fee waivers, total return would be reduced.<br />
Returns exclude deductions for separte account sale<br />
loads and account fees. Please refer to the Benchmark<br />
Definitions section of this report for information about<br />
the indices cited in the above chart and graph.<br />
Consumer Staples<br />
4%<br />
Short-Term Investments<br />
& Other Net Assets<br />
4%<br />
Materials<br />
6%<br />
Information<br />
Technology<br />
6%<br />
Utilities<br />
6%<br />
Health Care<br />
9%<br />
Industrials<br />
12%<br />
Sector Allocation 12/31/08<br />
Other Holdings<br />
4%<br />
Financials<br />
20%<br />
Energy<br />
15%<br />
Consumer<br />
Discretionary<br />
14%<br />
Sector Allocation is based on Net Assets.<br />
Sector Allocation and Top 10 Holdings are subject to<br />
change.<br />
32 Equity Income Portfolio
Equity Income Portfolio<br />
<strong>Northwestern</strong> <strong>Mutual</strong> Series Fund, Inc.<br />
Schedule of Investments<br />
December 31, 2008<br />
Common Stocks (95.5%)<br />
Consumer Discretionary (14.3%)<br />
Shares/<br />
$ Par<br />
Value<br />
$ (000's)<br />
* Bed Bath & Beyond, Inc. 64,400 1,637<br />
The Black & Decker Corp. 14,300 598<br />
Cablevision Systems Corp. -<br />
Class A 49,200 829<br />
CBS Corp. - Class B 37,050 304<br />
D.R. Horton, Inc. 32,000 226<br />
Fortune Brands, Inc. 48,700 2,010<br />
Gannett Co., Inc. 23,800 190<br />
Genuine Parts Co. 25,600 969<br />
H&R Block, Inc. 43,800 995<br />
Harley-Davidson, Inc. 33,700 572<br />
Harman International<br />
Industries, Inc. 17,500 293<br />
The Home Depot, Inc. 105,600 2,431<br />
Macy's, Inc. 37,000 383<br />
Marriott International, Inc. -<br />
Class A 34,700 675<br />
Mattel, Inc. 67,700 1,083<br />
The McGraw-Hill Cos., Inc. 62,800 1,456<br />
* MGM MIRAGE 44,700 615<br />
The New York Times Co. -<br />
Class A 73,100 536<br />
Newell Rubbermaid, Inc. 75,800 741<br />
Tiffany & Co. 28,800 681<br />
Time Warner, Inc. 166,500 1,675<br />
The Walt Disney Co. 67,000 1,520<br />
Whirlpool Corp. 26,700 1,104<br />
WPP PLC, ADR 5,400 160<br />
Total 21,683<br />
Consumer Staples (4.1%)<br />
Colgate-Palmolive Co. 2,700 185<br />
The Estee Lauder Companies,<br />
Inc. - Class A 2,700 83<br />
The Hershey Co. 76,400 2,654<br />
Kimberly-Clark Corp. 21,400 1,129<br />
Kraft Foods, Inc. - Class A 48,700 1,308<br />
McCormick & Co., Inc. 20,900 666<br />
Whole Foods Market, Inc. 19,700 186<br />
Total 6,211<br />
Energy (14.6%)<br />
Anadarko Petroleum Corp. 32,000 1,233<br />
BJ Services Co. 30,900 361<br />
BP PLC, ADR 40,600 1,898<br />
Chevron Corp. 65,500 4,845<br />
CONSOL Energy, Inc. 15,900 454<br />
Exxon Mobil Corp. 65,500 5,229<br />
Murphy Oil Corp. 39,000 1,730<br />
Royal Dutch Shell PLC - Class<br />
A, ADR 62,300 3,298<br />
Schlumberger, Ltd. 20,300 859<br />
Spectra Energy Corp. 37,350 588<br />
Common Stocks (95.5%)<br />
Shares/<br />
$ Par<br />
Value<br />
$ (000's)<br />
Energy continued<br />
Sunoco, Inc. 37,000 1,608<br />
Total 22,103<br />
Financials (20.1%)<br />
Allied Irish Banks PLC, ADR 42,300 198<br />
American Express Co. 67,700 1,256<br />
Bank of America Corp. 74,571 1,050<br />
The Bank of New York Mellon<br />
Corp. 69,900 1,980<br />
Capital One Financial Corp. 39,000 1,244<br />
The Chubb Corp. 16,800 857<br />
Citigroup, Inc. 62,800 421<br />
Fifth Third Bancorp 78,300 647<br />
The Goldman Sachs Group,<br />
Inc. 15,100 1,274<br />
The Hartford Financial<br />
Services Group, Inc. 5,200 85<br />
Janus Capital Group, Inc. 34,500 277<br />
JPMorgan Chase & Co. 158,288 4,991<br />
KeyCorp 73,600 627<br />
Legg Mason, Inc. 10,600 232<br />
Lincoln National Corp. 47,376 893<br />
Marsh & McLennan<br />
Companies, Inc. 92,000 2,233<br />
Marshall & Ilsley Corp. 32,800 447<br />
Merrill Lynch & Co., Inc. 79,940 931<br />
(p)Merrill Lynch & Co., Inc. 30,069 333<br />
Och-Ziff Capital Management<br />
Group - Class A 29,600 152<br />
The Progressive Corp. 51,100 757<br />
*SLM Corp. 106,800 951<br />
SunTrust Banks, Inc. 54,100 1,598<br />
The Travelers Companies, Inc. 21,927 991<br />
U.S. Bancorp 92,000 2,301<br />
*UBS AG 48,015 687<br />
Wells Fargo & Co. 102,900 3,033<br />
Total 30,446<br />
Health Care (8.9%)<br />
*Amgen, Inc. 28,100 1,623<br />
Bristol-Myers Squibb Co. 65,500 1,523<br />
Eli Lilly and Co. 45,400 1,828<br />
Johnson & Johnson 27,300 1,633<br />
Merck & Co., Inc. 65,000 1,976<br />
Pfizer, Inc. 120,100 2,127<br />
*WellPoint, Inc. 19,300 813<br />
Wyeth 51,900 1,947<br />
Total 13,470<br />
Industrials (11.6%)<br />
3M Co. 40,900 2,353<br />
Avery Dennison Corp. 38,200 1,250<br />
The Boeing Co. 32,000 1,365<br />
The Accompanying Notes are an Integral Part of the Financial Statements.<br />
Equity Income Portfolio 33
Equity Income Portfolio<br />
Common Stocks (95.5%)<br />
Shares/<br />
$ Par<br />
Value<br />
$ (000's)<br />
Industrials continued<br />
Cooper Industries, Ltd. -<br />
Class A 25,100 734<br />
Deere & Co. 32,100 1,230<br />
Eaton Corp. 10,600 527<br />
General Electric Co. 278,400 4,510<br />
Honeywell International, Inc. 35,200 1,156<br />
Illinois Tool Works, Inc. 51,900 1,819<br />
Masco Corp. 88,900 990<br />
United Parcel Service, Inc. -<br />
Class B 27,300 1,506<br />
* USG Corp. 29,900 240<br />
Total 17,680<br />
Information Technology (5.8%)<br />
* Alcatel-Lucent, ADR 54,800 118<br />
Analog Devices, Inc. 54,600 1,039<br />
Applied Materials, Inc. 44,700 453<br />
* Cisco Systems, Inc. 28,900 471<br />
* Computer Sciences Corp. 32,800 1,153<br />
* Dell, Inc. 81,200 831<br />
* eBay, Inc. 46,000 642<br />
Intel Corp. 54,500 799<br />
Microsoft Corp. 98,300 1,911<br />
Tyco Electronics, Ltd. 28,400 460<br />
* Yahoo!, Inc. 76,400 932<br />
Total 8,809<br />
Materials (5.7%)<br />
Alcoa, Inc. 56,700 638<br />
E.I. du Pont de Nemours and<br />
Co. 48,500 1,227<br />
International Flavors &<br />
Fragrances, Inc. 35,500 1,055<br />
International Paper Co. 105,000 1,239<br />
MeadWestvaco Corp. 48,900 547<br />
Nucor Corp. 39,300 1,816<br />
Vulcan Materials Co. 24,600 1,712<br />
Weyerhaeuser Co. 13,300 407<br />
Total 8,641<br />
Telecommunication Services (4.5%)<br />
AT&T, Inc. 132,135 3,766<br />
Qwest Communications<br />
International, Inc. 272,900 993<br />
* Sprint Nextel Corp. 123,800 227<br />
Verizon Communications, Inc. 57,000 1,932<br />
Total 6,918<br />
Utilities (5.9%)<br />
Duke Energy Corp. 74,600 1,120<br />
Entergy Corp. 12,900 1,072<br />
FirstEnergy Corp. 13,300 646<br />
NiSource, Inc. 101,700 1,116<br />
* NRG Energy, Inc. 10,700 249<br />
PG&E Corp. 27,300 1,057<br />
Pinnacle West Capital Corp. 27,100 871<br />
Progress Energy, Inc. 32,500 1,295<br />
TECO Energy, Inc. 22,400 277<br />
Common Stocks (95.5%)<br />
Shares/<br />
$ Par<br />
Value<br />
$ (000's)<br />
Utilities continued<br />
Xcel Energy, Inc. 64,000 1,187<br />
Total 8,890<br />
Total Common Stocks (Cost: $208,948) 144,851<br />
Foreign Common Stocks<br />
(0.1%) Country<br />
Consumer Discretionary (0.1%)<br />
United<br />
WPP PLC<br />
Kingdom 28,500 169<br />
Total 169<br />
Financials (0.0%)<br />
*UBS AG Switzerland 3,700 53<br />
Total 53<br />
Total Foreign Common Stocks (Cost: $323) 222<br />
Preferred Stocks (0.0%)<br />
Federal Government & Agencies (0.0%)<br />
Federal National Mortgage<br />
Association 27,600 29<br />
Total 29<br />
Total Preferred Stocks<br />
(Cost: $1,207) 29<br />
Convertible Coporate Bonds (0.1%)<br />
Consumer Discretionary (0.1%)<br />
Ford Motor Co., 4.25%,<br />
12/15/36 929,000 239<br />
Total 239<br />
Total Convertible Corporate Bonds<br />
(Cost: $467) 239<br />
Short-Term Investments (3.9%)<br />
Other Holdings (3.9%)<br />
T. Rowe Price Reserve<br />
Investment Fund 5,910,788 5,911<br />
Total 5,911<br />
Total Short-Term Investments<br />
(Cost: $5,911) 5,911<br />
Total Investments (99.7%)<br />
(Cost: $216,856)(a) 151,252<br />
Other Assets, Less<br />
Liabilities (0.3%) 389<br />
Net Assets (100.0%) 151,641<br />
The Accompanying Notes are an Integral Part of the Financial Statements.<br />
34 Equity Income Portfolio
Equity Income Portfolio<br />
* Non-Income Producing<br />
ADR after the name of a security represents—American Depositary Receipt.<br />
(a)<br />
(l)<br />
At December 31, 2008 the aggregate cost of securities for federal tax purposes (in thousands) was $218,157 and the net unrealized depreciation of<br />
investments based on that cost was $66,905 which is comprised of $2,825 aggregate gross unrealized appreciation and $69,730 aggregate gross unrealized<br />
depreciation.<br />
As of December 31, 2008, portfolio securities with an aggregate value of $555 (in thousands) were fair valued under procedures adopted by the Board of<br />
Directors.<br />
(p) Restricted securities (excluding 144A issues) on December 31, 2008<br />
Value as a<br />
Percentage of<br />
Description Acquistion Date Cost (000's) Value (000's) Net Assets<br />
Merrill Lynch & Co., Inc. 7/29/08 $ 832 $ 333 0.22%<br />
The Accompanying Notes are an Integral Part of the Financial Statements.<br />
Equity Income Portfolio 35
Mid Cap Growth Stock Portfolio<br />
Objective: Portfolio Strategy: Net Assets:<br />
Long-term growth of capital.<br />
Invests in mid-sized companies with potential for<br />
$696 million<br />
above-average growth.<br />
Portfolio Overview<br />
Mason Street Advisors acts as the investment adviser for the Mid Cap Growth Stock Portfolio. The investment objective of the<br />
Portfolio is long-term growth of capital. The Mid Cap Growth Stock Portfolio seeks growth companies in the middlecapitalization<br />
range, as measured by the Portfolio’s benchmark. The Portfolio’s focus in stock selection is on companies with<br />
above-average growth potential giving consideration to factors such as companies’ ability to generate revenue, expand profit<br />
margins and maintain solid balance sheets. Industry and sector selection is of secondary importance.<br />
Market Overview<br />
Financial markets endured a brutal 2008, which saw the failure of a number of leading financial institutions, credit markets<br />
freeze up, and the U.S. government take a series of extraordinary steps to support the economy and financial system. The crisis<br />
was a result of the ongoing sub-prime mortgage meltdown, which spread rapidly through the domestic financial sector and into<br />
virtually every segment of global financial markets.<br />
For all of 2008, returns for large-, medium- and small-sized companies were –37.60%, –41.46% and –33.79%, as measured by<br />
the Russell 1000, Russell MidCap and Russell 2000 Stock Indices, respectively. Small-cap stocks held up best after lagging<br />
stocks of large- and mid-sized companies in 2007. That relative outperformance also reflected the fact that the Financial sector<br />
wreckage was concentrated in large-cap names. No sector of the market had positive returns for the year, and value-oriented<br />
stocks held up modestly better than growth stocks, as measured by the Russell style indices.<br />
Portfolio Results<br />
The Mid Cap Growth Stock Portfolio returned –40.08% for the twelve months ended December 31, 2008. By comparison, the<br />
Russell MidCap Growth Index returned –44.32%. (The Index is unmanaged, cannot be invested in directly, and does not<br />
include administrative expenses or sales charges.) The Portfolio’s Mid-Cap Growth Funds peer group had an average return of<br />
–45.24%, according to Lipper Analytical Services, Inc., an independent mutual fund ranking agency.<br />
The Portfolio’s absolute return reflected the unprecedented turmoil affecting the economy and financial markets in what was<br />
the worst year for stocks since the Great Depression. In that environment, no sector contributed positively to results. The<br />
biggest negative contribution came from Information Technology stocks. However, despite the difficult investing climate, the<br />
Portfolio held up better than the Index, benefiting from effective stock selection across a number of sectors, led by Industrials,<br />
Consumer Discretionary, and Health Care. At the other end of the spectrum, selection and allocation decisions made<br />
Consumer Staples shares the leading detractors from relative results.<br />
Stock selection in the Industrial sector drove the Portfolio’s relative results, led by positioning in the road and rail, air freight<br />
and logistics, industrial conglomerate and commercial services industry segments. Key contributors Knight Transportation and<br />
J.B. Hunt Transport Services benefited from falling energy prices, which helped offset a slowdown in business resulting from<br />
the recession. Freight shipping logistics coordinator C.H. Robinson Worldwide benefited from rising demand for its services<br />
across a number of business units.<br />
The Consumer Discretionary sector was home to the top two individual contributors to relative performance, Dollar Tree and<br />
DeVry. Discount retailer Dollar Tree saw more cost-conscious shoppers come through its doors. Adult and vocational<br />
education firm DeVry saw enrollment rise as the difficult job market put a premium on worker education and training. Health<br />
care providers Psychiatric Solutions and DaVita were other leading contributors for the year, enjoying steady demand for their<br />
treatment services.<br />
An underweight position and stock selection made Consumer Staples shares the largest detractors from relative results. The<br />
key detractor was cosmetics firm Bare Escentuals, which reported disappointing profit growth and guided analysts’<br />
expectations down for future quarters. It also hurt to be underrepresented in food products, tobacco, and household products<br />
companies, which held up better than the Index as a whole.<br />
In terms of individual stocks, several of the leading detractors were shares of companies hit hard by the sharp downturn in the<br />
economy. Topping the list were online marketing and digital ad firms Focus Media Holdings and ValueClick. Similarly,<br />
payment processor VeriFone Holdings and chipmakers Intersil and NVIDIA were victims of the economic turmoil.<br />
36 Mid Cap Growth Stock Portfolio
Mid Cap Growth Stock Portfolio<br />
Outlook<br />
Going forward, we will continue to look for companies that we believe are well managed, have solid growth in revenue and<br />
earnings, and have strong financial characteristics. As a result of this process, our sector and industry allocations reflect where<br />
we are finding what we consider to be the best growth opportunities at a given time. As of December 31, 2008, some of our<br />
largest stakes were in Information Technology and Health Care shares. The most notable sector underweights were in<br />
Consumer Staples, Telecommunication Services, and Utilities stocks.<br />
Relative Performance<br />
$20,000<br />
15,000<br />
10,000<br />
5,000<br />
0<br />
12/98 12/00 12/02 12/04 12/06 12/08<br />
Top 10 Equity Holdings 12/31/08<br />
Security Description<br />
% of Net Assets<br />
Immucor, Inc. 3.1%<br />
Psychiatric Solutions, Inc. 3.0%<br />
DeVry, Inc. 2.9%<br />
C.H. Robinson Worldwide, Inc. 2.7%<br />
DaVita, Inc. 2.6%<br />
Dollar Tree, Inc. 2.6%<br />
McAfee, Inc. 2.4%<br />
Alliance Data Systems Corp. 2.4%<br />
Corrections Corp. of America 2.4%<br />
Stericycle, Inc. 2.3%<br />
Mid Cap Growth Stock Portfolio<br />
Russell MidCap Growth Index<br />
Average <strong>Annual</strong> Total Returns<br />
For Periods Ended December 31, 2008<br />
1 Year 5 Years 10 Years<br />
Mid Cap Growth Stock Portfolio<br />
Russell MidCap Growth Index<br />
-40.08% -1.75%<br />
-44.32% -2.33%<br />
0.97%<br />
-0.19%<br />
Lipper Variable Insurance Products<br />
(VIP) Mid Cap Growth Funds<br />
Average -45.24% -2.33% 0.76%<br />
The performance data quoted represents past<br />
performance. Past performance is historical and does<br />
not guarantee future performance. Investment return<br />
and principal value will fluctuate, so that shares, when<br />
redeemed, may be worth more or less than their original<br />
cost. Current performance may be lower or higher than<br />
the performance data quoted. For the most recent<br />
month-end performance information visit<br />
www.nmfn.com.<br />
This chart assumes an initial investment of $10,000<br />
made on 12/31/98. Returns shown include deductions<br />
for management and other portfolio expenses, and<br />
reinvestment of all dividends. Returns exclude<br />
deductions for separte account sale loads and account<br />
fees. Please refer to the Benchmark Definitions section<br />
of this report for information about the indices cited in<br />
the above chart and graph.<br />
Investing in small and medium-sized companies<br />
involves a greater degree of risk than investing in large<br />
company stocks.<br />
Materials<br />
4%<br />
Short-Term Investments<br />
& Other Net Assets<br />
7%<br />
Energy<br />
7%<br />
Financials<br />
8%<br />
Consumer Discretionary<br />
14%<br />
Sector Allocation 12/31/08<br />
Utilities<br />
2%<br />
Other Holdings<br />
1%<br />
Information<br />
Technology<br />
23%<br />
Industrials<br />
18%<br />
Health Care<br />
16%<br />
Sector Allocation is based on Net Assets.<br />
Sector Allocation and Top 10 Holdings are subject to<br />
change.<br />
Mid Cap Growth Stock Portfolio 37
Mid Cap Growth Stock Portfolio<br />
<strong>Northwestern</strong> <strong>Mutual</strong> Series Fund, Inc.<br />
Schedule of Investments<br />
December 31, 2008<br />
Common Stocks (93.6%)<br />
Shares/<br />
$ Par<br />
Consumer Discretionary (14.1%)<br />
Value<br />
$ (000's)<br />
* Collective Brands, Inc. 1,115,200 13,070<br />
DeVry, Inc. 350,500 20,122<br />
* Dollar Tree, Inc. 426,600 17,832<br />
* Focus Media Holding,<br />
Ltd., ADR 406,100 3,691<br />
* GameStop Corp. -<br />
Class A 731,800 15,851<br />
* Jack in the Box, Inc. 542,400 11,982<br />
* O'Reilly Automotive, Inc. 305,560 9,393<br />
* Urban Outfitters, Inc. 419,500 6,284<br />
Total 98,225<br />
Energy (7.0%)<br />
* Cameron International<br />
Corp. 548,400 11,242<br />
Diamond Offshore<br />
Drilling, Inc. 41,000 2,417<br />
* National-Oilwell Varco,<br />
Inc. 222,300 5,433<br />
Range Resources Corp. 329,800 11,342<br />
* SandRidge Energy, Inc. 282,500 1,737<br />
Smith International, Inc. 216,500 4,956<br />
* Southwestern Energy Co. 385,500 11,168<br />
Total 48,295<br />
Financials (8.6%)<br />
Assured Guaranty, Ltd. 362,200 4,129<br />
* IntercontinentalExchange,<br />
Inc. 58,983 4,863<br />
* Investment Technology<br />
Group, Inc. 367,040 8,339<br />
* MBIA, Inc. 581,700 2,368<br />
Northern Trust Corp. 256,888 13,394<br />
Raymond James<br />
Financial, Inc. 574,400 9,839<br />
SEI Investments Co. 356,600 5,602<br />
Synovus Financial Corp. 695,700 5,774<br />
T. Rowe Price Group,<br />
Inc. 13,000 461<br />
W.R. Berkley Corp. 169,900 5,267<br />
Total 60,036<br />
Health Care (16.1%)<br />
* Celgene Corp. 262,600 14,517<br />
* Cerner Corp. 274,300 10,547<br />
* Charles River<br />
Laboratories<br />
International, Inc. 255,700 6,699<br />
* DaVita, Inc. 361,000 17,895<br />
* Express Scripts, Inc. 272,700 14,993<br />
* Immucor, Inc. 798,949 21,236<br />
* Intuitive Surgical, Inc. 39,200 4,978<br />
* Psychiatric Solutions, Inc. 757,881 21,107<br />
Total 111,972<br />
Common Stocks (93.6%)<br />
Industrials (18.4%)<br />
Shares/<br />
$ Par<br />
Value<br />
$ (000's)<br />
C.H. Robinson<br />
Worldwide, Inc. 337,700 18,584<br />
* Corrections Corp. of<br />
America 1,000,000 16,360<br />
Cummins, Inc. 82,700 2,211<br />
Expeditors International<br />
of Washington, Inc. 314,660 10,469<br />
* Foster Wheeler, Ltd. 163,100 3,813<br />
* FTI Consulting, Inc. 30,400 1,358<br />
Harsco Corp. 357,100 9,884<br />
J.B. Hunt Transport<br />
Services, Inc. 459,000 12,058<br />
Knight Transportation,<br />
Inc. 613,400 9,888<br />
L-3 Communications<br />
Holdings, Inc. 98,600 7,275<br />
MSC Industrial Direct<br />
Co., Inc. - Class A 136,900 5,042<br />
Ritchie Bros.<br />
Auctioneers, Inc. 420,100 8,998<br />
* Spirit AeroSystems<br />
Holdings, Inc. - Class A 607,100 6,174<br />
* Stericycle, Inc. 308,000 16,041<br />
Total 128,155<br />
Information Technology (22.9%)<br />
* Activision Blizzard, Inc. 485,820 4,197<br />
* Alliance Data Systems<br />
Corp. 353,200 16,434<br />
Amphenol Corp. -<br />
Class A 449,800 10,786<br />
* Citrix Systems, Inc. 295,400 6,963<br />
* Cognizant Technology<br />
Solutions Corp. -<br />
Class A 431,200 7,787<br />
FactSet Research<br />
Systems, Inc. 264,600 11,706<br />
Global Payments, Inc. 485,900 15,933<br />
Intersil Corp. - Class A 916,500 8,423<br />
KLA-Tencor Corp. 396,780 8,646<br />
* McAfee, Inc. 478,200 16,531<br />
* Mettler-Toledo<br />
International, Inc. 201,800 13,601<br />
Microchip Technology,<br />
Inc. 581,895 11,364<br />
* NeuStar, Inc. - Class A 514,300 9,839<br />
* Varian Semiconductor<br />
Equipment Associates,<br />
Inc. 527,200 9,553<br />
* VeriFone Holdings, Inc. 590,800 2,895<br />
Western Union Co. 296,500 4,252<br />
Total 158,910<br />
Materials (4.1%)<br />
* Owens-Illinois, Inc. 420,600 11,495<br />
Common Stocks (93.6%)<br />
Shares/<br />
$ Par<br />
Value<br />
$ (000's)<br />
Materials continued<br />
Praxair, Inc. 201,940 11,987<br />
Titanium Metals Corp. 568,500 5,009<br />
Total 28,491<br />
Other Holdings (0.6%)<br />
SPDR Metals & Mining 159,600 4,435<br />
Total 4,435<br />
Utilities (1.8%)<br />
Equitable Resources, Inc. 371,900 12,477<br />
Total 12,477<br />
Total Common Stocks<br />
(Cost: $903,677) 650,996<br />
Short-Term Investments (7.9%)<br />
Aircraft (1.4%)<br />
(b)Textron, Inc.,<br />
6.25%, 1/6/09 10,000,000 9,991<br />
Total 9,991<br />
Federal Government & Agencies (0.3%)<br />
Federal National<br />
Mortgage Association,<br />
0.20%, 3/30/09 2,000,000 2,000<br />
Total 2,000<br />
Finance Services (3.6%)<br />
Alpine Securitization<br />
Corp., 1.35%, 1/9/09 5,000,000 4,999<br />
Atlantic Asset<br />
Securitization LLC,<br />
0.30%, 1/15/09 10,000,000 9,999<br />
Gemini Securitization<br />
Corp. LLC,<br />
0.50%, 1/21/09 10,000,000 9,997<br />
Total 24,995<br />
Food Processors (1.5%)<br />
Kellogg Co.,<br />
1.70%, 1/13/09 10,100,000 10,094<br />
Total 10,094<br />
Oil and Gas (1.1%)<br />
Devon Energy Corp.,<br />
0.95%, 1/2/09 7,800,000 7,800<br />
Total 7,800<br />
Total Short-Term Investments<br />
(Cost: $54,879) 54,880<br />
Total Investments (101.5%)<br />
(Cost: $958,556)(a) 705,876<br />
Other Assets, Less<br />
Liabilities (-1.5%) (10,250)<br />
Net Assets (100.0%) 695,626<br />
The Accompanying Notes are an Integral Part of the Financial Statements.<br />
38 Mid Cap Growth Stock Portfolio
Mid Cap Growth Stock Portfolio<br />
* Non-Income Producing<br />
ADR after the name of a security represents—American Depositary Receipt.<br />
(a)<br />
(b)<br />
At December 31, 2008 the aggregate cost of securities for federal tax purposes (in thousands) was $964,249 and the net unrealized depreciation of<br />
investments based on that cost was $258,373 which is comprised of $27,519 aggregate gross unrealized appreciation and $285,892 aggregate gross<br />
unrealized depreciation.<br />
All or a portion of the securities have been committed as collateral for open futures positions or when-issued securities. Information regarding open futures<br />
contracts as of period end is summarized below.<br />
Unrealized<br />
Appreciation/<br />
Number of<br />
(Depreciation)<br />
Issuer (000's)<br />
Contracts Expiration Date (000's)<br />
Midcap 400 Index Futures (Long) (Total Notional Value at December 31, 2008, $13,098) 50 3/09 $ 332<br />
The Accompanying Notes are an Integral Part of the Financial Statements.<br />
Mid Cap Growth Stock Portfolio 39
Index 400 Stock Portfolio<br />
Objective: Portfolio Strategy: Net Assets:<br />
Investment results that approximate the<br />
performance of the S&P MidCap 400 ®<br />
Index.<br />
Invest in stocks included in the S&P MidCap 400 ® Index<br />
in approximately the same proportion as each stock’s<br />
weighting in the Index.<br />
$320 million<br />
Portfolio Overview<br />
Mason Street Advisors acts as the investment adviser for the Index 400 Stock Portfolio. The Portfolio seeks investment results<br />
that approximate the performance of the S&P MidCap 400 ® Index by investing in stocks included in the S&P MidCap 400 ®<br />
Index, which is composed of 400 common stocks. The S&P MidCap 400 ® Index does not include the very large issues that<br />
account for most of the weighting in the S&P 500 ® Index. The Index 400 Stock Portfolio is not managed in the traditional<br />
sense using economic, financial and market analysis. The Portfolio’s strategy is to capture mid-cap market performance by<br />
investing in a portfolio modeled after a mid-cap stock index. The Portfolio invests in stocks included in the S&P MidCap 400 ®<br />
Index in proportion to their weightings in the Index, and may buy or sell securities after announced changes in the Index but<br />
before or after the effective date of the changes to attempt to achieve higher correlation with the Index. The Portfolio remains<br />
neutral relative to the benchmark in terms of economic sectors, market capitalization and growth and value styles of investing.<br />
The Portfolio will, to the extent feasible, remain fully invested, and cash flows are invested promptly to attempt to minimize<br />
their impact on returns. The Portfolio may purchase Index futures contracts in an attempt to achieve full replication.<br />
Market Overview<br />
Financial markets endured a brutal 2008, which saw the failure of a number of leading financial institutions, credit markets<br />
freeze up, and the U.S. government take a series of extraordinary steps to support the economy and financial system. Returns<br />
were negative across all market capitalization ranges, sectors, and investment styles. For all of 2008, returns for large-,<br />
medium- and small-sized companies were –37.00%, –36.23% and –31.07%, as measured by the S&P 500 ® , MidCap 400 ® and<br />
SmallCap 600 ® Stock Indices, respectively.<br />
Mirroring the difficulty in the market, even the best-performing sectors in the S&P MidCap 400 ® Index—the traditionally<br />
defensive Utilities and Consumer Staples segments—fell more than 23% and 25%, respectively. Companies in these sectors<br />
were favored because they tend to have relatively healthy balance sheets, generate free cash flow, and/or have earnings<br />
resistant to economic downturns.<br />
Two of the poorest performers were Energy (–57%) and Materials (–46%) shares. These former high-flying sectors suffered as<br />
commodity prices collapsed along with the outlook for global growth in the second half of the year. The traditionally growthoriented<br />
Information Technology (–41%) and Health Care (–33%) sectors also performed poorly. It was a similar story for the<br />
economically sensitive Consumer Discretionary and Industrial sectors, which declined 40% and 37%, respectively.<br />
Interestingly, Financials in the mid-cap space finished the year with returns better than the Index as a whole (down 30%). In<br />
part that was because many of these stocks entered the year at depressed prices after underperforming badly in 2007. They<br />
were also helped by aggressive Federal Reserve policies, the TARP program and industry consolidation.<br />
Portfolio Results<br />
The Portfolio had a sharply negative return in the worst year for equities since the Great Depression. For the twelve months<br />
ended December 31, 2008, the Index 400 Stock Portfolio had a return of –36.28%, while the S&P MidCap 400 ® Index<br />
returned –36.23%. (This Index is unmanaged, cannot be invested in directly and does not include administrative expenses or<br />
sales charges.) Portfolio performance slightly lagged the S&P MidCap 400 ® Index due to transaction costs, administrative<br />
expenses, cash flow effects and costs associated with the use of stock index futures contracts. The average return for the<br />
Portfolio’s peer group, Mid-Cap Core Funds, was –38.25% for the same period, according to Lipper Analytical Services, Inc.,<br />
an independent mutual fund ranking agency. However, the Mid-Cap Core Funds peer group is not strictly comparable to the<br />
Index 400 Stock Portfolio because many of the portfolios in the group are actively managed.<br />
Outlook<br />
After the unprecedented events of 2008, we have a somewhat hopeful outlook for 2009—we are hoping for the reemergence of<br />
a more rational, less volatile market environment where fundamentals and diversification matter once again. Unfortunately, the<br />
economic fundamentals remain challenging, though we think it is reasonable to expect some sort of recovery based on the<br />
massive government stimulus likely to come early in the new year. Diversification, too, is likely to matter again, as we see<br />
40 Index 400 Stock Portfolio
Index 400 Stock Portfolio<br />
greater differentiation in returns across and within asset classes. We continue to believe in the potential benefit of investing in<br />
a fund based on a broad market index, such as the Index 400 Stock Portfolio, which provides exposure to both growth and<br />
value styles of investing, as well stocks of companies across the economy.<br />
$25,000<br />
20,000<br />
Relative Performance<br />
Investing in small and medium-sized companies<br />
involves a greater degree of risk than investing in large<br />
company stocks.<br />
15,000<br />
10,000<br />
5,000<br />
0<br />
4/9912/99 12/01 12/03 12/05 12/0712/08<br />
Index 400 Stock Portfolio<br />
S&P MidCap 400 Index<br />
Average <strong>Annual</strong> Total Returns<br />
For Periods Ended December 31, 2008<br />
1 Year 5 Years<br />
Since<br />
Inception*<br />
Index 400 Stock Portfolio<br />
S&P MidCap 400 Index<br />
-36.28% -0.23%<br />
-36.23% -0.08%<br />
4.27%<br />
4.51%<br />
Lipper Variable Insurance Products<br />
(VIP) Mid Cap Core Funds Average -38.25% -1.21% –<br />
*Inception date of 4/30/99<br />
The performance data quoted represents past<br />
performance. Past performance is historical and does<br />
not guarantee future performance. Investment return<br />
and principal value will fluctuate, so that shares, when<br />
redeemed, may be worth more or less than their original<br />
cost. Current performance may be lower or higher than<br />
the performance data quoted. For the most recent<br />
month-end performance information visit<br />
www.nmfn.com.<br />
This chart assumes an initial investment of $10,000<br />
made on 4/30/99 (commencement of the Portfolio's<br />
operations). Returns shown reflect fee waivers,<br />
deductions for management and other portfolio<br />
expenses, and reinvestment of all dividends. In the<br />
absence of fee waivers, total return would be reduced.<br />
Returns exclude deductions for separte account sale<br />
loads and account fees. Please refer to the Benchmark<br />
Definitions section of this report for information about<br />
the indices cited in the above chart and graph.<br />
Top 10 Equity Holdings 12/31/08<br />
Security Description<br />
% of Net Assets<br />
Everest Re Group, Ltd. 0.6%<br />
Vertex Pharmaceuticals, Inc. 0.6%<br />
Health Care REIT, Inc. 0.6%<br />
W.R. Berkley Corp. 0.6%<br />
O'Reilly Automotive, Inc. 0.6%<br />
New York Community Bancorp, Inc. 0.6%<br />
Martin Marietta Materials, Inc. 0.5%<br />
MDU Resources Group, Inc. 0.5%<br />
SAIC, Inc. 0.5%<br />
Church & Dwight Co., Inc. 0.5%<br />
Energy<br />
6%<br />
Materials<br />
7%<br />
Utilities<br />
8%<br />
Health Care<br />
11%<br />
Information Technology<br />
13%<br />
Sector Allocation 12/31/08<br />
Consumer Staples<br />
5%<br />
Telecommunication Services<br />
1%<br />
Financials<br />
21%<br />
Industrials<br />
14%<br />
Consumer<br />
Discretionary<br />
14%<br />
Sector Allocation is based on equities.<br />
Sector Allocation and Top 10 Holdings are subject to<br />
change.<br />
“Standard & Poor’s ® ”, “S&P ® ”, “S&P MidCap 400 Index”<br />
and “Standard & Poor’s MidCap 400 Index” are<br />
trademarks of The McGraw-Hill Companies, Inc. and<br />
have been licensed for use by The <strong>Northwestern</strong> <strong>Mutual</strong><br />
Life Insurance Company. The Portfolio is not sponsored,<br />
endorsed, sold or promoted by Standard & Poor’s, and<br />
Standard & Poor’s makes no representation regarding<br />
the advisability of investing in the Portfolio.<br />
Index 400 Stock Portfolio 41
Index 400 Stock Portfolio<br />
<strong>Northwestern</strong> <strong>Mutual</strong> Series Fund, Inc.<br />
Schedule of Investments<br />
December 31, 2008<br />
Common Stocks (89.3%)<br />
Shares/<br />
$ Par<br />
Consumer Discretionary (12.5%)<br />
Value<br />
$ (000's)<br />
* 99 Cents Only Stores 20,233 221<br />
Advance Auto Parts, Inc. 40,800 1,373<br />
* Aeropostale, Inc. 28,750 463<br />
American Eagle<br />
Outfitters, Inc. 88,750 831<br />
American Greetings<br />
Corp. - Class A 19,600 148<br />
* AnnTaylor Stores Corp. 24,650 142<br />
ArvinMeritor, Inc. 31,750 90<br />
Barnes & Noble, Inc. 15,900 238<br />
Belo Corp. - Class A 37,900 59<br />
Blyth, Inc. 10,400 81<br />
Bob Evans Farms, Inc. 13,200 270<br />
BorgWarner, Inc. 49,900 1,086<br />
Boyd Gaming Corp. 24,600 116<br />
Brinker International,<br />
Inc. 43,875 462<br />
* Brinks's Home Security<br />
Holdings, Inc. 17,500 384<br />
Callaway Golf Co. 27,800 258<br />
* Career Education Corp. 31,700 569<br />
* CarMax, Inc. 94,900 748<br />
* The Cheesecake Factory,<br />
Inc. 25,750 260<br />
* Chico's FAS, Inc. 76,400 319<br />
* Chipotle Mexican Grill,<br />
Inc. - Class A 14,200 880<br />
* Coldwater Creek, Inc. 20,400 58<br />
* Collective Brands, Inc. 27,442 322<br />
* Corinthian Colleges, Inc. 36,900 604<br />
DeVry, Inc. 26,500 1,521<br />
* Dick's Sporting Goods,<br />
Inc. 36,600 516<br />
* Dollar Tree, Inc. 39,000 1,630<br />
* DreamWorks Animation<br />
SKG, Inc. 33,200 839<br />
Foot Locker, Inc. 66,700 490<br />
Furniture Brands<br />
International, Inc. 17,900 40<br />
Gentex Corp. 60,200 532<br />
Guess?, Inc. 25,900 398<br />
* Hanesbrands, Inc. 40,300 514<br />
Harte-Hanks, Inc. 16,350 102<br />
* Hovnanian Enterprises,<br />
Inc. - Class A 21,800 37<br />
International Speedway<br />
Corp. - Class A 12,000 345<br />
* ITT Educational<br />
Services, Inc. 13,500 1,282<br />
* J. Crew Group, Inc. 22,300 272<br />
John Wiley & Sons, Inc.<br />
- Class A 18,400 655<br />
* Lamar Advertising Co. -<br />
Class A 32,700 411<br />
Common Stocks (89.3%)<br />
Shares/<br />
$ Par<br />
Value<br />
$ (000's)<br />
Consumer Discretionary continued<br />
* Life Time Fitness, Inc. 15,100 196<br />
* LKQ Corp. 60,200 702<br />
M.D.C. Holdings, Inc. 15,800 479<br />
* Marvel Entertainment,<br />
Inc. 21,100 649<br />
Matthews International<br />
Corp. - Class A 13,200 484<br />
Modine Manufacturing<br />
Co. 14,100 69<br />
* Mohawk Industries, Inc. 24,200 1,040<br />
* NetFlix, Inc. 17,900 535<br />
* NVR, Inc. 2,300 1,049<br />
* O'Reilly Automotive,<br />
Inc. 57,900 1,780<br />
* Pacific Sunwear of<br />
California, Inc. 28,300 45<br />
PetSmart, Inc. 54,800 1,011<br />
Phillips-Van Heusen<br />
Corp. 22,200 447<br />
* Priceline.com, Inc. 17,500 1,289<br />
Regis Corp. 18,600 270<br />
* Rent-A-Center, Inc. 28,800 508<br />
Ross Stores, Inc. 55,700 1,656<br />
The Ryland Group, Inc. 18,400 325<br />
* Saks, Inc. 61,200 268<br />
Scholastic Corp. 11,400 155<br />
* Scientific Games Corp.-<br />
Class A 28,000 491<br />
Service Corp.<br />
International 110,100 547<br />
Sotheby's 29,000 258<br />
Strayer Education, Inc. 6,100 1,308<br />
Thor Industries, Inc. 15,300 202<br />
* The Timberland Co. -<br />
Class A 19,800 229<br />
* Toll Brothers, Inc. 56,100 1,202<br />
Tupperware Brands<br />
Corp. 26,700 606<br />
* Under Armour, Inc. 15,700 374<br />
* Urban Outfitters, Inc. 49,100 735<br />
* The Warnaco Group,<br />
Inc. 20,100 395<br />
Wendy's/Arby's Group,<br />
Inc. 180,100 890<br />
Williams-Sonoma, Inc. 37,300 293<br />
Total 40,053<br />
Consumer Staples (4.1%)<br />
Alberto-Culver Co. 36,700 899<br />
* BJ's Wholesale Club,<br />
Inc. 25,300 867<br />
Church & Dwight Co.,<br />
Inc. 30,150 1,692<br />
Corn Products<br />
International, Inc. 32,101 926<br />
Common Stocks (89.3%)<br />
Shares/<br />
$ Par<br />
Value<br />
$ (000's)<br />
Consumer Staples continued<br />
* Energizer Holdings, Inc. 25,100 1,359<br />
Flowers Foods, Inc. 34,000 828<br />
* Hansen Natural Corp. 31,900 1,070<br />
Hormel Foods Corp. 30,200 939<br />
Lancaster Colony Corp. 8,500 292<br />
* NBTY, Inc. 23,600 369<br />
PepsiAmericas, Inc. 24,700 503<br />
* Ralcorp Holdings, Inc. 24,300 1,419<br />
Ruddick Corp. 16,900 467<br />
* Smithfield Foods, Inc. 51,200 720<br />
Tootsie Roll Industries,<br />
Inc. 11,157 286<br />
Universal Corp. 10,800 323<br />
Total 12,959<br />
Energy (5.7%)<br />
Arch Coal, Inc. 61,500 1,002<br />
* Bill Barrett Corp. 15,900 336<br />
Cimarex Energy Co. 35,900 961<br />
* Comstock Resources,<br />
Inc. 19,800 936<br />
* Denbury Resources, Inc. 106,400 1,162<br />
* Encore Acquisition Co. 22,700 579<br />
* Exterran Holdings, Inc. 27,902 594<br />
* FMC Technologies, Inc. 53,838 1,283<br />
* Forest Oil Corp. 41,800 689<br />
Frontier Oil Corp. 44,800 566<br />
* Helix Energy Solutions<br />
Group, Inc. 39,600 287<br />
Helmerich & Payne, Inc. 45,300 1,031<br />
* Mariner Energy, Inc. 38,300 391<br />
* Newfield Exploration<br />
Co. 57,000 1,126<br />
* Oceaneering<br />
International, Inc. 23,500 685<br />
Overseas Shipholding<br />
Group, Inc. 10,900 459<br />
* Patriot Coal Corp. 27,300 171<br />
Patterson-UTI Energy,<br />
Inc. 66,600 767<br />
* Plains Exploration &<br />
Production Co. 46,366 1,077<br />
* Pride International, Inc. 74,500 1,190<br />
* Quicksilver Resources,<br />
Inc. 48,200 268<br />
Southern Union Co. 53,400 696<br />
* Superior Energy<br />
Services, Inc. 33,400 532<br />
Tidewater, Inc. 22,200 894<br />
* Unit Corp. 20,400 545<br />
Total 18,227<br />
Financials (18.8%)<br />
* Affiliated Managers<br />
Group, Inc. 17,700 742<br />
The Accompanying Notes are an Integral Part of the Financial Statements.<br />
42 Index 400 Stock Portfolio
Index 400 Stock Portfolio<br />
Common Stocks (89.3%)<br />
Shares/<br />
$ Par<br />
Value<br />
$ (000's)<br />
Financials continued<br />
Alexandria Real Estate<br />
Equities, Inc. 13,900 839<br />
AMB Property Corp. 42,400 993<br />
American Financial<br />
Group, Inc. 32,350 740<br />
* AmeriCredit Corp. 50,100 383<br />
Apollo Investment Corp. 61,251 570<br />
Arthur J. Gallagher &<br />
Co. 40,900 1,060<br />
Associated Banc-Corp. 54,963 1,150<br />
Astoria Financial Corp. 34,700 572<br />
BancorpSouth, Inc. 31,100 726<br />
Bank of Hawaii Corp. 20,600 931<br />
BRE Properties, Inc. 22,000 616<br />
Brown & Brown, Inc. 50,000 1,045<br />
Camden Property Trust 22,900 718<br />
Cathay General Bancorp 21,300 506<br />
City National Corp. 17,400 847<br />
The Colonial<br />
BancGroup, Inc. 87,200 181<br />
Commerce Bancshares,<br />
Inc. 28,440 1,250<br />
Cousins Properties, Inc. 18,800 260<br />
Cullen/Frost Bankers,<br />
Inc. 25,600 1,297<br />
Duke Realty Corp. 63,500 696<br />
Eaton Vance Corp. 50,000 1,051<br />
Equity One, Inc. 14,200 251<br />
Essex Property Trust,<br />
Inc. 11,500 883<br />
Everest Re Group, Ltd. 26,500 2,018<br />
Federal Realty<br />
Investment Trust 25,400 1,577<br />
Fidelity National<br />
Financial, Inc. - Class A 91,191 1,619<br />
First American Corp. 40,000 1,156<br />
First Niagara Financial<br />
Group, Inc. 51,100 826<br />
FirstMerit Corp. 34,900 719<br />
Fulton Financial Corp. 75,400 725<br />
The Hanover Insurance<br />
Group, Inc. 22,000 945<br />
HCC Insurance<br />
Holdings, Inc. 49,450 1,323<br />
Health Care REIT, Inc. 44,600 1,882<br />
Highwoods Properties,<br />
Inc. 27,400 750<br />
Horace Mann Educators<br />
Corp. 16,800 154<br />
Hospitality Properties<br />
Trust 40,500 602<br />
Jefferies Group, Inc. 52,100 733<br />
Jones Lang LaSalle, Inc. 14,900 413<br />
Liberty Property Trust 42,300 966<br />
The Macerich Co. 32,800 596<br />
Mack-Cali Realty Corp. 28,400 696<br />
Mercury General Corp. 15,300 704<br />
Nationwide Health<br />
Properties, Inc. 42,800 1,229<br />
Common Stocks (89.3%)<br />
Shares/<br />
$ Par<br />
Value<br />
$ (000's)<br />
Financials continued<br />
New York Community<br />
Bancorp, Inc. 148,221 1,773<br />
Old Republic<br />
International Corp. 99,375 1,185<br />
OMEGA Healthcare<br />
Investors, Inc. 34,800 556<br />
PacWest Bancorp 10,500 282<br />
The PMI Group, Inc. 29,900 58<br />
Potlatch Corp. 17,047 443<br />
Protective Life Corp. 30,100 432<br />
Raymond James<br />
Financial, Inc. 41,525 711<br />
Rayonier, Inc. 33,966 1,065<br />
Realty Income Corp. 44,900 1,039<br />
Regency Centers Corp. 30,200 1,410<br />
Reinsurance Group of<br />
America, Inc. 31,300 1,340<br />
SEI Investments Co. 57,500 903<br />
SL Green Realty Corp. 24,600 637<br />
StanCorp Financial<br />
Group, Inc. 21,100 881<br />
* SVB Financial Group 14,100 370<br />
Synovus Financial Corp. 120,900 1,003<br />
TCF Financial Corp. 49,600 678<br />
UDR, Inc. 58,700 809<br />
Unitrin, Inc. 21,200 338<br />
Valley National Bancorp 51,800 1,049<br />
W.R. Berkley Corp. 59,750 1,852<br />
Waddell & Reed<br />
Financial, Inc. - Class A 36,500 564<br />
Washington Federal, Inc. 37,865 566<br />
Webster Financial Corp. 22,700 313<br />
Weingarten Realty<br />
Investors 33,400 691<br />
Westamerica<br />
Bancorporation 12,400 634<br />
Wilmington Trust Corp. 29,300 652<br />
Total 60,174<br />
Health Care (10.1%)<br />
* Advanced Medical<br />
Optics, Inc. 22,412 148<br />
* Affymetrix, Inc. 30,200 90<br />
Beckman Coulter, Inc. 27,000 1,186<br />
* Bio-Rad Laboratories,<br />
Inc. - Class A 8,200 618<br />
* Cerner Corp. 29,300 1,127<br />
* Charles River<br />
Laboratories<br />
International, Inc. 29,200 765<br />
* Community Health<br />
Systems, Inc. 40,200 586<br />
* Covance, Inc. 27,300 1,257<br />
* Edwards Lifesciences<br />
Corp. 24,000 1,319<br />
* Endo Pharmaceuticals<br />
Holdings, Inc. 50,400 1,304<br />
* Gen-Probe, Inc. 23,400 1,002<br />
Common Stocks (89.3%)<br />
Shares/<br />
$ Par<br />
Value<br />
$ (000's)<br />
Health Care continued<br />
* Health Management<br />
Associates, Inc. -<br />
Class A 105,100 188<br />
* Health Net, Inc. 44,700 487<br />
* Henry Schein, Inc. 38,500 1,413<br />
Hill-Rom Holdings, Inc. 26,900 443<br />
* Hologic, Inc. 110,400 1,443<br />
* IDEXX Laboratories,<br />
Inc. 25,700 927<br />
* Kindred Healthcare, Inc. 12,900 168<br />
* Kinetic Concepts, Inc. 24,100 462<br />
* LifePoint Hospitals, Inc. 23,000 525<br />
* Lincare Holdings, Inc. 32,000 862<br />
* Masimo Corp. 20,600 614<br />
Medicis Pharmaceutical<br />
Corp. - Class A 24,400 339<br />
Omnicare, Inc. 44,900 1,246<br />
Perrigo Co. 33,400 1,079<br />
Pharmaceutical Product<br />
Development, Inc. 50,800 1,474<br />
* Psychiatric Solutions,<br />
Inc. 24,100 671<br />
* ResMed, Inc. 32,600 1,222<br />
* Sepracor, Inc. 46,900 515<br />
STERIS Corp. 25,400 607<br />
Techne Corp. 16,400 1,058<br />
Teleflex, Inc. 17,100 857<br />
* Thoratec Corp. 24,200 786<br />
* United Therapeutics<br />
Corp. 10,000 626<br />
Universal Health<br />
Services, Inc. - Class B 21,800 819<br />
* Valeant Pharmaceuticals<br />
International 35,100 804<br />
* Varian, Inc. 12,500 419<br />
* VCA Antech, Inc. 36,500 726<br />
* Vertex Pharmaceuticals,<br />
Inc. 64,800 1,969<br />
* WellCare Health Plans,<br />
Inc. 18,000 231<br />
Total 32,382<br />
Industrials (12.9%)<br />
* AGCO Corp. 39,500 932<br />
* AirTran Holdings, Inc. 50,500 224<br />
* Alaska Air Group, Inc. 15,600 456<br />
Alexander & Baldwin,<br />
Inc. 17,800 446<br />
* Alliant Techsystems,<br />
Inc. 14,100 1,209<br />
AMETEK, Inc. 45,950 1,388<br />
* BE Aerospace, Inc. 42,800 329<br />
The Brink's Co. 17,500 470<br />
Bucyrus International,<br />
Inc. 32,200 596<br />
Carlisle Companies, Inc. 26,300 544<br />
* Clean Harbors, Inc. 8,700 552<br />
Con-way, Inc. 19,700 524<br />
* Copart, Inc. 27,300 742<br />
The Accompanying Notes are an Integral Part of the Financial Statements.<br />
Index 400 Stock Portfolio 43
Index 400 Stock Portfolio<br />
Common Stocks (89.3%)<br />
Shares/<br />
$ Par<br />
Value<br />
$ (000's)<br />
Industrials continued<br />
The Corporate Executive<br />
Board Co. 14,700 324<br />
* Corrections Corp. of<br />
America 54,100 885<br />
Crane Co. 20,900 360<br />
Deluxe Corp. 22,000 329<br />
Donaldson Co., Inc. 33,100 1,114<br />
* Dycom Industries, Inc. 17,000 140<br />
Federal Signal Corp. 20,400 168<br />
* FTI Consulting, Inc. 21,900 979<br />
GATX Corp. 21,000 650<br />
Graco, Inc. 25,600 608<br />
Granite Construction,<br />
Inc. 14,200 624<br />
Harsco Corp. 36,000 996<br />
Herman Miller, Inc. 23,100 301<br />
HNI Corp. 19,100 303<br />
Hubbell, Inc. - Class B 24,200 791<br />
IDEX Corp. 35,580 859<br />
J.B. Hunt Transport<br />
Services, Inc. 35,300 927<br />
* JetBlue Airways Corp. 78,925 560<br />
Joy Global, Inc. 46,450 1,063<br />
* Kansas City Southern 39,300 749<br />
KBR, Inc. 69,600 1,058<br />
Kelly Services, Inc. -<br />
Class A 11,800 154<br />
Kennametal, Inc. 31,500 699<br />
* Korn/Ferry International 19,300 220<br />
Lincoln Electric<br />
Holdings, Inc. 18,400 937<br />
Manpower, Inc. 33,600 1,142<br />
Mine Safety Appliances<br />
Co. 12,800 306<br />
* MPS Group, Inc. 39,800 300<br />
MSC Industrial Direct<br />
Co., Inc. - Class A 19,300 711<br />
* Navigant Consulting,<br />
Inc. 20,200 321<br />
Nordson Corp. 14,700 475<br />
Oshkosh Corp. 32,100 285<br />
Pentair, Inc. 42,500 1,006<br />
* Quanta Services, Inc. 85,000 1,683<br />
Rollins, Inc. 17,787 322<br />
Roper Industries, Inc. 38,600 1,676<br />
* The Shaw Group, Inc. 36,000 737<br />
SPX Corp. 23,400 949<br />
* Terex Corp. 40,900 708<br />
* Thomas & Betts Corp. 24,100 579<br />
The Timken Co. 36,600 718<br />
Trinity Industries, Inc. 34,250 540<br />
* United Rentals, Inc. 25,823 236<br />
* URS Corp. 36,000 1,468<br />
Wabtec Corp. 20,900 831<br />
* Waste Connections, Inc. 34,300 1,083<br />
Werner Enterprises, Inc. 18,350 318<br />
Woodward Governor Co. 23,500 541<br />
* YRC Worldwide, Inc. 25,500 73<br />
Total 41,218<br />
Common Stocks (89.3%)<br />
Shares/<br />
$ Par<br />
Information Technology (11.2%)<br />
Value<br />
$ (000's)<br />
* 3Com Corp. 175,000 399<br />
* ACI Worldwide, Inc. 15,000 238<br />
Acxiom Corp. 29,302 238<br />
* ADC<br />
Telecommunications,<br />
Inc. 50,700 277<br />
ADTRAN, Inc. 23,600 351<br />
* Advent Software, Inc. 7,200 144<br />
* Alliance Data Systems<br />
Corp. 27,800 1,294<br />
* ANSYS, Inc. 38,600 1,077<br />
* Arrow Electronics, Inc. 51,400 968<br />
* Atmel Corp. 193,000 604<br />
* Avnet, Inc. 64,900 1,182<br />
* Avocent Corp. 19,300 346<br />
Broadridge Financial<br />
Solutions, Inc. 60,900 764<br />
* Cadence Design<br />
Systems, Inc. 112,100 410<br />
* CommScope, Inc. 30,277 470<br />
* Cree, Inc. 38,000 603<br />
Diebold, Inc. 28,500 801<br />
* Digital River, Inc. 16,000 397<br />
* DST Systems, Inc. 17,500 665<br />
* F5 Networks, Inc. 34,300 784<br />
FactSet Research<br />
Systems, Inc. 18,200 805<br />
Fair Isaac Corp. 20,900 352<br />
* Fairchild Semiconductor<br />
International, Inc. 53,500 262<br />
* Gartner, Inc. 25,500 455<br />
Global Payments, Inc. 34,500 1,131<br />
Imation Corp. 13,000 176<br />
* Ingram Micro, Inc. -<br />
Class A 71,000 951<br />
* Integrated Device<br />
Technology, Inc. 72,830 409<br />
* International Rectifier<br />
Corp. 31,400 424<br />
Intersil Corp. - Class A 52,900 486<br />
Jack Henry &<br />
Associates, Inc. 36,400 706<br />
* Lam Research Corp. 53,800 1,145<br />
Lender Processing<br />
Services, Inc. 36,100 1,063<br />
* Macrovision Solutions<br />
Corp. 35,900 454<br />
* ManTech International<br />
Corp. - Class A 9,000 488<br />
* Mentor Graphics Corp. 39,800 206<br />
* Metavante Technologies,<br />
Inc. 38,700 623<br />
* Mettler-Toledo<br />
International, Inc. 14,400 971<br />
National Instruments<br />
Corp. 24,550 598<br />
* NCR Corp. 68,000 961<br />
* NeuStar, Inc. - Class A 34,000 650<br />
* Palm, Inc. 47,300 145<br />
Common Stocks (89.3%)<br />
Shares/<br />
$ Par<br />
Value<br />
$ (000's)<br />
Information Technology continued<br />
* Parametric Technology<br />
Corp. 50,000 632<br />
Plantronics, Inc. 21,000 277<br />
* Polycom, Inc. 35,800 484<br />
* RF Micro Devices, Inc. 113,300 88<br />
* SAIC, Inc. 87,300 1,701<br />
* Semtech Corp. 26,000 293<br />
* Silicon Laboratories, Inc. 19,900 493<br />
* SRA International, Inc. -<br />
Class A 18,100 312<br />
* Sybase, Inc. 34,923 865<br />
* Synopsys, Inc. 62,100 1,150<br />
* Tech Data Corp. 21,500 384<br />
* Trimble Navigation, Ltd. 51,500 1,113<br />
* ValueClick, Inc. 37,400 256<br />
* Vishay Intertechnology,<br />
Inc. 80,387 275<br />
* Western Digital Corp. 95,400 1,092<br />
* Wind River Systems,<br />
Inc. 29,200 264<br />
* Zebra Technologies<br />
Corp. - Class A 27,300 553<br />
Total 35,705<br />
Materials (6.1%)<br />
Airgas, Inc. 34,900 1,361<br />
Albemarle Corp. 39,300 876<br />
AptarGroup, Inc. 29,100 1,026<br />
Ashland, Inc. 28,500 300<br />
Cabot Corp. 28,200 432<br />
Carpenter Technology<br />
Corp. 19,000 390<br />
Chemtura Corp. 104,463 146<br />
Cliffs Natural Resources,<br />
Inc. 48,900 1,252<br />
Commercial Metals Co. 49,000 582<br />
Cytec Industries, Inc. 20,300 431<br />
Ferro Corp. 18,800 133<br />
FMC Corp. 31,900 1,427<br />
Grief, Inc. - Class A 14,700 491<br />
Louisiana-Pacific Corp. 39,200 61<br />
The Lubrizol Corp. 29,000 1,055<br />
Martin Marietta<br />
Materials, Inc. 17,800 1,728<br />
Minerals Technologies,<br />
Inc. 8,100 331<br />
Olin Corp. 33,100 598<br />
Packaging Corp. of<br />
America 44,100 594<br />
Reliance Steel &<br />
Aluminum Co. 27,500 548<br />
RPM International, Inc. 55,400 736<br />
The Scotts Miracle-Gro<br />
Co. - Class A 18,900 562<br />
Sensient Technologies<br />
Corp. 20,800 497<br />
Sonoco Products Co. 43,000 996<br />
Steel Dynamics, Inc. 69,700 779<br />
Temple-Inland, Inc. 45,900 220<br />
Terra Industries, Inc. 44,000 734<br />
The Accompanying Notes are an Integral Part of the Financial Statements.<br />
44 Index 400 Stock Portfolio
Index 400 Stock Portfolio<br />
Common Stocks (89.3%)<br />
Shares/<br />
$ Par<br />
Value<br />
$ (000's)<br />
Materials continued<br />
The Valspar Corp. 43,000 778<br />
Worthington Industries,<br />
Inc. 25,800 284<br />
Total 19,348<br />
Telecommunication Services (0.5%)<br />
* Cincinnati Bell, Inc. 99,200 192<br />
Telephone and Data<br />
Systems, Inc. 45,900 1,457<br />
Total 1,649<br />
Utilities (7.4%)<br />
AGL Resources, Inc. 33,100 1,038<br />
Alliant Energy Corp. 47,600 1,389<br />
Aqua America, Inc. 58,233 1,199<br />
Black Hills Corp. 16,600 448<br />
DPL, Inc. 49,900 1,140<br />
Energen Corp. 30,900 906<br />
Great Plains Energy, Inc. 51,177 989<br />
Hawaiian Electric<br />
Industries, Inc. 38,800 859<br />
IDACORP, Inc. 19,600 577<br />
MDU Resources Group,<br />
Inc. 79,100 1,707<br />
National Fuel Gas Co. 34,100 1,068<br />
Northeast Utilities 67,100 1,614<br />
NSTAR 46,000 1,679<br />
NV Energy, Inc. 100,881 998<br />
OGE Energy Corp. 40,000 1,031<br />
ONEOK, Inc. 45,000 1,310<br />
PNM Resources, Inc. 37,250 375<br />
Puget Energy, Inc. 55,900 1,524<br />
UGI Corp. 46,500 1,136<br />
Vectren Corp. 34,900 873<br />
Westar Energy, Inc. 46,600 956<br />
WGL Holdings, Inc. 21,500 703<br />
Total 23,519<br />
Total Common Stocks<br />
(Cost: $397,066) 285,234<br />
Short-Term<br />
Investments (9.7%)<br />
Electric Utilities (1.8%)<br />
Shares/<br />
$ Par<br />
Value<br />
$ (000's)<br />
(b) Duke Energy Corp.,<br />
4.00%, 1/5/09 5,800,000 5,797<br />
Total 5,797<br />
Federal Government & Agencies (1.4%)<br />
Federal Home Loan<br />
Bank, 0.47%, 3/13/09 4,500,000 4,499<br />
Total 4,499<br />
Finance Services (3.1%)<br />
Falcon Asset<br />
Securitization Co. LLC,<br />
0.45%, 1/13/09 10,000,000 9,999<br />
Total 9,999<br />
Oil and Gas (3.4%)<br />
Devon Energy Corp.,<br />
1.15%, 1/2/09 8,000,000 8,000<br />
Sempra Global,<br />
1.00%, 1/2/09 2,900,000 2,900<br />
Total 10,900<br />
Total Short-Term Investments<br />
(Cost: $31,191) 31,195<br />
Total Investments (99.0%)<br />
(Cost: $428,257)(a) 316,429<br />
Other Assets, Less<br />
Liabilities (1.0%) 3,086<br />
Net Assets (100.0%) 319,515<br />
* Non-Income Producing<br />
(a)<br />
(b)<br />
At December 31, 2008 the aggregate cost of securities for federal tax purposes (in thousands) was $429,737 and the net unrealized depreciation of<br />
investments based on that cost was $113,308 which is comprised of $20,035 aggregate gross unrealized appreciation and $133,343 aggregate gross<br />
unrealized depreciation.<br />
All or a portion of the securities have been committed as collateral for open futures positions or when-issued securities. Information regarding open futures<br />
contracts as of period end is summarized below.<br />
Unrealized<br />
Appreciation/<br />
Number of<br />
(Depreciation)<br />
Issuer (000's)<br />
Contracts Expiration Date (000's)<br />
Midcap 400 Index Futures (Long) (Total Notional Value at December 31, 2008, $30,852) 118 3/09 $ 842<br />
The Accompanying Notes are an Integral Part of the Financial Statements.<br />
Index 400 Stock Portfolio 45
Mid Cap Value Portfolio<br />
Objective: Portfolio Strategy: Net Assets:<br />
Long-term capital growth. Current<br />
income is a secondary objective.<br />
Invest primarily in equity securities of mid-sized companies<br />
that are believed to be undervalued in relation to their<br />
prospects for growth.<br />
$75 million<br />
Portfolio Overview<br />
Mason Street Advisors, the investment adviser for the Mid Cap Value Portfolio, has engaged AllianceBernstein L.P. to act as<br />
sub-adviser for the Portfolio. The primary investment objective of the Portfolio is long-term capital growth; current income is<br />
a secondary objective. The Portfolio invests primarily in a diversified portfolio of equities of mid-sized companies with market<br />
capitalization between $1.0 billion and $10.0 billion with an emphasis on securities with market capitalizations between $1.0<br />
and $5.0 billion. The Portfolio’s investment policies emphasize investment in companies that we determine to be undervalued<br />
using our fundamental value approach. In selecting investments, we use our fundamental research to identify companies whose<br />
long-term earnings power is not reflected in the current market price of their securities.<br />
Market Overview<br />
Equity markets around the world collapsed in 2008 as investor anxiety over global economic growth intensified. U.S. smallercap<br />
markets were no exception with the Russell 2000 and Russell 2500 Stock Indices down 33.8% and 36.8%, respectively,<br />
roughly in line with the decline of the S&P 500 ® Index, which returned –37.0%. Much of the carnage occurred in the fourth<br />
quarter where smaller-cap indices lagged the S&P 500 by about four percentage points. Within the Russell 2500, all sectors<br />
fell, with Utilities’ 20.7% decline for the year being the best return, while Consumer Cyclicals and Energy sector returns were<br />
the worst, not surprisingly given their high economic exposure. Value, as measured by the Russell 2500 Value Index,<br />
outperformed the broad small/mid-cap market, declining 32.0% for the year.<br />
Portfolio Results<br />
The Mid Cap Value Portfolio returned –35.07% for the twelve months ended December 31, 2008. By comparison, the Russell<br />
2500 Value and Russell MidCap Value Indices returned –31.99% and –38.44%, respectively. (These Indices are unmanaged,<br />
cannot be invested in directly and do not include administrative expenses or sales charges.) The average return of the Mid-Cap<br />
Value Funds peer group was –38.71%, according to Lipper Analytical Services, Inc., an independent mutual fund ranking<br />
agency.<br />
The Portfolio’s absolute return reflected the unprecedented turmoil affecting the economy and financial markets in what was<br />
the worst year for stocks since the Great Depression. The Portfolio underperformed the Russell 2500 Value Index for the year,<br />
but outperformed the Russell Midcap Value Index. Versus the Russell 2500 Value Index, the bulk of the underperformance<br />
was attributable to stock selection where the Portfolio’s holdings in more economically sensitive sectors, such as Capital<br />
Equipment and Information Technology, were pressured by investors concerned over declining global growth. This was offset<br />
somewhat by strong relative stock selection in Financials, driven by some of the Portfolio’s bank and insurance holdings. The<br />
Portfolio also benefited from holdings among transport names where its trucking and airline holdings benefited from capacity<br />
management and lower fuel costs.<br />
Sector selection was a modest detractor, driven by the Portfolio’s underweight in Utilities, which were prized by investors<br />
seeking stocks with defensive characteristics. It also hurt to be overweight in Energy, where stocks were pressured by falling<br />
oil prices. An overweight position in transports offset this somewhat.<br />
Key contributors included Cliffs Natural Resources, Platinum Underwriters, Arch Capital Group, Arkansas Best and<br />
Amerigroup. Specific stocks that underperformed included Reliant Energy, Brunswick, Rockwood Holdings, Avis Budget and<br />
TRW Automotive.<br />
Outlook<br />
In our opinion, investor anxiety over depressed global economic growth and continued financial contagion has deepened the<br />
value opportunity in smaller-cap markets. We are seeking to capture a diverse array of compelling opportunities—including<br />
many in cyclical industries—while attempting to guard against the risk of a prolonged economic downturn. We have increased<br />
both the quality and relative market cap within the Portfolio as a result of opportunities created by market conditions late in the<br />
year, while keeping valuations at a level we find very attractive.<br />
The opportunity also is remarkably diverse, spanning many industries and sectors. But since companies and sectors sensitive<br />
to the economic cycle performed worse over the last year, many have become very attractively valued. In the quarter, we<br />
increased exposure to Energy, while reducing exposure to Financials. In our analysis, investors have overreacted to the very<br />
real threats posed by the financial crisis and recession; many cyclicals today are valued as if their earnings will never recover.<br />
But historically, recessions end, credit markets ease and companies address their problems. We are adding what we consider to<br />
be quality companies with strong business models trading at attractive valuations, providing what we feel is attractive longterm<br />
potential.<br />
46 Mid Cap Value Portfolio
Mid Cap Value Portfolio<br />
Sub-Adviser Change<br />
Effective February 23, 2009, American Century Investment Management, Inc. will replace AllianceBernstein L.P. as the subadviser<br />
for the Mid Cap Value Portfolio.<br />
Relative Performance<br />
The Portfolio's investment strategy emphasizes<br />
investments in smaller mid-sized companies, which may<br />
cause its average market capitalization to be lower<br />
than, may cause it to perform differently from, and will<br />
subject it to greater small cap company risk than, other<br />
mid cap funds without this emphasis. Investing in small<br />
and medium-sized companies involves a greater degree<br />
of risk than investing in large company stocks.<br />
Average <strong>Annual</strong> Total Returns<br />
For Periods Ended December 31, 2008<br />
1 Year 5 Years<br />
Since<br />
Inception*<br />
Mid Cap Value Portfolio -35.07% -1.47% 3.82%<br />
Russell 2500 Value Index -31.99% -0.15% 5.94%<br />
Russell MidCap Value Index -38.44% 0.33% 5.60%<br />
Lipper Variable Insurance Products<br />
(VIP) Mid Cap Value Funds<br />
Average -38.71% -1.49% –<br />
*Inception date of 5/1/03<br />
The performance data quoted represents past<br />
performance. Past performance is historical and does<br />
not guarantee future performance. Investment return<br />
and principal value will fluctuate, so that shares, when<br />
redeemed, may be worth more or less than their original<br />
cost. Current performance may be lower or higher than<br />
the performance data quoted. For the most recent<br />
month-end performance information visit<br />
www.nmfn.com.<br />
This chart assumes an initial investment of $10,000<br />
made on 5/1/03 (commencement of the Portfolio's<br />
operations). Returns shown reflect fee waivers,<br />
deductions for management and other portfolio<br />
expenses, and reinvestment of all dividends. In the<br />
absence of fee waivers, total return would be reduced.<br />
Returns exclude deductions for separte account sale<br />
loads and account fees. Please refer to the Benchmark<br />
Definitions section of this report for information about<br />
the indices cited in the above chart and graph.<br />
Top 10 Equity Holdings 12/31/08<br />
Security Description<br />
% of Net Assets<br />
Platinum Underwriters Holdings, Ltd. 2.0%<br />
Aspen Insurance Holdings, Ltd. 2.0%<br />
Ruddick Corp. 1.8%<br />
AMERIGROUP Corp. 1.7%<br />
Northeast Utilities 1.6%<br />
Arch Capital Group, Ltd. 1.6%<br />
Terex Corp. 1.5%<br />
Del Monte Foods Co. 1.5%<br />
Mueller Industries, Inc. 1.5%<br />
Fidelity National Financial, Inc. - Class A 1.5%<br />
Health Care<br />
5%<br />
Utilities<br />
6%<br />
Consumer<br />
Discretionary<br />
8%<br />
Materials<br />
9%<br />
Consumer Staples<br />
9%<br />
Sector Allocation 12/31/08<br />
Energy<br />
5%<br />
Short-Term Investments<br />
& Other Net Assets<br />
5%<br />
Sector Allocation is based on Net Assets.<br />
Sector Allocation and Top 10 Holdings are subject to<br />
change.<br />
Financials<br />
24%<br />
Industrials<br />
17%<br />
Information<br />
Technology<br />
12%<br />
Mid Cap Value Portfolio 47
Mid Cap Value Portfolio<br />
<strong>Northwestern</strong> <strong>Mutual</strong> Series Fund, Inc.<br />
Schedule of Investments<br />
December 31, 2008<br />
Common Stocks (95.7%)<br />
Consumer Discretionary (8.2%)<br />
Shares/<br />
$ Par<br />
Value<br />
$ (000's)<br />
ArvinMeritor, Inc. 98,100 280<br />
Autoliv, Inc. 10,300 221<br />
* AutoNation, Inc. 30,900 305<br />
Boyd Gaming Corp. 72,900 345<br />
Callaway Golf Co. 76,900 714<br />
Foot Locker, Inc. 89,900 660<br />
Gannett Co., Inc. 30,100 241<br />
J.C. Penney Co., Inc. 37,900 747<br />
Jones Apparel Group, Inc. 35,000 205<br />
Limited Brands, Inc. 36,400 366<br />
The Men's Wearhouse, Inc. 54,900 743<br />
* Mohawk Industries, Inc. 10,200 438<br />
Thor Industries, Inc. 54,400 717<br />
* TRW Automotive Holdings<br />
Corp. 29,700 107<br />
Total 6,089<br />
Consumer Staples (9.4%)<br />
Bunge, Ltd. 13,700 709<br />
Del Monte Foods Co. 159,400 1,138<br />
The Pepsi Bottling Group,<br />
Inc. 33,900 763<br />
Ruddick Corp. 48,000 1,327<br />
* Smithfield Foods, Inc. 67,700 953<br />
SUPERVALU, INC. 45,050 658<br />
Tyson Foods, Inc. - Class A 68,800 603<br />
Universal Corp. 29,200 872<br />
Total 7,023<br />
Energy (5.1%)<br />
Cimarex Energy Co. 32,500 871<br />
* Denbury Resources, Inc. 36,900 403<br />
Frontier Oil Corp. 65,400 826<br />
Helmerich & Payne, Inc. 23,700 539<br />
* Oil States International,<br />
Inc. 25,700 480<br />
* Whiting Petroleum Corp. 21,400 716<br />
Total 3,835<br />
Financials (23.5%)<br />
Alexandria Real Estate<br />
Equities, Inc. 7,600 459<br />
* Arch Capital Group, Ltd. 16,800 1,178<br />
Aspen Insurance Holdings,<br />
Ltd. 61,300 1,487<br />
Astoria Financial Corp. 18,300 302<br />
Central Pacific Financial<br />
Corp. 5,800 58<br />
Digital Realty Trust, Inc. 27,200 894<br />
Fidelity National Financial,<br />
Inc. - Class A 62,000 1,100<br />
First Niagara Financial<br />
Group, Inc. 27,100 438<br />
Home Properties, Inc. 19,000 771<br />
Common Stocks (95.7%)<br />
Shares/ Value<br />
$ Par $ (000's)<br />
Financials continued<br />
Mid-America Apartment<br />
Communities, Inc. 12,100 450<br />
Old Republic International<br />
Corp. 72,300 862<br />
PartnerRe, Ltd. 7,700 549<br />
Platinum Underwriters<br />
Holdings, Ltd. 41,500 1,497<br />
Popular, Inc. 50,200 259<br />
Provident Financial<br />
Services, Inc. 21,000 321<br />
Reinsurance Group of<br />
America, Inc. 9,400 402<br />
RenaissanceRe Holdings,<br />
Ltd. 10,100 521<br />
The South Financial Group,<br />
Inc. 85,600 370<br />
StanCorp Financial Group,<br />
Inc. 23,300 973<br />
Sunstone Hotel Investors,<br />
Inc. 40,800 253<br />
Susquehanna Bancshares,<br />
Inc. 26,550 422<br />
Synovus Financial Corp. 36,300 301<br />
Tanger Factory Outlet<br />
Centers, Inc. 18,900 711<br />
Taubman Centers, Inc. 11,500 293<br />
Trustmark Corp. 35,300 762<br />
Washington Federal, Inc. 58,800 880<br />
Webster Financial Corp. 38,200 526<br />
Whitney Holding Corp. 31,400 502<br />
Total 17,541<br />
Health Care (5.3%)<br />
* AMERIGROUP Corp. 42,700 1,260<br />
* LifePoint Hospitals, Inc. 31,200 712<br />
* Molina Healthcare, Inc. 37,071 653<br />
Omnicare, Inc. 23,800 661<br />
Universal Health Services,<br />
Inc. - Class B 18,200 684<br />
Total 3,970<br />
Industrials (16.5%)<br />
Acuity Brands, Inc. 18,500 646<br />
* Alaska Air Group, Inc. 29,700 869<br />
Arkansas Best Corp. 22,800 687<br />
Briggs & Stratton Corp. 49,600 872<br />
* Continental Airlines, Inc. -<br />
Class B 29,900 540<br />
Con-way, Inc. 18,700 497<br />
Cooper Industries, Ltd. -<br />
Class A 13,400 392<br />
* EnerSys 52,200 574<br />
* Gardner Denver, Inc. 17,700 413<br />
GATX Corp. 29,600 917<br />
Goodrich Corp. 9,300 344<br />
Common Stocks (95.7%)<br />
Shares/ Value<br />
$ Par $ (000's)<br />
Industrials continued<br />
* Hertz Global Holdings, Inc. 69,400 352<br />
Kelly Services, Inc. -<br />
Class A 64,600 840<br />
Mueller Industries, Inc. 44,400 1,114<br />
Quanex Building Products<br />
Corp. 25,900 243<br />
Regal-Beloit Corp. 4,775 181<br />
SkyWest, Inc. 30,000 558<br />
* Terex Corp. 66,100 1,145<br />
* United Stationers, Inc. 25,900 867<br />
Werner Enterprises, Inc. 15,800 274<br />
Total 12,325<br />
Information Technology (12.3%)<br />
* Amkor Technology, Inc. 71,700 156<br />
* Anixter International, Inc. 16,600 500<br />
* Arrow Electronics, Inc. 40,200 757<br />
AU Optronics Corp., ADR 120,000 922<br />
* Avnet, Inc. 19,400 353<br />
* Benchmark Electronics,<br />
Inc. 40,400 516<br />
* CommScope, Inc. 19,800 308<br />
* Convergys Corp. 65,700 421<br />
* Ingram Micro, Inc. -<br />
Class A 63,900 856<br />
* Insight Enterprises, Inc. 63,900 441<br />
* Lexmark International, Inc.<br />
- Class A 19,500 524<br />
* SanDisk Corp. 44,100 423<br />
Siliconware Precision<br />
Industries Co., ADR 198,000 883<br />
* Tech Data Corp. 24,600 439<br />
* Teradyne, Inc. 131,700 556<br />
* Vishay Intertechnology,<br />
Inc. 66,400 227<br />
* Western Digital Corp. 46,700 535<br />
* Zoran Corp. 52,400 358<br />
Total 9,175<br />
Materials (9.2%)<br />
AptarGroup, Inc. 21,200 747<br />
Arch Chemicals, Inc. 28,100 733<br />
Ashland, Inc. 12,500 131<br />
Celanese Corp. 31,000 385<br />
Chemtura Corp. 166,200 233<br />
Commercial Metals Co. 68,900 818<br />
Cytec Industries, Inc. 28,700 609<br />
Methanex Corp. 28,800 324<br />
* Owens-Illinois, Inc. 24,400 667<br />
Reliance Steel &<br />
Aluminum Co. 28,000 558<br />
* Rockwood Holdings, Inc. 54,200 585<br />
Sonoco Products Co. 20,300 470<br />
Steel Dynamics, Inc. 25,200 282<br />
The Accompanying Notes are an Integral Part of the Financial Statements.<br />
48 Mid Cap Value Portfolio
Mid Cap Value Portfolio<br />
Common Stocks (95.7%)<br />
Shares/ Value<br />
$ Par $ (000's)<br />
Materials continued<br />
Westlake Chemical Corp. 19,300 314<br />
Total 6,856<br />
Utilities (6.2%)<br />
Allegheny Energy, Inc. 10,100 342<br />
Atmos Energy Corp. 43,000 1,019<br />
Northeast Utilities 50,400 1,213<br />
Portland General Electric<br />
Co. 16,800 327<br />
Puget Energy, Inc. 17,600 480<br />
* Reliant Energy, Inc. 70,900 410<br />
Wisconsin Energy Corp. 19,200 806<br />
Total 4,597<br />
Total Common Stocks<br />
(Cost: $104,936) 71,411<br />
Short-Term Investments (3.6%)<br />
Oil and Gas (1.6%)<br />
Devon Energy Corp.,<br />
1.25%, 1/2/09 1,220,000 1,220<br />
Total 1,220<br />
Retail Food and Drug (2.0%)<br />
CVS Corp., 5.55%, 1/8/09 1,500,000 1,498<br />
Total 1,498<br />
Total Short-Term Investments<br />
(Cost: $2,718) 2,718<br />
Total Investments (99.3%)<br />
(Cost: $107,654)(a) 74,129<br />
Other Assets, Less<br />
Liabilities (0.7%) 552<br />
Net Assets (100.0%) 74,681<br />
* Non-Income Producing<br />
ADR after the name of a security represents—American Depositary Receipt.<br />
(a)<br />
At December 31, 2008 the aggregate cost of securities for federal tax purposes (in thousands) was $107,697 and the net unrealized depreciation of<br />
investments based on that cost was $33,568 which is comprised of $2,176 aggregate gross unrealized appreciation and $35,744 aggregate gross unrealized<br />
depreciation.<br />
The Accompanying Notes are an Integral Part of the Financial Statements.<br />
Mid Cap Value Portfolio 49
Small Cap Growth Stock Portfolio<br />
Objective: Portfolio Strategy: Net Assets:<br />
Long-term growth of capital.<br />
Seek capital appreciation by investing in small companies $285 million<br />
with potential for above-average growth.<br />
Portfolio Overview<br />
Mason Street Advisors acts as the investment adviser for the Small Cap Growth Stock Portfolio. The Portfolio seeks long-term<br />
growth of capital. The Portfolio invests in growth companies in the small-capitalization range, as measured by the Portfolio’s<br />
benchmark. The Portfolio’s focus in stock selection is on companies with above-average growth potential supported by<br />
financial strength and capable management. In evaluating individual companies, factors such as the growth rates of revenues<br />
and earnings, opportunities for margin expansion, financial strength, and quality of management are important variables.<br />
Market Overview<br />
Financial markets endured a brutal 2008, which saw the failure of a number of leading financial institutions, credit markets<br />
freeze up, and the U.S. government take a series of extraordinary steps to support the economy and financial system. The crisis<br />
was a result of the ongoing sub-prime mortgage meltdown, which spread rapidly through the domestic financial sector and into<br />
virtually every segment of global financial markets.<br />
For all of 2008, returns for large-, medium- and small-sized companies were –37.60%, –41.46% and –33.79%, as measured by<br />
the Russell 1000, Russell MidCap and Russell 2000 Stock Indices, respectively. Small-cap stocks held up best after lagging<br />
stocks of large- and mid-sized companies in 2007. That relative outperformance also reflected the fact that the Financial sector<br />
wreckage was concentrated in large-cap names. No sector of the market had positive returns for the year, and value-oriented<br />
stocks held up modestly better than growth stocks, as measured by the Russell style indices.<br />
Portfolio Results<br />
For the twelve months ended December 31, 2008, the Small Cap Growth Stock Portfolio returned –43.87%. By comparison,<br />
the Russell 2000 Growth Index returned –38.54%. (The Index is unmanaged, cannot be invested in directly, and does not<br />
include administrative expenses or sales charges.) The Portfolio’s Small-Cap Growth Funds peer group had an average return<br />
of –41.12%, according to Lipper Analytical Services, Inc., an independent mutual fund ranking agency.<br />
The Portfolio’s absolute return reflected the unprecedented turmoil affecting the economy and financial markets in what was<br />
the worst year for stocks since the Great Depression. In that environment, no sector contributed positively to results. The<br />
biggest negative contribution to both absolute performance and relative to the Russell Index came from Information<br />
Technology stocks. Stock selection made the Industrials and Materials sectors the leading contributors to relative results.<br />
Positioning in Information Technology shares was the main source of weakness, largely as a result of stock selection in the<br />
semiconductor, internet software & services and communications equipment industry segments. A general theme uniting these<br />
detractors was their exposure to the communications market, which slowed along with the economy. For example, mobile<br />
phone and digital media equipment maker Cogo Group also faced concern about top-line growth and a changing product mix<br />
geared toward lower-margin business. Other notable detractors from performance were semiconductor firms Tessera<br />
Technologies and Diodes. Tessera Technologies suffered in 2008 from adverse litigation results, while global economic<br />
weakness weighed heavily on Diodes’ earnings.<br />
Holdings in the Health Care, Financials, and Energy sectors also detracted from relative performance. In Health Care, it hurt to<br />
be underweight the biotechnology segment. In Financials and Energy, poor performance was driven by selection and<br />
allocation decisions among capital market and energy equipment and services stocks, respectively.<br />
At the other end of the spectrum, Industrial shares contributed most to relative results, led by positioning among aerospace and<br />
defense and road and rail firms. The top two contributors to performance were military contractors Axsys Technologies and<br />
AeroVironment, whose business boomed as a result of increased defense spending. Other key contributors from these two<br />
industry segments were Knight Transportation, Stanley and TransDigm Group.<br />
The Portfolio also benefited from stock selection in the Materials sector, led by positioning in the containers and packaging<br />
and chemicals industries. Packaging firm Silgan Holdings was by far the largest single contributor in the sector, reporting<br />
record business despite the challenging economic environment.<br />
Outlook<br />
Looking ahead to 2009, we will continue our focus on well-managed, attractively valued, fast-growing, small-cap companies.<br />
Because we build the Small Cap Growth Stock Portfolio from the bottom up, one stock at a time, our sector and industry<br />
allocations reflect where we’re finding the best growth opportunities at a given time. As of December 31, 2008, the largest<br />
sector overweight was in Industrials. The most notable sector underweight was in Health Care.<br />
50 Small Cap Growth Stock Portfolio
Small Cap Growth Stock Portfolio<br />
Relative Performance<br />
$35,000<br />
30,000<br />
25,000<br />
20,000<br />
15,000<br />
10,000<br />
5,000<br />
0<br />
4/9912/99 12/01 12/03 12/05 12/0712/08<br />
Small Cap Growth Stock Portfolio<br />
Russell 2000 Growth Index<br />
Top 10 Equity Holdings 12/31/08<br />
Security Description<br />
% of Net Assets<br />
Team, Inc. 2.3%<br />
Masimo Corp. 2.2%<br />
Dollar Tree, Inc. 2.1%<br />
ITC Holdings Corp. 2.0%<br />
New Oriental Education & Technology Group,<br />
Inc., ADR 2.0%<br />
Knight Transportation, Inc. 1.9%<br />
Psychiatric Solutions, Inc. 1.7%<br />
Illumina, Inc. 1.7%<br />
Genoptix, Inc. 1.6%<br />
Cornell Cos., Inc. 1.6%<br />
Sector Allocation 12/31/08<br />
Average <strong>Annual</strong> Total Returns<br />
For Periods Ended December 31, 2008<br />
1 Year 5 Years<br />
Since<br />
Inception*<br />
Small Cap Growth Stock Portfolio<br />
Russell 2000 Growth Index<br />
-43.87% -2.83%<br />
-38.54% -2.35%<br />
6.25%<br />
-1.48%<br />
Lipper Variable Insurance Products<br />
(VIP) Small Cap Growth Funds<br />
Average -41.12% -2.95% –<br />
*Inception date of 4/30/99<br />
Materials<br />
3%<br />
Consumer Staples<br />
3%<br />
Financials<br />
6%<br />
Energy<br />
6%<br />
Other Holdings<br />
3%<br />
Utilities<br />
2%<br />
Telecommunication Services<br />
1%<br />
Information<br />
Technology<br />
20%<br />
The performance data quoted represents past<br />
performance. Past performance is historical and does<br />
not guarantee future performance. Investment return<br />
and principal value will fluctuate, so that shares, when<br />
redeemed, may be worth more or less than their original<br />
cost. Current performance may be lower or higher than<br />
the performance data quoted. For the most recent<br />
month-end performance information visit<br />
www.nmfn.com.<br />
This chart assumes an initial investment of $10,000<br />
made on 4/30/99 (commencement of the Portfolio's<br />
operations). Returns shown reflect fee waivers,<br />
deductions for management and other portfolio<br />
expenses, and reinvestment of all dividends. In the<br />
absence of fee waivers, total return would be reduced.<br />
Returns exclude deductions for separte account sale<br />
loads and account fees. Please refer to the Benchmark<br />
Definitions section of this report for information about<br />
the indices cited in the above chart and graph.<br />
Short-Term<br />
Investments &<br />
Other Net Assets<br />
8%<br />
Consumer Discretionary<br />
13%<br />
Sector Allocation is based on Net Assets.<br />
Sector Allocation and Top 10 Holdings are subject to<br />
change.<br />
Industrials<br />
19%<br />
Health Care<br />
16%<br />
Stocks of smaller or newer companies, such as those<br />
held in this Portfolio, are more likely to realize more<br />
substantial growth as well as suffer more significant<br />
losses than larger or more established issuers.<br />
Investments in such companies can be both more<br />
volatile and more speculative. Investing in small<br />
company stocks involves a greater degree of risk than<br />
investing in medium or large company stocks.<br />
Small Cap Growth Stock Portfolio 51
Small Cap Growth Stock Portfolio<br />
<strong>Northwestern</strong> <strong>Mutual</strong> Series Fund, Inc.<br />
Schedule of Investments<br />
December 31, 2008<br />
Common Stocks (91.6%)<br />
Shares/<br />
$ Par<br />
Consumer Discretionary (13.3%)<br />
Value<br />
$ (000's)<br />
* Aeropostale, Inc. 2,250 36<br />
* American Public<br />
Education, Inc. 106,600 3,964<br />
Arbitron, Inc. 3,075 41<br />
* Buffalo Wild Wings, Inc. 88,800 2,278<br />
* The Cheesecake Factory,<br />
Inc. 3,850 39<br />
Cracker Barrel Old<br />
Country Store, Inc. 1,750 36<br />
* Dollar Tree, Inc. 143,650 6,005<br />
* Exide Technologies 7,700 41<br />
* Fossil, Inc. 2,475 41<br />
* J. Crew Group, Inc. 3,050 37<br />
* Jack in the Box, Inc. 184,350 4,072<br />
* Jos. A. Bank Clothiers,<br />
Inc. 1,450 38<br />
* Life Time Fitness, Inc. 3,125 40<br />
* LKQ Corp. 342,150 3,989<br />
* Lumber Liquidators, Inc. 210,500 2,223<br />
The Men's Wearhouse,<br />
Inc. 2,550 35<br />
* New Oriental Education<br />
& Technology Group,<br />
Inc., ADR 104,590 5,743<br />
* O'Reilly Automotive,<br />
Inc. 77,800 2,392<br />
PetSmart, Inc. 127,300 2,349<br />
Polaris Industries, Inc. 1,425 41<br />
* Retail Ventures, Inc. 11,925 41<br />
Sinclair Broadcast<br />
Group, Inc. - Class A 12,250 38<br />
* Skechers U.S.A., Inc. -<br />
Class A 3,125 40<br />
Snap-on, Inc. 34,000 1,339<br />
Sotheby's 4,350 39<br />
Tempur-Pedic<br />
International, Inc. 6,500 46<br />
* True Religion Apparel,<br />
Inc. 120,350 1,497<br />
Tupperware Brands<br />
Corp. 1,775 40<br />
* The Warnaco Group,<br />
Inc. 1,825 36<br />
* Zumiez, Inc. 189,600 1,412<br />
Total 37,968<br />
Consumer Staples (3.4%)<br />
* AgFeed Industries, Inc. 16,825 27<br />
Alberto-Culver Co. 130,000 3,186<br />
* Central European<br />
Distribution Corp. 64,905 1,279<br />
* Darling International,<br />
Inc. 7,175 40<br />
Flowers Foods, Inc. 141,300 3,442<br />
Common Stocks (91.6%)<br />
Shares/<br />
$ Par<br />
Value<br />
$ (000's)<br />
Consumer Staples continued<br />
* TreeHouse Foods, Inc. 60,100 1,637<br />
Total 9,611<br />
Energy (5.9%)<br />
* Arena Resources, Inc. 119,400 3,354<br />
* ATP Oil & Gas Corp. 5,500 32<br />
Berry Petroleum Co. 4,875 37<br />
* Bill Barrett Corp. 1,875 40<br />
* Carrizo Oil & Gas, Inc. 95,025 1,530<br />
* Contango Oil & Gas Co. 40,300 2,269<br />
Crosstex Energy, Inc. 14,525 57<br />
* Dril-Quip, Inc. 2,100 43<br />
Energy XXI, Ltd. 53,300 42<br />
* EXCO Resources, Inc. 177,700 1,610<br />
* Gasco Energy, Inc. 53,400 21<br />
General Maritime Corp. 3,400 37<br />
* IHS, Inc. - Class A 48,633 1,820<br />
* ION Geophysical Corp. 311,575 1,069<br />
* McMoRan Exploration<br />
Co. 3,675 36<br />
* Oceaneering<br />
International, Inc. 46,800 1,364<br />
* Parker Drilling Co. 13,000 38<br />
Penn Virginia Corp. 1,425 37<br />
* PetroQuest Energy, Inc. 6,250 42<br />
Ship Finance<br />
International, Ltd. 3,300 36<br />
* Stone Energy Corp. 3,850 42<br />
* T-3 Energy Services,<br />
Inc. 75,462 712<br />
* Whiting Petroleum Corp. 73,200 2,449<br />
* Willbros Group, Inc. 4,525 38<br />
Total 16,755<br />
Financials (5.7%)<br />
Boston Private Financial<br />
Holdings, Inc. 408,850 2,797<br />
Digital Realty Trust, Inc. 98,150 3,224<br />
* Encore Bancshares, Inc. 58,509 644<br />
* FCStone Group, Inc. 7,825 35<br />
GFI Group, Inc. 11,625 41<br />
* Investment Technology<br />
Group, Inc. 114,450 2,600<br />
* KBW, Inc. 81,342 1,871<br />
MFA Mortgage<br />
Investments, Inc. 698,150 4,112<br />
optionsXpress Holdings,<br />
Inc. 3,075 41<br />
* Portfolio Recovery<br />
Associates, Inc. 25,250 854<br />
Total 16,219<br />
Health Care (15.8%)<br />
* Affymetrix, Inc. 14,150 42<br />
Common Stocks (91.6%)<br />
Shares/<br />
$ Par<br />
Value<br />
$ (000's)<br />
Health Care continued<br />
* Alkermes, Inc. 3,900 42<br />
* athenahealth, Inc. 95,200 3,582<br />
* BioMarin<br />
Pharmaceutical, Inc. 222,200 3,955<br />
* CardioNet, Inc. 96,200 2,371<br />
* Genoptix, Inc. 136,589 4,655<br />
* Illumina, Inc. 180,000 4,689<br />
* IPC The Hospitalist Co. 70,700 1,190<br />
* K-V Pharmaceutical Co.<br />
- Class A 7,200 21<br />
* Masimo Corp. 207,282 6,183<br />
Meridian Bioscience,<br />
Inc. 164,739 4,196<br />
* NuVasive, Inc. 74,816 2,592<br />
* PAREXEL International<br />
Corp. 4,325 42<br />
* Phase Forward, Inc. 199,218 2,494<br />
* Psychiatric Solutions,<br />
Inc. 168,644 4,697<br />
* Thoratec Corp. 107,245 3,484<br />
* United Therapeutics<br />
Corp. 13,450 841<br />
Total 45,076<br />
Industrials (19.1%)<br />
* AAR Corp. 2,250 41<br />
Actuant Corp. 2,375 45<br />
Acuity Brands, Inc. 1,125 39<br />
* Aerovironment, Inc. 57,300 2,109<br />
* Allegiant Travel Co. 28,000 1,360<br />
* Astec Industries, Inc. 38,550 1,208<br />
* Astronics Corp. 205,652 1,830<br />
* Axsys Technologies, Inc. 27,733 1,521<br />
Belden, Inc. 1,975 41<br />
Bucyrus International,<br />
Inc. 70,963 1,314<br />
* Chart Industries, Inc. 3,350 36<br />
* Cornell Cos., Inc. 240,800 4,477<br />
* Corrections Corp. of<br />
America 229,548 3,755<br />
Deluxe Corp. 2,475 37<br />
Eagle Bulk Shipping,<br />
Inc. 5,100 35<br />
* EMCOR Group, Inc. 1,850 42<br />
* Energy Recovery, Inc. 79,201 600<br />
* EnerSys 3,775 42<br />
* Flow International Corp. 18,900 46<br />
* Force Protection, Inc. 7,725 46<br />
Genco Shipping &<br />
Trading, Ltd. 2,550 38<br />
* GrafTech International,<br />
Ltd. 5,025 42<br />
* Hawaiian Holdings, Inc. 7,475 48<br />
Herman Miller, Inc. 2,800 37<br />
* Hexcel Corp. 4,675 35<br />
The Accompanying Notes are an Integral Part of the Financial Statements.<br />
52 Small Cap Growth Stock Portfolio
Small Cap Growth Stock Portfolio<br />
Common Stocks (91.6%)<br />
Shares/<br />
$ Par<br />
Value<br />
$ (000's)<br />
Industrials continued<br />
* Hill International, Inc. 105,200 741<br />
* Hub Group, Inc. - Class<br />
A 122,400 3,247<br />
* Huron Consulting<br />
Group, Inc. 71,350 4,086<br />
* ICF International, Inc. 133,300 3,275<br />
Kaydon Corp. 49,459 1,699<br />
Knight Transportation,<br />
Inc. 334,628 5,394<br />
Knoll, Inc. 4,250 38<br />
* Korn/Ferry International 3,275 37<br />
* Perini Corp. 1,750 41<br />
* Stanley, Inc. 119,700 4,336<br />
* TBS International, Ltd. -<br />
Class A 4,125 41<br />
* Team, Inc. 240,077 6,650<br />
* Titan Machinery, Inc. 203,200 2,857<br />
* TransDigm Group, Inc. 90,800 3,048<br />
Total 54,314<br />
Information Technology (20.4%)<br />
* Advanced Energy<br />
Industries, Inc. 244,417 2,432<br />
* Amkor Technology, Inc. 18,800 41<br />
* Atheros<br />
Communications, Inc. 126,950 1,817<br />
* Bankrate, Inc. 117,083 4,449<br />
* Blackboard, Inc. 50,631 1,328<br />
* comScore, Inc. 134,989 1,721<br />
* Comtech<br />
Telecommunications<br />
Corp. 30,250 1,386<br />
* Concur Technologies,<br />
Inc. 86,400 2,836<br />
* CyberSource Corp. 140,900 1,689<br />
* DG Fastchannel, Inc. 209,550 2,615<br />
* Diodes, Inc. 300,675 1,822<br />
* EarthLink, Inc. 5,800 39<br />
* F5 Networks, Inc. 130,250 2,977<br />
* Harmonic, Inc. 6,550 37<br />
* Infinera Corp. 4,375 39<br />
* j2 Global<br />
Communications, Inc. 63,350 1,270<br />
* Mellanox Technologies,<br />
Ltd. 216,901 1,705<br />
* Netlogic Microsystems,<br />
Inc. 174,703 3,845<br />
* NeuStar, Inc. - Class A 193,350 3,699<br />
* Novatel Wireless, Inc. 9,475 44<br />
* Omniture, Inc. 296,169 3,151<br />
* OmniVision<br />
Technologies, Inc. 7,700 40<br />
* PMC-Sierra, Inc. 8,225 40<br />
* Rubicon Technology,<br />
Inc. 128,300 547<br />
* Sigma Designs, Inc. 3,850 37<br />
* Skyworks Solutions, Inc. 7,100 39<br />
Common Stocks (91.6%)<br />
Shares/<br />
$ Par<br />
Value<br />
$ (000's)<br />
Information Technology continued<br />
* Switch and Data<br />
Facilities Co., Inc. 367,463 2,716<br />
* Synchronoss<br />
Technologies, Inc. 337,656 3,599<br />
* Take-Two Interactive<br />
Software, Inc. 4,550 34<br />
* TeleTech Holdings, Inc. 4,350 36<br />
* TiVo, Inc. 5,725 41<br />
* TriQuint Semiconductor,<br />
Inc. 895,850 3,082<br />
* VanceInfo Technologies,<br />
Inc., ADR 646,095 3,069<br />
* VistaPrint, Ltd. 188,436 3,507<br />
* Vocus, Inc. 120,350 2,192<br />
Total 57,921<br />
Materials (2.6%)<br />
* Apex Silver Mines, Ltd. 28,425 28<br />
* Calgon Carbon Corp. 229,450 3,524<br />
* Flotek Industries, Inc. 16,675 42<br />
Silgan Holdings, Inc. 80,779 3,862<br />
* W.R. Grace & Co. 6,675 40<br />
Worthington Industries,<br />
Inc. 3,125 35<br />
Total 7,531<br />
Other Holdings (2.5%)<br />
Financial Select Sector<br />
SPDR Fund 209,400 2,643<br />
iShares Nasdaq<br />
Biotechnology Index<br />
Fund 45,550 3,236<br />
SPDR Metals & Mining<br />
ETF 40,709 1,131<br />
Total 7,010<br />
Telecommunication Services (0.9%)<br />
* Centennial<br />
Communications Corp. 314,611 2,536<br />
Total 2,536<br />
Utilities (2.0%)<br />
ITC Holdings Corp. 132,250 5,777<br />
Total 5,777<br />
Total Common Stocks<br />
(Cost: $333,444) 260,718<br />
Short-Term Investments (7.4%)<br />
Aircraft (3.5%)<br />
(k) Textron, Inc.,<br />
6.25%, 1/12/09 10,000,000 9,981<br />
Total 9,981<br />
Energy (1.8%)<br />
(b) Sempra Global,<br />
1.50%, 1/7/09 5,000,000 4,999<br />
Total 4,999<br />
Short-Term<br />
Investments (7.4%)<br />
Shares/<br />
$ Par<br />
Value<br />
$ (000's)<br />
Federal Government & Agencies (0.4%)<br />
(b)Federal National<br />
Mortgage Association,<br />
0.20%, 3/30/09 1,500,000 1,499<br />
Total 1,499<br />
Personal Credit Institutions (1.7%)<br />
HSBC Finance Corp.,<br />
0.30%, 1/6/09 4,700,000 4,700<br />
Total 4,700<br />
Total Short-Term Investments<br />
(Cost: $21,179) 21,179<br />
Total Investments (99.0%)<br />
(Cost: $354,623)(a) 281,897<br />
Other Assets, Less<br />
Liabilities (1.0%) 2,724<br />
Net Assets (100.0%) 284,621<br />
The Accompanying Notes are an Integral Part of the Financial Statements.<br />
Small Cap Growth Stock Portfolio 53
Small Cap Growth Stock Portfolio<br />
* Non-Income Producing<br />
ADR after the name of a security represents—American Depositary Receipt.<br />
(a)<br />
(b)<br />
At December 31, 2008 the aggregate cost of securities for federal tax purposes (in thousands) was $366,374 and the net unrealized depreciation of<br />
investments based on that cost was $84,477 which is comprised of $8,045 aggregate gross unrealized appreciation and $92,522 aggregate gross unrealized<br />
depreciation.<br />
All or a portion of the securities have been committed as collateral for open futures positions or when-issued securities. Information regarding open futures<br />
contracts as of period end is summarized below.<br />
Unrealized<br />
Appreciation/<br />
Number of<br />
(Depreciation)<br />
Issuer (000's)<br />
Contracts Expiration Date (000's)<br />
Russell 2000 Mini Index Future (Long) (Total Notional Value at December 31, 2008, $5,994) 125 3/09 $ 229<br />
(j) Swap agreements outstanding on December 31, 2008<br />
Total Return Swaps<br />
CounterParty<br />
JPMorgan Chase<br />
Reference<br />
Russell 2000 Growth<br />
Biotechnology Industry Index<br />
Payment Made by<br />
the Fund<br />
3 Month USD-<br />
LIBOR -120 Bps<br />
Payment Received by<br />
the Fund<br />
Russell 2000 Growth<br />
Biotechnology<br />
Industry Index Total<br />
Return<br />
Notional<br />
Amount<br />
(000's)<br />
Unrealized<br />
Appreciation/<br />
(Depreciation)<br />
(000's)<br />
Expiration<br />
Date<br />
12/09 6,600 $ 782<br />
(k) Securities with an aggregate value of $9,981 (in thousands) have been pledged as collateral for swap contracts outstanding on December 31, 2008<br />
The Accompanying Notes are an Integral Part of the Financial Statements.<br />
54 Small Cap Growth Stock Portfolio
Index 600 Stock Portfolio<br />
Objective: Portfolio Strategy: Net Assets:<br />
The Portfolio’s investment objective is to<br />
achieve investment results that approximate<br />
the performance of the S&P SmallCap 600 ®<br />
Index’s performance.<br />
Invest in the stocks included in the S&P SmallCap 600 ®<br />
Index in approximately the same proportion as each<br />
stock’s weighting in the Index.<br />
$21 million<br />
Portfolio Overview<br />
Mason Street Advisors acts as the investment adviser for the Index 600 Stock Portfolio. The Portfolio seeks investment results<br />
that approximate the performance of the S&P SmallCap 600 ® Index. The Portfolio invests in a representative sample of stocks<br />
included in the S&P SmallCap 600 ® Index, and in total return swaps whose performance is related to the index. The Portfolio<br />
may also invest in exchange traded funds in an attempt to gain exposure to the market while awaiting the purchase of<br />
underlying securities. The Portfolio invests in stocks included in the S&P SmallCap 600 ® Index in proportion to their<br />
weightings in the Index, and may buy or sell securities after announced changes in the Index but before or after the effective<br />
date of the changes to attempt to achieve higher correlation with the Index. The Portfolio remains neutral relative to the<br />
benchmark in terms of economic sectors, market capitalization, and the growth and value styles of investing. The Portfolio<br />
will, to the extent feasible, remain fully invested.<br />
Market Overview<br />
Financial markets endured a brutal 2008, which saw the failure of a number of leading financial institutions, credit markets<br />
freeze up, and the U.S. government take a series of extraordinary steps to support the economy and financial system. Returns<br />
were negative across all market capitalization ranges, sectors, and investment styles. For all of 2008, returns for large-,<br />
medium- and small-sized companies were –37.00%, –36.23% and –31.07%, as measured by the S&P 500 ® , MidCap 400 ® and<br />
SmallCap 600 ® Stock Indices, respectively.<br />
Small-cap stocks did better after lagging stocks of large- and mid-sized companies in 2007. In part that was because the fallout<br />
from the credit crisis was concentrated in large-cap Financial shares, removing a big drag on small-cap performance. Indeed,<br />
in the small-cap space Financials were among the five sectors to manage returns better than those of the Index as a whole (–<br />
28% versus –31%).<br />
The other areas to hold up better than the Index were the traditionally defensive Utilities and Consumer Staples shares, which<br />
had returns of –7% and –14%, respectively. In addition, the more growth-oriented Industrial and Health Care sectors both<br />
managed returns of –28%.<br />
At the other end of the spectrum, the poorest performers were generally those stocks facing worries about the drag on earnings<br />
from the U.S. recession. In that environment, Materials, Energy, Consumer Discretionary and Information Technology shares<br />
fell 49%, 46%, 43% and 41%, respectively. Finally, Telecommunication Services also had a sizable negative return, down<br />
58%, though this represents the performance of only two stocks, which comprise a tiny fraction of the Index.<br />
Portfolio Results<br />
The Portfolio had a sharply negative return in the worst year for equities since the Great Depression. For the twelve months<br />
ended December 31, 2008, the Index 600 Stock Portfolio returned –31.30%, while the S&P SmallCap 600 ® Index returned –<br />
31.07%. (This Index is unmanaged, cannot be invested in directly and does not include administrative expenses or sales<br />
charges.) Portfolio performance slightly lagged the S&P SmallCap 600 ® Index due to transaction costs, administrative<br />
expenses, cash flow effects and the costs associated with the use of exchange traded funds and other derivative instruments<br />
used to achieve full replication. The average return for the Portfolio’s peer group, Small-Cap Core Funds, was –35.54% for the<br />
same period, according to Lipper Analytical Services, Inc., an independent mutual fund ranking agency. However, the Small-<br />
Cap Core Funds peer group is not strictly comparable to the Index 600 Stock Portfolio because many of the portfolios in the<br />
group are actively managed.<br />
Outlook<br />
After the unprecedented events of 2008, we have a somewhat hopeful outlook for 2009—we are hoping for the reemergence of<br />
a more rational, less volatile market environment where fundamentals and diversification matter once again. Unfortunately, the<br />
economic fundamentals remain challenging, though we think it is reasonable to expect some sort of recovery based on the<br />
massive government stimulus likely to come early in the new year. Diversification, too, is likely to matter again, as we see<br />
greater differentiation in returns across and within asset classes. We continue to believe in the potential benefit of investing in<br />
a fund based on a broad market index, such as the Index 600 Stock Portfolio, which provides exposure to both growth and<br />
value styles of investing, as well stocks of companies across the economy.<br />
Index 600 Stock Portfolio 55
Index 600 Stock Portfolio<br />
$10,000<br />
9,000<br />
8,000<br />
7,000<br />
Relative Performance<br />
6,000<br />
4/07 12/07 12/08<br />
Index 600 Stock Portfolio<br />
S&P SmallCap 600 Index<br />
Average <strong>Annual</strong> Total Returns<br />
For Periods Ended December 31, 2008<br />
1 Year<br />
Since<br />
Inception*<br />
Index 600 Stock Portfolio<br />
S&P SmallCap 600 Index<br />
-31.30%<br />
-31.07%<br />
-22.97%<br />
-22.59%<br />
Lipper Variable Insurance Products<br />
(VIP) Small Cap Core Funds<br />
Average -35.54% –%<br />
*Inception date of 4/30/07<br />
The performance data quoted represents past<br />
performance. Past performance is historical and does<br />
not guarantee future performance. Investment return<br />
and principal value will fluctuate, so that shares, when<br />
redeemed, may be worth more or less than their original<br />
cost. Current performance may be lower or higher than<br />
the performance data quoted. For the most recent<br />
month-end performance information visit<br />
www.nmfn.com.<br />
This chart assumes an initial investment of $10,000<br />
made on 4/30/07 (commencement of the Portfolio's<br />
operations). Returns shown reflect fee waivers,<br />
deductions for management and other portfolio<br />
expenses, and reinvestment of all dividends. In the<br />
absence of fee waivers, total return would be reduced.<br />
Returns exclude deductions for separte account sale<br />
loads and account fees. Please refer to the Benchmark<br />
Definitions section of this report for information about<br />
the indices cited in the above chart and graph.<br />
“Standard & Poor’s ® ”, “S&P ® ”, S&P SmallCap 600 and<br />
Standard & Poor’s SmallCap 600 are trademarks of The<br />
McGraw-Hill Companies, Inc. and have been licensed for<br />
use by The <strong>Northwestern</strong> <strong>Mutual</strong> Life Insurance<br />
Company. The Portfolio is not sponsored, endorsed, sold<br />
or promoted by Standard & Poor’s, and Standard &<br />
Poor’s makes no representation regarding the<br />
advisability of investing in the Portfolio.<br />
Stocks of smaller or newer companies, such as those<br />
held in this Portfolio, are more likely to realize more<br />
substantial growth as well as suffer more significant<br />
losses than larger or more established issuers.<br />
Investments in such companies can be both more<br />
volatile and more speculative. Investing in small<br />
company stocks involves a greater degree of risk than<br />
investing in medium or large company stocks.<br />
The Portfolio may use derivative instruments for hedging<br />
purposes as part of its investment strategy. Use of these<br />
instruments may involve certain costs and risks such as<br />
liquidity risk, interest rate risk, market risk, credit risk,<br />
management risk and the risk that the Portfolio could<br />
not close out a position when it would be most<br />
advantageous to do so. Portfolios investing in<br />
derivatives could lose more than the principal amount<br />
invested in those instruments.<br />
Top 10 Equity Holdings 12/31/08<br />
Security Description<br />
% of Net Assets<br />
iShares S&P SmallCap 600 Index Fund 3.6%<br />
Piedmont Natural Gas Co., Inc. 0.6%<br />
Itron, Inc. 0.5%<br />
Atmos Energy Corp. 0.5%<br />
Watson Wyatt Worldwide, Inc. - Class A 0.5%<br />
Senior Housing Properties Trust 0.5%<br />
Landstar System, Inc. 0.5%<br />
Immucor, Inc. 0.5%<br />
ProAssurance Corp. 0.4%<br />
CLARCOR, Inc. 0.4%<br />
Energy<br />
4%<br />
Other Holdings<br />
4%<br />
Utilities<br />
5%<br />
Consumer<br />
Discretionary<br />
13%<br />
Health Care<br />
13%<br />
Sector Allocation 12/31/08<br />
Materials<br />
4%<br />
Consumer Staples<br />
4%<br />
Sector Allocation is based on equities.<br />
Sector Allocation and Top 10 Holdings are subject to<br />
change.<br />
Financials<br />
20%<br />
Industrials<br />
18%<br />
Information<br />
Technology<br />
15%<br />
56 Index 600 Stock Portfolio
Index 600 Stock Portfolio<br />
<strong>Northwestern</strong> <strong>Mutual</strong> Series Fund, Inc.<br />
Schedule of Investments<br />
December 31, 2008<br />
Common Stocks (84.5%)<br />
Shares/<br />
$ Par<br />
Consumer Discretionary (10.4%)<br />
Value<br />
$ (000's)<br />
* 4Kids Entertainment, Inc. 589 1<br />
A.H. Belo Corp. - Class A 876 2<br />
Aaron Rents, Inc. 2,781 74<br />
Arbitron, Inc. 1,384 18<br />
Arctic Cat, Inc. 622 3<br />
* Audiovox Corp. - Class A 966 5<br />
Bassett Furniture<br />
Industries, Inc. 607 2<br />
Big 5 Sporting Goods<br />
Corp. 1,124 6<br />
* Blue Nile, Inc. 760 19<br />
Brown Shoe Co., Inc. 2,208 19<br />
Brunswick Corp. 4,569 19<br />
The Buckle, Inc. 1,222 27<br />
* Buffalo Wild Wings, Inc. 930 24<br />
* Cabela's, Inc. 2,047 12<br />
* California Pizza Kitchen,<br />
Inc. 1,280 14<br />
* Capella Education Co. 739 43<br />
* Carter's, Inc. 2,929 56<br />
The Cato Corp. - Class A 1,542 23<br />
* CEC Entertainment, Inc. 1,181 29<br />
* Champion Enterprises, Inc. 4,058 2<br />
* Charlotte Russe Holding,<br />
Inc. 1,089 7<br />
* The Children's Place Retail<br />
Stores, Inc. 1,258 27<br />
Christopher & Banks<br />
Corp. 1,847 10<br />
CKE Restaurants, Inc. 2,735 24<br />
* Coinstar, Inc. 1,473 29<br />
Cracker Barrel Old<br />
Country Store, Inc. 1,155 24<br />
* Crocs, Inc. 4,321 5<br />
* Deckers Outdoor Corp. 681 54<br />
DineEquity, Inc. 803 9<br />
* The Dress Barn, Inc. 2,360 25<br />
* Drew Industries, Inc. 1,021 12<br />
The E.W. Scripps Co. -<br />
Class A 1,534 3<br />
Ethan Allen Interiors, Inc. 1,497 22<br />
The Finish Line, Inc. -<br />
Class A 2,861 16<br />
* Fossil, Inc. 2,365 40<br />
Fred's, Inc. - Class A 2,083 22<br />
* Genesco, Inc. 1,000 17<br />
Group 1 Automotive, Inc. 1,214 13<br />
* The Gymboree Corp. 1,513 39<br />
Haverty Furniture Cos.,<br />
Inc. 967 9<br />
* Hibbett Sports, Inc. 1,485 23<br />
Hillenbrand, Inc. 3,256 54<br />
* Hot Topic, Inc. 2,283 21<br />
* HSN, Inc. 2,035 15<br />
Common Stocks (84.5%)<br />
Shares/ Value<br />
$ Par $ (000's)<br />
Consumer Discretionary continued<br />
* Iconix Brand Group, Inc. 3,015 29<br />
* Interval Leisure Group,<br />
Inc. 2,035 11<br />
* Jack in the Box, Inc. 2,958 65<br />
* JAKKS Pacific, Inc. 1,431 30<br />
* Jo-Ann Stores, Inc. 1,324 21<br />
* Jos. A. Bank Clothiers,<br />
Inc. 948 25<br />
K-Swiss, Inc. - Class A 1,398 16<br />
Landry's Restaurants, Inc. 648 8<br />
La-Z-Boy, Inc. 2,706 6<br />
Lithia Motors, Inc. -<br />
Class A 857 3<br />
* Live Nation, Inc. 3,952 23<br />
Liz Claiborne, Inc. 4,940 13<br />
M/I Homes, Inc. 731 8<br />
* Maidenform Brands, Inc. 974 10<br />
The Marcus Corp. 1,100 18<br />
* MarineMax, Inc. 961 3<br />
The Men's Wearhouse,<br />
Inc. 2,693 36<br />
* Meritage Homes Corp. 1,601 19<br />
* Midas, Inc. 732 8<br />
* Monarch Casino & Resort,<br />
Inc. 597 7<br />
Movado Group, Inc. 937 9<br />
* Multimedia Games, Inc. 1,207 3<br />
National Presto Industries,<br />
Inc. 250 19<br />
* Nautilus, Inc. 1,202 3<br />
NutriSystem, Inc. 1,542 23<br />
O'Charley's, Inc. 1,110 2<br />
OfficeMax, Inc. 3,961 30<br />
Oxford Industries, Inc. 711 6<br />
* P.F. Chang's China Bistro,<br />
Inc. 1,240 26<br />
* Panera Bread Co. -<br />
Class A 1,589 83<br />
* Papa John's International,<br />
Inc. 1,129 21<br />
* Peet's Coffee & Tea, Inc. 623 14<br />
The Pep Boys - Manny,<br />
Moe & Jack 2,311 10<br />
* Perry Ellis International,<br />
Inc. 617 4<br />
* PetMed Express, Inc. 1,236 22<br />
* Pinnacle Entertainment,<br />
Inc. 3,128 24<br />
Polaris Industries, Inc. 1,694 49<br />
Pool Corp. 2,498 45<br />
* Pre-Paid Legal Services,<br />
Inc. 401 15<br />
* Quiksilver, Inc. 6,624 12<br />
* RC2 Corp. 897 10<br />
Common Stocks (84.5%)<br />
Shares/ Value<br />
$ Par $ (000's)<br />
Consumer Discretionary continued<br />
* Red Robin Gourmet<br />
Burgers, Inc. 806 14<br />
Ruby Tuesday, Inc. 2,753 4<br />
* Russ Berrie and Co., Inc. 837 2<br />
* Ruth's Hospitality Group,<br />
Inc. 1,008 1<br />
* Shuffle Master, Inc. 2,897 14<br />
* Skechers U.S.A., Inc. -<br />
Class A 1,734 22<br />
Skyline Corp. 355 7<br />
Sonic Automotive, Inc. -<br />
Class A 1,463 6<br />
* Sonic Corp. 3,147 38<br />
Spartan Motors, Inc. 1,706 8<br />
Stage Stores, Inc. 2,018 17<br />
* Stamps.com, Inc. 742 7<br />
Standard Motor Products,<br />
Inc. 595 2<br />
* Standard Pacific Corp. 6,005 11<br />
* The Steak n Shake Co. 1,492 9<br />
Stein Mart, Inc. 1,263 1<br />
* Sturm, Ruger & Co., Inc. 1,015 6<br />
Superior Industries<br />
International, Inc. 1,210 13<br />
* Texas Roadhouse, Inc. -<br />
Class A 2,743 21<br />
*Ticketmaster<br />
Entertainment, Inc. 2,035 13<br />
* Tractor Supply Co. 1,672 60<br />
* True Religion Apparel,<br />
Inc. 954 12<br />
* Tuesday Morning Corp. 1,570 3<br />
* Tween Brands, Inc. 1,292 6<br />
UniFirst Corp. 746 22<br />
* Universal Electronics, Inc. 726 12<br />
* Universal Technical<br />
Institute, Inc. 1,125 19<br />
* Volcom, Inc. 826 9<br />
Winnebago Industries, Inc. 1,516 9<br />
* WMS Industries, Inc. 2,616 70<br />
Wolverine World Wide,<br />
Inc. 2,555 54<br />
* Zale Corp. 1,663 6<br />
* Zumiez, Inc. 1,043 8<br />
Total 2,213<br />
Consumer Staples (2.9%)<br />
* Alliance One International,<br />
Inc. 4,636 14<br />
The Andersons, Inc. 944 15<br />
* The Boston Beer Co., Inc.<br />
- Class A 520 15<br />
Cal-Maine Foods, Inc. 656 19<br />
Casey's General Stores,<br />
Inc. 2,648 60<br />
The Accompanying Notes are an Integral Part of the Financial Statements.<br />
Index 600 Stock Portfolio 57
Index 600 Stock Portfolio<br />
Common Stocks (84.5%)<br />
Shares/ Value<br />
$ Par $ (000's)<br />
Consumer Staples continued<br />
* Central Garden & Pet Co. -<br />
Class A 3,710 22<br />
* Chattem, Inc. 979 70<br />
* Darling International, Inc. 4,269 23<br />
Diamond Foods, Inc. 849 17<br />
* The Great Atlantic &<br />
Pacific Tea Co., Inc. 1,575 10<br />
* Green Mountain Coffee<br />
Roasters, Inc. 910 35<br />
* The Hain Celestial Group,<br />
Inc. 2,095 40<br />
J & J Snack Foods Corp. 741 27<br />
Lance, Inc. 1,642 38<br />
Mannatech, Inc. 814 2<br />
Nash Finch Co. 667 30<br />
Sanderson Farms, Inc. 910 31<br />
Spartan Stores, Inc. 1,152 27<br />
* TreeHouse Foods, Inc. 1,640 45<br />
* United Natural Foods, Inc. 2,236 40<br />
WD-40 Co. 858 24<br />
Total 604<br />
Energy (3.5%)<br />
* Atwood Oceanics, Inc. 2,906 44<br />
* Basic Energy Services,<br />
Inc. 1,207 16<br />
* Bristow Group, Inc. 1,517 41<br />
CARBO Ceramics, Inc. 1,065 38<br />
* Dril-Quip, Inc. 1,593 33<br />
Gulf Island Fabrication,<br />
Inc. 745 11<br />
Holly Corp. 2,125 39<br />
* Hornbeck Offshore<br />
Services, Inc. 1,200 20<br />
* ION Geophysical Corp. 4,480 15<br />
Lufkin Industries, Inc. 776 27<br />
* Matrix Service Co. 1,359 10<br />
* NATCO Group, Inc. -<br />
Class A 1,053 16<br />
* Oil States International,<br />
Inc. 2,597 48<br />
Penn Virginia Corp. 2,182 57<br />
* Petroleum Development<br />
Corp. 775 19<br />
* PetroQuest Energy, Inc. 2,263 15<br />
* Pioneer Drilling Co. 2,597 14<br />
* SEACOR Holdings, Inc. 1,087 72<br />
St. Mary Land &<br />
Exploration Co. 3,243 66<br />
* Stone Energy Corp. 1,802 20<br />
* Superior Well Services,<br />
Inc. 861 9<br />
* Swift Energy Co. 1,609 27<br />
* TETRA Technologies, Inc. 3,901 19<br />
World Fuel Services Corp. 1,526 56<br />
Total 732<br />
Financials (17.0%)<br />
Acadia Realty Trust 1,687 24<br />
Common Stocks (84.5%)<br />
Shares/ Value<br />
$ Par $ (000's)<br />
Financials continued<br />
American Physicians<br />
Capital, Inc. 351 17<br />
* Amerisafe, Inc. 956 20<br />
Anchor BanCorp<br />
Wisconsin, Inc. 941 3<br />
Bank <strong>Mutual</strong> Corp. 2,515 29<br />
BankAtlantic Bancorp,<br />
Inc. - Class A 409 2<br />
BioMed Realty Trust, Inc. 4,132 48<br />
Boston Private Financial<br />
Holdings, Inc. 3,325 23<br />
Brookline Bancorp, Inc. 3,045 32<br />
Cascade Bancorp 1,464 10<br />
Cash America<br />
International, Inc. 1,516 42<br />
Cedar Shopping Centers,<br />
Inc. 2,320 16<br />
Central Pacific Financial<br />
Corp. 1,498 15<br />
Colonial Properties Trust 2,498 21<br />
Columbia Banking<br />
System, Inc. 947 11<br />
Community Bank System,<br />
Inc. 1,676 41<br />
Corus Bankshares, Inc. 1,625 2<br />
Delphi Financial Group,<br />
Inc. - Class A 2,152 40<br />
DiamondRock Hospitality<br />
Co. 4,808 24<br />
Dime Community<br />
Bancshares 1,373 18<br />
East West Bancorp, Inc. 3,310 53<br />
EastGroup Properties, Inc. 1,307 47<br />
Entertainment Properties<br />
Trust 1,714 51<br />
Extra Space Storage, Inc. 4,274 44<br />
Financial Federal Corp. 1,331 31<br />
First BanCorp 3,957 44<br />
* First Cash Financial<br />
Services, Inc. 1,342 26<br />
First Commonwealth<br />
Financial Corp. 3,823 47<br />
First Financial Bancorp. 1,662 21<br />
First Financial Bankshares,<br />
Inc. 1,085 60<br />
First Midwest Bancorp,<br />
Inc. 2,534 51<br />
* Flagstar Bancorp, Inc. 3,053 2<br />
* Forestar Group, Inc. 1,861 18<br />
Franklin Street Properties<br />
Corp. 3,130 46<br />
Frontier Financial Corp. 2,452 11<br />
Glacier Bancorp, Inc. 3,103 59<br />
Greenhill & Co., Inc. 913 64<br />
* Guaranty Financial Group,<br />
Inc. 5,681 15<br />
Hancock Holding Co. 1,229 56<br />
Hanmi Financial Corp. 1,939 4<br />
Home BancShares, Inc. 692 19<br />
Home Properties, Inc. 1,665 68<br />
Common Stocks (84.5%)<br />
Shares/ Value<br />
$ Par $ (000's)<br />
Financials continued<br />
Independent Bank Corp. 996 2<br />
Independent Bank<br />
Corp./Rockland Trust Co. 819 21<br />
Infinity Property &<br />
Casualty Corp. 747 35<br />
Inland Real Estate Corp. 3,001 39<br />
* Investment Technology<br />
Group, Inc. 2,273 52<br />
* Irwin Financial Corp. 944 1<br />
Kilroy Realty Corp. 1,703 57<br />
Kite Realty Group Trust 1,769 10<br />
* LaBranche & Co., Inc. 2,813 14<br />
LaSalle Hotel Properties 2,110 23<br />
Lexington Realty Trust 3,453 17<br />
LTC Properties, Inc. 1,205 24<br />
Medical Properties Trust,<br />
Inc. 3,460 22<br />
Mid-America Apartment<br />
Communities, Inc. 1,434 53<br />
Nara Bancorp, Inc. 1,162 11<br />
National Financial Partners<br />
Corp. 2,071 6<br />
National Penn Bancshares,<br />
Inc. 4,155 60<br />
National Retail Properties,<br />
Inc. 4,088 70<br />
* The Navigators Group,<br />
Inc. 692 38<br />
Old National Bancorp 3,452 63<br />
optionsXpress Holdings,<br />
Inc. 2,224 30<br />
Parkway Properties, Inc. 798 14<br />
Pennsylvania Real Estate<br />
Investment Trust 2,075 15<br />
* Piper Jaffray Cos., Inc. 823 33<br />
* Portfolio Recovery<br />
Associates, Inc. 801 27<br />
Post Properties, Inc. 2,302 38<br />
Presidential Life Corp. 1,126 11<br />
PrivateBancorp, Inc. 1,426 46<br />
* ProAssurance Corp. 1,747 92<br />
Prosperity Bancshares, Inc. 2,138 63<br />
Provident Bankshares<br />
Corp. 1,730 17<br />
PS Business Parks, Inc. 778 35<br />
* Rewards Network, Inc. 1,408 4<br />
RLI Corp. 924 57<br />
S&T Bancorp, Inc. 1,223 43<br />
Safety Insurance Group,<br />
Inc. 850 32<br />
Selective Insurance Group,<br />
Inc. 2,748 63<br />
Senior Housing Properties<br />
Trust 5,972 107<br />
* Signature Bank 1,798 52<br />
The South Financial<br />
Group, Inc. 3,799 16<br />
Sovran Self Storage, Inc. 1,145 41<br />
Sterling Bancorp 938 13<br />
Sterling Bancshares, Inc. 3,817 23<br />
The Accompanying Notes are an Integral Part of the Financial Statements.<br />
58 Index 600 Stock Portfolio
Index 600 Stock Portfolio<br />
Common Stocks (84.5%)<br />
Shares/ Value<br />
$ Par $ (000's)<br />
Financials continued<br />
Sterling Financial Corp. 2,716 24<br />
Stewart Information<br />
Services Corp. 946 22<br />
* Stifel Financial Corp. 1,309 60<br />
Susquehanna Bancshares,<br />
Inc. 4,488 71<br />
SWS Group, Inc. 1,431 27<br />
Tanger Factory Outlet<br />
Centers, Inc. 1,649 62<br />
Tompkins Financial Corp. 348 20<br />
Tower Group, Inc. 1,058 30<br />
* TradeStation Group, Inc. 1,678 11<br />
TrustCo Bank Corp. NY 3,956 38<br />
UCBH Holdings, Inc. 5,762 40<br />
UMB Financial Corp. 1,537 76<br />
Umpqua Holdings Corp. 3,134 45<br />
United Bankshares, Inc. 1,964 65<br />
United Community Banks,<br />
Inc. 2,120 29<br />
United Fire & Casualty<br />
Co. 1,174 37<br />
Urstadt Biddle Properties,<br />
Inc. 1,111 18<br />
Whitney Holding Corp. 3,511 56<br />
Wilshire Bancorp, Inc. 1,012 9<br />
Wintrust Financial Corp. 1,233 25<br />
* World Acceptance Corp. 854 17<br />
Zenith National Insurance<br />
Corp. 1,943 61<br />
Total 3,608<br />
Health Care (11.1%)<br />
* Abaxis, Inc. 1,136 18<br />
* Air Methods Corp. 561 9<br />
* Amedisys, Inc. 1,398 58<br />
* American Medical<br />
Systems Holdings, Inc. 3,811 34<br />
* AMERIGROUP Corp. 2,767 82<br />
* AMN Healthcare Services,<br />
Inc. 1,760 15<br />
* AmSurg Corp. 1,650 39<br />
Analogic Corp. 699 19<br />
* ArQule, Inc. 1,470 6<br />
* ArthroCare Corp. 1,389 7<br />
* Cambrex Corp. 1,521 7<br />
* Catalyst Health Solutions,<br />
Inc. 1,984 48<br />
* Centene Corp. 2,255 44<br />
Chemed Corp. 1,195 48<br />
* CONMED Corp. 1,500 36<br />
The Cooper Cos., Inc. 2,347 38<br />
* CorVel Corp. 424 9<br />
* Cross Country Healthcare,<br />
Inc. 1,600 14<br />
* CryoLife, Inc. 1,461 14<br />
* Cubist Pharmaceuticals,<br />
Inc. 2,951 71<br />
* Cyberonics, Inc. 1,212 20<br />
Datascope Corp. 682 36<br />
* Dionex Corp. 944 42<br />
Common Stocks (84.5%)<br />
Shares/ Value<br />
$ Par $ (000's)<br />
Health Care continued<br />
* Eclipsys Corp. 2,836 40<br />
* Enzo Biochem, Inc. 1,688 8<br />
* Gentiva Health Services,<br />
Inc. 1,493 44<br />
* Greatbatch, Inc. 1,193 32<br />
* Haemonetics Corp. 1,325 75<br />
* Healthspring, Inc. 2,594 52<br />
* Healthways, Inc. 1,752 20<br />
* HMS Holdings Corp. 1,307 41<br />
* ICU Medical, Inc. 656 22<br />
* Immucor, Inc. 3,661 97<br />
* Integra LifeSciences<br />
Holdings 1,016 36<br />
Invacare Corp. 1,672 26<br />
* inVentiv Health, Inc. 1,732 20<br />
* Kendle International, Inc. 691 18<br />
* Kensey Nash Corp. 607 12<br />
Landauer, Inc. 485 36<br />
LCA-Vision, Inc. 967 4<br />
* LHC Group, Inc. 773 28<br />
* Magellan Health Services,<br />
Inc. 2,119 83<br />
* Martek Biosciences Corp. 1,727 52<br />
* MedCath Corp. 1,021 11<br />
Mentor Corp. 1,762 55<br />
Meridian Bioscience, Inc. 2,098 53<br />
* Merit Medical Systems,<br />
Inc. 1,454 26<br />
* Molina Healthcare, Inc. 745 13<br />
* MWI Veterinary Supply,<br />
Inc. 629 17<br />
* Natus Medical, Inc. 1,449 19<br />
* Noven Pharmaceuticals,<br />
Inc. 1,299 14<br />
* Odyssey HealthCare, Inc. 1,711 16<br />
* Omnicell, Inc. 1,620 20<br />
* Osteotech, Inc. 885 2<br />
Owens & Minor, Inc. 2,156 81<br />
* Palomar Medical<br />
Technologies, Inc. 941 11<br />
* Par Pharmaceutical Cos.,<br />
Inc. 1,801 24<br />
* PAREXEL International<br />
Corp. 2,878 28<br />
* Pediatrix Medical Group,<br />
Inc. 2,378 75<br />
* PharMerica Corp. 1,587 25<br />
* Phase Forward, Inc. 2,232 28<br />
* PSS World Medical, Inc. 3,245 61<br />
* Regeneron<br />
Pharmaceuticals, Inc. 3,266 60<br />
* RehabCare Group, Inc. 941 14<br />
* Res-Care, Inc. 1,334 20<br />
* Salix Pharmaceuticals,<br />
Ltd. 2,506 22<br />
* Savient Pharmaceuticals,<br />
Inc. 2,465 14<br />
* SurModics, Inc. 792 20<br />
* Symmetry Medical, Inc. 1,867 15<br />
* Theragenics Corp. 1,653 2<br />
Common Stocks (84.5%)<br />
Shares/ Value<br />
$ Par $ (000's)<br />
Health Care continued<br />
* ViroPharma, Inc. 4,029 52<br />
West Pharmaceutical<br />
Services, Inc. 1,696 64<br />
* Zoll Medical Corp. 1,097 21<br />
Total 2,343<br />
Industrials (15.4%)<br />
A.O. Smith Corp. 1,177 35<br />
* AAR Corp. 2,021 37<br />
ABM Industries, Inc. 2,305 44<br />
Actuant Corp. 2,581 49<br />
Acuity Brands, Inc. 2,121 74<br />
Administaff, Inc. 1,182 26<br />
Albany International Corp.<br />
- Class A 1,385 18<br />
Apogee Enterprises, Inc. 1,502 16<br />
Applied Industrial<br />
Technologies, Inc. 1,898 36<br />
Applied Signal<br />
Technology, Inc. 665 12<br />
Arkansas Best Corp. 1,319 40<br />
* Astec Industries, Inc. 1,027 32<br />
* ATC Technology Corp. 1,096 16<br />
* Axsys Technologies, Inc. 479 26<br />
Baldor Electric Co. 2,410 43<br />
Barnes Group, Inc. 2,271 33<br />
Belden, Inc. 2,425 51<br />
Bowne & Co., Inc. 1,406 8<br />
Brady Corp. - Class A 2,809 67<br />
Briggs & Stratton Corp. 2,598 46<br />
* C&D Technologies, Inc. 1,342 4<br />
Cascade Corp. 442 13<br />
CDI Corp. 670 9<br />
* Ceradyne, Inc. 1,370 28<br />
CIRCOR International,<br />
Inc. 829 23<br />
CLARCOR, Inc. 2,647 88<br />
* Consolidated Graphics,<br />
Inc. 581 13<br />
Cubic Corp. 809 22<br />
Curtiss-Wright Corp. 2,342 78<br />
* EMCOR Group, Inc. 3,409 76<br />
* EnPro Industries, Inc. 1,044 22<br />
* Esterline Technologies<br />
Corp. 1,546 59<br />
Forward Air Corp. 1,508 37<br />
G & K Services, Inc. -<br />
Class A 986 20<br />
* Gardner Denver, Inc. 2,776 65<br />
* GenCorp, Inc. 2,536 9<br />
* The GEO Group, Inc. 2,665 48<br />
Gibraltar Industries, Inc. 1,406 17<br />
* Griffon Corp. 2,147 20<br />
Healthcare Services<br />
Group, Inc. 2,240 36<br />
Heartland Express, Inc. 2,909 46<br />
Heidrick & Struggles<br />
International, Inc. 859 18<br />
* Hub Group, Inc. - Class A 1,964 52<br />
* II-VI, Inc. 1,279 24<br />
The Accompanying Notes are an Integral Part of the Financial Statements.<br />
Index 600 Stock Portfolio 59
Index 600 Stock Portfolio<br />
Common Stocks (84.5%)<br />
Shares/ Value<br />
$ Par $ (000's)<br />
Industrials continued<br />
* Insituform Technologies,<br />
Inc. - Class A 1,457 29<br />
Interface, Inc. - Class A 2,942 14<br />
John Bean Technologies<br />
Corp. 1,437 12<br />
Kaman Corp. 1,324 24<br />
Kaydon Corp. 1,787 61<br />
* Kirby Corp. 2,819 77<br />
Knight Transportation, Inc. 3,039 49<br />
Landstar System, Inc. 2,762 106<br />
Lawson Products, Inc. 218 5<br />
Lennox International, Inc. 2,445 79<br />
Lindsay Corp. 633 20<br />
* Lydall, Inc. 868 5<br />
* Magnetek, Inc. 1,597 4<br />
* Mobile Mini, Inc. 1,818 26<br />
* Moog, Inc. - Class A 2,226 81<br />
Mueller Industries, Inc. 1,937 49<br />
* NCI Building Systems,<br />
Inc. 1,029 17<br />
* Old Dominion Freight<br />
Line, Inc. 1,439 41<br />
* On Assignment, Inc. 1,850 10<br />
* Orbital Sciences Corp. 3,058 60<br />
Quanex Building Products<br />
Corp. 1,964 18<br />
Regal-Beloit Corp. 1,680 64<br />
Robbins & Myers, Inc. 1,806 29<br />
* School Specialty, Inc. 833 16<br />
Simpson Manufacturing<br />
Co., Inc. 1,952 54<br />
SkyWest, Inc. 2,974 55<br />
* Spherion Corp. 2,754 6<br />
The Standard Register Co. 660 6<br />
Standex International<br />
Corp. 652 13<br />
* Sykes Enterprises, Inc. 1,742 33<br />
* Teledyne Technologies,<br />
Inc. 1,861 83<br />
* Tetra Tech, Inc. 3,101 75<br />
The Toro Co. 1,852 61<br />
Tredegar Corp. 1,001 18<br />
Triumph Group, Inc. 855 36<br />
* TrueBlue, Inc. 2,263 22<br />
* United Stationers, Inc. 1,220 41<br />
Universal Forest Products,<br />
Inc. 872 23<br />
Valmont Industries, Inc. 913 56<br />
Viad Corp. 1,094 27<br />
Vicor Corp. 1,022 7<br />
* Volt Information Sciences,<br />
Inc. 666 5<br />
Wabash National Corp. 1,603 7<br />
Watsco, Inc. 1,478 57<br />
Watson Wyatt Worldwide,<br />
Inc. - Class A 2,256 108<br />
Watts Water Technologies,<br />
Inc. - Class A 1,522 38<br />
Total 3,263<br />
Common Stocks (84.5%)<br />
Shares/<br />
$ Par<br />
Information Technology (12.8%)<br />
Value<br />
$ (000's)<br />
* Actel Corp. 1,344 16<br />
* Adaptec, Inc. 6,282 21<br />
* Advanced Energy<br />
Industries, Inc. 1,700 17<br />
Agilysys, Inc. 1,187 5<br />
* Anixter International, Inc. 1,558 47<br />
* Arris Group, Inc. 6,403 51<br />
* ATMI, Inc. 1,630 25<br />
* Avid Technology, Inc. 1,585 17<br />
* Axcelis Technologies, Inc. 5,374 3<br />
* Bankrate, Inc. 724 27<br />
Bel Fuse, Inc. - Class B 615 13<br />
* Benchmark Electronics,<br />
Inc. 3,469 44<br />
Black Box Corp. 914 24<br />
Blackbaud, Inc. 2,273 31<br />
* Blue Coat Systems, Inc. 2,032 17<br />
* Brightpoint, Inc. 2,682 12<br />
* Brooks Automation, Inc. 3,317 19<br />
* Cabot Microelectronics<br />
Corp. 1,213 32<br />
* CACI International, Inc. -<br />
Class A 1,579 71<br />
* Catapult Communications<br />
Corp. 450 3<br />
* Checkpoint Systems, Inc. 2,015 20<br />
* CIBER, Inc. 2,781 13<br />
Cognex Corp. 2,063 30<br />
Cohu, Inc. 1,211 15<br />
* Comtech<br />
Telecommunications<br />
Corp. 1,265 58<br />
* Concur Technologies, Inc. 2,241 73<br />
* CSG Systems<br />
International, Inc. 1,823 32<br />
CTS Corp. 1,758 10<br />
* CyberSource Corp. 3,624 43<br />
* Cymer, Inc. 1,546 34<br />
* Cypress Semiconductor<br />
Corp. 7,907 35<br />
Daktronics, Inc. 1,772 17<br />
* DealerTrack Holdings, Inc. 2,125 25<br />
* Digi International, Inc. 1,338 11<br />
* Diodes, Inc. 1,683 10<br />
* DSP Group, Inc. 1,447 12<br />
* Electro Scientific<br />
Industries, Inc. 1,410 10<br />
* EMS Technologies, Inc. 817 21<br />
* Epicor Software Corp. 3,107 15<br />
* EPIQ Systems, Inc. 1,852 31<br />
* Exar Corp. 2,228 15<br />
* FARO Technologies, Inc. 871 15<br />
* FEI Co. 1,917 36<br />
* Forrester Research, Inc. 806 23<br />
* Gerber Scientific, Inc. 1,244 6<br />
Gevity HR, Inc. 1,178 2<br />
* Harmonic, Inc. 4,943 28<br />
Heartland Payment<br />
Systems, Inc. 1,272 22<br />
Common Stocks (84.5%)<br />
Shares/ Value<br />
$ Par $ (000's)<br />
Information Technology continued<br />
* Hittite Microwave Corp. 1,001 29<br />
* Hutchinson Technology,<br />
Inc. 1,196 4<br />
* Informatica Corp. 4,643 64<br />
InfoSpace, Inc. 1,802 14<br />
* Insight Enterprises, Inc. 2,376 16<br />
* Integral Systems, Inc. 893 11<br />
* Intermec, Inc. 2,549 34<br />
* Interwoven, Inc. 2,404 30<br />
* Intevac, Inc. 1,137 6<br />
* Itron, Inc. 1,789 114<br />
* j2 Global<br />
Communications, Inc. 2,285 46<br />
* JDA Software Group, Inc. 1,419 19<br />
Keithley Insturments, Inc. 714 3<br />
* The Knot, Inc. 1,490 12<br />
* Kopin Corp. 3,533 7<br />
* Kulicke and Soffa<br />
Industries, Inc. 2,797 5<br />
* Littelfuse, Inc. 1,131 19<br />
* LoJack Corp. 905 4<br />
* Manhattan Associates, Inc. 1,279 20<br />
MAXIMUS, Inc. 973 34<br />
* Mercury Computer<br />
Systems, Inc. 1,186 7<br />
Methode Electronics, Inc. 1,986 13<br />
Micrel, Inc. 2,573 19<br />
* MICROS Systems, Inc. 4,209 69<br />
* Microsemi Corp. 4,136 52<br />
* MKS Instruments, Inc. 2,566 38<br />
MTS Systems Corp. 885 24<br />
* NETGEAR, Inc. 1,848 21<br />
* Network Equipment<br />
Technologies, Inc. 1,507 4<br />
* Newport Corp. 1,883 13<br />
* Novatel Wireless, Inc. 1,653 8<br />
Park Electrochemical<br />
Corp. 1,067 20<br />
PC-Tel, Inc. 1,001 7<br />
* Perficient, Inc. 1,678 8<br />
* Pericom Semiconductor<br />
Corp. 1,321 7<br />
* Phoenix Technologies,<br />
Ltd. 1,462 5<br />
* Plexus Corp. 2,047 35<br />
* Progress Software Corp. 2,147 41<br />
Quality Systems, Inc. 927 40<br />
* Radiant Systems, Inc. 1,436 5<br />
* RadiSys Corp. 1,179 6<br />
* Rogers Corp. 937 26<br />
* Rudolph Technologies,<br />
Inc. 1,598 6<br />
* ScanSource, Inc. 1,374 26<br />
* Skyworks Solutions, Inc. 8,603 48<br />
* Smith Micro Software,<br />
Inc. 1,452 8<br />
* Sonic Solutions 1,320 2<br />
* SPSS, Inc. 945 25<br />
* Standard Microsystems<br />
Corp. 1,161 19<br />
The Accompanying Notes are an Integral Part of the Financial Statements.<br />
60 Index 600 Stock Portfolio
Index 600 Stock Portfolio<br />
Common Stocks (84.5%)<br />
Shares/ Value<br />
$ Par $ (000's)<br />
Information Technology continued<br />
* StarTek, Inc. 573 3<br />
* Stratasys, Inc. 1,096 12<br />
* Supertex, Inc. 670 16<br />
* Symmetricom, Inc. 2,344 9<br />
* Synaptics, Inc. 1,757 29<br />
* SYNNEX Corp. 969 11<br />
* Take-Two Interactive<br />
Software, Inc. 4,048 31<br />
* Taleo Corp. - Class A 1,597 12<br />
Technitrol, Inc. 2,138 7<br />
* Tekelec 3,434 46<br />
* THQ, Inc. 3,481 15<br />
* Tollgrade<br />
Communications, Inc. 693 3<br />
* TriQuint Semiconductor,<br />
Inc. 7,548 26<br />
* TTM Technologies, Inc. 2,233 12<br />
* Tyler Technologies, Inc. 1,535 18<br />
* Ultratech, Inc. 1,225 15<br />
United Online, Inc. 4,237 26<br />
* Varian Semiconductor<br />
Equipment Associates,<br />
Inc. 3,788 69<br />
* Veeco Instruments, Inc. 1,678 11<br />
* ViaSat, Inc. 1,410 34<br />
* Websense, Inc. 2,350 35<br />
* Wright Express Corp. 2,024 25<br />
Total 2,715<br />
Materials (3.1%)<br />
A. Schulman, Inc. 1,380 23<br />
A.M. Castle & Co. 870 9<br />
AMCOL International<br />
Corp. 1,173 25<br />
Arch Chemicals, Inc. 1,297 34<br />
Balchem Corp. 948 24<br />
* Brush Engineered<br />
Materials, Inc. 1,064 13<br />
* Buckeye Technologies,<br />
Inc. 2,043 7<br />
* Calgon Carbon Corp. 2,820 43<br />
* Century Aluminum Co. 1,919 19<br />
* Clearwater Paper Corp. 572 5<br />
Deltic Timber Corp. 553 25<br />
Eagle Materials, Inc. 2,271 42<br />
Georgia Gulf Corp. 1,564 2<br />
H.B. Fuller Co. 2,526 41<br />
* Headwaters, Inc. 2,190 15<br />
Myers Industries, Inc. 1,470 12<br />
Neenah Paper, Inc. 761 7<br />
NewMarket Corp. 655 23<br />
Olympic Steel, Inc. 470 10<br />
Common Stocks (84.5%)<br />
Shares/ Value<br />
$ Par $ (000's)<br />
Materials continued<br />
* OM Group, Inc. 1,589 34<br />
Penford Corp. 587 6<br />
* PolyOne Corp. 4,867 15<br />
Quaker Chemical Corp. 554 9<br />
Rock-Tenn Co. - Class A 1,991 68<br />
* RTI International Metals,<br />
Inc. 1,200 17<br />
Schweitzer-Mauduit<br />
International, Inc. 817 16<br />
Stepan Co. 371 17<br />
Texas Industries, Inc. 1,436 50<br />
Wausau Paper Corp. 2,545 29<br />
Zep, Inc. 1,092 21<br />
Total 661<br />
Other Holdings (3.6%)<br />
iShares S&P SmallCap<br />
600 Index Fund 17,434 767<br />
Total 767<br />
Telecommunication Services (0.2%)<br />
FairPoint<br />
Communications, Inc. 4,643 15<br />
* General Communication,<br />
Inc. - Class A 2,303 19<br />
Total 34<br />
Utilities (4.5%)<br />
ALLETE, Inc. 1,357 44<br />
American States Water Co. 900 30<br />
Atmos Energy Corp. 4,727 112<br />
Avista Corp. 2,790 54<br />
Central Vermont Public<br />
Service Corp. 602 14<br />
CH Energy Group, Inc. 823 42<br />
Cleco Corp. 3,129 72<br />
* El Paso Electric Co. 2,338 42<br />
The Laclede Group, Inc. 1,146 54<br />
New Jersey Resources<br />
Corp. 2,192 86<br />
Northwest Natural Gas Co. 1,379 61<br />
Piedmont Natural Gas Co.,<br />
Inc. 3,822 121<br />
South Jersey Industries,<br />
Inc. 1,551 62<br />
Southwest Gas Corp. 2,271 57<br />
UIL Holdings Corp. 1,317 40<br />
Unisource Energy Corp. 1,851 54<br />
Total 945<br />
Total Common Stocks<br />
(Cost: $26,588) 17,885<br />
Short-Term Investments<br />
(3.3%)<br />
Shares/<br />
$ Par<br />
Value<br />
$ (000's)<br />
Federal Government & Agencies (3.3%)<br />
(k)Federal Home Loan Bank,<br />
0.38%, 1/15/09 700,000 700<br />
Total 700<br />
Total Short-Term Investments<br />
(Cost: $700) 700<br />
Total Investments (87.8%)<br />
(Cost: $27,288)(a) 18,585<br />
Other Assets, Less<br />
Liabilities (12.2%) 2,589<br />
Net Assets (100.0%) 21,174<br />
The Accompanying Notes are an Integral Part of the Financial Statements.<br />
Index 600 Stock Portfolio 61
Index 600 Stock Portfolio<br />
* Non-Income Producing<br />
(a)<br />
At December 31, 2008 the aggregate cost of securities for federal tax purposes (in thousands) was $27,599 and the net unrealized depreciation of<br />
investments based on that cost was $9,014 which is comprised of $333 aggregate gross unrealized appreciation and $9,347 aggregate gross unrealized<br />
depreciation.<br />
(j) Swap agreements outstanding on December 31, 2008<br />
Total Return Swaps<br />
CounterParty<br />
Reference<br />
Payment Made by<br />
the Fund<br />
JPMorgan Chase Bank S&P SmallCap 600 Index 1-Month USD<br />
LIBOR - 30 Basis<br />
Points<br />
Payment Received<br />
by the Fund<br />
S&P SmallCap<br />
600 Index Total<br />
Return<br />
Unrealized<br />
Appreciation/<br />
Expiration Date<br />
Notional Amount<br />
(000's)<br />
(Depreciation)<br />
(000's)<br />
5/09 3,336 $ 101<br />
(k) Securities with an aggregate value of $700 (in thousands) have been pledged as collateral for swap contracts outstanding on December 31, 2008<br />
62 Index 600 Stock Portfolio<br />
The Accompanying Notes are an Integral Part of the Financial Statements.
Small Cap Value Portfolio<br />
Objective: Portfolio Strategy: Net Assets:<br />
Long-term growth of capital.<br />
Invest primarily in small companies whose common $241 million<br />
stocks are believed to be undervalued.<br />
Portfolio Overview<br />
Mason Street Advisors, the investment adviser for the Small Cap Value Portfolio, has engaged T. Rowe Price Associates, Inc.<br />
to act as sub-adviser for the Portfolio. The Portfolio invests in the common stocks of companies that have market<br />
capitalizations in the range of the S&P SmallCap 600 ® Index and whose current stock prices do not appear to reflect their<br />
underlying value. Value is defined broadly, with consideration given to stock price relative to long-term growth prospects and<br />
business franchises, in addition to typical value measures such as assets, current earnings and cash flow. The major emphasis<br />
is on selection of individual stocks, with secondary consideration given to industry weightings in order to keep the Portfolio<br />
broadly diversified among economic sectors.<br />
Market Overview<br />
Financial markets endured a brutal 2008, which saw the failure of a number of leading financial institutions, credit markets<br />
freeze up and the U.S. government take a series of extraordinary steps to support the economy and financial system. The crisis<br />
was a result of the ongoing sub-prime mortgage meltdown, which spread rapidly through the domestic financial sector and into<br />
virtually every segment of global financial markets. For all of 2008, returns for large-, medium- and small-sized companies<br />
were –37.60%, –41.46% and –33.79%, as measured by the Russell 1000, Russell MidCap and Russell 2000 Stock Indices,<br />
respectively. No sector in the market provided positive returns, while value-oriented shares held up better than growth stocks,<br />
as measured by the Russell style indices.<br />
Portfolio Results<br />
For the twelve months ended December 31, 2008, the Small Cap Value Portfolio returned –28.13%. By comparison, the<br />
Russell 2000 Value Index returned –28.92%. (The Index is unmanaged, cannot be invested in directly and does not include<br />
administrative expenses or sales charges.) The Portfolio’s Small-Cap Value Funds peer group had an average return of<br />
–32.92%, according to Lipper Analytical Services, Inc., an independent mutual fund ranking agency.<br />
The Portfolio’s absolute return reflected the unprecedented turmoil affecting the economy and financial markets in what was<br />
the worst year for stocks since the Great Depression. However, the Portfolio outperformed the Russell 2000 Value Index for<br />
the twelve-month period. The Consumer Discretionary, Health Care and Industrials and Business Services sectors contributed<br />
the most to the Portfolio’s outperformance of the Index. Financials and Energy were the notable detractors.<br />
The Consumer Discretionary sector was by far the largest contributor to results versus the Index. Two companies stood out as<br />
top performers—Aaron Rents and Corinthian Colleges. Aaron Rents thrived despite economic weakness as consumers unable<br />
to buy goods on credit turned to renting big-ticket items like home furnishings. Corinthian Colleges, a post-secondary<br />
education provider, benefited from increased enrollment as rising unemployment prompted workers to return to school seeking<br />
to bolster their résumés.<br />
Results relative to the Index in Health Care and Industrials were more subdued but still significant sources of outperformance.<br />
In Health Care, the Portfolio benefited from our selection of holdings. Two biotechnology investments were top contributors—<br />
Myriad Genetics and Landauer. Myriad Genetics’ announcement that it would spin off its drug development business was<br />
viewed favorably by investors. Landauer, a provider of analytical services, was helped by an increase in international business.<br />
In Industrials, the Portfolio was aided by a significantly overweight position and stock selection. Beacon Roofing Supply, a<br />
distributor of roofing materials, and Genesee & Wyoming, an operator of regional freight railroads, were standout performers.<br />
An underweight position and stock selection in the Financials sector hampered results versus the Index. SVB Financial Group,<br />
a regional bank with little exposure to housing debt, had been holding up well but began to struggle as the credit crisis spread<br />
throughout the economy. Two other notable detractors were hotel real estate investment trusts (REITs) that faced challenges<br />
including a difficult real estate market, muted consumer spending, and investors’ diminished confidence in real estate values.<br />
By year-end, oil prices had dropped precipitously from the historic high reached during the summer and the Energy sector of<br />
the Index ended the year down nearly 50%. In such an environment, the Portfolio’s overweight position was unfavorable and<br />
detracted from relative performance.<br />
Outlook<br />
While remaining aware of the substantial challenges that exist for the financial system and the U.S. economy and the<br />
headwinds they have created for corporate profits, we are optimistic on two fronts. First, we believe the steep drop in stock<br />
prices has provided rare opportunities to invest in strong companies at value prices. Second, we feel confident that policy<br />
Small Cap Value Portfolio 63
Small Cap Value Portfolio<br />
actions taken by world governments will help avert worst-case scenarios for the global economy. We expect the U.S. economy<br />
to bottom out in the latter half of 2009 and proceed to expand in 2010.<br />
Relative Performance<br />
$25,000<br />
20,000<br />
15,000<br />
10,000<br />
5,000<br />
0<br />
7/01 12/01 12/02 12/03 12/04 12/05 12/06 12/07 12/08<br />
Top 10 Equity Holdings 12/31/08<br />
Security Description<br />
% of Net Assets<br />
Landstar System, Inc. 2.2%<br />
Aaron Rents, Inc. 2.1%<br />
ProAssurance Corp. 2.0%<br />
Owens & Minor, Inc. 1.8%<br />
AptarGroup, Inc. 1.5%<br />
Matthews International Corp. - Class A 1.4%<br />
FTI Consulting, Inc. 1.4%<br />
Beacon Roofing Supply, Inc. 1.4%<br />
Genesee & Wyoming, Inc. - Class A 1.3%<br />
Penn Virginia Corp. 1.3%<br />
Small Cap Value Portfolio<br />
Russell 2000 Value Index<br />
Average <strong>Annual</strong> Total Returns<br />
For Periods Ended December 31, 2008<br />
1 Year 5 Years<br />
Since<br />
Inception*<br />
Small Cap Value Portfolio<br />
Russell 2000 Value Index<br />
-28.13%<br />
-28.92%<br />
2.10%<br />
0.27%<br />
5.04%<br />
4.19%<br />
Lipper Variable Insurance Products<br />
(VIP) Small Cap Value Funds<br />
Average -32.92% -0.21% –<br />
*Inception date of 7/31/01<br />
The performance data quoted represents past<br />
performance. Past performance is historical and does<br />
not guarantee future performance. Investment return<br />
and principal value will fluctuate, so that shares, when<br />
redeemed, may be worth more or less than their original<br />
cost. Current performance may be lower or higher than<br />
the performance data quoted. For the most recent<br />
month-end performance information visit<br />
www.nmfn.com.<br />
This chart assumes an initial investment of $10,000<br />
made on 7/31/01 (commencement of the Portfolio's<br />
operations). Returns shown reflect fee waivers,<br />
deductions for management and other portfolio<br />
expenses, and reinvestment of all dividends. In the<br />
absence of fee waivers, total return would be reduced.<br />
Returns exclude deductions for separte account sale<br />
loads and account fees. Please refer to the Benchmark<br />
Definitions section of this report for information about<br />
the indices cited in the above chart and graph.<br />
Consumer Staples<br />
3%<br />
Other Holdings<br />
4%<br />
Energy<br />
4%<br />
Utilities<br />
5%<br />
Health Care<br />
8%<br />
Materials<br />
9%<br />
Information Technology<br />
10%<br />
Sector Allocation 12/31/08<br />
Short-Term Investments<br />
& Other Net Assets<br />
1%<br />
Telecommunication Services<br />
1%<br />
Industrials<br />
24%<br />
Financials<br />
19%<br />
Consumer<br />
Discretionary<br />
12%<br />
Sector Allocation is based on Net Assets.<br />
Sector Allocation and Top 10 Holdings are subject to<br />
change.<br />
Stocks of smaller or newer companies, such as those<br />
held in this Portfolio, are more likely to realize more<br />
substantial growth as well as suffer more significant<br />
losses than larger or more established issuers.<br />
Investments in such companies can be both more<br />
volatile and more speculative. Investing in small<br />
company stocks involves a greater degree of risk than<br />
investing in medium or large company stocks.<br />
64 Small Cap Value Portfolio
Small Cap Value Portfolio<br />
<strong>Northwestern</strong> <strong>Mutual</strong> Series Fund, Inc.<br />
Schedule of Investments<br />
December 31, 2008<br />
Common Stocks (96.2%)<br />
Shares/<br />
$ Par<br />
Consumer Discretionary (11.8%)<br />
Value<br />
$ (000's)<br />
Aaron Rents, Inc. 186,100 4,954<br />
Aaron Rents, Inc. - Class A 4,725 104<br />
* Ascent Media Corp. -<br />
Class A 34,650 757<br />
* Bed Bath & Beyond, Inc. 7,300 186<br />
Cablevision Systems Corp.<br />
- Class A 600 10<br />
* Career Education Corp. 22,100 396<br />
* CarMax, Inc. 3,700 29<br />
* Corinthian Colleges, Inc. 127,000 2,079<br />
* Cox Radio, Inc. - Class A 3,600 22<br />
CSS Industries, Inc. 55,400 983<br />
* Culp, Inc. 54,800 108<br />
* Discovery<br />
Communications, Inc. 8,400 115<br />
* DISH Network Corp. -<br />
Class A 15,300 170<br />
* Drew Industries, Inc. 102,900 1,235<br />
* Expedia, Inc. 9,200 76<br />
Family Dollar Stores, Inc. 3,700 96<br />
Fortune Brands, Inc. 10,500 433<br />
Fred's, Inc. - Class A 100,400 1,080<br />
The Gap, Inc. 34,800 466<br />
Harman International<br />
Industries, Inc. 1,500 25<br />
Haverty Furniture<br />
Companies, Inc. 128,000 1,194<br />
* Live Nation, Inc. 34,300 197<br />
M/I Homes, Inc. 60,000 632<br />
* MarineMax, Inc. 83,900 284<br />
Mattel, Inc. 33,600 538<br />
Matthews International<br />
Corp. - Class A 92,200 3,382<br />
The Men's Wearhouse, Inc. 81,500 1,103<br />
Meredith Corp. 20,900 358<br />
* Meritage Homes Corp. 99,000 1,205<br />
Orient-Express Hotels, Ltd.<br />
- Class A 129,400 991<br />
Pool Corp. 87,625 1,575<br />
* Saga Communications, Inc.<br />
- Class A 103,700 171<br />
Scholastic Corp. 18,600 253<br />
Scripps Networks<br />
Interactive - Class A 6,100 134<br />
Stanley Furniture Co., Inc. 75,200 596<br />
* The Steak n Shake Co. 83,400 496<br />
Stein Mart, Inc. 184,300 208<br />
Tiffany & Co. 1,600 38<br />
* Time Warner Cable, Inc. -<br />
Class A 6,000 129<br />
The TJX Companies, Inc. 5,100 105<br />
* TRW Automotive Holdings<br />
Corp. 20,300 73<br />
* Viacom, Inc. - Class B 4,300 82<br />
Common Stocks (96.2%)<br />
Shares/ Value<br />
$ Par $ (000's)<br />
Consumer Discretionary continued<br />
The Washington Post Co. -<br />
Class B 350 137<br />
Weight Watchers<br />
International, Inc. 9,985 294<br />
Winnebago Industries, Inc. 137,400 828<br />
Total 28,327<br />
Consumer Staples (3.0%)<br />
Alberto-Culver Co. 13,900 341<br />
* Alliance One International,<br />
Inc. 249,400 733<br />
Brown-Forman Corp. -<br />
Class B 2,000 103<br />
Casey's General Stores, Inc. 61,500 1,400<br />
Coca-Cola Enterprises, Inc. 38,000 457<br />
ConAgra Foods, Inc. 15,400 254<br />
The Hershey Co. 15,000 521<br />
Hormel Foods Corp. 1,200 37<br />
The J.M. Smucker Co. 2,800 122<br />
McCormick & Co., Inc. 3,000 96<br />
Nash Finch Co. 46,900 2,105<br />
Sara Lee Corp. 10,200 100<br />
Sysco Corp. 18,300 420<br />
Tootsie Roll Industries, Inc. 5,173 133<br />
* Winn-Dixie Stores, Inc. 16,100 259<br />
Total 7,081<br />
Energy (4.7%)<br />
* Atwood Oceanics, Inc. 32,800 501<br />
Baker Hughes, Inc. 6,900 221<br />
BJ Services Co. 25,000 292<br />
CARBO Ceramics, Inc. 34,300 1,219<br />
Cimarex Energy Co. 11,500 308<br />
* Compton Petroleum Corp. 7,900 6<br />
* Forest Oil Corp. 56,650 934<br />
* GeoMet, Inc. 65,000 112<br />
* Hercules Offshore, Inc. 60,489 287<br />
* Mariner Energy, Inc. 65,793 671<br />
Murphy Oil Corp. 11,400 506<br />
Nexen, Inc. 27,400 482<br />
Penn Virginia Corp. 117,500 3,053<br />
Petro-Canada 12,800 280<br />
* TETRA Technologies, Inc. 170,200 827<br />
* Union Drilling, Inc. 32,600 169<br />
* Whiting Petroleum Corp. 44,700 1,496<br />
Total 11,364<br />
Financials (19.6%)<br />
The Allstate Corp. 4,300 141<br />
Ares Capital Corp. 193,600 1,225<br />
Axis Capital Holdings, Ltd. 11,700 341<br />
Cedar Shopping Centers,<br />
Inc. 130,000 920<br />
Cincinnati Financial Corp. 13,800 401<br />
Common Stocks (96.2%)<br />
Shares/ Value<br />
$ Par $ (000's)<br />
Financials continued<br />
Commerce Bancshares, Inc. 11,265 495<br />
Compass Diversified<br />
Holdings 91,300 1,027<br />
Discover Financial Services 39,700 378<br />
East West Bancorp, Inc. 133,942 2,139<br />
Employers Holdings, Inc. 45,100 744<br />
First American Corp. 7,700 222<br />
First Horizon National<br />
Corp. 3,835 41<br />
First Niagara Financial<br />
Group, Inc. 27,300 441<br />
First Potomac Realty Trust 101,800 947<br />
Glacier Bancorp, Inc. 112,000 2,130<br />
Hatteras Financial Corp. 67,000 1,782<br />
Hercules Technology<br />
Growth Capital, Inc. 132,200 1,047<br />
Home BancShares, Inc. 77,064 2,077<br />
Janus Capital Group, Inc. 33,100 266<br />
JMP Group, Inc. 79,100 439<br />
Kilroy Realty Corp. 70,400 2,356<br />
Kohlberg Capital Corp. 142,950 520<br />
LaSalle Hotel Properties 81,000 895<br />
Legg Mason, Inc. 1,400 31<br />
*Markel Corp. 5,100 1,525<br />
Marsh & McLennan<br />
Companies, Inc. 14,800 359<br />
Max Capital Group, Ltd. 104,700 1,853<br />
Montpelier Re Holdings,<br />
Ltd. 9,600 161<br />
National Interstate Corp. 76,600 1,369<br />
Northern Trust Corp. 7,800 407<br />
OneBeacon Insurance<br />
Group, Ltd. 10,600 111<br />
Parkway Properties, Inc. 45,400 817<br />
*Piper Jaffray Companies,<br />
Inc. 30,600 1,217<br />
Potlatch Corp. 69,800 1,815<br />
*ProAssurance Corp. 92,200 4,866<br />
The Progressive Corp. 24,000 355<br />
Prudential Financial, Inc. 2,700 82<br />
Redwood Trust, Inc. 57,600 859<br />
*Signature Bank 43,000 1,234<br />
*The St. Joe Co. 12,200 297<br />
*Stifel Financial Corp. 51,900 2,380<br />
Strategic Hotels & Resorts,<br />
Inc. 114,000 192<br />
*SVB Financial Group 84,200 2,209<br />
The Travelers Companies,<br />
Inc. 4,330 196<br />
Valley National Bancorp 10,277 208<br />
Washington Real Estate<br />
Investment Trust 61,500 1,740<br />
Westamerica<br />
Bancorporation 4,600 235<br />
The Accompanying Notes are an Integral Part of the Financial Statements<br />
Small Cap Value Portfolio 65
Small Cap Value Portfolio<br />
Common Stocks (96.2%)<br />
Shares/ Value<br />
$ Par $ (000's)<br />
Financials continued<br />
Willis Group Holdings,<br />
Ltd. 9,100 226<br />
Wilmington Trust Corp. 11,100 247<br />
Wintrust Financial Corp. 64,500 1,327<br />
Total 47,292<br />
Health Care (7.9%)<br />
Analogic Corp. 23,700 647<br />
* AngioDynamics, Inc. 59,700 817<br />
* Biogen Idec, Inc. 1,700 81<br />
* Boston Scientific Corp. 44,700 346<br />
CIGNA Corp. 10,300 174<br />
* Exelixis, Inc. 117,300 589<br />
HEALTHSOUTH Corp. 30,060 329<br />
Landauer, Inc. 28,100 2,060<br />
* Lincare Holdings, Inc. 13,400 361<br />
* Myriad Genetics, Inc. 41,100 2,723<br />
National Healthcare Corp. 48,600 2,461<br />
* OSI Pharmaceuticals, Inc. 1,500 59<br />
Owens & Minor, Inc. 112,100 4,221<br />
* Sepracor, Inc. 10,700 118<br />
* St. Jude Medical, Inc. 4,500 148<br />
* Triple-S Management<br />
Corp. - Class B 32,300 371<br />
* Universal American<br />
Financial Corp. 65,700 579<br />
* Valeant Pharmaceuticals<br />
International 3,400 78<br />
* Waters Corp. 2,900 106<br />
West Pharmaceutical<br />
Services, Inc. 68,000 2,568<br />
* Zimmer Holdings, Inc. 3,500 141<br />
Total 18,977<br />
Industrials (23.9%)<br />
* Accuride Corp. 106,400 25<br />
* Alaska Air Group, Inc. 79,800 2,334<br />
Ameron International Corp. 34,100 2,146<br />
* Astec Industries, Inc. 33,800 1,059<br />
* Beacon Roofing Supply,<br />
Inc. 233,700 3,244<br />
Belden, Inc. 80,700 1,685<br />
* C&D Technologies, Inc. 93,000 291<br />
Cascade Corp. 38,400 1,147<br />
* Casella Waste Systems,<br />
Inc. - Class A 35,000 143<br />
Cintas Corp. 6,200 144<br />
CIRCOR International, Inc. 46,600 1,282<br />
Comfort Systems USA, Inc. 83,100 886<br />
* Dollar Thrifty Automotive<br />
Group, Inc. 87,400 95<br />
Dover Corp. 3,200 105<br />
Equifax, Inc. 4,700 125<br />
Franklin Electric Co., Inc. 21,100 593<br />
* FTI Consulting, Inc. 75,300 3,364<br />
G & K Services, Inc. -<br />
Class A 67,600 1,367<br />
* Genesee & Wyoming, Inc. -<br />
Class A 102,900 3,138<br />
Gibraltar Industries, Inc. 103,800 1,239<br />
Common Stocks (96.2%)<br />
Shares/ Value<br />
$ Par $ (000's)<br />
Industrials continued<br />
IDEX Corp. 98,800 2,386<br />
* Insituform Technologies,<br />
Inc. - Class A 122,900 2,420<br />
* Kirby Corp. 103,000 2,818<br />
* Kratos Defense & Security<br />
Solutions, Inc. 265,000 371<br />
Landstar System, Inc. 138,300 5,315<br />
Manpower, Inc. 10,100 343<br />
McGrath Rentcorp 122,000 2,606<br />
* MPS Group, Inc. 250,500 1,886<br />
* Navigant Consulting, Inc. 139,200 2,209<br />
Nordson Corp. 70,700 2,283<br />
Raytheon Co. 700 36<br />
Rockwell Collins, Inc. 900 35<br />
Southwest Airlines Co. 60,100 518<br />
* Sterling Construction Co.,<br />
Inc. 47,500 881<br />
Universal Forest Products,<br />
Inc. 56,300 1,515<br />
UTI Worldwide, Inc. 131,120 1,880<br />
* Waste Connections, Inc. 83,000 2,620<br />
Woodward Governor Co. 127,500 2,935<br />
Total 57,469<br />
Information Technology (9.7%)<br />
* Advanced Energy<br />
Industries, Inc. 121,400 1,208<br />
ASML Holding NV 6,100 110<br />
* ATMI, Inc. 57,300 884<br />
Automatic Data Processing,<br />
Inc. 2,600 102<br />
AVX Corp. 28,100 223<br />
* Brooks Automation, Inc. 144,487 840<br />
* Cabot Microelectronics<br />
Corp. 27,600 720<br />
Electro Rent Corp. 139,200 1,554<br />
* Electronic Arts, Inc. 11,800 189<br />
* Exar Corp. 134,700 898<br />
* Fairchild Semiconductor<br />
International, Inc. 27,900 136<br />
* Formfactor, Inc. 75,000 1,095<br />
* GSI Group, Inc. 191,800 110<br />
* Ixia 153,000 884<br />
* Littelfuse, Inc. 58,400 969<br />
Methode Electronics, Inc. 36,800 248<br />
Molex, Inc. - Class A 25,500 330<br />
Motorola, Inc. 47,500 210<br />
* Newport Corp. 76,200 517<br />
* Novellus Systems, Inc. 28,500 352<br />
* Palm, Inc. 204,000 626<br />
* Progress Software Corp. 102,500 1,974<br />
Seagate Technology 20,800 92<br />
* Sonus Networks, Inc. 407,100 643<br />
* SPSS, Inc. 75,925 2,047<br />
* StarTek, Inc. 107,800 480<br />
* Symyx Technologies, Inc. 99,500 591<br />
* SYNNEX Corp. 63,800 723<br />
* Synopsys, Inc. 4,200 78<br />
* Teradyne, Inc. 27,900 118<br />
Total System Services, Inc. 22,752 319<br />
Common Stocks (96.2%)<br />
Shares/ Value<br />
$ Par $ (000's)<br />
Information Technology continued<br />
Tyco Electronics, Ltd. 16,400 266<br />
*Websense, Inc. 94,100 1,409<br />
*Wind River Systems, Inc. 241,800 2,184<br />
Xilinx, Inc. 3,500 62<br />
*Xyratex, Ltd. 84,100 248<br />
Total 23,439<br />
Materials (8.8%)<br />
Airgas, Inc. 72,900 2,842<br />
Alcoa, Inc. 26,100 294<br />
AMCOL International<br />
Corp. 41,900 878<br />
American Vanguard Corp. 105,300 1,232<br />
AngloGold Ashanti, Ltd.,<br />
ADR 9,100 252<br />
AptarGroup, Inc. 104,000 3,665<br />
Arch Chemicals, Inc. 76,000 1,981<br />
Carpenter Technology<br />
Corp. 67,000 1,376<br />
*Clearwater Paper Corp. 34,999 294<br />
Deltic Timber Corp. 46,700 2,136<br />
*Domtar Corp. 43,600 73<br />
Freeport-McMoRan Copper<br />
& Gold, Inc. 5,600 137<br />
Innospec, Inc. 108,300 638<br />
International Flavors &<br />
Fragrances, Inc. 6,100 181<br />
International Paper Co. 15,000 177<br />
Myers Industries, Inc. 157,100 1,257<br />
Nalco Holding Co. 16,600 192<br />
Sims Group, Ltd., ADR 128,440 1,595<br />
Wausau Paper Corp. 150,000 1,716<br />
Weyerhaeuser Co. 10,900 334<br />
Total 21,250<br />
Other Holdings (1.1%)<br />
Central Fund of Canada,<br />
Ltd. - Class A 73,900 829<br />
First Opportunity Fund,<br />
Inc. 138,600 706<br />
iShares Russell 2000 Value<br />
Index 23,700 1,165<br />
Total 2,700<br />
Telecommunication Services (0.8%)<br />
*Premiere Global Services,<br />
Inc. 182,400 1,570<br />
Telephone and Data<br />
Systems, Inc. 3,200 102<br />
Telephone and Data<br />
Systems, Inc. - Special<br />
Shares 8,500 239<br />
Total 1,911<br />
Utilities (4.9%)<br />
Ameren Corp. 5,700 190<br />
Black Hills Corp. 70,667 1,905<br />
Cleco Corp. 96,800 2,210<br />
Constellation Energy<br />
Group, Inc. 200 5<br />
The Accompanying Notes are an Integral Part of the Financial Statements.<br />
66 Small Cap Value Portfolio
Small Cap Value Portfolio<br />
Common Stocks (96.2%)<br />
Shares/ Value<br />
$ Par $ (000's)<br />
Utilities continued<br />
Duke Energy Corp. 9,500 143<br />
* Dynegy, Inc. - Class A 13,900 28<br />
* El Paso Electric Co. 93,400 1,690<br />
The Empire District<br />
Electric Co. 55,400 975<br />
* Mirant Corp. 30,800 581<br />
NiSource, Inc. 36,900 405<br />
* NRG Energy, Inc. 12,300 287<br />
Pinnacle West Capital<br />
Corp. 14,700 472<br />
PNM Resources, Inc. 13,600 137<br />
Southwest Gas Corp. 64,600 1,629<br />
TECO Energy, Inc. 2,800 34<br />
Vectren Corp. 44,100 1,103<br />
Total 11,794<br />
Total Common Stocks<br />
(Cost: $288,633) 231,604<br />
Preferred Stocks (0.6%)<br />
Federal Savings Institutions (0.6%)<br />
East West Bancorp, Inc.,<br />
8.00%, 12/31/49 1,359 1,464<br />
Total 1,464<br />
Total Preferred Stocks<br />
(Cost: $1,348) 1,464<br />
Short-Term Investments<br />
(2.7%)<br />
Other Holdings (2.7%)<br />
Shares/<br />
$ Par<br />
Value<br />
$ (000's)<br />
T. Rowe Price Reserve<br />
Investment Fund 6,437,646 6,438<br />
Total 6,438<br />
Total Short-Term Investments<br />
(Cost: $6,438) 6,438<br />
Total Investments (99.9%)<br />
(Cost: $297,683)(a) 240,508<br />
Other Assets, Less<br />
Liabilities (0.1%) 309<br />
Net Assets (100.0%) 240,817<br />
* Non-Income Producing<br />
(a)<br />
ADR after the name of a security represents<br />
—American Depositary Receipt.<br />
At December 31, 2008 the aggregate cost of<br />
securities for federal tax purposes (in<br />
thousands) was $297,931 and the net<br />
unrealized depreciation of investments based<br />
on that cost was $57,423 which is comprised<br />
of $25,216 aggregate gross unrealized<br />
appreciation and $82,639 aggregate gross<br />
unrealized depreciation.<br />
Convertible Corporate Bonds (0.4%)<br />
Advertising Agencies (0.0%)<br />
Omnicom Group, Inc.,<br />
0.00%, 2/7/31 82,000 81<br />
Total 81<br />
Finance Services (0.1%)<br />
Prudential Financial, Inc.,<br />
.366%, 12/15/37 213,000 201<br />
Total 201<br />
Industrials (0.1%)<br />
Allied Waste Industries,<br />
Inc., 4.25%, 4/15/34 161,000 144<br />
Total 144<br />
Metals/Mining (0.1%)<br />
Newmont Mining Corp.,<br />
1.625%, 7/15/17 298,000 317<br />
Total 317<br />
Telephone and Telegraph Apparatus (0.1%)<br />
Lucent Technologies,<br />
2.75%, 6/15/25 555,000 259<br />
Total 259<br />
Total Convertible Corporate<br />
Bonds<br />
(Cost: $1,264) 1,002<br />
The Accompanying Notes are an Integral Part of the Financial Statements.<br />
Small Cap Value Portfolio 67
International Growth Portfolio<br />
Objective: Portfolio Strategy: Net Assets:<br />
Long-term growth of capital.<br />
Invest primarily in securities of issuers from countries $197 million<br />
outside the U.S. that have above-average growth potential.<br />
Portfolio Overview<br />
Mason Street Advisors acts as the investment adviser for the International Growth Portfolio. The Portfolio seeks long-term<br />
capital appreciation. The Portfolio seeks to achieve this objective by investing primarily in common stocks of companies that<br />
are headquartered or trade primarily in markets outside the United States and that are expected to grow more rapidly than<br />
market averages. The investments comprising the Portfolio are chosen individually, reflecting the managers’ assessment of<br />
their attractiveness. Equities purchased will possess, in the managers’ judgment, a combination of solid fundamentals,<br />
attractive valuation, and positive technical evaluation. The Portfolio can invest in any foreign country, developed or<br />
undeveloped, and its investments may include small, medium and large capitalization issues.<br />
Market Overview<br />
Global financial markets endured a brutal 2008, which saw the failure of a number of leading financial institutions, credit<br />
markets freeze up, and governments around the world take a series of coordinated actions to support economic growth and the<br />
financial system itself. The crisis was a result of the sub-prime mortgage meltdown, which spread rapidly through the financial<br />
sector into virtually every segment of global financial markets.<br />
For the full year, the S&P Global ex-U.S. LargeMidCap Index tumbled -44.91%. There was little differentiation of return by<br />
growth or value styles. Looking at performance by sector, no segment had positive results. Financials performed worst, while<br />
the more traditionally defensive Health Care sector held up best. After a bumpy ride for much of the year, the dollar finished<br />
higher because of the turmoil, as investors sought a safe haven for their money. The exception was Japan, whose currency and<br />
stock market held up the best among the developed economies.<br />
Portfolio Results<br />
For the twelve months ended December 31, 2008, the International Growth Portfolio returned –46.19%, while the S&P Global<br />
ex-U.S. LargeMidCap Index returned –44.91%. (The Index is unmanaged, cannot be invested in directly, and does not include<br />
administrative expenses or sales charges.) The average return for the Portfolio’s peer group, International Growth Funds, was<br />
–46.61%, according to Lipper Analytical Services, Inc., an independent mutual fund rating agency.<br />
The Portfolio’s absolute return reflected the unprecedented turmoil affecting the economy and financial markets in what was<br />
the most trying year for investors in memory. In that environment, no sector contributed positively to results. Relative to the<br />
Index, our positioning and stock selection in Asia detracted, as did stock selection in Japan and Europe. The largest<br />
contribution came from positioning in the Financials and Materials sectors.<br />
At a regional level, our stock selection in Japan and developing Asian markets detracted most, led by exposure to Chinese<br />
media business Focus Media Holdings, the number two overall detractor for the year. Poor execution and acquisitions weighed<br />
on the stock, as did slumping advertising and licensing revenues. In Japan, a key detractor was Industrial firm Mitsubishi,<br />
which saw business slow along with the economy.<br />
In Europe, the main source of weakness was our positioning in the Health Care sector. We were overweight in the medical<br />
technology industry at the expense of being underweight pharmaceuticals. In particular, we were underrepresented in some of<br />
the big pharmaceutical companies such as GlaxoSmithKline, AstraZeneca and Sanofi-Aventis because we were concerned<br />
about generic competition, patent expiries and the quality of their new drug pipelines. But that positioning detracted in 2008,<br />
because many investors viewed these large, liquid, defensive-oriented names as safe-haven plays.<br />
However, Europe was also home to a number of the leading contributors to relative results, as stock selection worked best in<br />
Materials and Financials shares. In Materials, the key contribution came from agricultural chemical firms K+S and Syngenta.<br />
These companies benefited from the overarching trend toward rising global population and living standards, creating demand<br />
for fertilizers, seeds and other agricultural products needed to boost crop yield and quality.<br />
In Financials, the Portfolio benefited from stock selection and an underweight position in the poorest-performing sector in the<br />
benchmark. Among positive contributors, it helped to avoid Royal Bank of Scotland, which struggled with credit losses, and to<br />
hold a stake in Reinet Investments, a spin-off that we sold at a good valuation.<br />
Outlook<br />
We have a cautious outlook that revolves around three themes: vigilance, volatility and valuation. While we believe it will take<br />
time to work through the issues confronting the global economy, the markets often anticipate the turn. As a result, we will be<br />
vigilant for signs of any fundamental improvement. But until the economy bottoms and investor sentiment improves, we<br />
68 International Growth Portfolio
International Growth Portfolio<br />
expect market volatility to continue. This argues for defensive positioning in the near term. Finally, one positive result of all<br />
the turmoil in the market is that we see high quality companies trading at valuations we believe are very compelling. We are<br />
using this opportunity to buy companies with strong brands, balance sheets and earnings power at discounted prices.<br />
$25,000<br />
20,000<br />
15,000<br />
10,000<br />
5,000<br />
Relative Performance<br />
0<br />
7/01 12/01 12/02 12/03 12/04 12/05 12/06 12/07 12/08<br />
International Growth Portfolio<br />
S&P Global ex-US LargeMidCap Index**<br />
Average <strong>Annual</strong> Total Returns<br />
For Periods Ended December 31, 2008<br />
1 Year 5 Years<br />
Since<br />
Inception*<br />
International Growth Portfolio -46.19% 1.10% 2.09%<br />
S&P Global ex-US LargeMidCap<br />
Index** -44.91% 3.03% 3.87%<br />
Lipper Variable Insurance Products<br />
(VIP) International Growth Funds<br />
Average -46.61% 1.88% –<br />
*Inception date of 7/31/01<br />
** Prior to October 1, 2008, the S&P Global ex-US LargeMidCap<br />
Index was known as the S&P/Citigroup PMI Global ex-US Index.<br />
The performance data quoted represents past<br />
performance. Past performance is historical and does<br />
not guarantee future performance. Investment return<br />
and principal value will fluctuate, so that shares, when<br />
redeemed, may be worth more or less than their original<br />
cost. Current performance may be lower or higher than<br />
the performance data quoted. For the most recent<br />
month-end performance information visit<br />
www.nmfn.com.<br />
This chart assumes an initial investment of $10,000<br />
made on 7/31/01 (commencement of the Portfolio's<br />
operations). Returns shown reflect fee waivers,<br />
deductions for management and other portfolio<br />
expenses, and reinvestment of all dividends. In the<br />
absence of fee waivers, total return would be reduced.<br />
Returns exclude deductions for separte account sale<br />
loads and account fees. Please refer to the Benchmark<br />
Definitions section of this report for information about<br />
the indices cited in the above chart and graph.<br />
Investors should be aware of the risks of investments in<br />
foreign securities, particularly investments in securities<br />
of companies in developing nations. These include the<br />
risks of currency fluctuation, of political and economic<br />
instability and of less well-developed government<br />
supervision and regulation of business and industry<br />
practices, as well as differences in accounting<br />
standards.<br />
The Portfolio may use derivative instruments for hedging<br />
purposes as part of its investment strategy. Use of these<br />
instruments may involve certain costs and risks such as<br />
liquidity risk, interest rate risk, market risk, credit risk,<br />
management risk and the risk that the Portfolio could<br />
not close out a position when it would be most<br />
advantageous to do so. Portfolios investing in<br />
derivatives could lose more than the principal amount<br />
invested in those instruments.<br />
Top 10 Equity Holdings 12/31/08<br />
Security Description<br />
% of Net Assets<br />
Nestle SA 1.9%<br />
Roche Holding AG 1.7%<br />
Novartis AG 1.7%<br />
BP PLC 1.7%<br />
Royal Dutch Shell PLC - Class A 1.6%<br />
Telefonica SA 1.5%<br />
Teva Pharmaceutical Industries, Ltd., ADR 1.5%<br />
GDF Suez 1.4%<br />
Eni SPA 1.4%<br />
Zurich Financial Services AG 1.3%<br />
Consumer Discretionary<br />
5%<br />
Utilities<br />
6%<br />
Materials<br />
7%<br />
Telecommunication<br />
Services<br />
8%<br />
Industrials<br />
8%<br />
Health Care<br />
9%<br />
Sector Allocation 12/31/08<br />
Information Technology<br />
4%<br />
Other Holdings<br />
3%<br />
Financials<br />
18%<br />
Short-Term<br />
Investments &<br />
Other Net<br />
Assets<br />
13%<br />
Consumer<br />
Staples<br />
10%<br />
Energy<br />
9%<br />
Sector Allocation is based on Net Assets.<br />
Sector Allocation and Top 10 Holdings are subject to<br />
change.<br />
International Growth Portfolio 69
International Growth Portfolio<br />
<strong>Northwestern</strong> <strong>Mutual</strong> Series Fund, Inc.<br />
Schedule of Investments<br />
December 31, 2008<br />
Foreign Common Stocks<br />
(87.5%) Country<br />
Shares/<br />
$ Par<br />
Value<br />
$ (000's)<br />
Foreign Common Stocks<br />
(87.5%) Country<br />
Shares/<br />
$ Par<br />
Value<br />
$ (000's)<br />
Consumer Discretionary (4.8%)<br />
Bridgestone Corp. Japan 14,700 221<br />
* Compass Group PLC United Kingdom 263,970 1,330<br />
Denso Corp. Japan 15,300 254<br />
Fast Retailing Co., Ltd. Japan 800 117<br />
Grupo Televisa SA, ADR Mexico 93,730 1,400<br />
Hennes & Mauritz AB - B<br />
Shares Sweden 28,330 1,119<br />
Honda Motor Co., Ltd. Japan 23,300 505<br />
Kingfisher PLC United Kingdom 296,865 589<br />
Next PLC United Kingdom 26,010 413<br />
Oriental Land Co., Ltd. Japan 2,400 197<br />
Panasonic Corp. Japan 31,000 388<br />
Reed Elsevier PLC United Kingdom 39,380 291<br />
Sekisui House, Ltd. Japan 15,000 131<br />
Toyota Industries Corp. Japan 9,600 206<br />
Vivendi France 59,330 1,941<br />
Yamada Denki Co., Ltd. Japan 2,570 178<br />
Yamaha Motor Co., Ltd. Japan 18,400 193<br />
Total 9,473<br />
Consumer Staples (9.8%)<br />
Aeon Co., Ltd. Japan 20,800 208<br />
Ajinomoto Co., Inc. Japan 16,000 174<br />
Asahi Breweries, Ltd. Japan 10,300 177<br />
British American Tobacco<br />
PLC United Kingdom 34,005 897<br />
Cadbury PLC United Kingdom 35,895 319<br />
Imperial Tobacco Group PLC United Kingdom 31,905 865<br />
ITC, Ltd. India 111,891 398<br />
Japan Tobacco, Inc. Japan 75 248<br />
Kao Corp. Japan 8,000 242<br />
Kerry Group PLC - Class A Ireland 41,801 766<br />
Kirin Holdings Co., Ltd. Japan 18,000 237<br />
Koninklijke Ahold NV Netherlands 53,555 662<br />
* KT&G Corp. South Korea 12,249 764<br />
Lawson, Inc. Japan 3,000 173<br />
Nestle SA Switzerland 93,785 3,686<br />
Pernod-Ricard SA France 12,824 956<br />
Reckitt Benckiser Group<br />
PLC United Kingdom 22,460 849<br />
Seven & I Holdings Co., Ltd. Japan 11,300 387<br />
Shiseido Co., Ltd. Japan 12,000 245<br />
Shoppers Drug Mart Corp. Canada 44,838 1,771<br />
Tesco PLC United Kingdom 153,395 811<br />
Unilever NV Netherlands 75,005 1,826<br />
UNY Co., Ltd. Japan 17,000 187<br />
Wal-Mart de Mexico SAB de<br />
CV Mexico 351,500 948<br />
Woolworths, Ltd. Australia 78,325 1,491<br />
Total 19,287<br />
Energy (9.6%)<br />
*Artumas Group, Inc. Canada 134,855 55<br />
BG Group PLC United Kingdom 23,405 330<br />
BP PLC United Kingdom 420,195 3,268<br />
CNOOC, Ltd. Hong Kong 1,328,000 1,262<br />
Eni SPA Italy 115,010 2,739<br />
INPEX Corp. Japan 28 221<br />
Nexen, Inc. Canada 102,335 1,804<br />
Oil Search, Ltd. Australia 227,640 759<br />
Petroleo Brasileiro SA, ADR Brazil 71,160 1,743<br />
Reliance Industries, Ltd. India 43,612 1,113<br />
Royal Dutch Shell PLC -<br />
Class A United Kingdom 114,910 3,049<br />
Saipem SPA Italy 73,425 1,239<br />
Seadrill, Ltd. Norway 33,400 274<br />
Suncor Energy, Inc. Canada 53,571 1,044<br />
Total 18,900<br />
Financials (17.6%)<br />
Allianz SE Germany 6,607 712<br />
AXA SA France 35,626 798<br />
Banco Espirito Santo SA Portugal 75,945 717<br />
Banco Santander SA Spain 204,915 1,987<br />
The Bank of Yokohama, Ltd. Japan 30,000 177<br />
BNP Paribas France 32,768 1,390<br />
Cathay Financial Holding<br />
Co., Ltd. Taiwan 533,400 599<br />
Cheung Kong Holdings, Ltd. Hong Kong 48,000 458<br />
China Life Insurance Co.,<br />
Ltd. China 247,000 761<br />
China Overseas Land &<br />
Investment, Ltd. Hong Kong 354,000 498<br />
(n),*China Overseas Land &<br />
Investment, Ltd. - Rights Hong Kong 14,160 5<br />
The Chugoku Bank, Ltd. Japan 10,000 154<br />
Credit Suisse Group AG Switzerland 32,005 875<br />
Daito Trust Construction Co.,<br />
Ltd. Japan 1,800 94<br />
Erste Group Bank AG Austria 22,060 520<br />
Hang Seng Bank, Ltd. Hong Kong 59,800 790<br />
Housing Development<br />
Finance Corp., Ltd. India 42,385 1,325<br />
HSBC Holdings PLC, ADR United Kingdom 42,900 2,088<br />
Industrial & Commercial<br />
Bank of China, Ltd. - Class<br />
H China 2,593,000 1,378<br />
Intesa Sanpaolo SPA Italy 263,525 954<br />
Julius Baer Holding AG Switzerland 35,210 1,351<br />
Man Group PLC United Kingdom 89,530 314<br />
Manulife Financial Corp. Canada 70,040 1,193<br />
Mitsubishi Estate Co., Ltd. Japan 16,000 264<br />
Mitsubishi UFJ Financial<br />
Group, Inc. Japan 130,500 809<br />
Mitsui Fudosan Co., Ltd. Japan 14,000 232<br />
Mizuho Financial Group, Inc. Japan 166,000 494<br />
The Accompanying Notes are an Integral Part of the Financial Statements.<br />
70 International Growth Portfolio
International Growth Portfolio<br />
Foreign Common Stocks<br />
(87.5%) Country<br />
Shares/<br />
$ Par<br />
Value<br />
$ (000's)<br />
Financials continued<br />
Muenchener<br />
Rueckversicherungs-<br />
Gesellschaft AG Germany 3,999 631<br />
National Bank of Greece SA Greece 24,095 448<br />
Nomura Real Estate<br />
Holdings, Inc. Japan 7,600 152<br />
Piraeus Bank SA Greece 44,305 401<br />
QBE Insurance Group, Ltd. Australia 38,970 723<br />
Resona Holdings, Inc. Japan 9,400 149<br />
Samsung Fire & Marine<br />
Insurance Co., Ltd. South Korea 10,977 1,666<br />
Societe Generale France 11,260 573<br />
Sompo Japan Insurance, Inc. Japan 22,000 161<br />
Sony Financial Holdings, Inc. Japan 75 288<br />
Standard Chartered PLC United Kingdom 29,055 377<br />
Sumitomo Mitsui Financial<br />
Group, Inc. Japan 119 515<br />
The Sumitomo Trust &<br />
Banking Co., Ltd. Japan 34,000 201<br />
T&D Holdings, Inc. Japan 5,450 228<br />
TAG Tegernsee Immobilien<br />
und Beteiligungs AG Germany 65,873 186<br />
Tokio Marine Holdings, Inc. Japan 11,300 331<br />
The Toronto-Dominion Bank Canada 49,084 1,753<br />
* Turkiye Garanti Bankasi AS Turkey 209,371 358<br />
UniCredit SPA Italy 309,385 774<br />
Westpac Banking Corp. Australia 107,242 1,303<br />
Zurich Financial Services AG Switzerland 12,183 2,637<br />
Total 34,792<br />
Health Care (8.6%)<br />
* Actelion, Ltd. Switzerland 8,650 486<br />
Astellas Pharma, Inc. Japan 7,200 293<br />
CSL, Ltd. Australia 78,604 1,894<br />
Daiichi Sankyo Co., Ltd. Japan 11,900 283<br />
Eisai Co., Ltd. Japan 5,900 244<br />
Fresenius Medical Care AG<br />
& Co. KGaA Germany 29,502 1,390<br />
Hisamitsu Pharmaceutical<br />
Co., Inc. Japan 3,600 147<br />
Novartis AG Switzerland 67,675 3,381<br />
Novo Nordisk A/S Denmark 15,561 796<br />
Roche Holding AG Switzerland 22,275 3,419<br />
Synthes, Inc. United States 7,390 931<br />
Taisho Pharmaceutical Co.,<br />
Ltd. Japan 7,000 149<br />
Takeda Pharmaceutical Co.,<br />
Ltd. Japan 10,000 518<br />
Terumo Corp. Japan 3,100 145<br />
Teva Pharmaceutical<br />
Industries, Ltd., ADR Israel 68,439 2,913<br />
Total 16,989<br />
Industrials (8.2%)<br />
ABB, Ltd., ADR Switzerland 69,570 1,044<br />
All Nippon Airways Co., Ltd. Japan 28,000 111<br />
Alstom SA France 20,090 1,192<br />
Asahi Glass Co., Ltd. Japan 38,000 216<br />
* BAE Systems PLC United Kingdom 387,045 2,141<br />
Foreign Common Stocks<br />
(87.5%) Country<br />
Shares/<br />
$ Par<br />
Value<br />
$ (000's)<br />
Industrials continued<br />
Balfour Beatty PLC United Kingdom 73,490 355<br />
Central Japan Railway Co. Japan 29 250<br />
Chemring Group PLC United Kingdom 34,415 984<br />
China Railway Construction<br />
Corp. - Class H China 485,500 729<br />
ComfortDelGro Corp., Ltd. Singapore 347,000 353<br />
Companhia de Concessoes<br />
Rodoviarias Brazil 55,700 569<br />
Dai Nippon Printing Co., Ltd. Japan 17,000 187<br />
East Japan Railway Co. Japan 57 445<br />
Fanuc, Ltd. Japan 3,800 270<br />
IHI Corp. Japan 124,000 157<br />
Itochu Corp. Japan 42,000 211<br />
The Japan Steel Works, Ltd. Japan 10,000 139<br />
JTEKT Corp. Japan 28,300 218<br />
Kamigumi Co., Ltd. Japan 16,000 143<br />
Keio Corp. Japan 37,000 222<br />
Kintetsu Corp. Japan 52,000 239<br />
Komatsu, Ltd. Japan 22,700 287<br />
*LG Corp. South Korea 24,601 858<br />
Marubeni Corp. Japan 61,000 232<br />
Mitsubishi Corp. Japan 21,600 303<br />
Mitsubishi Electric Corp. Japan 38,000 238<br />
Mitsubishi Heavy Industries,<br />
Ltd. Japan 59,000 263<br />
Mitsui & Co., Ltd. Japan 31,000 317<br />
Mitsui OSK Lines, Ltd. Japan 31,000 190<br />
*Morphic Technologies AB Sweden 470,405 79<br />
Nippon Yusen Kabushiki<br />
Kaisha Japan 33,000 203<br />
Secom Co., Ltd. Japan 6,400 329<br />
Serco Group PLC United Kingdom 149,960 991<br />
SMC Corp. Japan 1,600 164<br />
Sumitomo Corp. Japan 21,700 191<br />
Tokyu Corp. Japan 39,000 196<br />
Toppan Printing Co., Ltd. Japan 20,000 154<br />
Vinci SA France 17,155 726<br />
West Japan Railway Co. Japan 47 214<br />
Yamato Holdings Co., Ltd. Japan 13,000 169<br />
Total 16,279<br />
Information Technology (4.1%)<br />
*Autonomy Corp. PLC United Kingdom 145,300 2,030<br />
Canon, Inc. Japan 15,800 496<br />
EVS Broadcast Equipment<br />
SA Belgium 11,960 428<br />
Fujitsu, Ltd. Japan 51,000 246<br />
*Gresham Computing PLC United Kingdom 228,550 122<br />
Hitachi, Ltd. Japan 63,000 244<br />
Hoya Corp. Japan 16,500 286<br />
Kontron AG Germany 61,634 641<br />
NEC Corp. Japan 76,000 255<br />
Nintendo Co., Ltd. Japan 1,200 461<br />
Ricoh Co., Ltd. Japan 16,000 204<br />
Samsung Electronics Co.,<br />
Ltd. South Korea 3,219 1,166<br />
*Temenos Group AG Switzerland 118,425 1,576<br />
Total 8,155<br />
The Accompanying Notes are an Integral Part of the Financial Statements.<br />
International Growth Portfolio 71
International Growth Portfolio<br />
Foreign Common Stocks<br />
(87.5%) Country<br />
Materials (7.5%)<br />
Shares/<br />
$ Par<br />
Value<br />
$ (000's)<br />
Angang Steel Co., Ltd. China 652,000 738<br />
Anglo American PLC United Kingdom 34,335 796<br />
* Anhui Conch Cement Co.,<br />
Ltd. China 132,000 613<br />
Asahi Kasei Corp. Japan 62,000 272<br />
BHP Billiton, Ltd. Australia 73,660 1,583<br />
Companhia Vale do Rio<br />
Doce, ADR Brazil 70,585 855<br />
Givaudan SA Switzerland 450 353<br />
Goldcorp, Inc. Canada 66,825 2,107<br />
Huabao International<br />
Holdings, Ltd. Hong Kong 1,085,000 713<br />
* Intex Resources ASA Norway 515,110 98<br />
JFE Holdings, Inc. Japan 9,100 240<br />
K+S AG Germany 25,316 1,461<br />
Mitsubishi Chemical<br />
Holdings Corp. Japan 40,500 179<br />
Mitsubishi Materials Corp. Japan 69,000 174<br />
Nippon Steel Corp. Japan 88,000 289<br />
POSCO South Korea 1,633 481<br />
Potash Corp. of<br />
Saskatchewan, Inc. Canada 20,215 1,480<br />
Rio Tinto PLC, ADR United Kingdom 4,370 389<br />
Shin-Etsu Chemical Co., Ltd. Japan 6,500 298<br />
Sumitomo Metal Industries,<br />
Ltd. Japan 69,000 170<br />
Syngenta AG Switzerland 7,482 1,445<br />
Total 14,734<br />
Other Holdings (3.5%)<br />
Hang Seng Investment Index<br />
Funds Series - H-Share<br />
Index Hong Kong 90,000 935<br />
iShares MSCI Hong Kong<br />
Index Fund Hong Kong 178,309 1,849<br />
iShares MSCI Japan Index<br />
Fund Japan 32,731 314<br />
iShares MSCI Singapore<br />
Index Fund Singapore 200,459 1,417<br />
iShares MSCI South Korea<br />
Index Fund South Korea 31,872 889<br />
iShares MSCI Taiwan Index<br />
Fund Taiwan 191,290 1,452<br />
Total 6,856<br />
Telecommunication Services (7.8%)<br />
* Bharti Airtel, Ltd. India 27,849 411<br />
China Mobile, Ltd. Hong Kong 40,500 411<br />
Chunghwa Telecom Co., Ltd. Taiwan 1,165,780 1,862<br />
Deutsche Telekom AG Germany 128,701 1,965<br />
France Telecom SA France 50,734 1,426<br />
KDDI Corp. Japan 41 292<br />
Koninklijke (Royal) KPN<br />
NV Netherlands 163,711 2,386<br />
Nippon Telegraph and<br />
Telephone Corp. Japan 7,600 408<br />
NTT DoCoMo, Inc. Japan 194 382<br />
SOFTBANK Corp. Japan 10,100 183<br />
Telefonica SA Spain 132,552 2,986<br />
Foreign Common Stocks<br />
(87.5%) Country<br />
Shares/<br />
$ Par<br />
Value<br />
$ (000's)<br />
Telecommunication Services continued<br />
Turkcell Iletisim Hizmetleri<br />
AS Turkey 97,373 561<br />
Vodafone Group PLC United Kingdom 995,343 2,034<br />
Total 15,307<br />
Utilities (6.0%)<br />
Centrica PLC United Kingdom 156,490 610<br />
CEZ Czech Republic 12,275 504<br />
Chubu Electric Power Co.,<br />
Inc. Japan 10,800 328<br />
The Chugoku Electric Power<br />
Co., Inc. Japan 8,300 218<br />
E.ON AG Germany 24,580 999<br />
Electricite de France France 12,180 711<br />
Enagas Spain 42,320 933<br />
GDF Suez France 55,189 2,747<br />
Hokuriku Electric Power Co. Japan 5,200 147<br />
The Kansai Electric Power<br />
Co., Inc. Japan 12,000 347<br />
Kyushu Electric Power Co.,<br />
Inc. Japan 9,200 245<br />
National Grid PLC United Kingdom 94,825 951<br />
Osaka Gas Co., Ltd. Japan 49,000 226<br />
PT Perusahaan Gas Negara Indonesia 2,606,500 471<br />
RWE AG Germany 12,630 1,141<br />
Shikoku Electric Power Co.,<br />
Inc. Japan 6,100 206<br />
Toho Gas Co., Ltd. Japan 25,000 165<br />
Tohoku Electric Power Co.,<br />
Inc. Japan 9,300 252<br />
The Tokyo Electric Power<br />
Co., Inc. Japan 15,700 524<br />
Tokyo Gas Co., Ltd. Japan 43,000 218<br />
Total 11,943<br />
Total Foreign Common Stocks (Cost: $243,469) 172,715<br />
Short-Term Investments (9.7%)<br />
Aircraft (1.0%)<br />
(k)Kitty Hawk Funding Corp.,<br />
0.28%, 1/5/09 United States 2,000,000 2,000<br />
Total 2,000<br />
Federal Government & Agencies (3.9%)<br />
Federal Home Loan Bank,<br />
0.10%, 1/20/09 United States 2,000,000 2,000<br />
Federal Home Loan Bank,<br />
0.10%, 2/13/09 United States 1,500,000 1,500<br />
Federal Home Loan Bank,<br />
0.28%, 1/16/09 United States 2,000,000 2,000<br />
Federal Home Loan Bank,<br />
0.36%, 1/15/09 United States 2,100,000 2,099<br />
Total 7,599<br />
Finance Services (2.8%)<br />
Alpine Securitization Corp.,<br />
1.09%, 1/8/09 United States 2,000,000 2,000<br />
The Accompanying Notes are an Integral Part of the Financial Statements.<br />
72 International Growth Portfolio
International Growth Portfolio<br />
Short-Term Investments<br />
(9.7%) Country<br />
Shares/<br />
$ Par<br />
Value<br />
$ (000's)<br />
Finance Services continued<br />
Bryant Park Funding LLC,<br />
1.02%, 1/9/09 United States 2,000,000 1,999<br />
Gemini Securitization Corp.<br />
LLC, 1.27%, 1/8/09 United States 1,500,000 1,500<br />
Total 5,499<br />
Personal Credit Institutions (1.0%)<br />
HSBC Finance Corp.,<br />
1.29%, 1/7/09 United States 2,000,000 1,999<br />
Total 1,999<br />
Short Term Business Credit (1.0%)<br />
Liberty Street Funding LLC,<br />
0.55%, 1/12/09 United States 2,000,000 2,000<br />
Total 2,000<br />
Total Short-Term Investments<br />
(Cost: $19,097) 19,097<br />
Total Investments (97.2%)<br />
(Cost: $262,566)(a) 191,812<br />
Other Assets, Less<br />
Liabilities (2.8%) 5,571<br />
Net Assets (100.0%) 197,383<br />
* Non-Income Producing<br />
ADR after the name of a security represents—American Depositary Receipt.<br />
(a)<br />
At December 31, 2008 the aggregate cost of securities for federal tax purposes (in thousands) was $264,432 and the net unrealized depreciation of<br />
investments based on that cost was $72,620 which is comprised of $2,916 aggregate gross unrealized appreciation and $75,536 aggregate gross unrealized<br />
depreciation.<br />
Investments Percentage by Country is based on Net Assets:<br />
United Kingdom 13.8%<br />
Japan 12.9%<br />
Switzerland 10.3%<br />
United States 10.1%<br />
France 6.3%<br />
Canada 5.7%<br />
Other 40.9%<br />
Total 100.0%<br />
(j) Swap agreements outstanding on December 31, 2008<br />
Total Return Swaps<br />
CounterParty<br />
JPMorgan Chase<br />
Reference<br />
Morgan Stanley Capital International<br />
(MSCI) Daily Net Japan<br />
Payment Made by<br />
the Fund<br />
3 Month USD-<br />
LIBOR + 15 Basis<br />
Points<br />
Payment Received<br />
by the Fund<br />
MSCI Daily Net<br />
Japan Total<br />
Return<br />
Unrealized<br />
Expiration Date<br />
Notional<br />
Amount<br />
(000's)<br />
Appreciation/<br />
(Depreciation)<br />
(000's)<br />
3/09 10,159 $ 316<br />
(k) Securities with an aggregate value of $2,000 (in thousands) have been pledged as collateral for swap contracts outstanding on December 31, 2008<br />
(l)<br />
(n)<br />
As of December 31, 2008, portfolio securities with an aggregate value of $143,688 (in thousands) were fair valued under procedures adopted by the Board<br />
of Directors.<br />
At December 31, 2008 portfolio securities with a aggregate value of $5 (in thousands) were valued with reference to securities whose values are more<br />
readily available.<br />
The Accompanying Notes are an Integral Part of the Financial Statements.<br />
International Growth Portfolio 73
Research International Core Portfolio<br />
Objective: Portfolio Strategy: Net Assets:<br />
Capital appreciation.<br />
Invest primarily in foreign equity securities of growth $33 million<br />
and value companies, including emerging market securities.<br />
Portfolio Overview<br />
Mason Street Advisors, the investment adviser for the Research International Core Portfolio, has engaged Massachusetts<br />
Financial Services Company to act as sub-adviser for the Portfolio. The objective of the Portfolio is to achieve capital<br />
appreciation. The Portfolio seeks to accomplish this by primarily investing in foreign equity securities, including emerging<br />
market equity securities. The Portfolio may invest in stocks of companies it believes to have above average earnings growth<br />
potential compared to other companies (growth companies), in the stocks of companies it believes are undervalued compared<br />
to their perceived worth (value companies), or in a combination of growth and value companies. The Portfolio also may invest<br />
in companies of any size. A “bottom-up” investment approach is used in buying and selling investments for the Portfolio.<br />
Investments are selected primarily based on fundamental analysis of issuers and their potential in light of their current<br />
financial condition and industry position, as well as market, economic, potential and regulatory conditions. Factors considered<br />
may include analysis of earnings, cash flows, competitive position and management ability. Quantitative analysis of these and<br />
other factors also may be considered. The Portfolio is generally managed to be sector neutral versus the MSCI EAFE Index.<br />
Market Overview<br />
Global financial markets endured a brutal 2008, which saw the failure of a number of leading financial institutions, credit<br />
markets freeze up and world governments take a series of coordinated actions to support economic growth and the financial<br />
system itself. The crisis was a result of the sub-prime mortgage meltdown, which spread rapidly through the U.S. financial<br />
sector into virtually every segment of global financial markets.<br />
This contagion put to rest the notion of “de-coupling” of international economies and markets from the U.S. Rather, global<br />
growth slowed sharply and virtually all markets suffered greatly. For the full year, the MSCI EAFE Index—a measure of<br />
large-cap stock performance in the developed economies of Europe, Australasia and the Far East—returned –43.06%. There<br />
was little differentiation of return by growth or value styles. Looking at performance by sector, no segment had positive<br />
results. Financials performed worst, while the more traditionally defensive Health Care sector held up best. After a bumpy ride<br />
for much of the year, the dollar finished higher because of the turmoil, as investors sought a safe haven for their money. The<br />
exception was Japan, whose currency and stock market held up the best among the developed economies.<br />
Portfolio Results<br />
For the twelve months ended December 31, 2008, the Research International Portfolio provided a total return of -42.54%. By<br />
comparison, the MSCI EAFE Index returned –43.06%. (This Index is unmanaged, cannot be invested in directly and does not<br />
include administrative expenses or sales charges.) The average return for the Portfolio’s peer group, International Core Funds<br />
was –42.59%, according to Lipper Analytical Services, Inc., an independent mutual fund ranking agency.<br />
On an absolute basis, no sector contributed positively to Portfolio results. Shares in the Financial sector detracted most, while<br />
shares in the Health Care sector held up best. Relative to the MSCI EAFE Index, stock selection in the Capital Goods sector<br />
was a primary factor contributing to performance. The Portfolio’s holdings of parcel delivery service company Yamato<br />
Holding and railway operator East Japan Railway were among the top relative contributors. An additional positive factor was<br />
our underweight position to Rio Tinto during the period.<br />
Stocks in other sectors that helped relative performance included pharmaceutical companies Roche Holding, Astellas Pharma<br />
and Actelion. Our underweight position in Royal Bank of Scotland, in addition to positions in fashion distributor Inditex and<br />
telecommunications company KDDI, also boosted results.<br />
The Portfolio’s cash position also was a contributor to relative performance. The Portfolio holds cash in anticipation of buying<br />
new holdings and to provide liquidity. In a period when equity markets declined, holding cash helped performance versus the<br />
benchmark, which has no cash position.<br />
Stock selection in the Financials sector hurt relative performance over the reporting period. Banking firms Anglo Irish Bank,<br />
Barclays, Bank of Cyprus and BNP Paribas were among the top relative detractors. The Portfolio’s positioning in banking and<br />
financial services firms Erste Group Bank, Intesa Sanpaolo and BOC Hong Kong Holdings also held back relative returns.<br />
Stock selection in the Energy sector had a negative impact on relative returns. In particular, not owning integrated oil company<br />
BP hurt performance relative to the benchmark. Information technology services provider Satyam Computer Services<br />
hampered relative returns. In addition, not owning automobile manufacturer Volkswagen also had a negative effect on relative<br />
performance.<br />
74 Research International Core Portfolio
Research International Core Portfolio<br />
Outlook<br />
The Research International Core Portfolio is a sector-neutral portfolio that emphasizes bottom-up fundamental research.<br />
Therefore, our sector allocation is strictly a by-product of where our analysts are finding their best ideas at a given time.<br />
Regardless of changing economic and market conditions, the strategy followed by the managers of the Research International<br />
Portfolio is to continue to seek the most attractive opportunities among growth and value companies without regard to market<br />
capitalization. As of December 31, 2008, the Portfolio had a modest overweight in Information Technology and Capital Goods<br />
shares, while being modestly underweight the Financials and Energy sectors relative to the benchmark.<br />
Relative Performance<br />
Investors should be aware of the risks of investments in<br />
foreign securities, particularly investments in securities<br />
of companies in developing nations. These include the<br />
risks of currency fluctuation, of political and economic<br />
instability and of less well-developed government<br />
supervision and regulation of business and industry<br />
practices, as well as differences in accounting<br />
standards.<br />
Investments in the securities of companies in<br />
developing nations impose risks different from, and<br />
greater than, risks of investing in developed countries.<br />
Average <strong>Annual</strong> Total Returns<br />
For Periods Ended December 31, 2008<br />
1 Year<br />
Since<br />
Inception*<br />
Research International Core Portfolio<br />
MSCI EAFE Index (Gross)<br />
-42.54%<br />
-43.06%<br />
-25.88%<br />
-27.46%<br />
MSCI All Country World (ex-US) Index<br />
(Gross) -45.24% -27.01%<br />
Lipper Variable Insurance Products<br />
(VIP) International Core Funds<br />
Average -42.59% –<br />
*Inception date of 4/30/07<br />
The performance data quoted represents past<br />
performance. Past performance is historical and does<br />
not guarantee future performance. Investment return<br />
and principal value will fluctuate, so that shares, when<br />
redeemed, may be worth more or less than their original<br />
cost. Current performance may be lower or higher than<br />
the performance data quoted. For the most recent<br />
month-end performance information visit<br />
www.nmfn.com.<br />
This chart assumes an initial investment of $10,000<br />
made on 4/30/07 (commencement of the Portfolio's<br />
operations). Returns shown reflect fee waivers,<br />
deductions for management and other portfolio<br />
expenses, and reinvestment of all dividends. In the<br />
absence of fee waivers, total return would be reduced.<br />
Returns exclude deductions for separte account sale<br />
loads and account fees. Please refer to the Benchmark<br />
Definitions section of this report for information about<br />
the indices cited in the above chart and graph.<br />
Top 10 Equity Holdings 12/31/08<br />
Security Description<br />
% of Net Assets<br />
Roche Holding AG 3.2%<br />
Nestle SA 3.0%<br />
E.ON AG 2.6%<br />
Total SA 2.4%<br />
Royal Dutch Shell PLC - Class A 2.3%<br />
Vodafone Group PLC 2.2%<br />
Intesa Sanpaolo SPA 2.1%<br />
Akzo Nobel NV 2.0%<br />
AXA SA 1.9%<br />
Siemens AG 1.8%<br />
Sector Allocation 12/31/08<br />
Short-Term Investments & Other Net Assets<br />
2%<br />
Utilities<br />
5%<br />
Telecommunication<br />
Services<br />
7%<br />
Materials<br />
7%<br />
Information<br />
Technology<br />
7%<br />
Consumer<br />
Discretionary<br />
8%<br />
Consumer Staples<br />
8%<br />
Sector Allocation is based on Net Assets.<br />
Sector Allocation and Top 10 Holdings are subject to<br />
change.<br />
Financials<br />
22%<br />
Industrials<br />
13%<br />
Energy<br />
11%<br />
Health Care<br />
10%<br />
Research International Core Portfolio 75
Research International Core Portfolio<br />
<strong>Northwestern</strong> <strong>Mutual</strong> Series Fund, Inc.<br />
Schedule of Investments<br />
December 31, 2008<br />
Foreign Common Stocks<br />
(98.5%) Country<br />
Consumer Discretionary (8.0%)<br />
Shares/<br />
$ Par<br />
Value<br />
$ (000's)<br />
Bridgestone Corp. Japan 11,200 168<br />
Compagnie Generale des<br />
Etablissements Michelin -<br />
Class B France 2,530 133<br />
Esprit Holdings, Ltd. Hong Kong 27,500 157<br />
Grupo Televisa SA, ADR Mexico 19,050 285<br />
Industria de Diseno Textil SA Spain 10,330 459<br />
Kingfisher PLC United Kingdom 84,560 168<br />
Li & Fung, Ltd. Bermuda 108,000 186<br />
LVMH Moet Hennessy Louis<br />
Vuitton SA France 7,450 503<br />
Next PLC United Kingdom 2,990 47<br />
* Urbi Desarrollos Urbanos SAB<br />
de CV Mexico 42,190 58<br />
WPP PLC United Kingdom 87,310 517<br />
Total 2,681<br />
Consumer Staples (8.5%)<br />
Beiersdorf AG Germany 3,010 180<br />
Groupe DANONE France 7,902 479<br />
Heineken NV Netherlands 8,370 258<br />
Hengan International Group Co.,<br />
Ltd. Hong Kong 46,000 148<br />
Japan Tobacco, Inc. Japan 91 301<br />
Kimberly-Clark de Mexico SAB<br />
de CV Mexico 41,630 140<br />
Lawson, Inc. Japan 2,700 156<br />
Nestle SA Switzerland 25,616 1,007<br />
Unilever NV Netherlands 6,790 165<br />
Total 2,834<br />
Energy (11.2%)<br />
Chevron Corp. United States 2,030 150<br />
CNOOC, Ltd. Hong Kong 121,000 115<br />
Eni SPA Italy 23,840 568<br />
Gazprom OAO, ADR Russia 6,580 94<br />
INPEX Corp. Japan 33 261<br />
Marathon Oil Corp. United States 4,540 124<br />
* Paladin Energy, Ltd. Australia 53,821 96<br />
Petroleo Brasileiro SA, ADR Brazil 6,560 161<br />
Royal Dutch Shell PLC -<br />
Class A United Kingdom 29,450 781<br />
Saipem SPA Italy 6,770 114<br />
StatoilHydro ASA Norway 20,520 340<br />
Total SA France 14,820 812<br />
Tullow Oil PLC United Kingdom 12,517 122<br />
Total 3,738<br />
Financials (21.6%)<br />
Aeon Credit Service Co., Ltd. Japan 26,100 276<br />
AXA SA France 27,770 622<br />
Foreign Common Stocks<br />
(98.5%) Country<br />
Shares/<br />
$ Par<br />
Value<br />
$ (000's)<br />
Financials continued<br />
Bank of Cyprus Public Co., Ltd. Cyprus 49,283 185<br />
Barclays PLC United Kingdom 118,224 271<br />
BNP Paribas France 11,120 472<br />
The Chiba Bank, Ltd. Japan 38,000 237<br />
China Construction Bank Corp. China 966,000 535<br />
Daiwa Securities Group, Inc. Japan 76,000 453<br />
Deutsche Boerse AG Germany 2,110 154<br />
Hang Seng Bank, Ltd. Hong Kong 11,200 148<br />
HDFC Bank, Ltd., ADR India 2,630 188<br />
Intesa Sanpaolo SPA Italy 189,729 687<br />
Oversea-Chinese Banking Corp.,<br />
Ltd. Singapore 47,000 165<br />
QBE Insurance Group, Ltd. Australia 13,680 254<br />
The Shizuoka Bank, Ltd. Japan 20,000 231<br />
Standard Bank Group, Ltd. South Africa 24,173 215<br />
Standard Chartered PLC United Kingdom 28,387 368<br />
Sumitomo Mitsui Financial<br />
Group, Inc. Japan 98 424<br />
UBI Banca - Unione di Banche<br />
Italiane SCpA Italy 35,539 517<br />
*UBS AG Switzerland 20,073 290<br />
Unibanco - Uniao de Bancos<br />
Brasileiros SA, ADR Brazil 5,320 344<br />
United Overseas Bank, Ltd. Singapore 19,000 172<br />
Total 7,208<br />
Health Care (9.6%)<br />
*Actelion, Ltd. Switzerland 4,737 266<br />
Bayer AG Germany 7,200 425<br />
Daiichi Sankyo Co., Ltd. Japan 19,900 473<br />
Merck KGaA Germany 5,450 498<br />
Novartis AG Switzerland 10,180 508<br />
Roche Holding AG Switzerland 6,880 1,056<br />
Total 3,226<br />
Industrials (13.5%)<br />
Assa Abloy AB Sweden 25,530 293<br />
Brambles, Ltd. Australia 93,670 497<br />
Bucyrus International, Inc. United States 11,100 206<br />
Duratex SA Brazil 7,600 47<br />
East Japan Railway Co. Japan 60 468<br />
Geberit AG Switzerland 2,959 318<br />
Glory, Ltd. Japan 17,600 344<br />
Grupo Aeroportuario del<br />
Pacifico SAB de CV, ADR Mexico 2,100 48<br />
JGC Corp. Japan 9,000 135<br />
Keppel Corp., Ltd. Singapore 57,000 174<br />
*LS Industrial Systems Co., Ltd. South Korea 5,020 200<br />
Mitsubishi Corp. Japan 17,400 244<br />
Schneider Electric SA France 3,894 292<br />
Siemens AG Germany 8,090 609<br />
The Accompanying Notes are an Integral Part of the Financial Statements.<br />
76 Research International Core Portfolio
Research International Core Portfolio<br />
Foreign Common Stocks<br />
(98.5%) Country<br />
Shares/<br />
$ Par<br />
Value<br />
$ (000's)<br />
Industrials continued<br />
TNT NV Netherlands 6,220 120<br />
Yamato Holdings Co., Ltd. Japan 40,000 521<br />
Total 4,516<br />
Information Technology (7.1%)<br />
Acer, Inc. Taiwan 168,000 221<br />
ASML Holding NV Netherlands 11,456 205<br />
Cap Gemini SA France 3,860 150<br />
* CSU Cardsystem SA Brazil 16,140 16<br />
Konica Minolta Holdings, Inc. Japan 31,500 244<br />
Nokia OYJ Finland 12,670 197<br />
Ricoh Co., Ltd. Japan 33,000 420<br />
Samsung Electronics Co., Ltd. South Korea 501 181<br />
SAP AG Germany 8,570 309<br />
Taiwan Semiconductor<br />
Manufacturing Co., Ltd. Taiwan 192,000 263<br />
Tokyo Electron, Ltd. Japan 4,900 172<br />
Total 2,378<br />
Preferred Stocks (0.0%)<br />
Information Technology (0.0%)<br />
Country<br />
Shares/<br />
$ Par<br />
Value<br />
$ (000's)<br />
Universo Online SA - UOL Brazil 4,200 13<br />
Total 13<br />
Total Preferred Stocks<br />
(Cost: $19) 13<br />
Total Investments (98.5%)<br />
(Cost: $45,315)(a) 32,929<br />
Other Assets, Less<br />
Liabilities (1.5%) 506<br />
Net Assets (100.0%) 33,435<br />
* Non-Income Producing<br />
ADR after the name of a security represents<br />
—American Depositary Receipt.<br />
Materials (7.0%)<br />
Akzo Nobel NV Netherlands 16,300 676<br />
BHP Billiton PLC United Kingdom 30,670 586<br />
Corporacion Moctezuma SAB<br />
de CV Mexico 15,400 24<br />
CRH PLC Ireland 10,600 269<br />
Linde AG Germany 5,530 470<br />
Rio Tinto PLC United Kingdom 9,530 210<br />
Symrise AG Germany 7,335 104<br />
Total 2,339<br />
Telecommunication Services (7.0%)<br />
America Movil SAB de CV,<br />
ADR - Series L Mexico 9,720 301<br />
BCE, Inc. Canada 5,710 118<br />
China Unicom Hong Kong, Ltd. Hong Kong 134,000 163<br />
KDDI Corp. Japan 47 335<br />
Rogers Communications, Inc. Canada 5,100 153<br />
Telefonica SA Spain 24,140 544<br />
Vodafone Group PLC United Kingdom 354,810 725<br />
Total 2,339<br />
Utilities (5.0%)<br />
E.ON AG Germany 21,370 869<br />
GDF Suez France 10,045 500<br />
NTPC, Ltd. India 48,670 182<br />
Tokyo Gas Co., Ltd. Japan 21,000 106<br />
Total 1,657<br />
Total Foreign Common Stocks (Cost: $45,296) 32,916<br />
(a)<br />
(l)<br />
At December 31, 2008 the aggregate cost of securities for federal tax<br />
purposes (in thousands) was $46,240 and the net unrealized depreciation<br />
of investments based on that cost was $13,311 which is comprised of<br />
$470 aggregate gross unrealized appreciation and $13,781 aggregate<br />
gross unrealized depreciation.<br />
Investments Percentage by Country is based on Net Assets:<br />
Japan 17.9%<br />
France 11.9%<br />
United Kingdom 11.4%<br />
Germany 10.8%<br />
Switzerland 10.3%<br />
Italy 5.6%<br />
Other 32.1%<br />
Total 100.0%<br />
As of December 31, 2008, portfolio securities with an aggregate value of<br />
$30,459 (in thousands) were fair valued under procedures adopted by the<br />
Board of Directors.<br />
The Accompanying Notes are an Integral Part of the Financial Statements.<br />
Research International Core Portfolio 77
International Equity Portfolio<br />
Objective: Portfolio Strategy: Net Assets:<br />
Long-term growth of capital.<br />
Participate in the growth of foreign economies by<br />
investing primarily in securities with high long-term<br />
earnings potential relative to current market values.<br />
$1.0 billion<br />
Portfolio Overview<br />
Mason Street Advisors, the investment adviser for the International Equity Portfolio, has engaged Templeton Investment<br />
Counsel, LLC to act as sub-adviser for the Portfolio. Templeton Investment Counsel, LLC has appointed Franklin Templeton<br />
Investments (Asia) Limited as an additional sub-adviser for the Portfolio. The Portfolio seeks long-term growth of capital. The<br />
Portfolio seeks to achieve this objective by investing primarily in equity securities of issuers from countries outside the U.S.<br />
The Portfolio’s holdings will consist primarily of equity securities of issuers in foreign countries. The Portfolio has an<br />
unlimited right to purchase securities in any foreign country, developed or undeveloped. The Portfolio’s strategy is to identify<br />
and invest in the undervalued stocks of foreign companies offering the greatest discounts to their long-term values. The<br />
strategy will reflect a bottom-up, value-oriented and long-term investment philosophy. In choosing equities, the Portfolio’s<br />
manager will focus on the market price of a company’s security in relation to its long-term earnings, asset value and cash flow<br />
potential. A company’s historical value measure, including price/earnings ratio, profit margins and liquidation value, also will<br />
be considered.<br />
Market Overview<br />
Global financial markets endured a brutal 2008, which saw the failure of a number of leading financial institutions, credit<br />
markets freeze up and governments around the world take a series of coordinated actions to support economic growth and the<br />
financial system itself. The crisis was a result of the sub-prime mortgage meltdown, which spread rapidly through the U.S.<br />
financial sector into virtually every segment of global financial markets.<br />
This contagion put to rest the notion of “de-coupling” of international economies and markets from the U.S. Rather, global<br />
growth slowed sharply and virtually all markets suffered greatly. For the full year, the MSCI EAFE Index—a measure of<br />
large-cap stock performance in the developed economies of Europe, Australasia and the Far East—returned –43.06%. There<br />
was little differentiation of return by growth or value styles. Looking at performance by sector, no segment had positive<br />
results. Financials performed worst, while the more traditionally defensive Health Care sector held up relatively better. After a<br />
bumpy ride for much of the year, the dollar finished higher because of the turmoil, as investors sought a safe haven for their<br />
money. The exception was Japan, whose currency and stock market held up the best among the developed economies.<br />
Portfolio Results<br />
For the twelve months ended December 31, 2008, the International Equity Portfolio returned –43.78%, while the MSCI EAFE<br />
Index returned –43.06%. (The Index is unmanaged, cannot be invested in directly and does not include administrative<br />
expenses or sales charges.) The average return for the Portfolio’s peer group, International Value Funds, was –43.63%,<br />
according to Lipper Analytical Services, Inc., an independent mutual fund rating agency.<br />
The Portfolio’s absolute return reflected the unprecedented turmoil affecting the economy and financial markets in what was<br />
the most trying year for investors in recent memory. No sector contributed positively to results. Relative to the MSCI EAFE<br />
Index, the largest contribution came from an underweight position and stock selection in the hard-hit Financials sector. Stock<br />
selection made the Consumer Discretionary sector the leading detractor from relative results.<br />
The key theme explaining the Portfolio’s return relative to the benchmark was exposure to companies that ratcheted down<br />
earnings expectations as demand for their products declined along with the pace of global growth. This trend was visible in the<br />
Consumer Discretionary sector, where some of the leading detractors were automotive manufacturers or parts providers, such<br />
as Hyundai Motors and GKN.<br />
In Health Care, stock selection and allocation decisions hurt most in the pharmaceutical industry. The leading detractors from<br />
performance compared with the benchmark tended to be large, less volatile stocks—such as Roche Holdings and<br />
AstraZeneca—that held up well and to which we had no exposure.<br />
The leading contribution to Portfolio performance at the sector level came from an underweight position in Financials, the<br />
poorest-performing segment of the Index. Our investment process focuses on undervalued companies, which requires a<br />
judgment about corporate balance sheets, earnings and security valuations. But many companies in the Finance sector have<br />
opaque financial statements, making valuation assessments difficult. Because of this lack of transparency, we were<br />
significantly underweight Financial stocks. Stock selection also had a positive effect in the sector, with global property and<br />
casualty insurer ACE Limited providing the largest contribution to relative returns.<br />
Telecommunication shares also contributed to relative results for the year, led by France Telecom, Telefonos de Mexico and<br />
Telefonica. These traditionally defensive-oriented stocks generally held up well because of their strong financial position,<br />
steady cash flow and lack of liquidity or credit problems.<br />
78 International Equity Portfolio
International Equity Portfolio<br />
Outlook<br />
We believe the unprecedented events sweeping global financial markets can provide patient, long-term investors with<br />
opportunity when we return to some semblance of normal, functioning markets. We feel the forced selling and deleveraging<br />
sweeping markets made little distinction between “good” and “bad” companies. As a result, we are finding no shortage of what<br />
we consider to be high-quality companies trading at very attractive levels. Because we build the Portfolio stock by stock from<br />
the bottom up, our sector and industry selection as well as capitalization range allocations reflect where we are finding<br />
individual securities about which we have the highest conviction at a given time. As of December 31, 2008, the Portfolio’s<br />
largest overweight positions were in the Telecommunication Services and Information Technology sectors. The largest sector<br />
underweights were in Financials and Consumer Staples.<br />
Relative Performance<br />
Investors should be aware of the risks of investments in<br />
foreign securities, particularly investments in securities<br />
of companies in developing nations. These include the<br />
risks of currency fluctuation, of political and economic<br />
instability and of less well-developed government<br />
supervision and regulation of business and industry<br />
practices, as well as differences in accounting<br />
standards.<br />
Average <strong>Annual</strong> Total Returns<br />
For Periods Ended December 31, 2008<br />
1 Year 5 Years 10 Years<br />
International Equity Portfolio<br />
MSCI EAFE Index (Gross)<br />
-43.78%<br />
-43.06%<br />
2.94%<br />
2.10%<br />
3.47%<br />
1.18%<br />
MSCI All Country World (ex-US) Index<br />
(Gross) -45.24% 3.00% 2.27%<br />
Lipper Variable Insurance Products<br />
(VIP) International Value Funds<br />
Average -43.63% 0.98% 2.02%<br />
The performance data quoted represents past<br />
performance. Past performance is historical and does<br />
not guarantee future performance. Investment return<br />
and principal value will fluctuate, so that shares, when<br />
redeemed, may be worth more or less than their original<br />
cost. Current performance may be lower or higher than<br />
the performance data quoted. For the most recent<br />
month-end performance information visit<br />
www.nmfn.com.<br />
This chart assumes an initial investment of $10,000<br />
made on 12/31/98. Returns shown include deductions<br />
for management and other portfolio expenses, and<br />
reinvestment of all dividends. Returns exclude<br />
deductions for separte account sale loads and account<br />
fees. Please refer to the Benchmark Definitions section<br />
of this report for information about the indices cited in<br />
the above chart and graph<br />
Top 10 Equity Holdings 12/31/08<br />
Security Description<br />
% of Net Assets<br />
Telefonica SA, ADR 2.6%<br />
France Telecom SA 2.1%<br />
Novartis AG 2.1%<br />
BAE Systems PLC 1.9%<br />
Royal Dutch Shell PLC - Class B 1.8%<br />
E.ON AG 1.8%<br />
Samsung Electronics Co., Ltd. 1.7%<br />
Vodafone Group PLC 1.6%<br />
Deutsche Post AG 1.6%<br />
Nestle SA 1.5%<br />
Materials<br />
4%<br />
Utilities<br />
6%<br />
Energy<br />
8%<br />
Health Care<br />
10%<br />
Sector Allocation 12/31/08<br />
Consumer Staples<br />
4%<br />
Short-Term Investments<br />
& Other Net Assets<br />
2%<br />
Financials<br />
17%<br />
Industrials<br />
14%<br />
Telecommunication<br />
Services<br />
13%<br />
Information<br />
Technology<br />
10%<br />
Sector Allocation is based on Net Assets.<br />
Sector Allocation and Top 10 Holdings are subject to<br />
change.<br />
Consumer Discretionary<br />
12%<br />
International Equity Portfolio 79
International Equity Portfolio<br />
<strong>Northwestern</strong> <strong>Mutual</strong> Series Fund, Inc.<br />
Schedule of Investments<br />
December 31, 2008<br />
Foreign Common Stocks<br />
(97.0%) Country<br />
Consumer Discretionary (12.4%)<br />
Shares/<br />
$ Par<br />
Value<br />
$ (000's)<br />
Accor SA France 173,000 8,555<br />
Bayerische Motoren Werke<br />
AG Germany 380,920 11,767<br />
British Sky Broadcasting<br />
Group PLC United Kingdom 1,864,690 13,168<br />
Burberry Group PLC United Kingdom 738,190 2,403<br />
Compagnie Generale des<br />
Etablissements Michelin<br />
- Class B France 260,200 13,711<br />
Compass Group PLC United Kingdom 2,915,350 14,684<br />
GKN PLC United Kingdom 2,091,540 3,006<br />
* Hyundai Motor Co. South Korea 264,580 8,494<br />
Kingfisher PLC United Kingdom 3,825,490 7,594<br />
Mediaset SPA Italy 1,497,610 8,595<br />
NGK Spark Plug Co., Ltd. Japan 550,000 4,404<br />
Pearson PLC United Kingdom 697,770 6,573<br />
Reed Elsevier NV Netherlands 558,652 6,614<br />
Sony Corp. Japan 323,400 7,025<br />
* Thomson France 1,088,780 1,480<br />
Valeo SA France 135,280 2,021<br />
Wolters Kluwer NV Netherlands 166,630 3,162<br />
Yell Group PLC United Kingdom 1,590,550 993<br />
Zon Multimedia Servicos<br />
de Telecomunicacoes e<br />
Multimedia SGPS SA Portugal 89,113 465<br />
Total 124,714<br />
Consumer Staples (3.7%)<br />
Cadbury PLC United Kingdom 1,534,097 13,631<br />
Nestle SA Switzerland 389,800 15,319<br />
Unilever PLC United Kingdom 348,295 8,034<br />
Total 36,984<br />
Energy (7.8%)<br />
BP PLC United Kingdom 1,866,830 14,519<br />
China Shenhua Energy<br />
Co., Ltd. China 1,578,500 3,385<br />
Eni SPA Italy 414,535 9,871<br />
Gazprom OAO, ADR Russia 368,660 5,253<br />
Repsol YPF SA Spain 493,680 10,566<br />
Royal Dutch Shell PLC -<br />
Class B United Kingdom 704,315 17,992<br />
SBM Offshore NV Netherlands 451,200 5,942<br />
Total SA France 205,958 11,284<br />
Total 78,812<br />
Financials (17.0%)<br />
ACE, Ltd. Switzerland 234,580 12,414<br />
Australia & New Zealand<br />
Banking Group, Ltd. Australia 89,588 981<br />
Aviva PLC United Kingdom 1,715,770 9,858<br />
AXA SA France 512,174 11,475<br />
Banco Santander SA Spain 906,009 8,787<br />
Foreign Common Stocks<br />
(97.0%) Country<br />
Shares/<br />
$ Par<br />
Value<br />
$ (000's)<br />
Financials continued<br />
Cheung Kong Holdings,<br />
Ltd. Hong Kong 1,035,000 9,867<br />
DBS Group Holdings, Ltd. Singapore 1,192,000 7,112<br />
(n),*DBS Group Holdings, Ltd.<br />
- Rights Singapore 596,000 1,248<br />
HSBC Holdings PLC United Kingdom 1,474,937 14,158<br />
ING Groep NV Netherlands 683,040 7,175<br />
*KB Financial Group, Inc. South Korea 226,500 6,191<br />
Lloyds TSB Group PLC United Kingdom 1,671,640 2,165<br />
Mitsubishi UFJ Financial<br />
Group, Inc. Japan 565,000 3,503<br />
Mitsubishi UFJ Financial<br />
Group, Inc., ADR Japan 222,000 1,379<br />
National Australia Bank,<br />
Ltd. Australia 514,532 7,696<br />
Nomura Holdings, Inc. Japan 332,400 2,739<br />
Nordea Bank AB Sweden 1,536,530 11,209<br />
Old <strong>Mutual</strong> PLC United Kingdom 4,953,850 4,017<br />
Royal Bank of Scotland<br />
Group PLC United Kingdom 3,000,044 2,201<br />
Sompo Japan Insurance,<br />
Inc. Japan 1,103,000 8,071<br />
Standard Chartered PLC United Kingdom 370,360 4,805<br />
Swire Pacific, Ltd. Hong Kong 1,276,500 8,851<br />
Swiss Re Switzerland 180,212 8,730<br />
*UBS AG Switzerland 1,015,136 14,681<br />
UniCredit SPA Italy 860,800 2,154<br />
Total 171,467<br />
Health Care (9.5%)<br />
*Agfa Gevaert NV Belgium 291,272 764<br />
Celesio AG Germany 261,230 7,170<br />
GlaxoSmithKline PLC United Kingdom 621,430 11,709<br />
Lonza Group AG Switzerland 162,050 14,938<br />
Merck KGaA Germany 154,300 14,098<br />
Novartis AG Switzerland 424,920 21,230<br />
Olympus Corp. Japan 236,500 4,745<br />
Sanofi-Aventis France 164,625 10,508<br />
Takeda Pharmaceutical<br />
Co., Ltd. Japan 208,500 10,806<br />
Total 95,968<br />
Industrials (13.1%)<br />
Atlas Copco AB Sweden 1,330,560 11,572<br />
BAE Systems PLC United Kingdom 3,411,020 18,870<br />
Deutsche Post AG Germany 935,380 15,903<br />
Empresa Brasileira de<br />
Aeronautica SA, ADR Brazil 416,340 6,749<br />
Hutchison Whampoa, Ltd. Hong Kong 1,826,000 9,211<br />
Koninklijke (Royal)<br />
Philips Electronics NV Netherlands 449,135 8,778<br />
*Loomis AB Sweden 130,460 817<br />
Niscayah Group AB Sweden 652,300 563<br />
Qantas Airways, Ltd. Australia 2,552,550 4,802<br />
Rentokil Initial PLC United Kingdom 2,672,940 1,736<br />
80 International Equity Portfolio<br />
The Accompanying Notes are an Integral Part of the Financial Statements.
International Equity Portfolio<br />
Foreign Common Stocks<br />
(97.0%) Country<br />
Shares/<br />
$ Par<br />
Value<br />
$ (000's)<br />
Industrials continued<br />
* Rolls-Royce Group PLC United Kingdom 1,916,990 9,532<br />
Securitas AB - Class B Sweden 652,300 5,409<br />
* Shanghai Electric Group<br />
Co., Ltd. China 23,038,000 9,437<br />
Siemens AG, ADR Germany 199,230 15,092<br />
Smiths Group PLC United Kingdom 320,326 4,186<br />
* Vestas Wind Systems A/S Denmark 167,380 9,997<br />
Total 132,654<br />
Information Technology (9.9%)<br />
BYD Co., Ltd. China 3,163,000 5,215<br />
* Check Point Software<br />
Technologies, Ltd. Israel 387,430 7,357<br />
Compal Electronics, Inc. Taiwan 6,035,398 3,214<br />
FUJIFILM Holdings Corp. Japan 159,300 3,503<br />
Hitachi, Ltd. Japan 1,198,000 4,642<br />
* Infineon Technologies AG Germany 1,122,690 1,553<br />
Lite-On Technology Corp. Taiwan 3,467,876 2,293<br />
Mabuchi Motor Co., Ltd. Japan 168,400 6,988<br />
Nintendo Co., Ltd. Japan 39,300 15,086<br />
Samsung Electronics<br />
Co., Ltd. South Korea 46,140 16,709<br />
SAP AG Germany 261,040 9,402<br />
Taiwan Semiconductor<br />
Manufacturing Co., Ltd. Taiwan 10,165,997 13,933<br />
Toshiba Corp. Japan 2,350,000 9,668<br />
Total 99,563<br />
Materials (3.8%)<br />
Akzo Nobel NV Netherlands 111,700 4,629<br />
Alumina, Ltd. Australia 1,908,930 1,907<br />
BASF SE Germany 218,600 8,680<br />
Companhia Vale do Rio<br />
Doce, ADR Brazil 881,000 9,383<br />
* Domtar Corp. Canada 1,006,610 1,712<br />
* Norske Skogindustrier<br />
ASA Norway 978,371 1,948<br />
Stora Enso OYJ - Class R Finland 658,140 5,163<br />
UPM-Kymmene OYJ Finland 394,760 5,030<br />
Total 38,452<br />
Telecommunication Services (13.5%)<br />
China Telecom Corp., Ltd. China 17,338,000 6,573<br />
Chunghwa Telecom Co.,<br />
Ltd., ADR Taiwan 364,613 5,688<br />
France Telecom SA France 756,770 21,272<br />
* KT Corp., ADR South Korea 385,100 5,649<br />
Nippon Telegraph and<br />
Telephone Corp. Japan 1,930 10,364<br />
Portugal Telecom SGPS<br />
SA Portugal 632,670 5,395<br />
SK Telecom Co., Ltd.,<br />
ADR South Korea 322,890 5,870<br />
Telefonica SA, ADR Spain 395,838 26,676<br />
Telefonos de Mexico SAB<br />
de CV, ADR Mexico 514,688 10,778<br />
Telenor ASA Norway 1,208,610 8,141<br />
Telmex Internacional SAB<br />
de CV, ADR Mexico 514,688 5,847<br />
Foreign Common Stocks<br />
Shares/ Value<br />
(97.0%) Country $ Par $ (000's)<br />
Telecommunication Services continued<br />
Turkcell Iletisim<br />
Hizmetleri AS Turkey 1,315,060 7,584<br />
Vodafone Group PLC United Kingdom 8,017,483 16,382<br />
Total 136,219<br />
Utilities (6.3%)<br />
E.ON AG Germany 440,100 17,884<br />
Electricite de France France 258,050 15,072<br />
GDF Suez France 300,594 14,961<br />
Iberdrola SA Spain 682,240 6,366<br />
*Korea Electric Power<br />
Corp. South Korea 365,650 8,523<br />
*Suez Environnement SA France 78,727 1,334<br />
Total 64,140<br />
Total Foreign Common Stocks (Cost: $1,193,785) 978,973<br />
Short-Term Investments (2.8%)<br />
Finance Services (1.0%)<br />
Bryant Park Funding LLC,<br />
1.02%, 1/9/09 United States 10,000,000 9,997<br />
Total 9,997<br />
Independent Finance (0.4%)<br />
HSBC Finance Corp.,<br />
0.30%, 1/6/09 United States 4,000,000 4,000<br />
Total 4,000<br />
Industrials (1.0%)<br />
Textron, Inc.,<br />
6.25%, 1/6/09 United States 10,000,000 9,991<br />
Total 9,991<br />
Oil and Gas (0.4%)<br />
Sempra Global,<br />
1.00%, 1/2/09 United States 4,100,000 4,100<br />
Total 4,100<br />
Total Short-Term Investments<br />
(Cost: $28,088) 28,088<br />
Total Investments (99.8%)<br />
(Cost: $1,221,873)(a) 1,007,061<br />
Other Assets, Less<br />
Liabilities (0.2%) 2,306<br />
Net Assets (100.0%) 1,009,367<br />
The Accompanying Notes are an Integral Part of the Financial Statements.<br />
International Equity Portfolio 81
International Equity Portfolio<br />
* Non-Income Producing<br />
ADR after the name of a security represents—American Depositary Receipt.<br />
(a)<br />
At December 31, 2008 the aggregate cost of securities for federal tax purposes (in thousands) was $1,223,067 and the net unrealized depreciation of<br />
investments based on that cost was $216,006 which is comprised of $161,208 aggregate gross unrealized appreciation and $377,214 aggregate gross<br />
unrealized depreciation.<br />
Investments Percentage by Country is based on Net Assets:<br />
United Kingdom 20.0%<br />
France 11.1%<br />
Germany 10.1%<br />
Japan 9.2%<br />
Switzerland 8.7%<br />
Spain 5.2%<br />
South Korea 5.1%<br />
Other 30.6%<br />
Total 100.0%<br />
(l)<br />
(n)<br />
As of December 31, 2008, portfolio securities with an aggregate value of $878,897 (in thousands) were fair valued under procedures adopted by the Board<br />
of Directors.<br />
At December 31, 2008 portfolio securities with a aggregate value of $1,248 (in thousands) were valued with reference to securities whose values are more<br />
readily available.<br />
82 International Equity Portfolio<br />
The Accompanying Notes are an Integral Part of the Financial Statements.
Emerging Markets Equity Portfolio<br />
Objective: Portfolio Strategy: Net Assets:<br />
Capital appreciation.<br />
Invest primarily in equity securities of issuers that are $52 million<br />
tied economically to emerging market counties.<br />
Portfolio Overview<br />
Mason Street Advisors, the investment adviser for the Emerging Markets Equity Portfolio, has engaged Massachusetts<br />
Financial Services Company to act as sub-adviser for the Portfolio. The objective of the Portfolio is to achieve capital<br />
appreciation. The Portfolio seeks to accomplish this by investing at least 80% of its net assets (plus any borrowings for<br />
investment purposes) in equity instruments of issuers that are tied economically to emerging market countries. Such equity<br />
instruments could include common stocks, preferred stock, securities convertible into stock and ADRs. Emerging market<br />
countries may include countries that have emerging market economies, taking into account a number of factors, including<br />
whether a particular country has a low to middle economy according to the International Bank for Reconstruction and<br />
Development (the World Bank), the country’s foreign currency debt rating, its political and economic stability, and the<br />
development of its financial and capital markets.<br />
Market Overview<br />
Global financial markets endured a brutal 2008, which saw the failure of a number of leading financial institutions, credit<br />
markets freeze up and governments around the world take a series of coordinated actions to support economic growth and the<br />
financial system itself. The crisis was a result of the sub-prime mortgage meltdown, which spread rapidly through the U.S.<br />
financial sector into virtually every segment of global financial markets.<br />
This contagion put to rest the notion of “de-coupling” of international economies and markets from the U.S. Rather, global<br />
growth slowed sharply and virtually all markets suffered greatly. For the full year, the MSCI EAFE Index—a measure of<br />
large-cap stock performance in the developed markets of Europe, Australasia and the Far East—returned –43.06%. Emerging<br />
market equities performed even worse, highly levered as they tend to be to economic growth and commodity prices (many are<br />
basic materials exporters), both of which turned down sharply in the second half of the year. Looking at performance by<br />
sector, no segment had positive results.<br />
Portfolio Results<br />
For the twelve months ended December 31, 2008, the Emerging Markets Equity Portfolio provided a total return after fees and<br />
expenses of –55.22%. This compares with a return of –53.18% for the Portfolio’s benchmark, the MSCI Emerging Markets<br />
Index. (This Index is unmanaged, cannot be invested in directly and does not include administrative expenses or sales<br />
charges.) The average return for the Portfolio’s peer group, Emerging Markets Funds, was –54.07%, according to Lipper<br />
Analytical Services, Inc., an independent mutual fund ranking agency.<br />
As evidenced by the returns of the Portfolio's benchmark, the MSCI Emerging Markets Index, losses among emerging markets<br />
equities were significant and broad based during the reporting period. For the Portfolio, security selection in the Materials<br />
sector was the primary detractor from relative performance. In this sector, holdings of mining and metal companies Mechel<br />
Oao and Evraz Group were among the Portfolio’s top relative detractors over the reporting period.<br />
Stock selection, and to a lesser extent, an underweighted position in the Special Products and Services sector, also hindered<br />
relative returns. Holdings of poor-performing real estate brokerage firm LPS Brasil negatively impacted returns for the period.<br />
The Portfolio’s overweighted position in the Energy sector hurt relative performance. Shares of natural gas producer Gazprom<br />
and integrated oil company LUKOIL were among the Portfolio’s top detractors within this sector.<br />
Stock selection in the Technology sector helped the Portfolio’s relative performance. Semiconductor firm Taiwan<br />
Semiconductor was among the Portfolio’s top relative contributors. Stock selection in the Retailing sector also aided relative<br />
returns. Positioning in investment holding company Lewis Group and women’s clothing retailer Foschini helped as both<br />
positions significantly outperformed the benchmark. Elsewhere, the Portfolio’s positioning in state-owned telecom operator<br />
China Telecom, commercial bank Sberbank and cosmetics firm Natura Cosmeticos bolstered relative performance.<br />
During the reporting period, the Portfolio's currency exposure was a contributor to relative performance. All of our investment<br />
decisions are driven by the fundamentals of each individual opportunity and as such, it is common for our portfolios to have<br />
different currency exposure than the benchmark.<br />
The Portfolio’s cash position also was a contributor to relative performance. The Portfolio holds cash in anticipation of buying<br />
new holdings and to provide liquidity. In a period when equity markets declined, holding cash helped performance versus the<br />
benchmark, which has no cash position.<br />
Outlook<br />
Global financial markets remain in the thrall of financial, economic and political developments in the United States.<br />
Regardless of changing economic and market conditions, the manager of the Emerging Markets Equity Portfolio expects to<br />
Emerging Markets Equity Portfolio 83
Emerging Markets Equity Portfolio<br />
continue to seek companies that are undergoing fundamental operational improvements and whose shares trade at discounted<br />
valuations. As of December 31, 2008, our largest sector overweights were in Utilities and Health Care shares, while Financials<br />
and Materials were our leading underweight positions relative to the benchmark.<br />
Relative Performance<br />
$14,000<br />
13,000<br />
12,000<br />
11,000<br />
10,000<br />
9,000<br />
8,000<br />
7,000<br />
6,000<br />
5,000<br />
4/07 12/07 12/08<br />
Emerging Markets Equity Portfolio<br />
MSCI Emerging Markets Index (Gross)<br />
Average <strong>Annual</strong> Total Returns<br />
For Periods Ended December 31, 2008<br />
1 Year<br />
Since<br />
Inception*<br />
Emerging Markets Equity Portfolio -55.22% -29.43%<br />
MSCI Emerging Markets Index<br />
(Gross) -53.18% -25.49%<br />
Lipper Variable Insurance Products<br />
(VIP) Emerging Markets Funds<br />
Average -54.07% –<br />
*Inception date of 4/30/07<br />
The performance data quoted represents past<br />
performance. Past performance is historical and does<br />
not guarantee future performance. Investment return<br />
and principal value will fluctuate, so that shares, when<br />
redeemed, may be worth more or less than their original<br />
cost. Current performance may be lower or higher than<br />
the performance data quoted. For the most recent<br />
month-end performance information visit<br />
www.nmfn.com.<br />
This chart assumes an initial investment of $10,000<br />
made on 4/30/07 (commencement of the Portfolio's<br />
operations). Returns shown reflect fee waivers,<br />
deductions for management and other portfolio<br />
expenses, and reinvestment of all dividends. In the<br />
absence of fee waivers, total return would be reduced.<br />
Returns exclude deductions for separte account sale<br />
loads and account fees. Please refer to the Benchmark<br />
Definitions section of this report for information about<br />
the indices cited in the above chart and graph.<br />
Investors should be aware of the risks of investments in<br />
foreign securities, particularly investments in securities<br />
of companies in developing nations. These include the<br />
risks of currency fluctuation, of political and economic<br />
instability and of less well-developed government<br />
supervision and regulation of business and industry<br />
practices, as well as differences in accounting<br />
standards.<br />
Investments in the securities of companies in<br />
developing nations impose risks different from, and<br />
greater than, risks of investing in developed countries.<br />
The Portfolio may use derivative instruments for hedging<br />
purposes as part of its investment strategy. Use of these<br />
instruments may involve certain costs and risks such as<br />
liquidity risk, interest rate risk, market risk, credit risk,<br />
management risk and the risk that the Portfolio could<br />
not close out a position when it would be most<br />
advantageous to do so. Portfolios investing in<br />
derivatives could lose more than the principal amount<br />
invested in those instruments.<br />
Top 10 Equity Holdings 12/31/08<br />
Security Description<br />
% of Net Assets<br />
Samsung Electronics Co., Ltd. 4.4%<br />
China Mobile, Ltd. 4.3%<br />
Teva Pharmaceutical Industries, Ltd., ADR 3.8%<br />
Petroleo Brasileiro SA, ADR 3.7%<br />
Companhia Vale do Rio Doce, ADR 2.9%<br />
Gazprom OAO, ADR 2.6%<br />
Industrial & Commercial Bank of China, Ltd. -<br />
Class H 2.4%<br />
MTN Group, Ltd. 2.1%<br />
America Movil SAB de CV, ADR - Series L 2.0%<br />
Taiwan Semiconductor Manufacturing Co., Ltd.,<br />
ADR 1.9%<br />
Utilities<br />
5%<br />
Health Care<br />
5%<br />
Consumer<br />
Discretionary<br />
6%<br />
Consumer Staples<br />
7%<br />
Materials<br />
9%<br />
Energy<br />
13%<br />
Sector Allocation 12/31/08<br />
Industrials<br />
2%<br />
Short-Term Investments<br />
& Other Net Assets<br />
2%<br />
Telecommunication<br />
Services<br />
19%<br />
Financials<br />
18%<br />
Information Technology<br />
14%<br />
Sector Allocation is based on Net Assets.<br />
Sector Allocation and Top 10 Holdings are subject to<br />
change.<br />
84 Emerging Markets Equity Portfolio
Emerging Markets Equity Portfolio<br />
<strong>Northwestern</strong> <strong>Mutual</strong> Series Fund, Inc.<br />
Schedule of Investments<br />
December 31, 2008<br />
Foreign Common Stocks<br />
(96.5%) Country<br />
Shares/<br />
$ Par<br />
Value<br />
$ (000's)<br />
Foreign Common Stocks<br />
(96.5%) Country<br />
Shares/<br />
$ Par<br />
Value<br />
$ (000's)<br />
Consumer Discretionary (5.8%)<br />
* Desarrolladora Homex SAB de<br />
CV, ADR Mexico 4,830 110<br />
Dufry South America, Ltd. Bermuda 22,970 164<br />
Foschini, Ltd. South Africa 78,020 400<br />
Genting Bhd Malaysia 293,300 316<br />
Grupo Televisa SA, ADR Mexico 32,800 490<br />
* Kroton Educacional SA Brazil 16,500 89<br />
Lewis Group, Ltd. South Africa 75,231 386<br />
PT Astra International Tbk Indonesia 222,000 224<br />
* SARE Holding SAB de CV -<br />
Class B Mexico 497,100 106<br />
Truworths International, Ltd. South Africa 79,700 291<br />
* Urbi Desarrollos Urbanos SAB<br />
de CV Mexico 73,020 101<br />
Woolworths Holdings, Ltd. South Africa 252,136 343<br />
Total 3,020<br />
Consumer Staples (6.8%)<br />
Asiatic Development Bhd Malaysia 214,300 221<br />
Chaoda Modern Agriculture<br />
Holdings, Ltd. Hong Kong 569,920 367<br />
Companhia de Bebidas das<br />
Americas, ADR Brazil 10,960 486<br />
Grupo Continental SAB de CV Mexico 145,010 242<br />
Hengan International Group<br />
Co., Ltd. Hong Kong 126,000 406<br />
Kimberly-Clark de Mexico<br />
SAB de CV Mexico 50,620 170<br />
* KT&G Corp. South Korea 5,744 358<br />
Massmart Holdings, Ltd. South Africa 31,660 286<br />
Natura Cosmeticos SA Brazil 20,730 170<br />
PT Hanjaya Mandala<br />
Sampoerna Tbk Indonesia 292,000 219<br />
PT Unilever Indonesia Tbk Indonesia 386,000 280<br />
Tradewinds Malaysia Bhd Malaysia 420,200 366<br />
Total 3,571<br />
Energy (13.5%)<br />
China Oilfield Services, Ltd. China 386,000 315<br />
CNOOC, Ltd. Hong Kong 960,000 912<br />
Gazprom OAO, ADR Russia 94,250 1,343<br />
LUKOIL, ADR Russia 29,540 978<br />
NovaTek OAO Russia 15,100 289<br />
Oil & Natural Gas Corp., Ltd. India 15,488 214<br />
Petroleo Brasileiro SA, ADR Brazil 78,450 1,921<br />
PT Bumi Resources Tbk Indonesia 1,056,500 91<br />
PTT Exploration & Production<br />
PCL Thailand 102,800 316<br />
Rosneft Oil Co. Russia 81,650 306<br />
Tenaris SA, ADR Luxembourg 7,510 158<br />
Tupras-Turkiye Petrol<br />
Rafinerileri AS Turkey 22,693 240<br />
Total 7,083<br />
Financials (17.7%)<br />
Ayala Land, Inc. Philippines 2,110,600 292<br />
Banco Santander Chile, ADR Chile 10,270 360<br />
BanColombia SA, ADR Colombia 5,710 133<br />
Bank of China, Ltd. China 1,612,000 444<br />
Bank of Communications Co.,<br />
Ltd. China 397,000 289<br />
Bank Pekao SA Poland 6,820 291<br />
BM&F BOVESPA SA Brazil 53,400 139<br />
*Bolsa Mexicana de Valores<br />
SAB de CV Mexico 28,700 21<br />
*Brasil Brokers Participacoes<br />
SA Brazil 80,900 58<br />
Cathay Financial Holding Co.,<br />
Ltd. Taiwan 331,750 373<br />
China Construction Bank Corp. China 1,699,000 940<br />
China Merchants Bank Co.,<br />
Ltd. China 166,500 312<br />
Credicorp, Ltd. Bermuda 3,400 170<br />
First Financial Holding Co.,<br />
Ltd. Taiwan 621,888 330<br />
Grupo Financiero Banorte SAB<br />
de CV Mexico 118,100 215<br />
Industrial & Commercial Bank<br />
of China, Ltd. - Class H China 2,325,000 1,236<br />
Komercni Banka AS Czech Republic 1,739 272<br />
LPS Brasil - Consultoria de<br />
Imoveis SA Brazil 20,818 59<br />
Nedbank Group, Ltd. South Africa 28,000 287<br />
Powszechna Kasa<br />
Oszczednosci Bank Polski<br />
SA Poland 31,670 379<br />
PT Bank Central Asia Tbk Indonesia 1,201,000 363<br />
PT Bank Rakyat Indonesia Indonesia 589,000 260<br />
Public Bank Bhd Malaysia 114,000 290<br />
Siam Commercial Bank PCL Thailand 210,400 296<br />
Standard Bank Group, Ltd. South Africa 68,520 611<br />
*Turkiye Garanti Bankasi AS Turkey 227,960 390<br />
Unibanco - Uniao de Bancos<br />
Brasileiros SA, ADR Brazil 6,760 437<br />
Total 9,247<br />
Health Care (5.4%)<br />
Diagnosticos da America SA Brazil 10,700 104<br />
*Genomma Lab Internacional<br />
SAB de CV - Class B Mexico 373,400 262<br />
OdontoPrev SA Brazil 21,600 215<br />
Ranbaxy Laboratories, Ltd. India 50,090 261<br />
Teva Pharmaceutical<br />
Industries, Ltd., ADR Israel 46,310 1,971<br />
Total 2,813<br />
Industrials (1.9%)<br />
The Accompanying Notes are an Integral Part of the Financial Statements.<br />
Emerging Markets Equity Portfolio 85
Emerging Markets Equity Portfolio<br />
Foreign Common Stocks<br />
(96.5%) Country<br />
Shares/<br />
$ Par<br />
Value<br />
$ (000's)<br />
Industrials continued<br />
Bharat Heavy Electricals, Ltd. India 20 0<br />
Copa Holdings SA - Class A Panama 5,430 165<br />
Duratex SA Brazil 24,900 155<br />
Empresa Brasileira de<br />
Aeronautica SA, ADR Brazil 5,360 87<br />
Keppel Corp., Ltd. Singapore 78,000 238<br />
Larsen & Toubro, Ltd. India 15,401 246<br />
Orascom Construction<br />
Industries Egypt 4,870 124<br />
Total 1,015<br />
Information Technology (13.5%)<br />
Acer, Inc. Taiwan 251,000 330<br />
* CSU Cardsystem SA Brazil 146,000 145<br />
Delta Electronics, Inc. Taiwan 185,420 361<br />
HTC Corp. Taiwan 35,370 357<br />
Infosys Technologies, Ltd.,<br />
ADR India 25,930 637<br />
MediaTek, Inc. Taiwan 59,550 403<br />
Redecard SA Brazil 22,900 254<br />
Samsung Electronics Co., Ltd. South Korea 6,368 2,306<br />
Siliconware Precision<br />
Industries Co., ADR Taiwan 64,830 289<br />
Taiwan Semiconductor<br />
Manufacturing Co., Ltd. Taiwan 660,120 905<br />
Taiwan Semiconductor<br />
Manufacturing Co., Ltd.,<br />
ADR Taiwan 127,844 1,010<br />
Totvs SA Brazil 6,100 98<br />
Total 7,095<br />
Materials (9.0%)<br />
Companhia Vale do Rio Doce,<br />
ADR Brazil 124,320 1,506<br />
Corporacion Moctezuma SAB<br />
de CV Mexico 193,400 303<br />
Evraz Group SA Luxembourg 5,460 47<br />
Grupo Mexico SAB de CV Mexico 386,030 250<br />
Impala Platinum Holdings, Ltd. South Africa 29,540 429<br />
Israel Chemicals, Ltd. Israel 48,250 337<br />
* LG Chem, Ltd. South Korea 8,010 459<br />
Makhteshim-Agan Industries,<br />
Ltd. Israel 70,240 229<br />
Mechel, ADR Russia 16,520 66<br />
Novolipetsk Steel OAO Russia 11,450 117<br />
Pretoria Portland Cement Co.,<br />
Ltd. South Africa 103,337 347<br />
PT International Nickel<br />
Indonesia Tbk Indonesia 719,000 130<br />
The Siam Cement PCL Thailand 121,900 387<br />
* Suzano Papel e Celulose SA Brazil 17,400 91<br />
Total 4,698<br />
Telecommunication Services (18.6%)<br />
America Movil SAB de CV,<br />
ADR - Series L Mexico 32,890 1,019<br />
(n) AS Eesti Telekom Estonia 14,880 264<br />
Foreign Common Stocks<br />
(96.5%) Country<br />
Shares/<br />
$ Par<br />
Value<br />
$ (000's)<br />
Telecommunication Services continued<br />
Bezeq Israeli<br />
Telecommunication Corp.,<br />
Ltd. Israel 168,970 278<br />
China Mobile, Ltd. Hong Kong 219,500 2,226<br />
China Mobile, Ltd., ADR Hong Kong 19,470 990<br />
China Unicom (Hong Kong),<br />
Ltd., ADR Hong Kong 24,780 302<br />
Chunghwa Telecom Co., Ltd. Taiwan 415,189 663<br />
Egyptian Co. for Mobile<br />
Services Egypt 15,510 411<br />
Globe Telecom, Inc. Philippines 15,440 251<br />
Magyar Telekom<br />
Telecommunications PLC,<br />
ADR Hungary 17,190 241<br />
Mobile Telesystems OAO,<br />
ADR Russia 16,120 430<br />
MTN Group, Ltd. South Africa 93,700 1,090<br />
Philippine Long Distance<br />
Telephone Co. Philippines 5,950 274<br />
PT Telekomunikasi Indonesia<br />
Tbk Indonesia 823,500 536<br />
Telkom South Africa, Ltd. South Africa 24,250 298<br />
Turkcell Iletisim Hizmet AS,<br />
ADR Turkey 20,330 297<br />
Vimpel-Communications,<br />
ADR Russia 26,360 189<br />
Total 9,759<br />
Utilities (4.3%)<br />
AES Tiete SA Brazil 17,000 109<br />
CEZ Czech Republic 19,170 787<br />
Equatorial Energia SA Brazil 19,600 85<br />
Gail India, Ltd. India 83,225 359<br />
Manila Water Co., Inc. Philippines 3,169,000 911<br />
Total 2,251<br />
Total Foreign Common Stocks (Cost: $78,226) 50,552<br />
Preferred Stocks (1.7%)<br />
Information Technology (0.4%)<br />
Country<br />
Shares/<br />
$ Par<br />
Value<br />
$ (000's)<br />
Universo Online SA - UOL Brazil 62,100 196<br />
Total 196<br />
Materials (0.4%)<br />
Usinas Siderurgicas de Minas<br />
Gerais SA - Class A Brazil 17,000 194<br />
Total 194<br />
Utilities (0.9%)<br />
Eletropaulo Metropolitana SA -<br />
Class B Brazil 43,560 480<br />
Total 480<br />
Total Preferred Stocks<br />
(Cost: $1,602) 870<br />
86 Emerging Markets Equity Portfolio<br />
The Accompanying Notes are an Integral Part of the Financial Statements.
Emerging Markets Equity Portfolio<br />
Foreign Common Stocks<br />
(96.5%) Country<br />
Shares/<br />
$ Par<br />
Value<br />
$ (000's)<br />
Total Investments<br />
(98.2%) (Cost:<br />
$79,828)(a) 51,422<br />
Other Assets, Less<br />
Liabilities (1.8%) 964<br />
Net Assets (100.0%) 52,386<br />
* Non-Income Producing<br />
ADR after the name of a security represents—American Depositary Receipt.<br />
(a)<br />
At December 31, 2008 the aggregate cost of securities for federal tax purposes (in thousands) was $81,068 and the net unrealized depreciation of<br />
investments based on that cost was $29,646 which is comprised of $1,224 aggregate gross unrealized appreciation and $30,870 aggregate gross unrealized<br />
depreciation.<br />
Investments Percentage by Country is based on Net Assets:<br />
Brazil 13.5%<br />
Hong Kong 9.9%<br />
Taiwan 9.6%<br />
South Africa 9.1%<br />
Russia 7.1%<br />
China 6.7%<br />
Mexico 6.3%<br />
South Korea 6.0%<br />
Israel 5.4%<br />
Other 26.4%<br />
Total 100.0%<br />
(h) Forward foreign currency contracts outstanding on December 31, 2008<br />
Principal<br />
Amount<br />
Covered by<br />
Contract (000's)<br />
Unrealized<br />
Appreciation<br />
(000's)<br />
Unrealized<br />
(Depreciation)<br />
(000's)<br />
Net Unrealized<br />
Appreciation/<br />
(Depreciation)<br />
(000's)<br />
Settlement<br />
Type<br />
Month<br />
Buy TRY 853 5/09 $ 30 $ — $ 30<br />
Sell TRY 853 5/09 — (35) (35 )<br />
$ 30 $ (35) $ (5)<br />
TRY - Turkish Lira<br />
(l)<br />
As of December 31, 2008, portfolio securities with an aggregate value of $30,139 (in thousands) were fair valued under procedures adopted by the Board of<br />
Directors.<br />
(m) Amount is less than one thousand.<br />
(n)<br />
At December 31, 2008 portfolio securities with a aggregate value of $264 (in thousands) were valued with reference to securities whose values are more<br />
readily available.<br />
The Accompanying Notes are an Integral Part of the Financial Statements.<br />
Emerging Markets Equity Portfolio 87
Money Market Portfolio<br />
Objective: Portfolio Strategy: Net Assets:<br />
Maximum current income consistent Invest in high quality, short-term money market<br />
$623 million<br />
with liquidity and stability of capital. instruments that present minimal credit risk.<br />
Portfolio Overview<br />
Mason Street Advisors acts as the investment adviser for the Money Market Portfolio. The Portfolio’s investment objective is<br />
to generate maximum current income consistent with liquidity and stability of capital. The Money Market Portfolio, which<br />
invests only in high-quality commercial paper and other short-term debt securities with maturities generally not exceeding one<br />
year, seeks to provide a moderate return in line with prevailing short-term interest rates. The Portfolio will attempt to<br />
maximize its return by trading to take advantage of changing money market conditions and trends.<br />
The Money Market Portfolio will also trade to take advantage of what are believed to be disparities in yield relationships<br />
between different money market instruments. This procedure may increase or decrease the Portfolio’s yield depending upon<br />
management’s ability to correctly time and execute such transactions. The Money Market Portfolio may only invest in<br />
securities that mature in 397 days or fewer from the date of purchase.<br />
Market Overview<br />
The spiraling sub-prime credit crisis took an incredible toll on U.S. financial institutions, the economy and financial markets in<br />
2008. Nowhere was this as evident as in the fixed income markets, where risk aversion, deleveraging and fear of deflation sent<br />
segments of the Treasury market to their best year ever, while credit-sensitive bonds endured historic underperformance. In<br />
that environment, the Federal Reserve took dramatic steps, effectively cutting its short-term rate target to 0%, intervening in<br />
the mortgage, commercial, and consumer debt markets, while Congress passed the $700 billion Troubled Asset Relief Program<br />
(TARP).<br />
The year also held a number of important developments for money market investors. First, the Fed’s rate cuts (from 4.25% to<br />
effectively 0%) signaled dramatically lower yields on cash-equivalent investments. Second, the freezing of credit markets,<br />
extreme risk aversion, and the bankruptcy of Lehman Brothers were precipitating factors in a large, institutional money market<br />
fund seeing its net asset value per share fall below $1. In response, the government took significant steps to support money<br />
market funds and the short-term commercial paper market in which many money funds invest.<br />
Looking at returns in that environment, money market investments managed modest returns, and were one of very few asset<br />
classes to enjoy positive performance in 2008. For the full year, cash-like investments returned 2.06%, as measured by the<br />
Merrill Lynch 3-Month T-Bill Index, while stocks and bonds returned –37.00% and 7.02%, as measured by the S&P 500 ®<br />
Stock Index and Citigroup U.S. Broad Investment Grade Bond Index, respectively.<br />
Portfolio Results<br />
For the twelve months ended December 31, 2008, the Portfolio returned 2.76%, outperforming the Merrill Lynch<br />
3-Month Treasury Bill (T-Bill) Index, which returned 2.06%. The average return of the Portfolio’s Money Market Funds peer<br />
group was 2.23%, according to Lipper Analytical Services, Inc., an independent mutual fund ranking agency.<br />
The Portfolio’s outperformance relative to the peer group likely resulted from effective management of the Portfolio’s<br />
weighted average maturity (WAM) and efforts to avoid problem areas or securities at risk of substantial write-downs.<br />
In terms of Portfolio positioning, we helped performance relative to our Index and peers by maintaining a longer-than-average<br />
WAM all year. It is beneficial to have a longer WAM when rates are falling, because it allows the Portfolio to lock in higher<br />
yields for a longer time. In addition, we lengthened the Portfolio’s WAM aggressively in September—buying nine-month<br />
Treasuries at very attractive yields—and again in November, ahead of the typical, seasonal decline in commercial paper yields<br />
at year-end. These trades helped support the Portfolio’s yield at a time when the Fed rapidly accelerated the pace of rate cuts.<br />
We should also point out that despite the problems that affected some other money market funds, we maintained a stable $1<br />
share price, benefiting from the careful monitoring process and risk controls we have in place. What’s more, we enjoyed<br />
positive cash flows in this period, allowing us to take advantage of attractive securities and valuations as other funds were<br />
selling.<br />
88 Money Market Portfolio
Money Market Portfolio<br />
Outlook<br />
As the challenging economic and financial conditions continue into 2009, we believe the Fed will hold short-term rates near<br />
zero for the foreseeable future. In that environment, we are taking a number of steps designed to maintain a competitive,<br />
positive yield. First, we envision avoiding investments in securities with negative yields, as we saw on some T-Bills in late<br />
2008. As a result, we anticipate that the Portfolio will maintain a positive but modest yield. Second, we will continue to<br />
carefully monitor the quality and health of the issuers whose securities we hold, relying on our compliance and credit<br />
processes and controls. Finally, beginning on December 31, 2008, we waived the Portfolio’s management fee on a temporary<br />
basis. We will continue to monitor the need for this waiver in light of market and economic developments, and may<br />
discontinue the waiver at any time.<br />
AN INVESTMENT IN THE MONEY MARKET PORTFOLIO IS NOT INSURED OR GUARANTEED<br />
BY THE FEDERAL DEPOSIT INSURANCE CORPORATION OR ANY OTHER GOVERNMENT<br />
AGENCY. ALTHOUGH THE MONEY MARKET PORTFOLIO SEEKS TO PRESERVE THE VALUE<br />
OF YOUR INVESTMENT AT $1.00 PER SHARE, IT IS POSSIBLE TO LOSE MONEY BY INVESTING<br />
IN THE MONEY MARKET PORTFOLIO.<br />
Money Market Portfolio 89
Money Market Portfolio<br />
<strong>Northwestern</strong> <strong>Mutual</strong> Series Fund, Inc.<br />
Schedule of Investments<br />
December 31, 2008<br />
Money Market<br />
Investments (99.8%)<br />
Aircraft (4.8%)<br />
Shares/<br />
$ Par<br />
Value<br />
$ (000's)<br />
Kitty Hawk Funding<br />
Corp., 0.60%, 2/2/09 8,000,000 7,996<br />
Kitty Hawk Funding<br />
Corp., 1.40%, 1/6/09 6,000,000 5,999<br />
Kitty Hawk Funding<br />
Corp., 1.40%, 2/24/09 10,000,000 9,979<br />
Textron Financial Corp.,<br />
6.75%, 1/13/09 6,000,000 5,986<br />
Total 29,960<br />
Asset-Backed Securities (3.5%)<br />
Nissan Auto Receivables<br />
Owner Trust, Series<br />
2008-C, Class A1,<br />
3.037%, 12/15/09 10,000 10,000<br />
Volkswagen Auto Loan<br />
Enhanced Trust, Series<br />
2008-2, Class A1,<br />
2.358%, 1/20/10 12,000 12,000<br />
Total 22,000<br />
Autos (6.9%)<br />
American Honda Finance<br />
Corp.,<br />
2.319%, 5/5/09 144A 4,670,000 4,670<br />
American Honda Finance<br />
Corp.,<br />
2.989%, 8/26/09 144A 5,300,000 5,300<br />
American Honda Finance<br />
Corp.,<br />
4.389%, 1/8/09 144A 9,300,000 9,300<br />
Toyota Motor Credit<br />
Corp., 2.05%, 1/21/09 7,500,000 7,491<br />
Toyota Motor Credit<br />
Corp., 2.05%, 1/27/09 8,000,000 7,988<br />
Toyota Motor Credit<br />
Corp., 3.20%, 3/27/09 8,500,000 8,436<br />
Total 43,185<br />
Commercial Banks Non-US (7.7%)<br />
Bank of Scotland PLC,<br />
1.868%, 10/9/09 144A 3,400,000 3,400<br />
Barclays Bank PLC/New<br />
York, 2.446%, 2/27/09 10,100,000 10,100<br />
Barclays US Funding<br />
Corp., 2.43%, 3/13/09 13,000,000 12,938<br />
Royal Bank of<br />
Canada/New York NY,<br />
5.29%, 2/2/09 5,000,000 5,012<br />
Royal Bank Of Scotland<br />
PLC, 3.46%, 2/4/09 12,000,000 11,961<br />
UBS AG/Stamford<br />
Branch, 1.03%, 4/19/09 4,465,000 4,465<br />
Total 47,876<br />
Money Market<br />
Investments (99.8%)<br />
Shares/<br />
$ Par<br />
Value<br />
$ (000's)<br />
Federal Home Loan<br />
Bank Corp.,<br />
1.80%, 5/13/09 25,000,000 24,835<br />
Federal National<br />
Mortgage Association,<br />
1.95%, 1/26/09 25,000,000 24,966<br />
Total 49,801<br />
Finance Lessors (8.6%)<br />
(q) International Lease<br />
Finance Corp.,<br />
3.50%, 4/1/09 6,560,000 6,228<br />
Ranger Funding Co.<br />
LLC, 0.45%, 4/3/09 7,000,000 6,992<br />
Ranger Funding Co.<br />
LLC, 1.25%, 3/18/09 5,000,000 4,987<br />
Ranger Funding Co.<br />
LLC, 1.40%, 2/23/09 12,000,000 11,975<br />
Thunder Bay Funding<br />
LLC, 0.75%, 3/10/09 12,000,000 11,983<br />
Thunder Bay Funding<br />
LLC, 1.50%, 1/9/09 8,000,000 7,997<br />
Thunder Bay Funding<br />
LLC, 1.55%, 1/22/09 3,500,000 3,497<br />
Total 53,659<br />
Finance Services (23.7%)<br />
Alpine Securitization<br />
Corp., 1.25%, 1/22/09 6,000,000 5,996<br />
Alpine Securitization<br />
Corp., 1.35%, 1/7/09 6,000,000 5,999<br />
Alpine Securitization<br />
Corp., 1.35%, 1/9/09 5,000,000 4,998<br />
Atlantic Asset<br />
Securitization LLC,<br />
1.40%, 1/12/09 10,000,000 9,996<br />
Atlantic Asset<br />
Securitization LLC,<br />
1.50%, 2/4/09 14,000,000 13,980<br />
Barton Capital LLC,<br />
0.70%, 4/9/09 5,200,000 5,190<br />
Barton Capital LLC,<br />
0.75%, 1/15/09 1,700,000 1,699<br />
Barton Capital LLC,<br />
1.45%, 1/7/09 6,000,000 5,998<br />
Barton Capital LLC,<br />
1.50%, 1/13/09 8,000,000 7,996<br />
Bryant Park Funding<br />
LLC, 0.45%, 3/16/09 4,500,000 4,496<br />
Bryant Park Funding<br />
LLC, 0.75%, 1/8/09 6,300,000 6,299<br />
Bryant Park Funding<br />
LLC, 1.55%, 1/14/09 7,500,000 7,496<br />
Bryant Park Funding<br />
LLC, 2.00%, 1/2/09 4,000,000 4,000<br />
Money Market Shares/ Value<br />
Investments (99.8%) $ Par $ (000's)<br />
Finance Services continued<br />
Ciesco LLC,<br />
1.55%, 1/20/09 7,000,000 6,994<br />
Ciesco LLC,<br />
0.25%, 1/15/09 1,600,000 1,600<br />
Ciesco LLC,<br />
1.60%, 1/30/09 7,000,000 6,991<br />
Falcon Asset<br />
Securitization Co.<br />
LLC, 0.70%, 2/10/09 5,200,000 5,196<br />
Falcon Asset<br />
Securitization Co.<br />
LLC, 1.10%, 2/11/09 8,500,000 8,489<br />
Falcon Asset<br />
Securitization Co.<br />
LLC, 1.40%, 1/16/09 2,160,000 2,159<br />
Falcon Asset<br />
Securitization Co.<br />
LLC, 1.50%, 2/6/09 8,000,000 7,988<br />
Gemini Securitization<br />
Corp. LLC,<br />
1.30%, 1/12/09 5,200,000 5,198<br />
Gemini Securitization<br />
Corp. LLC,<br />
1.75%, 1/23/09 6,800,000 6,793<br />
Gemini Securitization<br />
Corp. LLC,<br />
1.90%, 2/18/09 6,000,000 5,985<br />
Gemini Securitization<br />
Corp. LLC,<br />
2.05%, 2/5/09 6,000,000 5,988<br />
Total 147,524<br />
Government (9.5%)<br />
US Treasury N/B,<br />
4.875%, 8/15/09 17,000,000 17,352<br />
US Treasury N/B,<br />
6.00%, 8/15/09 40,700,000 41,860<br />
Total 59,212<br />
Miscellaneous Business Credit Institutions<br />
(5.6%)<br />
General Electric Capital<br />
Corp., 1.40%, 3/23/09 10,000,000 9,969<br />
General Electric Capital<br />
Corp., 1.971%, 2/2/09 10,700,000 10,700<br />
Park Avenue<br />
Receivables Corp.,<br />
1.40%, 2/12/09 6,000,000 5,990<br />
Park Avenue<br />
Receivables Corp.,<br />
2.00%, 1/5/09 8,000,000 7,998<br />
Total 34,657<br />
The Accompanying Notes are an Integral Part of the Financial Statements.<br />
90 Money Market Portfolio
Money Market Portfolio<br />
Money Market<br />
Investments (99.8%)<br />
Shares/<br />
$ Par<br />
National Commercial Banks (1.9%)<br />
Value<br />
$ (000's)<br />
Bank of America NA,<br />
0.30%, 1/16/09 11,800,000 11,799<br />
Total 11,799<br />
Other Holdings (–%)<br />
<strong>Northwestern</strong> <strong>Mutual</strong> Life<br />
Insurance Co. Capital<br />
Support Agreement,<br />
0.00%, 7/19/09 23,570,000 –<br />
Total –<br />
Personal Credit Institutions (6.3%)<br />
American Express Bank<br />
FSB, .568%, 6/22/09 8,000,000 7,970<br />
(q) Associates Corp. of<br />
North America,<br />
8.55%, 7/15/09 7,010,000 7,001<br />
HSBC Finance Corp.,<br />
1.50%, 2/3/09 10,000,000 9,986<br />
HSBC Finance Corp.,<br />
1.75%, 1/29/09 6,000,000 5,992<br />
HSBC Finance Corp.,<br />
2.05%, 1/28/09 8,000,000 7,988<br />
Total 38,937<br />
Security Brokers and Dealers (2.2%)<br />
The Goldman Sachs<br />
Group, Inc.,<br />
1.625%, 6/19/09 3,827,000 3,815<br />
(q) The Goldman Sachs<br />
Group, Inc.,<br />
3.875%, 1/15/09 10,000,000 9,996<br />
Total 13,811<br />
Short Term Business Credit (11.1%)<br />
Caterpillar Financial<br />
Services Corp.,<br />
2.259%, 3/10/09 10,970,000 10,970<br />
Liberty Street Funding<br />
LLC, 0.55%, 2/17/09 7,000,000 6,995<br />
Liberty Street Funding<br />
LLC, 1.65%, 1/6/09 7,500,000 7,498<br />
Liberty Street Funding<br />
LLC, 2.10%, 2/13/09 6,000,000 5,985<br />
Money Market Shares/ Value<br />
Investments (99.8%) $ Par $ (000's)<br />
Short Term Business Credit continued<br />
Old Line Funding LLC,<br />
0.60%, 2/17/09 5,000,000 4,996<br />
Old Line Funding LLC,<br />
0.65%, 3/20/09 2,700,000 2,696<br />
Old Line Funding LLC,<br />
1.65%, 3/2/09 12,000,000 11,967<br />
Sheffield Receivables<br />
Corp., 0.65%, 2/2/09 6,000,000 5,997<br />
Sheffield Receivables<br />
Corp., 1.20%, 1/5/09 2,800,000 2,800<br />
Sheffield Receivables<br />
Corp., 1.65%, 3/4/09 9,000,000 8,974<br />
Total 68,878<br />
(q)<br />
Total Money Market<br />
Investments<br />
(Cost: $621,786) 621,299<br />
Total Investments (99.8%)<br />
(Cost: $621,786)(a) 621,299<br />
Other Assets, Less<br />
Liabilities (0.2%) 1,321<br />
Net Assets (100.0%) 622,620<br />
144A after the name of a security represents<br />
A security exempt from registration under<br />
Rule 144A of the Securities Act of 1933.<br />
These securities may be resold as transactions<br />
exempt from registration, normally to<br />
qualified institutional buyers. At<br />
December 31, 2008 the value of these<br />
securities (in thousands) was $22,670,<br />
representing 3.64% of the net assets.<br />
Security covered by Capital Support<br />
Agreement.<br />
The Accompanying Notes are an Integral Part of the Financial Statements.<br />
Money Market Portfolio 91
Short-Term Bond Portfolio<br />
Objective: Portfolio Strategy: Net Assets:<br />
Provide as high a level of current income<br />
as is consistent with prudent investment<br />
risk.<br />
Invest primarily in a diversified portfolio of high<br />
quality debt securities.<br />
$70 million<br />
Portfolio Overview<br />
Mason Street Advisors acts as the investment adviser for the Short-Term Bond Portfolio. The primary investment objective of<br />
the Portfolio is to provide as high a level of current income as is consistent with prudent investment risk. Normally, the<br />
Portfolio invests at least 80% of net assets (plus any borrowings for investment purposes) in a diversified portfolio of<br />
investment grade debt securities. Investment grade securities are securities rated “investment grade” by at least one qualified<br />
rating agency or, if unrated, determined by the Portfolio’s Adviser to be of comparable quality. The Portfolio may invest up to<br />
20% of net assets in non-investment grade, high yield/high risk bonds (so called “junk bonds”). Also, the Portfolio may invest<br />
up to 30% of net assets in foreign securities, consistent with its investment objective. Under normal market conditions, the<br />
Portfolio attempts to maintain a duration (the Portfolio’s sensitivity to changes in interest rates) of between one and three<br />
years. The Portfolio may invest in mortgage-and asset-backed securities. Securities are selected primarily based upon rigorous<br />
analysis of interest rates, the economy, and credit and call risks. Both a top-down and bottom-up investment approach is used<br />
to construct the portfolio of investments. The top-down investment approach involves an evaluation of the overall economic<br />
environment and its potential for performance based on economic and business cycles. The bottom-up investment approach<br />
focuses on fundamental research of issuers to identify issuers that appear to have strong relative credit quality, solid balance<br />
sheets, improving company specific fundamentals, and free cash flow. The proportion of the Portfolio’s assets committed to<br />
investments in securities with particular characteristics (such as quality, sector, interest rate or maturity) varies based on<br />
economic outlook, the financial markets and other factors.<br />
Market Overview<br />
The spiraling sub-prime credit crisis took an incredible toll on U.S. financial institutions, the economy and financial markets in<br />
2008. Nowhere was this as evident as in the fixed income markets, where risk aversion, deleveraging and fear of deflation sent<br />
segments of the Treasury market to their best year ever, while credit-sensitive bonds endured historic underperformance.<br />
Economic conditions deteriorated sharply over the course of the year, as the economy entered its first recession since 2002. In<br />
that environment, the Federal Reserve took dramatic steps, effectively cutting its short-term rate target to 0%, intervening in<br />
the mortgage, commercial, and consumer debt markets, while Congress passed the $700 billion Troubled Asset Relief Program<br />
(TARP). Against that backdrop, the Citigroup U.S. Broad Investment Grade (BIG) Bond Index (a broad-based bond index)<br />
rose 7.02%, led by gains in Treasury and government-backed mortgage debt, while corporate bonds endured their worst year<br />
ever, according to Merrill Lynch.<br />
Portfolio Results<br />
For the twelve months ended December 31, 2008, the Short-Term Bond Portfolio had a total return of 2.71%. By comparison,<br />
the Barclays Capital U.S. Aggregate 1-3 Year Government/Corporate Index returned 4.62%. (This Index is unmanaged, cannot<br />
be invested in directly and does not include administrative expenses or sales charges.) The average return for the Portfolio’s<br />
peer group, Short-Intermediate Investment-Grade Debt Funds, was –2.43%, according to Lipper Analytical Services, Inc.<br />
(Lipper), an independent mutual fund ranking agency.<br />
The Portfolio’s performance relative to its peers and Index can largely be explained by its sector allocation. Almost two-thirds<br />
of the Index was weighted toward Treasury and government agency bonds, which were the best-performing segment of the<br />
market in 2008. Meanwhile, the Portfolio and Lipper peer group invested across the investment grade fixed income spectrum.<br />
In 2008, corporate, mortgage-, and asset-backed securities significantly underperformed government bonds, and the Portfolio<br />
had more of these credit-sensitive securities than the Index, but presumably less than many of its peers.<br />
We manage the Portfolio using a patient, long-term relative value approach to investing, looking for the best values across the<br />
fixed income market, looking to buy assets with the best risk/reward trade-offs we can find. As a result of that approach, we<br />
were significantly underweight Treasury bonds in 2008, particularly late in the year as Treasury yields approached record<br />
lows. In addition, many of the Treasuries we did hold tended to be inflation-protected securities. Those decisions detracted<br />
from performance relative to the Index because plain-vanilla Treasury bonds outperformed every other asset class in 2008,<br />
including inflation-adjusted Treasuries. Nevertheless, we thought this positioning made sense because we reduced our<br />
exposure to what we believe is the last remaining asset bubble (Treasuries) and were able to buy future inflation protection at<br />
what we considered cheap prices.<br />
92 Short-Term Bond Portfolio
Short-Term Bond Portfolio<br />
A key positive contribution to performance relative to the Index and our peers was a large position (about a quarter of assets)<br />
in short-term bank paper backed by the Federal Deposit Insurance Corporation (FDIC). These bonds were issued with yields<br />
that were 150 basis points over like-maturity Treasuries, despite the fact that they too carry a government guarantee. These<br />
bonds performed very well late in 2008 when investors started looking beyond Treasury bonds to government agency-backed<br />
debt. This sort of trade exemplified our risk/reward, relative value approach at work—we were able to add significant<br />
additional yield on a large chunk of the Portfolio at little additional risk.<br />
Outlook<br />
We remain in a remarkable period where historical valuation and yield relationships in the fixed income markets are at<br />
unprecedented levels. At the sector level, this argues for a significant underweight to traditional Treasuries in favor of high<br />
quality, higher yielding paper where the government is your ally—our FDIC bonds are good examples. This is a point we<br />
cannot stress enough—there are no shortage of high quality assets trading at distressed levels. And with real questions about<br />
the likely length and depth of the recession, we see no reason to dip down into lower quality bonds. Add it all up, and we are<br />
likely to manage the Portfolio’s sensitivity to interest rate and yield curve changes conservatively, while working to capitalize<br />
on relative value disparities through our sector allocation and security selection.<br />
$11,000<br />
10,800<br />
10,600<br />
10,400<br />
10,200<br />
Relative Performance<br />
10,000<br />
4/07 12/07 12/08<br />
Short-Term Bond Portfolio<br />
Barclays Capital U.S. Aggregate 1-3 Years Index**<br />
Average <strong>Annual</strong> Total Returns<br />
For Periods Ended December 31, 2008<br />
1 Year<br />
Since<br />
Inception*<br />
Short-Term Bond Portfolio 2.71% 3.49%<br />
Barclays Capital U.S. Aggregate 1-3<br />
Years Index** 4.62% 5.66%<br />
Lipper Variable Insurance Products<br />
(VIP) Short-Intermediate<br />
Investment Grade Debt Funds<br />
Average -2.43% –<br />
*Inception date of 4/30/07<br />
** Prior to November 1, 2008, the Barclays Capital U.S. Aggregate<br />
1-3 Years Index was known as the Lehman Brothers U.S. Aggregate<br />
1-3 Years Index.<br />
The performance data quoted represents past<br />
performance. Past performance is historical and does<br />
not guarantee future performance. Investment return<br />
and principal value will fluctuate, so that shares, when<br />
redeemed, may be worth more or less than their original<br />
cost. Current performance may be lower or higher than<br />
the performance data quoted. For the most recent<br />
month-end performance information visit<br />
www.nmfn.com.<br />
This chart assumes an initial investment of $10,000<br />
made on 4/30/07 (commencement of the Portfolio's<br />
operations). Returns shown reflect fee waivers,<br />
deductions for management and other portfolio<br />
expenses, and reinvestment of all dividends. In the<br />
absence of fee waivers, total return would be reduced.<br />
Returns exclude deductions for separte account sale<br />
loads and account fees. Please refer to the Benchmark<br />
Definitions section of this report for information about<br />
the indices cited in the above chart and graph.<br />
Return of principal is not guaranteed. Bond funds have<br />
the same interest rate, inflation and credit risks that are<br />
associated with the underlying bonds owned by the<br />
Portfolio. When interest rates rise, bond prices fall. With<br />
a fixed income fund, when interest rates rise, the value<br />
of the fund’s existing bonds drops, which could<br />
negatively affect overall fund performance.<br />
Short-Term Bond Portfolio 93
Short-Term Bond Portfolio<br />
Top 10 Fixed Income Holdings 12/31/08<br />
Security Description<br />
% of Net Assets<br />
Federal National Mortgage Association, Various 8.0%<br />
Federal National Mortgage Association,<br />
3.875%, 7/12/13 7.6%<br />
US Treasury, Various 6.9%<br />
Wells Fargo Mortgage Backed Securities Trust,<br />
Series 2004-N, Class A6, 4.00%, 8/25/34 4.7%<br />
John Deere Owner Trust, Various 3.3%<br />
Banc of America Mortgage Securities,<br />
Inc., Series 2004-G, Class 2A6,<br />
4.648%, 8/25/34 2.8%<br />
Washington <strong>Mutual</strong> Commercial Mortgage<br />
Securities Trust, Various 2.6%<br />
Thornburg Mortgage Securities Trust, Series<br />
2006-1, Class A3, .641%, 1/25/46 2.3%<br />
LB-UBS Commercial Mortgage Trust, Series<br />
2001-WM, Class A2, 6.53%, 7/14/16 2.1%<br />
Bank of America Corp., Various 1.9%<br />
Sector Allocation 12/31/08<br />
Investment Grade<br />
Segment<br />
4%<br />
Short-Term Investments<br />
& Other Net Assets<br />
3%<br />
Governments<br />
14%<br />
Structured<br />
Products<br />
45%<br />
Corporate<br />
Bonds<br />
33%<br />
Sector Allocation is based on Net Assets.<br />
Sector Allocation and Top 10 Holdings are subject to<br />
change.<br />
The Corporate Bonds sector includes bonds of companies<br />
and governments headquartered outside the United States.<br />
The Government and Structured Product categories include<br />
domestic taxable bonds.<br />
Consistent with the Portfolio’s stated parameters, no more<br />
than 30% of the Portfolio is invested in foreign securities,<br />
and no more than 20% is invested in high yield securities.<br />
94 Short-Term Bond Portfolio
Short-Term Bond Portfolio<br />
<strong>Northwestern</strong> <strong>Mutual</strong> Series Fund, Inc.<br />
Schedule of Investments<br />
December 31, 2008<br />
Corporate Bonds (37.2%)<br />
Aerospace/Defense (1.1%)<br />
Shares/<br />
$ Par<br />
Value<br />
$ (000's)<br />
BAE Systems Holdings,<br />
Inc.,<br />
4.75%, 8/15/10 144A 250,000 249<br />
L-3 Communications<br />
Corp., 7.625%, 6/15/12 250,000 244<br />
Northrop Grumman<br />
Systems Corp.,<br />
7.125%, 2/15/11 250,000 260<br />
Total 753<br />
Auto Manufacturing (0.7%)<br />
Daimler Finance North<br />
America LLC,<br />
5.75%, 9/8/11 250,000 211<br />
Daimler Finance North<br />
America LLC,<br />
7.20%, 9/1/09 250,000 243<br />
Total 454<br />
Banking (16.9%)<br />
American Express Bank,<br />
FSB, 3.15%, 12/9/11 1,000,000 1,008<br />
Bank of America Corp.,<br />
3.125%, 6/15/12 1,000,000 1,039<br />
Bank of America Corp.,<br />
4.50%, 8/1/10 250,000 250<br />
Bank of Scotland PLC,<br />
5.625%, 7/20/09 144A 250,000 248<br />
Barclays Bank PLC,<br />
7.40%, 12/15/09 390,000 392<br />
Citigroup, Inc.,<br />
6.50%, 8/19/13 200,000 202<br />
Countrywide Home<br />
Loans, Inc.,<br />
4.125%, 9/15/09 270,000 267<br />
Credit Suisse USA, Inc.,<br />
5.50%, 8/16/11 225,000 224<br />
The Goldman Sachs<br />
Group, Inc.,<br />
3.25%, 6/15/12 1,000,000 1,043<br />
HSBC USA, Inc.,<br />
3.125%, 12/16/11 1,000,000 1,038<br />
JPMorgan Chase & Co.,<br />
4.75%, 5/1/13 250,000 247<br />
KeyBank NA,<br />
3.20%, 6/15/12 1,000,000 1,039<br />
Mellon Funding Corp.,<br />
3.25%, 4/1/09 185,000 184<br />
Merrill Lynch & Co.,<br />
4.25%, 2/8/10 35,000 34<br />
Merrill Lynch & Co.,<br />
4.79%, 8/4/10 215,000 209<br />
Morgan Stanley,<br />
6.60%, 4/1/12 250,000 242<br />
National City Corp.,<br />
3.125%, 4/30/09 300,000 294<br />
Corporate Bonds (37.2%)<br />
Shares/<br />
$ Par<br />
Value<br />
$ (000's)<br />
Banking continued<br />
PNC Funding Corp.,<br />
2.30%, 6/22/12 1,000,000 1,010<br />
PNC Funding Corp.,<br />
7.50%, 11/1/09 250,000 250<br />
Regions Bank,<br />
3.25%, 12/9/11 1,000,000 1,040<br />
SunTrust Bank,<br />
3.00%, 11/16/11 1,000,000 1,034<br />
U.S. Bancorp,<br />
4.50%, 7/29/10 250,000 249<br />
Wells Fargo Bank NA,<br />
7.55%, 6/21/10 268,000 279<br />
Total 11,822<br />
Cable/Media/Broadcasting/Satellite (1.0%)<br />
CBS Corp.,<br />
7.70%, 7/30/10 250,000 244<br />
Comcast Corp.,<br />
5.45%, 11/15/10 250,000 247<br />
Viacom, Inc.,<br />
5.75%, 4/30/11 250,000 227<br />
Total 718<br />
Consumer Products (0.2%)<br />
Colgate-Palmolive Co.,<br />
4.20%, 5/15/13 125,000 128<br />
Total 128<br />
Electric Utilities (3.7%)<br />
Appalachian Power Co.,<br />
6.60%, 5/1/09 138,000 137<br />
Consolidated Edison Co.<br />
of New York,<br />
3.85%, 6/15/13 250,000 236<br />
Consumers Energy Co.,<br />
4.80%, 2/17/09 250,000 249<br />
The Detroit Edison Co.,<br />
6.125%, 10/1/10 250,000 251<br />
Duke Energy Carolinas<br />
LLC, 4.50%, 4/1/10 250,000 250<br />
Florida Power Corp.,<br />
4.50%, 6/1/10 250,000 248<br />
Nevada Power Co.,<br />
6.50%, 4/15/12 250,000 239<br />
Pacific Gas & Electric<br />
Co., 3.60%, 3/1/09 250,000 249<br />
PacifiCorp,<br />
5.45%, 9/15/13 250,000 256<br />
PPL Electric Utilities<br />
Corp., 6.25%, 8/15/09 250,000 251<br />
Virginia Electric and<br />
Power Co.,<br />
4.50%, 12/15/10 250,000 247<br />
Total 2,613<br />
Corporate Bonds (37.2%)<br />
Shares/<br />
$ Par<br />
Value<br />
$ (000's)<br />
Electronics (0.5%)<br />
IBM International Group<br />
Capital LLC,<br />
5.05%, 10/22/12 325,000 339<br />
Total 339<br />
Food Processors (0.4%)<br />
Kraft Foods, Inc.,<br />
5.625%, 11/1/11 155,000 159<br />
Kraft Foods, Inc.,<br />
6.25%, 6/1/12 95,000 98<br />
Total 257<br />
Gas Pipelines (0.7%)<br />
Enterprise Products<br />
Operating LP,<br />
4.625%, 10/15/09 250,000 242<br />
Kinder Morgan Energy<br />
Partners, L.P.,<br />
6.30%, 2/1/09 250,000 250<br />
Total 492<br />
Independent Finance (2.2%)<br />
American General Finance<br />
Corp., 4.625%, 5/15/09 250,000 214<br />
General Electric Capital<br />
Corp., 3.00%, 12/9/11 1,000,000 1,034<br />
General Electric Capital<br />
Corp., 5.25%, 10/19/12 25,000 25<br />
(n) General Motors<br />
Acceptance Corp. LLC,<br />
7.50%, 12/31/13 144A 10,000 7<br />
General Motors<br />
Acceptance Corp. LLC,<br />
7.75%, 1/19/10 100,000 89<br />
(n) General Motors<br />
Acceptance Corp. LLC,<br />
8.00%, 12/31/18 144A 12,000 6<br />
International Lease<br />
Finance Corp.,<br />
5.45%, 3/24/11 250,000 184<br />
Total 1,559<br />
Industrials - Other (0.3%)<br />
D.R. Horton, Inc.,<br />
7.875%, 8/15/11 250,000 215<br />
Total 215<br />
Oil and Gas (1.3%)<br />
Anadarko Finance Co.,<br />
6.75%, 5/1/11 250,000 250<br />
Burlington Resources<br />
Finance Co.,<br />
6.40%, 8/15/11 250,000 257<br />
Devon Financing Corp.<br />
ULC, 6.875%, 9/30/11 250,000 252<br />
The Accompanying Notes are an Integral Part of the Financial Statements.<br />
Short-Term Bond Portfolio 95
Short-Term Bond Portfolio<br />
Corporate Bonds (37.2%)<br />
Shares/<br />
$ Par<br />
Value<br />
$ (000's)<br />
Oil and Gas continued<br />
Tesoro Corp.,<br />
6.25%, 11/1/12 250,000 172<br />
Total 931<br />
Other Finance (1.5%)<br />
Capmark Financial Group,<br />
Inc., 5.875%, 5/10/12 100,000 34<br />
John Deere Capital Corp.,<br />
2.875%, 6/19/12 1,000,000 1,029<br />
Total 1,063<br />
Paper and Forest Products (0.4%)<br />
International Paper Co.,<br />
4.00%, 4/1/10 250,000 241<br />
Total 241<br />
Railroads (1.3%)<br />
Burlington Northern Santa<br />
Fe Corp.,<br />
6.125%, 3/15/09 250,000 250<br />
Canadian National<br />
Railway Co.,<br />
4.25%, 8/1/09 198,000 198<br />
Norfolk Southern Corp.,<br />
6.75%, 2/15/11 237,000 240<br />
Union Pacific Corp.,<br />
3.875%, 2/15/09 250,000 250<br />
Total 938<br />
Real Estate Investment Trusts (1.1%)<br />
AvalonBay Communities,<br />
Inc., 7.50%, 8/1/09 390,000 377<br />
Duke Realty LP,<br />
5.625%, 8/15/11 250,000 194<br />
Simon Property Group LP,<br />
5.375%, 6/1/11 250,000 211<br />
Total 782<br />
Retail Food and Drug (0.7%)<br />
CVS/Caremark Corp.,<br />
4.00%, 9/15/09 250,000 247<br />
Safeway, Inc.,<br />
7.50%, 9/15/09 250,000 254<br />
Total 501<br />
Retail Stores (1.1%)<br />
The Home Depot, Inc.,<br />
4.625%, 8/15/10 250,000 247<br />
J.C. Penney Corp.,<br />
8.00%, 3/1/10 250,000 243<br />
Macy's Retail Holdings,<br />
Inc., 6.30%, 4/1/09 250,000 244<br />
Total 734<br />
Telecommunications (1.8%)<br />
AT&T, Inc.,<br />
4.125%, 9/15/09 293,000 294<br />
Deutsche Telekom<br />
International Finance<br />
BV, 8.00%, 6/15/10 250,000 258<br />
Corporate Bonds (37.2%)<br />
Shares/<br />
$ Par<br />
Value<br />
$ (000's)<br />
Telecommunications continued<br />
Rogers Wireless, Inc.,<br />
9.625%, 5/1/11 200,000 209<br />
Sprint Capital Corp.,<br />
7.625%, 1/30/11 250,000 209<br />
Vodafone Group PLC,<br />
7.75%, 2/15/10 250,000 255<br />
Total 1,225<br />
Vehicle Parts (0.3%)<br />
Johnson Controls, Inc.,<br />
5.25%, 1/15/11 250,000 230<br />
Total 230<br />
Total Corporate Bonds<br />
(Cost: $26,305) 25,995<br />
Governments (14.5%)<br />
Governments (14.5%)<br />
Federal National<br />
Mortgage Association,<br />
3.875%, 7/12/13 5,000,000 5,306<br />
US Treasury,<br />
2.125%, 4/30/10 422,000 432<br />
US Treasury,<br />
2.375%, 8/31/10 1,950,000 2,009<br />
US Treasury,<br />
3.125%, 8/31/13 175,000 189<br />
US Treasury Inflation<br />
Index Bond,<br />
0.875%, 4/15/10 2,287,140 2,149<br />
Total Governments<br />
(Cost: $9,809) 10,085<br />
Structured Products (45.3%)<br />
Structured Products (45.3%)<br />
Banc of America<br />
Mortgage Securities, Inc.,<br />
Series 2004-G, Class<br />
2A6, 4.648%, 8/25/34 2,000,000 1,921<br />
Capital One Multi-Asset<br />
Execution Trust, Series<br />
2007-A6, Class A6,<br />
1.265%, 5/15/13 875,000 788<br />
Capital One Prime Auto<br />
Receivables Trust, Series<br />
2006-2, Class A4,<br />
4.94%, 7/15/12 1,000,000 956<br />
Countrywide Home Loan<br />
Mortgage Pass Through<br />
Trust, Series 2005-31,<br />
Class 2A1,<br />
5.471%, 1/25/36 745,358 535<br />
Federal Home Loan<br />
Mortgage Corp.,<br />
5.00%, 4/1/18 509,296 526<br />
Structured Products<br />
(45.3%)<br />
Shares/<br />
$ Par<br />
Value<br />
$ (000's)<br />
Structured Products continued<br />
(b)Federal Home Loan<br />
Mortgage Corp., Series<br />
2439, Class LH,<br />
6.00%, 4/15/32 500,000 515<br />
Federal Home Loan<br />
Mortgage Corp.,<br />
7.00%, 12/1/35 707,674 738<br />
Federal National<br />
Mortgage Association,<br />
5.00%, 5/1/20 1,577,807 1,624<br />
Federal National<br />
Mortgage Association,<br />
6.00%, 8/1/22 1,701,507 1,768<br />
Federal National<br />
Mortgage Association,<br />
6.50%, 12/1/37 1,801,853 1,874<br />
(b)Federal National<br />
Mortgage Association,<br />
6.50%, 9/1/38 335,515 349<br />
First Union National Bank<br />
Commercial Mortgage<br />
Trust, Series 1999-C4,<br />
Class E,<br />
7.939%, 12/15/31 144A 1,000,000 945<br />
John Deere Owner Trust,<br />
Series 2008-A, Class A4,<br />
4.89%, 3/16/15 1,000,000 906<br />
John Deere Owner Trust,<br />
Series 2007-A, Class A3,<br />
5.04%, 7/15/11 847,264 842<br />
John Deere Owner Trust,<br />
Series 2007-A, Class A4,<br />
5.07%, 4/15/14 1,500,000 1,428<br />
LB-UBS Commercial<br />
Mortgage Trust, Series<br />
2003-C7, Class A2,<br />
4.064%, 9/15/27 150,024 145<br />
LB-UBS Commercial<br />
Mortgage Trust, Series<br />
2001-WM, Class A2,<br />
6.53%, 7/14/16 144A 1,500,000 1,457<br />
MBNA Master Credit<br />
Card Trust, Series 2000-<br />
E, Class A,<br />
7.80%, 10/15/12 700,000 706<br />
Morgan Stanley Capital I,<br />
Inc., Series 1999-FNV1,<br />
Class C, 6.80%, 3/15/31 1,000,000 997<br />
Morgan Stanley Dean<br />
Witter Capital I, Inc.,<br />
Series 2000-LIF2, Class<br />
A2, 7.20%, 10/15/33 192,362 191<br />
Nissan Auto Receivables<br />
Owner Trust, Series<br />
2005-C, Class A4,<br />
4.31%, 3/15/11 507,791 502<br />
Nissan Auto Receivables<br />
Owner Trust, Series<br />
2006-A, Class A4,<br />
4.77%, 7/15/11 1,000,000 990<br />
The Accompanying Notes are an Integral Part of the Financial Statements.<br />
96 Short-Term Bond Portfolio
Short-Term Bond Portfolio<br />
Structured Products<br />
(45.3%)<br />
Shares/<br />
$ Par<br />
Value<br />
$ (000's)<br />
Structured Products continued<br />
Nordstrom Private Label<br />
Credit Card Master Note<br />
Trust, Series 2007-1A,<br />
Class A,<br />
4.92%, 5/15/13 144A 963,000 919<br />
Thornburg Mortgage<br />
Securities Trust, Series<br />
2006-5, Class A1,<br />
.591%, 9/25/46 1,009,187 836<br />
Thornburg Mortgage<br />
Securities Trust, Series<br />
2006-1, Class A3,<br />
.641%, 1/25/46 1,583,733 1,578<br />
Thornburg Mortgage<br />
Securities Trust, Series<br />
2007-2, Class A3A,<br />
1.525%, 6/25/37 794,307 662<br />
USAA Auto Owner Trust,<br />
Series 2008-2, Class A4,<br />
5.16%, 11/15/13 1,000,000 885<br />
WaMu Commercial<br />
Mortgage Securities<br />
Trust, Series 2005-C1A,<br />
Class A2,<br />
5.15%, 5/25/36 144A 979,732 947<br />
Washington <strong>Mutual</strong><br />
Commercial Mortgage<br />
Securities Trust, Series<br />
2003-C1A, Class A,<br />
3.83%, 1/25/35 144A 899,171 853<br />
Wells Fargo Mortgage<br />
Backed Securities Trust,<br />
Series 2004-N, Class A6,<br />
4.00%, 8/25/34 3,450,000 3,296<br />
World Financial<br />
Properties,<br />
6.91%, 9/1/13 144A 887,900 905<br />
Total Structured Products<br />
(Cost: $32,529) 31,584<br />
Short-Term Investments<br />
(0.7%)<br />
Shares/<br />
$ Par<br />
Value<br />
$ (000's)<br />
Federal Government & Agencies (0.3%)<br />
(b) Federal National<br />
Mortgage Association,<br />
0.20%, 3/30/09 200,000 200<br />
Total 200<br />
Miscellaneous Business Credit Institutions<br />
(0.4%)<br />
(b) Duke Energy Corp.,<br />
4.00%, 1/5/09 300,000 300<br />
Total 300<br />
Total Short-Term Investments<br />
(Cost: $500) 500<br />
Total Investments (97.7%)<br />
(Cost: $69,143)(a) 68,164<br />
Other Assets, Less<br />
Liabilities (2.3%) 1,633<br />
Net Assets (100.0%) 69,797<br />
144A after the name of a security represents a security exempt from registration under Rule 144A of the Securities Act of 1933. These securities may be<br />
resold as transactions exempt from registration, normally to qualified institutional buyers. At December 31, 2008 the value of these securities (in thousands)<br />
was $6,536, representing 9.36% of the net assets.<br />
(a)<br />
(b)<br />
At December 31, 2008 the aggregate cost of securities for federal tax purposes (in thousands) was $69,146 and the net unrealized depreciation of<br />
investments based on that cost was $982 which is comprised of $1,120 aggregate gross unrealized appreciation and $2,102 aggregate gross unrealized<br />
depreciation.<br />
All or a portion of the securities have been committed as collateral for open futures positions or when-issued securities. Information regarding open futures<br />
contracts as of period end is summarized below.<br />
Unrealized<br />
Appreciation/<br />
Number of<br />
(Depreciation)<br />
Issuer (000's)<br />
Contracts Expiration Date (000's)<br />
US Two Year Treasury Note (Long) (Total Notional Value at December 31, 2008, $1,291) 6 3/09 $ 18<br />
(n)<br />
At December 31, 2008 portfolio securities with a aggregate market value of $13 (in thousands) were valued with reference to securities whose values are<br />
more readily available.<br />
The Accompanying Notes are an Integral Part of the Financial Statements.<br />
Short-Term Bond Portfolio 97
Select Bond Portfolio<br />
Objective: Portfolio Strategy: Net Assets:<br />
Realize as high a level of total return<br />
as is consistent with prudent investment<br />
risk. A secondary objective is to seek<br />
preservation of shareholders’ capital.<br />
Invest primarily in high quality corporate bonds, U.S.<br />
government bonds and government agency securities.<br />
$1.1 billion<br />
Portfolio Overview<br />
Mason Street Advisors acts as the investment adviser for the Select Bond Portfolio. The Portfolio seeks to realize as high a<br />
level of total return as is consistent with prudent investment risk; a secondary objective is to seek preservation of shareholders’<br />
capital. The Portfolio seeks to achieve these objectives by investing at least 80% of net assets (plus any borrowings for<br />
investment purposes) in a diversified portfolio of investment grade debt securities with maturities exceeding one year. The<br />
Portfolio invests in both domestic and foreign debt securities that are rated investment grade by at least one major rating<br />
agency, or if unrated, determined by management to be of comparable quality. Up to 20% of net assets may be invested in<br />
below investment grade securities. The Portfolio is actively managed to seek to take advantage of changes in interest rates,<br />
credit quality and maturity based on management’s outlook for the economy, the financial markets and other factors.<br />
Market Overview<br />
The spiraling sub-prime credit crisis took an incredible toll on U.S. financial institutions, the economy and financial markets in<br />
2008. Nowhere was this as evident as in the fixed income markets, where risk aversion, deleveraging and fear of deflation sent<br />
segments of the Treasury market to their best year ever, while credit-sensitive bonds endured historic underperformance.<br />
Economic conditions deteriorated sharply over the course of the year, as the economy entered its first recession since 2002. In<br />
that environment, the Federal Reserve took dramatic steps, effectively cutting its short-term rate target to 0%, intervening in<br />
the mortgage, commercial, and consumer debt markets, while Congress passed the $700 billion Troubled Asset Relief Program<br />
(TARP). Against that backdrop, the Citigroup U.S. Broad Investment Grade (BIG) Bond Index (a broad-based bond index)<br />
rose 7.02%, led by gains in Treasury and government-backed mortgage debt, while corporate bonds endured their worst year<br />
ever, according to Merrill Lynch.<br />
Portfolio Results<br />
For the twelve months ended December 31, 2008, the Select Bond Portfolio had a total return of 3.26%. By comparison, the<br />
Citigroup BIG Index returned 7.02% for the year. (This Index is unmanaged, cannot be invested in directly and does not<br />
include administrative expenses or sales charges.) The average return for the Portfolio’s peer group, A-Rated Corporate Debt<br />
Funds was –5.23%, according to Lipper Analytical Services, Inc., an independent mutual fund ranking agency.<br />
Select Bond’s performance relative to its peers and Index can largely be explained by its sector allocation. Corporate,<br />
mortgage-, and asset-backed securities significantly underperformed Treasuries in 2008, and the portfolio had more of these<br />
credit-sensitive securities than the Index, but apparently less than many of its peers.<br />
We take a patient, long-term approach to investing, looking for high quality assets at attractive prices. But managing the<br />
Portfolio with an eye toward the long term carries the risk of short-term set-backs as we build positions in out-of-favor<br />
segments of the market.<br />
For example, as Treasury yields fell to record lows across the maturity spectrum, we were selling these bonds and reducing our<br />
sensitivity to interest rate changes. Similarly, the difference in yield between plain vanilla and inflation adjusted Treasuries<br />
narrowed so dramatically in the fourth quarter that it implied inflation running below 1% a year for the next ten years. And this<br />
was at a time when the Fed was taking unprecedented steps to support the economy and employing policies that we felt almost<br />
certainly would prove inflationary down the road. So, while many people were dumping inflation-adjusted bonds, we were<br />
buying them. These trades detracted from performance compared with our Index in 2008, but we reduced our exposure to what<br />
is arguably the last remaining asset bubble (Treasuries) and bought future inflation protection at what we consider cheap<br />
prices.<br />
In the mortgage slice, we took advantage of the dislocations in the market to add high quality mortgage- and asset-backed<br />
securities trading at levels once reserved for low-quality, high-yield bonds. Again, we viewed these as excellent long-term<br />
plays, though they underperformed in 2008. And while it hurt performance relative to the Index to hold more corporate bonds,<br />
we mitigated some of the poor performance by holding shorter-term, higher quality securities in more defensive sectors of the<br />
economy. Finally, the Portfolio had limited exposure to Lehman Brothers, representing less than 1% of total assets, but which<br />
still hurt performance after the investment bank’s September bankruptcy filing.<br />
98 Select Bond Portfolio
Select Bond Portfolio<br />
Outlook<br />
We remain in a remarkable period where historical valuation and yield relationships in the fixed income markets are at<br />
unprecedented levels. At the sector level, this argues for a significant underweight to traditional Treasuries in favor of high<br />
quality, higher yielding paper where the government is your ally—Fannie Mae, Freddie Mac, and FDIC bonds are all good<br />
examples. This is a point we cannot stress enough—there are no shortage of high quality assets trading at distressed levels.<br />
And with real questions about the likely length and depth of the recession, we see no reason to dip down into lower quality<br />
bonds. Add it all up, and we are likely to continue to manage the Portfolio’s price sensitivity to interest rate changes<br />
conservatively, while working to capitalize on relative value disparities through our sector allocation and security selection.<br />
Relative Performance<br />
Average <strong>Annual</strong> Total Returns<br />
For Periods Ended December 31, 2008<br />
1 Year 5 Years 10 Years<br />
Select Bond Portfolio 3.26% 4.06% 5.68%<br />
Citigroup U.S. Broad Investment<br />
Grade Index 7.02% 5.10% 5.85%<br />
Barclays Capital U.S. Aggregate<br />
Index** 5.24% 4.65% 5.63%<br />
Lipper Variable Insurance Products<br />
(VIP) Corporate Debt Funds A-<br />
Rated Average -5.23% 1.97% 3.94%<br />
** Prior to November 1, 2008, the Barclays Capital U.S. Aggregate<br />
Index was known as the Lehman Brothers U.S. Aggregate Index.<br />
This chart assumes an initial investment of $10,000<br />
made on 12/31/98. Returns shown include deductions<br />
for management and other portfolio expenses, and<br />
reinvestment of all dividends. Returns exclude<br />
deductions for separte account sale loads and account<br />
fees. Please refer to the Benchmark Definitions section<br />
of this report for information about the indices cited in<br />
the above chart and graph.<br />
Return of principal is not guaranteed. Bond funds have<br />
the same interest rate, inflation and credit risks that are<br />
associated with the underlying bonds owned by the<br />
Portfolio. When interest rates rise, bond prices fall. With<br />
a fixed income fund, when interest rates rise, the value<br />
of the fund’s existing bonds drops, which could<br />
negatively affect overall fund performance.<br />
The performance data quoted represents past<br />
performance. Past performance is historical and does<br />
not guarantee future performance. Investment return<br />
and principal value will fluctuate, so that shares, when<br />
redeemed, may be worth more or less than their original<br />
cost. Current performance may be lower or higher than<br />
the performance data quoted. For the most recent<br />
month-end performance information visit<br />
www.nmfn.com.<br />
Select Bond Portfolio 99
Select Bond Portfolio<br />
Top 10 Fixed Income Holdings 12/31/08<br />
Security Description<br />
% of Net Assets<br />
Federal National Mortgage Association, Various 26.1%<br />
Federal Home Loan Mortgage Corp., Various 11.6%<br />
US Treasury, Various 9.0%<br />
Federal Home Loan Mortgage Corp.,<br />
4.875%, 6/13/18 3.6%<br />
AEP Texas Central Transition Funding<br />
LLC, Series 2006-A, Class A5, 5.306%, 7/1/21 1.3%<br />
Banc of America Commercial Mortgage,<br />
Inc., Series 2007-2, Class A4, 5.688%, 4/10/49 0.8%<br />
US Department of Housing & Urban<br />
Development, Various 0.7%<br />
Federal National Mortgage Association<br />
Aces, Series 2006-M1, Class C,<br />
5.355%, 2/25/16 0.7%<br />
Nordstrom Private Label Credit Card Master<br />
Note Trust, Series 2007-1A, Class A,<br />
4.92%, 5/15/13 0.6%<br />
Chase Issuance Trust, Series 2007-A17, Class<br />
A, 5.12%, 10/15/14 0.6%<br />
Short-Term Investments<br />
& Other Net Assets<br />
4%<br />
Sector Allocation 12/31/08<br />
Governments<br />
14%<br />
Corporate Bonds<br />
29%<br />
Structured<br />
Products<br />
53%<br />
Sector Allocation is based on Net Assets.<br />
Sector Allocation and Top 10 Holdings are subject to<br />
change.<br />
The Corporate Bonds sector includes bonds of companies<br />
and governments headquartered outside the United States.<br />
The Government and Structured Product categories include<br />
domestic taxable bonds.<br />
Consistent with the Portfolio’s stated parameters, no more<br />
than 30% of the Portfolio is invested in foreign securities,<br />
and no more than 20% is invested in high yield securities.<br />
100 Select Bond Portfolio
Select Bond Portfolio<br />
<strong>Northwestern</strong> <strong>Mutual</strong> Series Fund, Inc.<br />
Schedule of Investments<br />
December 31, 2008<br />
Preferred Stocks (0.0%)<br />
Independent Finance (0.0%)<br />
Shares/<br />
$ Par<br />
Value<br />
$ (000's)<br />
(n)* Preferred Blocker, Inc.,<br />
9.00%, 12/31/49 144A 207 52<br />
Total 52<br />
Total Preferred Stocks<br />
(Cost: $52) 52<br />
Corporate Bonds<br />
(28.9%)<br />
Aerospace/Defense (0.9%)<br />
BAE Systems Holdings,<br />
Inc.,<br />
5.20%, 8/15/15 144A 705,000 656<br />
General Dynamics<br />
Corp., 4.25%, 5/15/13 890,000 890<br />
L-3 Communications<br />
Corp.,<br />
6.375%, 10/15/15 3,050,000 2,851<br />
Litton Industries, Inc.,<br />
6.75%, 4/15/18 1,000,000 1,112<br />
Lockheed Martin Corp.,<br />
6.15%, 9/1/36 735,000 797<br />
Raytheon Co.,<br />
5.50%, 11/15/12 3,680,000 3,720<br />
Total 10,026<br />
Auto Manufacturing (0.2%)<br />
Daimler Finance North<br />
America LLC,<br />
5.75%, 5/18/09 1,940,000 1,883<br />
Daimler Finance North<br />
America LLC,<br />
8.50%, 1/18/31 240,000 175<br />
Total 2,058<br />
Banking (5.2%)<br />
American Express<br />
Bank, FSB,<br />
3.15%, 12/9/11 2,650,000 2,671<br />
BA Covered Bond<br />
Issuer,<br />
5.50%, 6/14/12 144A 2,505,000 2,580<br />
Bank of America Corp.,<br />
5.42%, 3/15/17 415,000 369<br />
Bank of America Corp.,<br />
5.65%, 5/1/18 3,550,000 3,571<br />
Bank of America Corp.,<br />
8.125%, 12/29/49 2,210,000 1,653<br />
The Bank of New York<br />
Mellon Corp.,<br />
4.95%, 11/1/12 210,000 213<br />
Bank One Corp.,<br />
5.25%, 1/30/13 2,835,000 2,765<br />
Barclays Bank PLC,<br />
6.05%, 12/4/17 144A 255,000 225<br />
Corporate Bonds<br />
(28.9%)<br />
Shares/<br />
$ Par<br />
Value<br />
$ (000's)<br />
Banking continued<br />
Barclays Bank PLC,<br />
7.7%, 4/26/49 144A 300,000 198<br />
The Bear Stearns<br />
Companies LLC,<br />
7.25%, 2/1/18 440,000 482<br />
BNP Paribas,<br />
7.195%, 6/29/49 144A 200,000 127<br />
Citigroup Capital XXI,<br />
8.3%, 12/21/57 555,000 428<br />
Citigroup, Inc.,<br />
5.125%, 5/5/14 1,645,000 1,546<br />
Citigroup, Inc.,<br />
6.125%, 11/21/17 1,315,000 1,329<br />
Citigroup, Inc.,<br />
6.125%, 5/15/18 1,095,000 1,107<br />
Citigroup, Inc.,<br />
8.4%, 4/29/49 395,000 261<br />
Countrywide Financial<br />
Corp., 5.80%, 6/7/12 575,000 560<br />
Countrywide Home<br />
Loans, Inc.,<br />
4.00%, 3/22/11 1,045,000 995<br />
Countrywide Home<br />
Loans, Inc.,<br />
4.125%, 9/15/09 210,000 208<br />
Credit Agricole<br />
SA/London,<br />
6.637%, 5/31/49 144A 220,000 99<br />
Credit Suisse Guernsey,<br />
Ltd., 5.86%, 5/29/49 85,000 40<br />
Credit Suisse/New York<br />
NY, 5.00%, 5/15/13 2,305,000 2,218<br />
Credit Suisse/New York<br />
NY, 6.00%, 2/15/18 1,335,000 1,226<br />
Deutsche Bank Capital<br />
Funding Trust VII,<br />
5.628%, 1/19/49 144A 815,000 348<br />
Fifth Third Bancorp,<br />
8.25%, 3/1/38 500,000 413<br />
The Goldman Sachs<br />
Group, Inc.,<br />
5.15%, 1/15/14 3,420,000 3,080<br />
The Goldman Sachs<br />
Group, Inc.,<br />
5.75%, 10/1/16 390,000 365<br />
HSBC Holdings PLC,<br />
6.80%, 6/1/38 910,000 962<br />
HSBC USA, Inc.,<br />
3.125%, 12/16/11 2,650,000 2,752<br />
JPMorgan Chase & Co.,<br />
4.75%, 3/1/15 95,000 89<br />
JPMorgan Chase & Co.,<br />
7.90%, 4/29/49 1,350,000 1,123<br />
(d) Lehman Brothers<br />
Holdings, Inc.,<br />
5.50%, 4/4/16 385,000 37<br />
Corporate Bonds<br />
(28.9%)<br />
Shares/<br />
$ Par<br />
Value<br />
$ (000's)<br />
Banking continued<br />
(d) Lehman Brothers<br />
Holdings, Inc.,<br />
6.875%, 5/2/18 480,000 46<br />
M&I Marshall & Ilsley<br />
Bank, 5.15%, 2/22/12 1,770,000 1,600<br />
Mellon Bank NA,<br />
5.45%, 4/1/16 940,000 919<br />
Merrill Lynch & Co.,<br />
6.22%, 9/15/26 240,000 222<br />
Merrill Lynch & Co.,<br />
6.40%, 8/28/17 3,110,000 3,116<br />
Morgan Stanley,<br />
2.00%, 9/22/11 2,650,000 2,667<br />
Morgan Stanley,<br />
5.375%, 10/15/15 800,000 689<br />
Morgan Stanley,<br />
6.25%, 8/28/17 800,000 681<br />
Morgan Stanley,<br />
6.25%, 8/9/26 640,000 520<br />
The Northern Trust Co.,<br />
5.85%, 11/9/17 250,000 256<br />
Northern Trust Corp.,<br />
5.30%, 8/29/11 580,000 591<br />
State Street Bank and<br />
Trust Co.,<br />
5.30%, 1/15/16 1,385,000 1,354<br />
SunTrust Bank,<br />
3.00%, 11/16/11 2,650,000 2,740<br />
UBS AG/Stamford<br />
Branch,<br />
5.75%, 4/25/18 1,775,000 1,611<br />
UBS AG/Stamford<br />
Branch,<br />
5.875%, 12/20/17 750,000 689<br />
UBS Preferred Funding<br />
Trust V,<br />
6.243%, 5/29/49 170,000 93<br />
UnionBanCal Corp.,<br />
5.25%, 12/16/13 565,000 481<br />
Wachovia Bank NA,<br />
6.60%, 1/15/38 435,000 472<br />
Wachovia Corp.,<br />
5.35%, 3/15/11 950,000 906<br />
Wachovia Corp.,<br />
7.98%, 2/28/49 250,000 213<br />
(d)Washington <strong>Mutual</strong><br />
Bank, 6.75%, 5/20/36 520,000 0<br />
(d)Washington <strong>Mutual</strong><br />
Bank,<br />
6.875%, 6/15/11 505,000 0<br />
Wells Fargo Capital<br />
XIII, 7.70%, 12/29/49 2,525,000 2,084<br />
Zions Bancorporation,<br />
5.50%, 11/16/15 1,520,000 1,075<br />
Total 57,065<br />
The Accompanying Notes are an Integral Part of the Financial Statements.<br />
Select Bond Portfolio 101
Select Bond Portfolio<br />
Corporate Bonds<br />
(28.9%)<br />
Beverage/Bottling (1.3%)<br />
Shares/<br />
$ Par<br />
Value<br />
$ (000's)<br />
Anheuser-Busch<br />
Companies, Inc.,<br />
4.50%, 4/1/18 40,000 34<br />
Anheuser-Busch<br />
Companies, Inc.,<br />
5.75%, 4/1/36 200,000 162<br />
Anheuser-Busch<br />
Companies, Inc.,<br />
9.00%, 12/1/09 3,025,000 3,113<br />
Bottling Group LLC,<br />
4.625%, 11/15/12 380,000 384<br />
Bottling Group LLC,<br />
5.50%, 4/1/16 2,815,000 2,817<br />
The Coca-Cola Co.,<br />
5.35%, 11/15/17 840,000 906<br />
Constellation Brands,<br />
Inc., 7.25%, 9/1/16 1,180,000 1,115<br />
Diageo Capital PLC,<br />
4.375%, 5/3/10 420,000 416<br />
Dr. Pepper Snapple<br />
Group, Inc.,<br />
6.82%, 5/1/18 144A 645,000 636<br />
Dr. Pepper Snapple<br />
Group, Inc.,<br />
7.45%, 5/1/38 144A 510,000 508<br />
PepsiCo, Inc.,<br />
4.65%, 2/15/13 385,000 396<br />
PepsiCo, Inc.,<br />
5.00%, 6/1/18 275,000 285<br />
PepsiCo, Inc.,<br />
7.9%, 11/1/18 375,000 460<br />
SABMiller PLC,<br />
6.20%, 7/1/11 144A 2,965,000 2,937<br />
Total 14,169<br />
Building Products (0.1%)<br />
CRH America, Inc.,<br />
6.00%, 9/30/16 575,000 358<br />
CRH America, Inc.,<br />
8.125%, 7/15/18 385,000 278<br />
Total 636<br />
Cable/Media/Broadcasting/Satellite (1.4%)<br />
CBS Corp.,<br />
6.625%, 5/15/11 330,000 292<br />
Comcast Corp.,<br />
5.90%, 3/15/16 1,945,000 1,857<br />
Comcast Corp.,<br />
6.40%, 5/15/38 555,000 554<br />
Comcast Corp.,<br />
6.50%, 11/15/35 175,000 174<br />
Cox Communications,<br />
Inc., 4.625%, 1/15/10 565,000 547<br />
Historic TW, Inc.,<br />
6.625%, 5/15/29 430,000 381<br />
Historic TW, Inc.,<br />
6.875%, 6/15/18 180,000 161<br />
News America, Inc.,<br />
6.15%, 3/1/37 730,000 681<br />
Rogers Cable, Inc.,<br />
5.50%, 3/15/14 3,450,000 3,183<br />
Corporate Bonds Shares/ Value<br />
(28.9%)<br />
$ Par $ (000's)<br />
Cable/Media/Broadcasting/Satellite<br />
continued<br />
Rogers Cable, Inc.,<br />
6.25%, 6/15/13 155,000 148<br />
TCI Communications,<br />
Inc., 8.75%, 8/1/15 735,000 782<br />
Time Warner Cable,<br />
Inc., 5.40%, 7/2/12 530,000 495<br />
Time Warner Cable,<br />
Inc., 6.55%, 5/1/37 900,000 862<br />
Time Warner Cable,<br />
Inc., 6.75%, 7/1/18 200,000 193<br />
Time Warner Cable,<br />
Inc., 8.75%, 2/14/19 510,000 555<br />
Time Warner<br />
Entertainment Co. LP,<br />
8.375%, 3/15/23 690,000 695<br />
Time Warner<br />
Entertainment Co. LP,<br />
8.875%, 10/1/12 1,500,000 1,513<br />
Time Warner, Inc.,<br />
5.50%, 11/15/11 1,000,000 940<br />
Viacom, Inc.,<br />
5.75%, 4/30/11 765,000 695<br />
Viacom, Inc.,<br />
6.125%, 10/5/17 190,000 157<br />
Total 14,865<br />
Conglomerate/Diversified Manufacturing<br />
(0.4%)<br />
The Dow Chemical Co.,<br />
5.70%, 5/15/18 45,000 40<br />
General Electric Co.,<br />
5.00%, 2/1/13 1,900,000 1,922<br />
Honeywell<br />
International, Inc.,<br />
5.30%, 3/1/18 1,000,000 1,020<br />
Monsanto Co.,<br />
5.125%, 4/15/18 130,000 136<br />
United Technologies<br />
Corp., 4.875%, 5/1/15 250,000 244<br />
United Technologies<br />
Corp., 6.35%, 3/1/11 770,000 814<br />
Total 4,176<br />
Consumer Products (0.4%)<br />
The Clorox Co.,<br />
4.20%, 1/15/10 1,750,000 1,729<br />
The Clorox Co.,<br />
5.00%, 3/1/13 1,000,000 985<br />
Colgate-Palmolive Co.,<br />
4.20%, 5/15/13 700,000 717<br />
Fortune Brands, Inc.,<br />
5.375%, 1/15/16 490,000 409<br />
The Procter & Gamble<br />
Co., 5.55%, 3/5/37 460,000 511<br />
Total 4,351<br />
Electric Utilities (4.7%)<br />
AEP Texas Central Co.,<br />
6.65%, 2/15/33 575,000 528<br />
Corporate Bonds<br />
(28.9%)<br />
Shares/<br />
$ Par<br />
Value<br />
$ (000's)<br />
Electric Utilities continued<br />
American Electric<br />
Power Co.,<br />
5.25%, 6/1/15 1,000,000 923<br />
Bruce Mansfield Unit,<br />
6.85%, 6/1/34 415,000 354<br />
Carolina Power &<br />
Light, Inc.,<br />
5.15%, 4/1/15 320,000 321<br />
Carolina Power &<br />
Light, Inc.,<br />
6.50%, 7/15/12 255,000 251<br />
CenterPoint Energy<br />
Houston Electric LLC,<br />
5.70%, 3/15/13 200,000 190<br />
CenterPoint Energy<br />
Houston Electric LLC,<br />
6.95%, 3/15/33 210,000 193<br />
CenterPoint Energy,<br />
Inc., 6.50%, 5/1/18 375,000 306<br />
CMS Energy Corp.,<br />
6.875%, 12/15/15 970,000 827<br />
Commonwealth Edison<br />
Co., 5.875%, 2/1/33 100,000 84<br />
Connecticut Light and<br />
Power Co.,<br />
5.65%, 5/1/18 160,000 159<br />
Consolidated Edison<br />
Co. of New York, Inc.,<br />
5.375%, 12/15/15 485,000 476<br />
Consolidated Edison<br />
Co. of New York, Inc.,<br />
5.50%, 9/15/16 430,000 426<br />
Consolidated Natural<br />
Gas Co.,<br />
5.00%, 12/1/14 1,340,000 1,230<br />
Consumers Energy Co.,<br />
5.15%, 2/15/17 1,000,000 937<br />
The Detroit Edison Co.,<br />
5.45%, 2/15/35 105,000 91<br />
Dominion Resources,<br />
Inc., 6.00%, 11/30/17 40,000 38<br />
Dominion Resources,<br />
Inc., 6.40%, 6/15/18 175,000 171<br />
DTE Energy Co.,<br />
6.375%, 4/15/33 195,000 154<br />
DTE Energy Co.,<br />
7.05%, 6/1/11 4,470,000 4,422<br />
Duke Energy Carolinas<br />
LLC, 6.45%, 10/15/32 1,225,000 1,296<br />
Duquesne Light<br />
Holdings, Inc.,<br />
5.50%, 8/15/15 640,000 537<br />
Entergy Louisiana LLC,<br />
6.50%, 9/1/18 385,000 365<br />
Entergy Mississippi,<br />
Inc., 6.25%, 4/1/34 660,000 559<br />
Exelon Generation Co.<br />
LLC, 6.20%, 10/1/17 955,000 821<br />
Florida Power & Light<br />
Co., 5.625%, 4/1/34 180,000 191<br />
Florida Power Corp.,<br />
4.50%, 6/1/10 2,115,000 2,095<br />
The Accompanying Notes are an Integral Part of the Financial Statements.<br />
102 Select Bond Portfolio
Select Bond Portfolio<br />
Corporate Bonds<br />
(28.9%)<br />
Shares/<br />
$ Par<br />
Value<br />
$ (000's)<br />
Electric Utilities continued<br />
Florida Power Corp.,<br />
4.80%, 3/1/13 100,000 99<br />
Florida Power Corp.,<br />
6.40%, 6/15/38 365,000 408<br />
Indiana Michigan Power<br />
Co., 5.05%, 11/15/14 1,560,000 1,405<br />
Kiowa Power Partners<br />
LLC,<br />
4.811%, 12/30/13<br />
144A 560,795 524<br />
Kiowa Power Partners<br />
LLC,<br />
5.737%, 3/30/21 144A 975,000 746<br />
MidAmerican Energy<br />
Holdings Co.,<br />
5.95%, 5/15/37 195,000 177<br />
Monongahela Power<br />
Co.,<br />
5.70%, 3/15/17 144A 615,000 516<br />
Nevada Power Co.,<br />
5.875%, 1/15/15 1,495,000 1,431<br />
Nevada Power Co.,<br />
5.95%, 3/15/16 165,000 158<br />
Nevada Power Co.,<br />
6.50%, 4/15/12 750,000 717<br />
Nevada Power Co.,<br />
6.50%, 5/15/18 1,155,000 1,112<br />
Northern States Power<br />
Co., 5.25%, 10/1/18 190,000 189<br />
Ohio Edison Co.,<br />
6.40%, 7/15/16 1,000,000 898<br />
Ohio Edison Co.,<br />
6.875%, 7/15/36 130,000 118<br />
Oncor Electric Delivery<br />
Co., 6.375%, 1/15/15 985,000 944<br />
Oncor Electric Delivery<br />
Co.,<br />
6.80%, 9/1/08 144A 375,000 360<br />
Oncor Electric Delivery<br />
Co., 7.00%, 9/1/22 180,000 168<br />
Pacific Gas & Electric<br />
Co., 5.80%, 3/1/37 190,000 197<br />
Pacific Gas & Electric<br />
Co., 6.05%, 3/1/34 315,000 335<br />
PacifiCorp,<br />
5.45%, 9/15/13 3,000,000 3,069<br />
PacifiCorp,<br />
5.75%, 4/1/37 630,000 622<br />
Potomac Electric Power<br />
Co., 6.50%, 11/15/37 170,000 166<br />
PPL Electric Utilities<br />
Corp., 4.30%, 6/1/13 1,800,000 1,690<br />
PPL Electric Utilities<br />
Corp., 6.25%, 8/15/09 145,000 146<br />
PPL Energy Supply<br />
LLC, 6.00%, 12/15/36 310,000 200<br />
PPL Energy Supply<br />
LLC, 6.50%, 5/1/18 330,000 268<br />
Progress Energy, Inc.,<br />
6.85%, 4/15/12 710,000 712<br />
Corporate Bonds<br />
(28.9%)<br />
Shares/<br />
$ Par<br />
Value<br />
$ (000's)<br />
Electric Utilities continued<br />
Public Service Co. of<br />
Colorado,<br />
5.50%, 4/1/14 955,000 907<br />
Public Service Co. of<br />
Colorado,<br />
6.50%, 8/1/38 1,800,000 2,008<br />
Public Service Electric<br />
& Gas Co.,<br />
5.00%, 1/1/13 1,000,000 975<br />
Public Service Electric<br />
& Gas Co.,<br />
5.70%, 12/1/36 1,160,000 1,071<br />
Puget Sound Energy,<br />
Inc., 6.274%, 3/15/37 765,000 681<br />
San Diego Gas &<br />
Electric Co.,<br />
5.30%, 11/15/15 215,000 221<br />
San Diego Gas &<br />
Electric Co.,<br />
6.125%, 9/15/37 170,000 187<br />
SCANA Corp.,<br />
6.25%, 4/1/20 500,000 462<br />
Sierra Pacific Power<br />
Co., 6.75%, 7/1/37 400,000 357<br />
South Carolina Electric<br />
& Gas Co.,<br />
6.05%, 1/15/38 265,000 277<br />
Southern California<br />
Edison Co.,<br />
5.00%, 1/15/16 1,005,000 1,017<br />
Southern California<br />
Edison Co.,<br />
5.55%, 1/15/37 230,000 242<br />
Southern California<br />
Edison Co.,<br />
5.625%, 2/1/36 70,000 74<br />
Tampa Electric Co.,<br />
6.10%, 5/15/18 2,370,000 2,157<br />
Tampa Electric Co.,<br />
6.15%, 5/15/37 320,000 260<br />
Tampa Electric Co.,<br />
6.55%, 5/15/36 385,000 329<br />
The Toledo Edison Co.,<br />
6.15%, 5/15/37 910,000 732<br />
Union Electric Co.,<br />
6.40%, 6/15/17 140,000 128<br />
Union Electric Co.,<br />
6.70%, 2/1/19 195,000 178<br />
Virginia Electric and<br />
Power Co.,<br />
5.25%, 12/15/15 3,040,000 2,954<br />
Virginia Electric and<br />
Power Co.,<br />
5.40%, 1/15/16 300,000 294<br />
Westar Energy, Inc.,<br />
8.625%, 12/1/18 125,000 135<br />
Xcel Energy, Inc.,<br />
6.50%, 7/1/36 590,000 542<br />
Total 51,508<br />
Corporate Bonds<br />
(28.9%)<br />
Shares/<br />
$ Par<br />
Value<br />
$ (000's)<br />
Electronics (0.1%)<br />
International Business<br />
Machines Corp.,<br />
8.00%, 10/15/38 700,000 932<br />
Total 932<br />
Food Processors (1.0%)<br />
General Mills, Inc.,<br />
5.25%, 8/15/13 190,000 191<br />
General Mills, Inc.,<br />
5.70%, 2/15/17 890,000 895<br />
H.J. Heinz Co.,<br />
5.35%, 7/15/13 1,425,000 1,414<br />
Kellogg Co.,<br />
6.60%, 4/1/11 3,610,000 3,778<br />
Kraft Foods, Inc.,<br />
6.25%, 6/1/12 2,585,000 2,673<br />
Kraft Foods, Inc.,<br />
6.50%, 8/11/17 1,305,000 1,312<br />
Kraft Foods, Inc.,<br />
6.875%, 1/26/39 440,000 441<br />
Smithfield Foods, Inc.,<br />
7.75%, 5/15/13 835,000 536<br />
Total 11,240<br />
Gaming/Lodging/Leisure (0.2%)<br />
Harrah's Operating Co.,<br />
5.75%, 10/1/17 420,000 65<br />
Royal Caribbean<br />
Cruises, Ltd.,<br />
7.00%, 6/15/13 1,180,000 673<br />
Wynn Las Vegas<br />
LLC/Wynn Las Vegas<br />
Capital Corp.,<br />
6.625%, 12/1/14 2,405,000 1,816<br />
Total 2,554<br />
Gas Pipelines (0.5%)<br />
CenterPoint Energy<br />
Resources Corp.,<br />
6.125%, 11/1/17 120,000 101<br />
El Paso Corp.,<br />
7.00%, 6/15/17 420,000 329<br />
El Paso Natural Gas<br />
Co., 5.95%, 4/15/17 160,000 127<br />
Kinder Morgan Energy<br />
Partners LP,<br />
6.50%, 2/1/37 200,000 153<br />
Kinder Morgan Energy<br />
Partners LP,<br />
7.30%, 8/15/33 1,085,000 900<br />
Kinder Morgan Finance<br />
Co. ULC,<br />
5.35%, 1/5/11 1,765,000 1,575<br />
Rockies Express<br />
Pipeline LLC,<br />
6.85%, 7/15/18 144A 325,000 300<br />
Southern Natural Gas<br />
Co.,<br />
5.90%, 4/1/17 144A 175,000 139<br />
Tennessee Gas Pipeline<br />
Co., 7.50%, 4/1/17 170,000 150<br />
The Accompanying Notes are an Integral Part of the Financial Statements.<br />
Select Bond Portfolio 103
Select Bond Portfolio<br />
Corporate Bonds<br />
(28.9%)<br />
Shares/<br />
$ Par<br />
Value<br />
$ (000's)<br />
Gas Pipelines continued<br />
TransCanada Pipelines,<br />
Ltd., 5.85%, 3/15/36 160,000 136<br />
TransCanada Pipelines,<br />
Ltd., 6.20%, 10/15/37 305,000 265<br />
TransCanada PipeLines,<br />
Ltd., 7.25%, 8/15/38 785,000 781<br />
Total 4,956<br />
Health Care/Pharmaceuticals (1.0%)<br />
AstraZeneca PLC,<br />
5.90%, 9/15/17 1,000,000 1,063<br />
Bristol-Myers Squibb<br />
Co., 5.875%, 11/15/36 90,000 96<br />
Bristol-Myers Squibb<br />
Co., 6.125%, 5/1/38 465,000 511<br />
Eli Lilly and Co.,<br />
5.55%, 3/15/37 735,000 759<br />
GlaxoSmithKline<br />
Capital, Inc.,<br />
5.65%, 5/15/18 555,000 583<br />
GlaxoSmithKline<br />
Capital, Inc.,<br />
6.375%, 5/15/38 815,000 921<br />
Johnson & Johnson,<br />
5.55%, 8/15/17 1,000,000 1,142<br />
Johnson & Johnson,<br />
5.95%, 8/15/37 735,000 897<br />
Merck & Co.,<br />
4.75%, 3/1/15 500,000 494<br />
Merck & Co.,<br />
5.75%, 11/15/36 375,000 395<br />
Merck & Co.,<br />
6.40%, 3/1/28 125,000 138<br />
Schering-Plough Corp.,<br />
6.00%, 9/15/17 1,000,000 990<br />
Wyeth, 5.50%, 2/1/14 2,040,000 2,072<br />
Wyeth, 5.95%, 4/1/37 910,000 1,010<br />
Total 11,071<br />
Independent Finance (1.0%)<br />
American General<br />
Finance Corp.,<br />
5.4%, 12/1/15 295,000 110<br />
American General<br />
Finance Corp.,<br />
6.90%, 12/15/17 1,455,000 630<br />
General Electric Capital<br />
Corp., 5.625%, 5/1/18 4,960,000 4,996<br />
General Electric Capital<br />
Corp.,<br />
5.875%, 1/14/38 180,000 176<br />
General Motors<br />
Acceptance Corp.<br />
LLC,<br />
6.00%, 12/15/11 144A 978,000 791<br />
(n) General Motors<br />
Acceptance Corp.<br />
LLC,<br />
7.50%, 12/31/13 144A 179,000 131<br />
Corporate Bonds<br />
(28.9%)<br />
Shares/<br />
$ Par<br />
Value<br />
$ (000's)<br />
Independent Finance continued<br />
(n) General Motors<br />
Acceptance Corp.<br />
LLC,<br />
8.00%, 12/31/18 144A 214,000 107<br />
HSBC Finance Corp.,<br />
4.125%, 11/16/09 2,330,000 2,309<br />
International Lease<br />
Finance Corp.,<br />
4.75%, 1/13/12 1,485,000 1,038<br />
iStar Financial, Inc.,<br />
5.15%, 3/1/12 1,165,000 367<br />
iStar Financial, Inc.,<br />
8.625%, 6/1/13 500,000 155<br />
Total 10,810<br />
Industrials - Other (0.1%)<br />
Centex Corp.,<br />
7.875%, 2/1/11 245,000 217<br />
D.R. Horton, Inc.,<br />
5.375%, 6/15/12 385,000 284<br />
D.R. Horton, Inc.,<br />
7.875%, 8/15/11 110,000 94<br />
Total 595<br />
Information/Data Technology (0.2%)<br />
Fiserv, Inc.,<br />
6.125%, 11/20/12 765,000 719<br />
Fiserv, Inc.,<br />
6.80%, 11/20/17 765,000 678<br />
Seagate Technology<br />
HDD Holdings,<br />
6.80%, 10/1/16 510,000 265<br />
Total 1,662<br />
Life Insurance (0.0%)<br />
Prudential Financial,<br />
Inc., 5.70%, 12/14/36 145,000 90<br />
Total 90<br />
Machinery (0.1%)<br />
Case Corp.,<br />
7.25%, 1/15/16 1,775,000 1,234<br />
Total 1,234<br />
Metals/Mining (0.3%)<br />
Alcoa, Inc.,<br />
5.55%, 2/1/17 1,000,000 787<br />
Alcoa, Inc.,<br />
5.72%, 2/23/19 860,000 646<br />
Alcoa, Inc.,<br />
5.90%, 2/1/27 520,000 342<br />
Alcoa, Inc.,<br />
6.75%, 7/15/18 290,000 237<br />
Barrick North America<br />
Fiance LLC,<br />
6.80%, 9/15/18 375,000 335<br />
Freeport-McMoRan<br />
Copper & Gold, Inc.,<br />
8.25%, 4/1/15 200,000 170<br />
Freeport-McMoRan<br />
Copper & Gold, Inc.,<br />
8.375%, 4/1/17 515,000 422<br />
Corporate Bonds<br />
(28.9%)<br />
Shares/<br />
$ Par<br />
Value<br />
$ (000's)<br />
Metals/Mining continued<br />
Rio Tinto Finance USA,<br />
Ltd., 6.50%, 7/15/18 410,000 301<br />
Total 3,240<br />
Natural Gas Distributors (0.1%)<br />
NiSource Finance<br />
Corp., 5.25%, 9/15/17 495,000 300<br />
NiSource Finance<br />
Corp., 5.40%, 7/15/14 590,000 404<br />
NiSource Finance<br />
Corp., 5.45%, 9/15/20 185,000 99<br />
NiSource Finance<br />
Corp., 6.40%, 3/15/18 205,000 128<br />
Total 931<br />
Oil & Gas Field Machines and Services<br />
(0.1%)<br />
Pride International, Inc.,<br />
7.375%, 7/15/14 655,000 609<br />
Total 609<br />
Oil and Gas (2.0%)<br />
Anadarko Finance Co.,<br />
7.50%, 5/1/31 775,000 685<br />
Apache Corp.,<br />
6.00%, 1/15/37 365,000 354<br />
Apache Corp.,<br />
6.90%, 9/15/18 95,000 103<br />
Canadian Natural<br />
Resources, Ltd.,<br />
5.15%, 2/1/13 1,000,000 927<br />
Canadian Natural<br />
Resources, Ltd.,<br />
5.70%, 5/15/17 700,000 611<br />
Canadian Natural<br />
Resources, Ltd.,<br />
5.85%, 2/1/35 140,000 104<br />
Canadian Natural<br />
Resources, Ltd.,<br />
6.25%, 3/15/38 1,465,000 1,152<br />
Canadian Natural<br />
Resources, Ltd.,<br />
6.45%, 6/30/33 255,000 206<br />
ConocoPhillips Canada<br />
Funding Co. I,<br />
5.30%, 4/15/12 565,000 565<br />
Devon Energy Corp.,<br />
7.95%, 4/15/32 200,000 221<br />
Devon Financing Corp.<br />
ULC, 6.875%, 9/30/11 1,830,000 1,847<br />
EnCana Corp.,<br />
5.90%, 12/1/17 325,000 271<br />
EnCana Corp.,<br />
6.50%, 2/1/38 300,000 241<br />
EnCana Corp.,<br />
6.625%, 8/15/37 250,000 201<br />
EnCana Holdings<br />
Finance Corp.,<br />
5.80%, 5/1/14 1,760,000 1,649<br />
Hess Corp.,<br />
7.125%, 3/15/33 260,000 231<br />
The Accompanying Notes are an Integral Part of the Financial Statements.<br />
104 Select Bond Portfolio
Select Bond Portfolio<br />
Corporate Bonds<br />
(28.9%)<br />
Shares/<br />
$ Par<br />
Value<br />
$ (000's)<br />
Oil and Gas continued<br />
Marathon Oil Corp.,<br />
6.125%, 3/15/12 1,000,000 1,012<br />
Marathon Oil Corp.,<br />
6.60%, 10/1/37 130,000 98<br />
Nexen, Inc.,<br />
5.875%, 3/10/35 2,300,000 1,732<br />
Nexen, Inc.,<br />
6.40%, 5/15/37 115,000 90<br />
Pemex Project Funding<br />
Master Trust,<br />
6.625%, 6/15/35 144A 200,000 169<br />
Petro-Canada,<br />
5.95%, 5/15/35 580,000 399<br />
Petro-Canada,<br />
6.05%, 5/15/18 880,000 725<br />
Pioneer Natural<br />
Resources Co.,<br />
6.875%, 5/1/18 1,340,000 937<br />
Suncor Energy, Inc.,<br />
6.50%, 6/15/38 1,330,000 1,006<br />
Suncor Energy, Inc.,<br />
6.85%, 6/1/39 210,000 167<br />
Sunoco, Inc.,<br />
5.75%, 1/15/17 625,000 519<br />
Talisman Energy, Inc.,<br />
5.85%, 2/1/37 1,590,000 1,106<br />
Tesoro Corp.,<br />
6.25%, 11/1/12 1,590,000 1,097<br />
Tesoro Corp.,<br />
6.50%, 6/1/17 2,045,000 1,122<br />
Valero Energy Corp.,<br />
6.625%, 6/15/37 1,450,000 1,067<br />
XTO Energy, Inc.,<br />
5.30%, 6/30/15 195,000 178<br />
XTO Energy, Inc.,<br />
6.25%, 4/15/13 100,000 98<br />
XTO Energy, Inc.,<br />
6.50%, 12/15/18 380,000 368<br />
XTO Energy, Inc.,<br />
6.75%, 8/1/37 450,000 421<br />
Total 21,679<br />
Other Finance (0.4%)<br />
Capmark Financial<br />
Group, Inc.,<br />
6.30%, 5/10/17 255,000 70<br />
Eaton Vance Corp.,<br />
6.50%, 10/2/17 85,000 75<br />
PNC Financial Services<br />
Group, Inc.,<br />
8.25%, 5/21/13 2,370,000 1,910<br />
SLM Corp.,<br />
5.375%, 1/15/13 80,000 59<br />
SLM Corp.,<br />
5.375%, 5/15/14 445,000 300<br />
SLM Corp.,<br />
5.45%, 4/25/11 3,020,000 2,384<br />
Total 4,798<br />
Corporate Bonds<br />
(28.9%)<br />
Shares/<br />
$ Par<br />
Value<br />
$ (000's)<br />
Other Services (0.1%)<br />
Waste Management,<br />
Inc., 5.00%, 3/15/14 540,000 463<br />
Waste Management,<br />
Inc., 6.10%, 3/15/18 1,090,000 943<br />
Total 1,406<br />
Paper and Forest Products (0.1%)<br />
International Paper Co.,<br />
7.95%, 6/15/18 430,000 340<br />
International Paper Co.,<br />
8.70%, 6/15/38 415,000 290<br />
Weyerhaeuser Co.,<br />
6.875%, 12/15/33 200,000 133<br />
Total 763<br />
Property and Casualty Insurance (0.0%)<br />
The Progressive Corp.,<br />
6.70%, 6/15/37 245,000 120<br />
Total 120<br />
Railroads (1.1%)<br />
Burlington Northern<br />
Santa Fe Corp.,<br />
6.125%, 3/15/09 3,000,000 3,007<br />
Burlington Northern<br />
Santa Fe Corp.,<br />
6.15%, 5/1/37 710,000 654<br />
Burlington Northern<br />
Santa Fe Corp.,<br />
6.20%, 8/15/36 625,000 576<br />
Canadian National<br />
Railway Co.,<br />
5.85%, 11/15/17 120,000 124<br />
Canadian National<br />
Railway Co.,<br />
6.375%, 11/15/37 365,000 400<br />
Canadian Pacific<br />
Railway Co.,<br />
5.95%, 5/15/37 145,000 102<br />
CSX Corp.,<br />
5.60%, 5/1/17 1,760,000 1,564<br />
Union Pacific Corp.,<br />
3.875%, 2/15/09 3,000,000 3,006<br />
Union Pacific Corp.,<br />
5.65%, 5/1/17 1,105,000 1,060<br />
Union Pacific Corp.,<br />
5.75%, 11/15/17 550,000 521<br />
Union Pacific Corp.,<br />
6.65%, 1/15/11 565,000 563<br />
Total 11,577<br />
Real Estate Investment Trusts (0.9%)<br />
AvalonBay<br />
Communities, Inc.,<br />
5.50%, 1/15/12 360,000 288<br />
BRE Properties, Inc.,<br />
5.50%, 3/15/17 315,000 160<br />
Colonial Realty LP,<br />
6.05%, 9/1/16 255,000 149<br />
Corporate Bonds<br />
(28.9%)<br />
Shares/<br />
$ Par<br />
Value<br />
$ (000's)<br />
Real Estate Investment Trusts continued<br />
Developers Diversified<br />
Realty Corp.,<br />
5.375%, 10/15/12 1,000,000 419<br />
Duke Realty LP,<br />
5.95%, 2/15/17 865,000 432<br />
Duke Realty LP,<br />
6.50%, 1/15/18 1,000,000 446<br />
ERP Operating LP,<br />
5.25%, 9/15/14 1,325,000 885<br />
ERP Operating LP,<br />
5.75%, 6/15/17 420,000 290<br />
First Industrial LP,<br />
5.25%, 6/15/09 1,275,000 1,177<br />
HCP, Inc.,<br />
6.00%, 1/30/17 290,000 140<br />
HCP, Inc.,<br />
6.70%, 1/30/18 170,000 82<br />
HRPT Properties Trust,<br />
5.75%, 11/1/15 800,000 426<br />
ProLogis,<br />
5.50%, 3/1/13 1,380,000 800<br />
ProLogis,<br />
5.75%, 4/1/16 865,000 431<br />
Rouse Co. LP/TRC Co-<br />
Issuer, Inc.,<br />
6.75%, 5/1/13 144A 2,700,000 972<br />
Simon Property Group<br />
LP, 5.375%, 6/1/11 2,370,000 2,003<br />
Simon Property Group<br />
LP, 5.60%, 9/1/11 590,000 493<br />
Simon Property Group<br />
LP, 6.10%, 5/1/16 1,155,000 738<br />
Total 10,331<br />
Restaurants (0.1%)<br />
Darden Restaurants,<br />
Inc., 6.20%, 10/15/17 120,000 89<br />
Darden Restaurants,<br />
Inc., 6.80%, 10/15/37 470,000 303<br />
Yum! Brands, Inc.,<br />
6.875%, 11/15/37 575,000 456<br />
Total 848<br />
Retail Food and Drug (0.6%)<br />
CVS/Caremark Corp.,<br />
4.875%, 9/15/14 730,000 673<br />
CVS/Caremark Corp.,<br />
6.125%, 8/15/16 330,000 320<br />
CVS/Caremark Corp.,<br />
6.25%, 6/1/27 1,475,000 1,371<br />
Delhaize Group,<br />
6.50%, 6/15/17 570,000 517<br />
The Kroger Co.,<br />
6.15%, 1/15/20 2,095,000 2,067<br />
The Kroger Co.,<br />
7.00%, 5/1/18 170,000 178<br />
The Kroger Co.,<br />
7.50%, 4/1/31 735,000 816<br />
Tesco PLC,<br />
6.15%, 11/15/37 144A 440,000 389<br />
Total 6,331<br />
The Accompanying Notes are an Integral Part of the Financial Statements.<br />
Select Bond Portfolio 105
Select Bond Portfolio<br />
Corporate Bonds<br />
(28.9%)<br />
Shares/<br />
$ Par<br />
Value<br />
$ (000's)<br />
Retail Stores (1.0%)<br />
Costco Wholesale<br />
Corp., 5.50%, 3/15/17 555,000 590<br />
The Home Depot, Inc.,<br />
5.875%, 12/16/36 1,300,000 1,019<br />
J.C. Penney Corp.,<br />
5.75%, 2/15/18 105,000 70<br />
J.C. Penney Corp.,<br />
6.375%, 10/15/36 210,000 127<br />
J.C. Penney Corp.,<br />
6.875%, 10/15/15 490,000 390<br />
J.C. Penney Corp.,<br />
7.95%, 4/1/17 420,000 320<br />
Kohl's Corp.,<br />
6.25%, 12/15/17 510,000 408<br />
Kohl's Corp.,<br />
6.875%, 12/15/37 380,000 270<br />
Macy's Retail Holdings,<br />
Inc., 6.30%, 4/1/09 3,790,000 3,696<br />
Macy's Retail Holdings,<br />
Inc., 6.65%, 7/15/24 65,000 36<br />
Macy's Retail Holdings,<br />
Inc., 7.00%, 2/15/28 95,000 52<br />
Macy's Retail Holdings,<br />
Inc., 7.875%, 7/15/15 605,000 436<br />
Nordstrom, Inc.,<br />
7.00%, 1/15/38 225,000 134<br />
Target Corp.,<br />
5.375%, 5/1/17 1,495,000 1,360<br />
Target Corp.,<br />
6.50%, 10/15/37 635,000 545<br />
Wal-Mart Stores, Inc.,<br />
5.80%, 2/15/18 1,000,000 1,107<br />
Wal-Mart Stores, Inc.,<br />
5.875%, 4/5/27 810,000 854<br />
Total 11,414<br />
Telecommunications (2.6%)<br />
AT&T Corp.,<br />
7.30%, 11/15/11 1,500,000 1,558<br />
AT&T Corp.,<br />
8.00%, 11/15/31 1,470,000 1,847<br />
AT&T Mobility LLC,<br />
7.125%, 12/15/31 1,535,000 1,613<br />
AT&T, Inc.,<br />
5.10%, 9/15/14 1,625,000 1,597<br />
British<br />
Telecommunications<br />
PLC,<br />
8.625%, 12/15/10 1,000,000 1,029<br />
British<br />
Telecommunications<br />
PLC,<br />
9.125%, 12/15/30 500,000 532<br />
Deutsche Telekom<br />
International Finance<br />
BV, 5.75%, 3/23/16 480,000 460<br />
Embarq Corp.,<br />
6.738%, 6/1/13 610,000 515<br />
Embarq Corp.,<br />
7.082%, 6/1/16 660,000 508<br />
Corporate Bonds<br />
(28.9%)<br />
Shares/<br />
$ Par<br />
Value<br />
$ (000's)<br />
Telecommunications continued<br />
Embarq Corp.,<br />
7.995%, 6/1/36 635,000 429<br />
France Telecom SA,<br />
7.75%, 3/1/11 1,000,000 1,052<br />
France Telecom SA,<br />
8.50%, 3/1/31 800,000 1,004<br />
Rogers<br />
Communications, Inc.,<br />
6.80%, 8/15/18 500,000 505<br />
Rogers Wireless, Inc.,<br />
6.375%, 3/1/14 625,000 594<br />
Sprint Capital Corp.,<br />
8.375%, 3/15/12 1,880,000 1,504<br />
Sprint Capital Corp.,<br />
8.75%, 3/15/32 330,000 223<br />
Sprint Nextel Corp.,<br />
6.00%, 12/1/16 385,000 271<br />
Telecom Italia Capital<br />
SA, 4.00%, 1/15/10 1,565,000 1,440<br />
Telecom Italia Capital<br />
SA, 6.20%, 7/18/11 1,225,000 1,087<br />
Verizon<br />
Communications, Inc.,<br />
5.85%, 9/15/35 3,135,000 3,119<br />
Verizon<br />
Communications, Inc.,<br />
6.10%, 4/15/18 2,085,000 2,078<br />
Verizon<br />
Communications, Inc.,<br />
8.95%, 3/1/39 425,000 549<br />
Vodafone Group PLC,<br />
5.00%, 9/15/15 265,000 243<br />
Vodafone Group PLC,<br />
5.375%, 1/30/15 700,000 659<br />
Vodafone Group PLC,<br />
5.50%, 6/15/11 2,035,000 2,028<br />
Vodafone Group PLC,<br />
5.625%, 2/27/17 1,445,000 1,362<br />
Vodafone Group PLC,<br />
5.75%, 3/15/16 90,000 86<br />
Total 27,892<br />
Tobacco (0.4%)<br />
Altria Group, Inc.,<br />
9.70%, 11/10/18 660,000 713<br />
Altria Group, Inc.,<br />
9.95%, 11/10/38 815,000 887<br />
Philip Morris<br />
International, Inc.,<br />
5.65%, 5/16/18 760,000 754<br />
Philip Morris<br />
International, Inc.,<br />
6.375%, 5/16/38 760,000 791<br />
Reynolds American,<br />
Inc., 6.75%, 6/15/17 150,000 119<br />
Reynolds American,<br />
Inc., 7.25%, 6/15/37 150,000 101<br />
Reynolds American,<br />
Inc., 7.625%, 6/1/16 1,735,000 1,445<br />
Total 4,810<br />
Corporate Bonds<br />
(28.9%)<br />
Vehicle Parts (0.1%)<br />
Shares/<br />
$ Par<br />
Value<br />
$ (000's)<br />
Johnson Controls, Inc.,<br />
5.25%, 1/15/11 565,000 519<br />
Johnson Controls, Inc.,<br />
5.50%, 1/15/16 580,000 450<br />
Johnson Controls, Inc.,<br />
6.00%, 1/15/36 360,000 228<br />
Total 1,197<br />
Yankee Sovereign (0.2%)<br />
Mexico Government<br />
International Bond,<br />
5.625%, 1/15/17 1,480,000 1,480<br />
Mexico Government<br />
International Bond,<br />
6.05%, 1/11/40 945,000 917<br />
Total 2,397<br />
Total Corporate Bonds<br />
(Cost: $343,520) 314,341<br />
Governments (13.9%)<br />
Governments (13.9%)<br />
(b)Federal Home Loan<br />
Mortgage Corp.,<br />
4.875%, 6/13/18 33,778,000 38,821<br />
Israel Government AID<br />
Bond, 5.50%, 4/26/24 1,910,000 2,373<br />
(n) Overseas Private<br />
Investment,<br />
4.10%, 11/15/14 1,727,760 1,705<br />
(e)Tennesse Valley<br />
Authority Stripped,<br />
0.00%, 4/15/42 3,600,000 3,168<br />
US Department of<br />
Housing & Urban<br />
Development,<br />
6.08%, 8/1/13 4,000,000 4,399<br />
US Department of<br />
Housing and Urban<br />
Development,<br />
6.17%, 8/1/14 3,000,000 3,305<br />
(g)US Treasury,<br />
2.75%, 10/31/13 34,685,000 36,875<br />
US Treasury,<br />
3.75%, 11/15/18 160,000 181<br />
(g)US Treasury,<br />
4.00%, 8/15/18 15,019,000 17,343<br />
(g)US Treasury,<br />
4.375%, 2/15/38 9,675,000 12,958<br />
(b)US Treasury,<br />
5.50%, 8/15/28 15,307,000 20,688<br />
US Treasury,<br />
8.125%, 8/15/21 915,000 1,392<br />
US Treasury Inflation<br />
Index Bond,<br />
2.00%, 4/15/12 4,187,245 4,083<br />
The Accompanying Notes are an Integral Part of the Financial Statements.<br />
106 Select Bond Portfolio
Select Bond Portfolio<br />
Governments (13.9%)<br />
Shares/<br />
$ Par<br />
Value<br />
$ (000's)<br />
Governments continued<br />
US Treasury Inflation<br />
Index Bond,<br />
2.625%, 7/15/17 4,179,109 4,283<br />
Total Governments<br />
(Cost: $135,900) 151,574<br />
Municipal Bonds (0.1%)<br />
Municipal Bonds (0.1%)<br />
Indiana Finance<br />
Authority<br />
Environmental<br />
Facillities, Series<br />
2006A, 4.47%,<br />
9/1/41 RB , AMBAC 755,000 755<br />
Total 755<br />
Total Municipal Bonds<br />
(Cost: $755) 755<br />
Structured Products (52.8%)<br />
Structured Products (52.8%)<br />
AEP Texas Central<br />
Transition Funding<br />
LLC, Series 2006-A,<br />
Class A5,<br />
5.306%, 7/1/21 15,910,000 14,208<br />
Asset Securitization<br />
Corp., Series 1997-D5,<br />
Class PS1,<br />
1.418%, 2/14/43 IO 36,650,745 1,027<br />
Banc of America<br />
Alternative Loan Trust,<br />
Series 2006-3, Class<br />
1CB1,<br />
6.00%, 4/25/36 1,602,718 768<br />
Banc of America<br />
Alternative Loan Trust,<br />
Series 2006-4, Class<br />
4CB1,<br />
6.50%, 5/25/46 1,909,521 933<br />
Banc of America<br />
Commercial Mortgage,<br />
Inc., Series 2007-3,<br />
Class A4,<br />
5.658%, 6/10/49 2,477,000 1,812<br />
Banc of America<br />
Commercial Mortgage,<br />
Inc., Series 2007-2,<br />
Class A4,<br />
5.688%, 4/10/49 12,033,000 9,142<br />
Banc of America<br />
Funding Corp., Series<br />
2007-1, Class TA1A,<br />
.531%, 1/25/37 1,771,135 840<br />
Banc of America<br />
Funding Corp., Series<br />
2007-4, Class TA1A,<br />
.561%, 5/25/37 2,769,408 2,406<br />
Structured Products<br />
(52.8%)<br />
Shares/<br />
$ Par<br />
Value<br />
$ (000's)<br />
Structured Products continued<br />
Banc of America<br />
Mortgage Securities,<br />
Inc., Series 2004-G,<br />
Class 2A6,<br />
4.648%, 8/25/34 3,817,000 3,667<br />
Bank of America Credit<br />
Card Trust, Series<br />
2007-A8, Class A8,<br />
5.59%, 11/17/14 4,500,000 4,211<br />
CenterPoint Energy<br />
Transition Bond Co.<br />
LLC, 5.17%, 8/1/19 1,730,000 1,745<br />
Chase Issuance Trust,<br />
Series 2007-A17, Class<br />
A, 5.12%, 10/15/14 7,000,000 6,494<br />
Citigroup Commercial<br />
Mortgage Trust, Series<br />
2007-C6, Class A4,<br />
5.7%, 12/10/49 5,502,000 4,147<br />
Citigroup Mortgage<br />
Loan Trust, Inc., Series<br />
2004-NCM2, Class<br />
2CB1,<br />
5.50%, 8/25/34 836,931 732<br />
Citigroup Mortgage<br />
Loan Trust, Inc., Series<br />
2005-1, Class 3A1,<br />
6.50%, 4/25/35 1,183,854 1,135<br />
Countrywide<br />
Alternative Loan Trust,<br />
Series 2003-J1, Class<br />
1A8, 5.25%, 10/25/33 74,668 60<br />
Countrywide Home<br />
Loan Mortgage Pass<br />
Through Trust, Series<br />
2005-31, Class 2A1,<br />
5.471%, 1/25/36 1,032,922 741<br />
Credit Suisse First<br />
Boston Mortgage<br />
Securities Corp., Series<br />
2005-7, Class 6A1,<br />
5.50%, 8/25/20 2,574,482 2,384<br />
(n) Credit Suisse Mortgage<br />
Capital Certificates,<br />
Series 2007-5, Class<br />
3A9, 6.00%, 8/25/37 2,136,930 1,454<br />
(n) Credit Suisse Mortgage<br />
Capital Certificates,<br />
Series 2007-5, Class<br />
3A19, 6.00%, 8/25/37 2,271,618 1,659<br />
(n) Criimi Mae Commercial<br />
Mortgage Trust, Series<br />
1998-C1, Class B,<br />
7.00%, 6/2/33 144A 2,090,371 2,090<br />
Discover Card Master<br />
Trust, Series 2007-A1,<br />
Class A1,<br />
5.65%, 3/16/20 5,000,000 3,786<br />
DLJ Commercial<br />
Mortgage Corp., Series<br />
1998-CF1, Class S,<br />
.728%, 2/18/31 IO 14,812,888 337<br />
Structured Products<br />
(52.8%)<br />
Shares/<br />
$ Par<br />
Value<br />
$ (000's)<br />
Structured Products continued<br />
DLJ Mortgage<br />
Acceptance Corp.,<br />
Series 1997-CF2, Class<br />
S, 62%, 10/15/30<br />
IO 144A 8,225,593 162<br />
Federal Home Loan<br />
Mortgage Corp.,<br />
4.00%, 10/1/20 1,404,829 1,420<br />
Federal Home Loan<br />
Mortgage Corp.,<br />
4.50%, 5/1/19 1,600,053 1,642<br />
Federal Home Loan<br />
Mortgage Corp.,<br />
4.50%, 7/1/20 4,473,207 4,586<br />
Federal Home Loan<br />
Mortgage Corp., Series<br />
3065, Class TN,<br />
4.50%, 10/15/33 1,770,301 1,806<br />
Federal Home Loan<br />
Mortgage Corp., Series<br />
3248, Class LN,<br />
4.50%, 7/15/35 3,933,426 4,015<br />
Federal Home Loan<br />
Mortgage Corp.,<br />
5.00%, 10/1/19 2,445,892 2,521<br />
Federal Home Loan<br />
Mortgage Corp.,<br />
5.00%, 2/1/20 354,390 365<br />
Federal Home Loan<br />
Mortgage Corp.,<br />
5.00%, 5/1/20 1,385,396 1,425<br />
Federal Home Loan<br />
Mortgage Corp.,<br />
5.00%, 10/1/20 1,977,737 2,035<br />
Federal Home Loan<br />
Mortgage Corp.,<br />
5.00%, 4/1/22 999,906 1,028<br />
Federal Home Loan<br />
Mortgage Corp.,<br />
5.00%, 9/1/35 7,520,257 7,696<br />
Federal Home Loan<br />
Mortgage Corp.,<br />
5.00%, 11/1/35 2,734,573 2,798<br />
(b)Federal Home Loan<br />
Mortgage Corp.,<br />
5.00%, 12/1/35 25,271,020 25,860<br />
Federal Home Loan<br />
Mortgage Corp.,<br />
5.00%, 6/1/38 5,462,256 5,588<br />
Federal Home Loan<br />
Mortgage Corp.,<br />
5.50%, 9/1/19 706,427 730<br />
Federal Home Loan<br />
Mortgage Corp.,<br />
5.50%, 11/1/19 1,991,977 2,058<br />
Federal Home Loan<br />
Mortgage Corp.,<br />
5.50%, 12/1/19 373,285 386<br />
Federal Home Loan<br />
Mortgage Corp.,<br />
5.50%, 3/1/20 2,702,904 2,790<br />
The Accompanying Notes are an Integral Part of the Financial Statements.<br />
Select Bond Portfolio 107
Select Bond Portfolio<br />
Structured Products<br />
(52.8%)<br />
Shares/<br />
$ Par<br />
Value<br />
$ (000's)<br />
Structured Products continued<br />
Federal Home Loan<br />
Mortgage Corp.,<br />
5.50%, 3/1/22 1,934,588 1,995<br />
Federal Home Loan<br />
Mortgage Corp.,<br />
5.50%, 4/1/22 2,896,047 2,987<br />
Federal Home Loan<br />
Mortgage Corp.,<br />
5.50%, 6/1/35 2,042,551 2,093<br />
(b) Federal Home Loan<br />
Mortgage Corp.,<br />
5.50%, 3/1/37 10,541,775 10,802<br />
(b) Federal Home Loan<br />
Mortgage Corp.,<br />
5.50%, 5/1/37 7,671,105 7,860<br />
Federal Home Loan<br />
Mortgage Corp.,<br />
5.50%, 6/1/37 5,653,288 5,793<br />
Federal Home Loan<br />
Mortgage Corp., Series<br />
K001, Class A2,<br />
5.651%, 4/25/16 5,382,489 5,613<br />
Federal Home Loan<br />
Mortgage Corp., Series<br />
2840, Class LK,<br />
6.00%, 11/15/17 1,122,929 1,163<br />
Federal Home Loan<br />
Mortgage Corp., Series<br />
2439, Class LH,<br />
6.00%, 4/15/32 2,550,000 2,627<br />
(b) Federal Home Loan<br />
Mortgage Corp.,<br />
6.00%, 8/1/37 31,106,678 32,078<br />
Federal National<br />
Mortgage Association,<br />
4.00%, 6/1/19 938,028 953<br />
Federal National<br />
Mortgage Association,<br />
4.50%, 6/1/19 4,798,473 4,924<br />
Federal National<br />
Mortgage Association,<br />
4.50%, 8/1/19 963,784 989<br />
Federal National<br />
Mortgage Association,<br />
4.50%, 12/1/19 548,642 563<br />
Federal National<br />
Mortgage Association,<br />
4.50%, 7/1/20 2,493,583 2,555<br />
Federal National<br />
Mortgage Association,<br />
4.50%, 9/1/20 3,375,693 3,459<br />
Federal National<br />
Mortgage Association,<br />
5.00%, 3/1/20 1,711,533 1,762<br />
Federal National<br />
Mortgage Association,<br />
5.00%, 4/1/20 676,556 696<br />
Federal National<br />
Mortgage Association,<br />
5.00%, 5/1/20 7,831,896 8,061<br />
Structured Products<br />
(52.8%)<br />
Shares/<br />
$ Par<br />
Value<br />
$ (000's)<br />
Structured Products continued<br />
Federal National<br />
Mortgage Association,<br />
5.00%, 3/1/34 529,867 542<br />
Federal National<br />
Mortgage Association,<br />
5.00%, 4/1/35 1,968,610 2,013<br />
Federal National<br />
Mortgage Association,<br />
5.00%, 7/1/35 3,250,590 3,323<br />
Federal National<br />
Mortgage Association,<br />
5.00%, 10/1/35 2,080,820 2,127<br />
Federal National<br />
Mortgage Association,<br />
5.32%, 4/1/14 1,700,402 1,767<br />
Federal National<br />
Mortgage Association,<br />
5.38%, 1/1/17 1,954,000 2,017<br />
Federal National<br />
Mortgage Association,<br />
5.50%, 4/1/21 1,564,491 1,614<br />
Federal National<br />
Mortgage Association,<br />
5.50%, 9/1/34 1,278,588 1,313<br />
Federal National<br />
Mortgage Association,<br />
5.50%, 3/1/35 4,099,307 4,206<br />
Federal National<br />
Mortgage Association,<br />
5.50%, 7/1/35 1,010,168 1,037<br />
Federal National<br />
Mortgage Association,<br />
5.50%, 8/1/35 2,571,576 2,639<br />
Federal National<br />
Mortgage Association,<br />
5.50%, 9/1/35 14,867,433 15,259<br />
Federal National<br />
Mortgage Association,<br />
5.50%, 10/1/35 4,460,820 4,578<br />
Federal National<br />
Mortgage Association,<br />
5.50%, 11/1/35 11,781,551 12,092<br />
Federal National<br />
Mortgage Association,<br />
5.50%, 1/1/36 9,595,368 9,848<br />
Federal National<br />
Mortgage Association,<br />
5.50%, 2/1/37 5,312,503 5,452<br />
Federal National<br />
Mortgage Association,<br />
5.50%, 3/1/37 1,836,991 1,885<br />
Federal National<br />
Mortgage Association,<br />
5.50%, 5/1/37 2,371,565 2,434<br />
Federal National<br />
Mortgage Association,<br />
5.50%, 6/1/37 418,256 429<br />
Federal National<br />
Mortgage Association,<br />
5.50%, 2/1/38 42,463,998 43,575<br />
Structured Products<br />
(52.8%)<br />
Shares/<br />
$ Par<br />
Value<br />
$ (000's)<br />
Structured Products continued<br />
Federal National<br />
Mortgage Association,<br />
5.50%, 3/1/38 797,770 818<br />
(b)Federal National<br />
Mortgage Association,<br />
5.50%, 4/1/38 10,982,238 11,269<br />
(b)Federal National<br />
Mortgage Association,<br />
5.50%, 5/1/38 15,010,153 15,402<br />
(b)Federal National<br />
Mortgage Association,<br />
5.50%, 6/1/38 9,629,367 9,881<br />
Federal National<br />
Mortgage Association,<br />
5.50%, 7/1/38 782,164 803<br />
Federal National<br />
Mortgage Association,<br />
6.00%, 5/1/35 216,460 223<br />
Federal National<br />
Mortgage Association,<br />
6.00%, 6/1/35 46,020 47<br />
Federal National<br />
Mortgage Association,<br />
6.00%, 7/1/35 4,328,299 4,462<br />
Federal National<br />
Mortgage Association,<br />
6.00%, 10/1/35 1,747,911 1,802<br />
Federal National<br />
Mortgage Association,<br />
6.00%, 11/1/35 3,948,599 4,070<br />
Federal National<br />
Mortgage Association,<br />
6.00%, 6/1/36 4,543,187 4,683<br />
Federal National<br />
Mortgage Association,<br />
6.00%, 9/1/36 2,554,178 2,633<br />
Federal National<br />
Mortgage Association,<br />
6.00%, 1/1/37 22,326 23<br />
Federal National<br />
Mortgage Association,<br />
6.00%, 6/1/37 43,883 46<br />
Federal National<br />
Mortgage Association,<br />
6.00%, 10/1/37 21,065 22<br />
Federal National<br />
Mortgage Association,<br />
6.00%, 11/1/37 14,856,934 15,312<br />
(b)Federal National<br />
Mortgage Association,<br />
6.00%, 1/1/38 18,136,454 18,690<br />
Federal National<br />
Mortgage Association,<br />
6.00%, 6/1/38 7,462,234 7,690<br />
Federal National<br />
Mortgage Association,<br />
Series 2002-W4, Class<br />
A4, 6.25%, 5/25/42 4,673,268 4,783<br />
Federal National<br />
Mortgage Association,<br />
6.50%, 9/1/37 1,155,572 1,202<br />
The Accompanying Notes are an Integral Part of the Financial Statements.<br />
108 Select Bond Portfolio
Select Bond Portfolio<br />
Structured Products<br />
(52.8%)<br />
Shares/<br />
$ Par<br />
Value<br />
$ (000's)<br />
Structured Products continued<br />
Federal National<br />
Mortgage Association,<br />
6.50%, 1/1/38 23,713,161 24,657<br />
Federal National<br />
Mortgage Association,<br />
6.50%, 9/1/38 17,532,116 18,228<br />
Federal National<br />
Mortgage Association,<br />
Series 1989-20, Class<br />
A, 6.75%, 4/25/18 830,186 869<br />
Federal National<br />
Mortgage Association<br />
Aces, Series 2006-M1,<br />
Class C,<br />
5.355%, 2/25/16 6,949,000 7,219<br />
(n) Final Maturity<br />
Amortizing Notes,<br />
Series 2004-1, Class 1,<br />
4.45%, 8/25/12 5,686,796 5,721<br />
First Horizon<br />
Alternative Mortgage<br />
Securities, Series<br />
2004-FA1, Class 1A1,<br />
6.25%, 10/25/34 2,524,565 2,142<br />
First Union National<br />
Bank Commercial<br />
Mortgage Trust, Series<br />
1999-C4, Class E,<br />
7.939%, 12/15/31<br />
144A 3,100,000 2,928<br />
Government National<br />
Mortgage Association,<br />
5.50%, 10/15/31 50,332 52<br />
Government National<br />
Mortgage Association,<br />
5.50%, 11/15/31 13,775 14<br />
Government National<br />
Mortgage Association,<br />
5.50%, 12/15/31 177,722 183<br />
Government National<br />
Mortgage Association,<br />
5.50%, 1/15/32 492,272 509<br />
Government National<br />
Mortgage Association,<br />
5.50%, 2/15/32 147,645 153<br />
Government National<br />
Mortgage Association,<br />
5.50%, 3/15/32 145,017 150<br />
Government National<br />
Mortgage Association,<br />
5.50%, 4/15/32 17,178 18<br />
Government National<br />
Mortgage Association,<br />
5.50%, 7/15/32 25,458 26<br />
Government National<br />
Mortgage Association,<br />
5.50%, 9/15/32 3,613,353 3,737<br />
Greenwich Capital<br />
Commerical Funding<br />
Corp., Series 2006-<br />
FL4A, Class A1,<br />
1.98%, 11/5/21 144A 508,781 376<br />
Structured Products<br />
(52.8%)<br />
Shares/<br />
$ Par<br />
Value<br />
$ (000's)<br />
Structured Products continued<br />
Louisiana Public<br />
Facilities Authority,<br />
Series 2008,<br />
6.65%, 8/1/20 RB 2,400,000 2,355<br />
Massachusetts RRB<br />
Special Purpose Trust,<br />
Series 2001-1, Class A,<br />
6.53%, 6/1/15 947,516 977<br />
MASTR Asset<br />
Securitization Trust,<br />
Series 2003-12, Class<br />
1A1, 5.25%, 12/25/24 1,286,091 1,241<br />
Merrill Lynch<br />
Alternative Note Asset,<br />
Series 2007-A1, Class<br />
A2A, .541%, 1/25/37 2,428,155 1,267<br />
Merrill Lynch/<br />
Countrywide<br />
Commercial Mortgage<br />
Trust, Series 2007-7,<br />
Class A4,<br />
5.749%, 6/12/50 2,399,000 1,703<br />
Mid-State Trust, Series<br />
6, Class A3,<br />
7.54%, 7/1/35 360,565 337<br />
Nissan Auto<br />
Receivables Owner<br />
Trust, Series 2006-A,<br />
Class A3,<br />
4.74%, 9/15/09 207,663 208<br />
Nissan Auto<br />
Receivables Owner<br />
Trust, Series 2007-B,<br />
Class A3,<br />
5.03%, 5/16/11 6,000,000 5,903<br />
Nordstrom Private<br />
Label Credit Card<br />
Master Note Trust,<br />
Series 2007-1A, Class<br />
A,<br />
4.92%, 5/15/13 144A 6,869,000 6,555<br />
(n) RMF Commercial<br />
Mortgage Pass-<br />
Through Certificates,<br />
Series 1997-1, Class F,<br />
7.471%, 1/15/19 144A 538,446 431<br />
TBW Mortgage Backed<br />
Pass Through<br />
Certificates, Series<br />
2007-1, Class A1,<br />
.561%, 3/25/37 1,967,565 1,733<br />
Thornburg Mortgage<br />
Securities Trust, Series<br />
2006-5, Class A1,<br />
.591%, 9/25/46 2,989,213 2,477<br />
Thornburg Mortgage<br />
Securities Trust, Series<br />
2006-1, Class A3,<br />
.641%, 1/25/46 6,303,256 6,279<br />
Thornburg Mortgage<br />
Securities Trust, Series<br />
2007-1, Class A1,<br />
1.505%, 3/25/37 2,177,411 1,798<br />
Structured Products<br />
(52.8%)<br />
Shares/<br />
$ Par<br />
Value<br />
$ (000's)<br />
Structured Products continued<br />
Thornburg Mortgage<br />
Securities Trust, Series<br />
2007-2, Class A3A,<br />
1.525%, 6/25/37 3,527,518 2,941<br />
Washington <strong>Mutual</strong><br />
Alternative Mortgage<br />
Pass-Through<br />
Certficates, Series<br />
2006-6, Class 4A,<br />
6.708%, 11/25/34 1,260,482 1,082<br />
Washington <strong>Mutual</strong><br />
Commercial Mortgage<br />
Securities Trust, Series<br />
2003-C1A, Class A,<br />
3.83%, 1/25/35 144A 1,435,077 1,361<br />
Wells Fargo Mortgage<br />
Backed Securities,<br />
Series 2006-2, Class<br />
1A1, 5.00%, 3/25/36 2,580,257 1,989<br />
Wells Fargo Mortgage<br />
Backed Securities<br />
Trust, Series 2004-S,<br />
Class A7,<br />
3.741%, 9/25/34 1,545,000 1,515<br />
Wells Fargo Mortgage<br />
Backed Securities<br />
Trust, Series 2004-N,<br />
Class A6,<br />
4.00%, 8/25/34 5,728,000 5,472<br />
Wells Fargo Mortgage<br />
Backed Securities<br />
Trust, Series 2005-1,<br />
Class 2A1,<br />
5.00%, 1/25/20 1,356,566 1,318<br />
Wells Fargo Mortgage<br />
Backed Securities<br />
Trust, Series 2005-7,<br />
Class A1,<br />
5.25%, 9/25/35 3,109,308 2,658<br />
Wells Fargo Mortgage<br />
Backed Securities<br />
Trust, Series 2005-11,<br />
Class 1A1,<br />
5.50%, 11/25/35 3,515,206 2,988<br />
Total Structured Products<br />
(Cost: $579,779) 575,243<br />
Short-Term Investments (9.5%)<br />
Aircraft (1.8%)<br />
(b)Textron, Inc.,<br />
6.00%, 1/2/09 20,000,000 19,997<br />
Total 19,997<br />
Autos (1.8%)<br />
(b)Toyota Motor Credit<br />
Corp., 1.15%, 1/13/09 10,000,000 9,996<br />
(b)Toyota Motor Credit<br />
Corp., 1.40%, 1/9/09 10,000,000 9,997<br />
Total 19,993<br />
The Accompanying Notes are an Integral Part of the Financial Statements.<br />
Select Bond Portfolio 109
Select Bond Portfolio<br />
Short-Term Investments<br />
(9.5%)<br />
Shares/<br />
$ Par<br />
Value<br />
$ (000's)<br />
Commercial Banks Non-US (0.4%)<br />
(b) Barclays US Funding<br />
Corp., .18%, 1/9/09 4,000,000 3,999<br />
Total 3,999<br />
Federal Government & Agencies (0.2%)<br />
(b) Federal Home Loan<br />
Bank, 0.47%, 3/13/09 2,000,000 2,000<br />
Total 2,000<br />
Finance Services (1.8%)<br />
(b) Ciesco LP,<br />
0.20%, 1/12/09 10,000,000 9,999<br />
(b) Gemini Securitization<br />
Corp. LLC,<br />
.75%, 1/26/09 10,000,000 9,997<br />
Total 19,996<br />
Food Processors (0.6%)<br />
(b) Kellogg Co.,<br />
1.70%, 1/13/09 6,900,000 6,896<br />
Total 6,896<br />
Oil and Gas (1.5%)<br />
(b) Devon Energy Corp.,<br />
1.25%, 1/2/09 15,890,000 15,889<br />
Total 15,889<br />
Personal Credit Institutions (0.5%)<br />
(b) HSBC Finance Corp.,<br />
0.30%, 1/6/09 5,000,000 5,000<br />
Total 5,000<br />
Retail Stores (0.9%)<br />
(b) Home Depot, Inc.,<br />
2.50%, 1/2/09 10,000,000 9,999<br />
Total 9,999<br />
Total Short Term Investments<br />
(Cost: $103,768) 103,769<br />
Total Investments (105.2%)<br />
(Cost: $1,163,774)(a) 1,145,734<br />
Other Assets, Less<br />
Liabilities (-5.2%) (57,087)<br />
Net Assets (100.0%) 1,088,647<br />
* Non-Income Producing<br />
144A after the name of a security represents a security exempt from registration under Rule 144A of the Securities Act of 1933. These securities may be<br />
resold as transactions exempt from registration, normally to qualified institutional buyers. At December 31, 2008 the value of these securities (in thousands)<br />
was $27,413, representing 2.52% of the net assets.<br />
IO — Interest Only Security<br />
RB — Revenue Bond<br />
AMBAC — American Municipal Bond Assurance Corp.<br />
The Accompanying Notes are an Integral Part of the Financial Statements.<br />
110 Select Bond Portfolio
Select Bond Portfolio<br />
(a)<br />
(b)<br />
At December 31, 2008 the aggregate cost of securities for federal tax purposes (in thousands) was $1,168,448 and the net unrealized depreciation of<br />
investments based on that cost was $22,714 which is comprised of $35,912 aggregate gross unrealized appreciation and $58,626 aggregate gross unrealized<br />
depreciation.<br />
All or a portion of the securities have been committed as collateral for open futures positions or when-issued securities. Information regarding open futures<br />
contracts as of period end is summarized below.<br />
Unrealized<br />
Appreciation/<br />
Number of<br />
(Depreciation)<br />
Issuer (000's)<br />
Contracts Expiration Date (000's)<br />
US Five Year Note Commodity (Long) (Total Notional Value at December 31, 2008, $33,540) 288 3/09 $ 747<br />
US Long Bond (CBT) Commodity (Short) (Total Notional Value at December 31, 2008, $39,346) 298 3/09 (1,793)<br />
US Ten Year Treasury Note (Short) (Total Notional Value at December 31, 2008, $103,224) 868 3/09 (5,929)<br />
US Two Year Treasury Note (Long) (Total Notional Value at December 31, 2008, $101,324) 471 3/09 1,382<br />
(d)<br />
(e)<br />
(g)<br />
Defaulted Security<br />
Step bond security that presently receives no coupon payments. At the predetermined date the stated coupon rate becomes effective.<br />
All or portion of the securities have been loaned. See Note 2M in the Notes to Financial Statements.<br />
(m) Securities showing zero value represent an amount less than one thousand.<br />
(n)<br />
At December 31, 2008 portfolio securities with a aggregate market value of $13,350 (in thousands) were valued with reference to securities whose values<br />
are more readily available.<br />
The Accompanying Notes are an Integral Part of the Financial Statements.<br />
Select Bond Portfolio 111
Long-Term U.S. Government Bond Portfolio<br />
Objective: Portfolio Strategy: Net Assets:<br />
Seek maximum total return, consistent with<br />
preservation of capital and prudent<br />
investment management.<br />
Invest primarily in debt securities that are<br />
issued or guaranteed by the U.S. Government,<br />
its agencies or government-sponsored<br />
enterprises, and in derivatives designed to<br />
replicate such securities.<br />
$90 million<br />
Portfolio Overview<br />
Mason Street Advisors, the investment adviser for the Long-Term U.S. Government Bond Portfolio, has engaged Pacific<br />
Investment Management Company LLC to act as sub-adviser for the Portfolio. The Portfolio investment objective is to seek<br />
maximum total return, consistent with preservation of capital and prudent investment management. The Portfolio seeks to<br />
achieve its investment objective by investing under normal circumstances at least 80% of its net assets (plus any borrowings<br />
for investment purposes) in a diversified portfolio of fixed income securities that are issued or guaranteed by the U.S.<br />
Government, its agencies or government-sponsored enterprises (“U.S. Government Securities”). Assets not invested in U.S.<br />
Government Securities may be invested in other types of investment-grade fixed-income instruments, or in preferred stocks.<br />
The Portfolio may also obtain exposure to U.S. Government Securities through the use of futures contracts (including related<br />
options) with respect to such securities. The Portfolio may invest all of its assets in derivative instruments, such as options,<br />
futures, contracts or swap agreements, or in mortgage-backed securities such as those issued by Ginnie Mae, Fannie Mae and<br />
Freddie Mac. The Portfolio may, without limitation, seek to obtain market exposure to the securities in which it primarily<br />
invests by entering into a series of purchase and sale contracts of by using other investment techniques (such as buy backs on<br />
dollar rolls).<br />
Market Overview<br />
In 2008, interest rates fell worldwide and yield curves in the U.S., Europe and U.K. steepened as investors fled to the safety of<br />
government bonds, especially shorter maturities. To forestall a recession and unfreeze credit markets during the early part of<br />
the year, the Federal Reserve reduced its short-term rate target by 200 basis points (a basis point equals 0.01%, so 200 basis<br />
points equal 2%) and took several unconventional steps: it made several hundred billion dollars of liquidity facilities available<br />
to the financial system against an expanded range of collateral, opened its discount window to investment banks and arranged<br />
the rescue of Bear Stearns.<br />
The crisis, which was originally thought to be contained within the housing market, gradually spread to the corporate sector.<br />
The month of September featured a succession of shocking events, including the Treasury’s bailout of mortgage agencies<br />
Fannie Mae and Freddie Mac and insurer AIG, as well as the realignment of the biggest U.S. investment banks via bankruptcy,<br />
merger, recapitalization, or transformation into bank holding companies.<br />
In early October, the U.S. Congress approved the $700 billion Troubled Asset Relief Program (TARP) proposed by the<br />
Treasury and the Fed to help unclog the flow of credit. As data continued to show a weakening economy in the midst of a deep<br />
recession, the Fed took forceful action, to get the economy growing again, cutting its fed funds rate target to between 0% and<br />
0.25%.<br />
Portfolio Results<br />
For the twelve months ended December 31, 2008, the Long-Term U.S. Government Bond Portfolio underperformed its<br />
benchmark, the Barclays Capital Long-Term Treasury Index, with a 20.76% return versus 24.03% for its benchmark. (This<br />
Index is unmanaged, cannot be invested in directly and does not include administrative expenses or sales charges.) The<br />
average return for the Portfolio’s peer group, General U.S. Government Bond Funds, was 3.86%, according to Lipper<br />
Analytical Services, Inc., an independent mutual fund ranking agency.<br />
In terms of contribution to the Portfolio’s performance, a curve-steepening bias for the majority of the year helped<br />
performance as the U.S. yield curve (indicated by the difference in yield between two- and 30-year bonds) steepened as much<br />
as 141 basis points through October. However, a 90 basis point flattening of the curve in November and December mitigated<br />
some of the impact. Modest holdings of inflation-adjusted bonds during the early part of the year was positive for returns as<br />
these bonds outperformed like-duration nominal bonds.<br />
At the other end of the spectrum, it detracted from performance relative to the benchmark to have a shorter duration as yields<br />
fell. (Duration measures a bond or fund’s sensitivity to interest rate changes. It is beneficial to have a longer duration when<br />
yields fall, and a shorter duration when yields rise.)<br />
An allocation to long-term corporate bonds detracted from performance. Investors began to price in higher default rates and<br />
lower recovery levels, causing long-term investment grade corporates to underperform Treasuries by 28% (2800 basis points)<br />
for the year.<br />
112 Long-Term U.S. Government Bond Portfolio
Long-Term U.S. Government Bond Portfolio<br />
A focus on high-grade financials within the investment grade corporate space was also negative for returns as the financial<br />
services sector was hurt by write-downs, decreased profitability, and funding issues.<br />
An out-of-benchmark allocation to agency mortgage-backed securities hurt performance, as agency mortgage-backed<br />
securities returned 8.34% in 2008, underperforming Treasuries by 232 basis points.<br />
During the year, the Portfolio also sought to add value by using derivative instruments to gain exposure to U.S. Government<br />
securities, which can be a less expensive and more efficient way to access this area of the market.<br />
Outlook<br />
We expect pressures of global de-leveraging to drive developed economies into one of the most severe recessions since World<br />
War II in 2009. We see conditions improving by 2010 as policy responses in the U.S. and elsewhere gain traction, with the<br />
recovery of risk appetites in financial markets as a leading indicator for recovery. As the global economy weakens into 2009,<br />
we will likely place less emphasis on interest rate strategies and more on high grade sectors/securities that we feel offer<br />
unusually attractive valuations after the massive selling of the last several months. Our approach over the next year will likely<br />
be to avoid assets such as Treasuries that have benefitted from the flight-to-liquidity associated with global deleveraging. By<br />
our estimate, Treasuries are now overvalued. We might seek to own assets that have been victims of the economic crisis but<br />
that we would expect to benefit from policy support. These assets include high quality mortgage-backed securities, bonds of<br />
financial companies, Treasury inflation-protected securities and municipal bonds.<br />
$14,000<br />
13,000<br />
12,000<br />
11,000<br />
Relative Performance<br />
10,000<br />
4/07 12/07 12/08<br />
Long-Term U.S. Government Bond Portfolio<br />
Barclays Capital Long-Term U.S. Treasury Index**<br />
Average <strong>Annual</strong> Total Returns<br />
For Periods Ended December 31, 2008<br />
1 Year<br />
Since<br />
Inception*<br />
Long-Term U.S. Government Bond<br />
Portfolio 20.76% 16.93%<br />
Barclays Capital Long-Term U.S.<br />
Treasury Index** 24.03% 18.96%<br />
Lipper Variable Insurance Products<br />
(VIP) General U.S. Government<br />
Bond Funds Average 3.86% –<br />
*Inception date of 4/30/07<br />
** Prior to November 1, 2008, the Barclays Capital Long-Term U.S.<br />
Treasury Index was known as the Lehman Brothers Long-Term U.S.<br />
Treasury Index.<br />
The performance data quoted represents past<br />
performance. Past performance is historical and does<br />
not guarantee future performance. Investment return<br />
and principal value will fluctuate, so that shares, when<br />
redeemed, may be worth more or less than their original<br />
cost. Current performance may be lower or higher than<br />
the performance data quoted. For the most recent<br />
month-end performance information visit<br />
www.nmfn.com.<br />
This chart assumes an initial investment of $10,000<br />
made on 4/30/07 (commencement of the Portfolio's<br />
operations). Returns shown reflect fee waivers,<br />
deductions for management and other portfolio<br />
expenses, and reinvestment of all dividends. In the<br />
absence of fee waivers, total return would be reduced.<br />
Returns exclude deductions for separte account sale<br />
loads and account fees. Please refer to the Benchmark<br />
Definitions section of this report for information about<br />
the indices cited in the above chart and graph.<br />
Return of principal is not guaranteed. Bond funds have<br />
the same interest rate, inflation and credit risks that are<br />
associated with the underlying bonds owned by the<br />
Portfolio. When interest rates rise, bond prices fall. With<br />
a fixed income fund, when interest rates rise, the value<br />
of the fund’s existing bonds drops, which could<br />
negatively affect overall fund performance.<br />
The Portfolio may invest in securities that are issued or<br />
guaranteed by the U.S. Government or its agencies, and<br />
in derivatives designed to replicate such securities. This<br />
guarantee is to timely repayment of the principal and<br />
interest if held to maturity, and does not apply to<br />
derivative securities held by the Portfolio. Guarantee<br />
does not eliminate market risk. The Portfolio may use<br />
derivative instruments for hedging purposes as part of<br />
its investment strategy. Use of these instruments may<br />
involve certain costs and risks such as liquidity risk,<br />
interest rate risk, market risk, credit risk, management<br />
risk and the risk that the Portfolio could not close out a<br />
position when it would be most advantageous to do so.<br />
Portfolios investing in derivatives could lose more than<br />
the principal amount invested in those instruments.<br />
Long-Term U.S. Government Bond Portfolio 113
Long-Term U.S. Government Bond Portfolio<br />
Top 10 Fixed Income Holdings 12/31/08<br />
Security Description<br />
% of Net Assets<br />
US Treasury, Various 54.8%<br />
Federal National Mortgage Association<br />
Mortgage Pool, Various 10.4%<br />
Federal National Mortgage Association, Various 4.4%<br />
Residual Funding Stripped, Various 2.1%<br />
Chase Issuance Trust, Various 2.0%<br />
Tennessee Valley Authority, Various 1.9%<br />
Financing Corp. Stripped, Various 1.4%<br />
Credit Suisse USA, Inc., Various 0.9%<br />
Israel Government AID Bond, Various 0.7%<br />
Federal Home Loan Mortgage Corp., Series<br />
2752, Class EZ, 5.50%, 2/15/34 0.7%<br />
Corporate Bonds<br />
5%<br />
Short-Term Investments<br />
& Other Net Assets<br />
10%<br />
Sector Allocation 12/31/08<br />
Structured<br />
Products<br />
20%<br />
Governments<br />
65%<br />
Sector Allocation is based on Net Assets.<br />
Sector Allocation and Top 10 Holdings are subject to<br />
change.<br />
The Corporate Bonds sector includes bonds of companies<br />
and governments headquartered outside the United States.<br />
The Government and Structured Product categories include<br />
domestic taxable bonds.<br />
Consistent with the Portfolio’s stated parameters, no more<br />
than 10% of the Portfolio is invested in securities rated A by<br />
Moody’s or S&P and no more than 25% of the Portfolio is<br />
invested in securities rated Aa by Moody’s or AA by S&P.<br />
114 Long-Term U.S. Government Bond Portfolio
Long-Term U.S. Government Bond Portfolio<br />
<strong>Northwestern</strong> <strong>Mutual</strong> Series Fund, Inc.<br />
Schedule of Investments<br />
December 31, 2008<br />
Corporate Bonds (5.2%)<br />
Banking (2.8%)<br />
Shares/<br />
$ Par<br />
Value<br />
$ (000's)<br />
Bank of America Corp.,<br />
2.099%, 6/12/09 100,000 100<br />
Citigroup Funding, Inc.,<br />
3.556%, 5/7/10 200,000 190<br />
Citigroup, Inc.,<br />
1.496%, 12/28/09 300,000 283<br />
Citigroup, Inc.,<br />
6.125%, 8/25/36 200,000 179<br />
Credit Suisse USA, Inc.,<br />
0.588%, 11/20/09 100,000 96<br />
Credit Suisse USA, Inc.,<br />
2.273%, 6/5/09 300,000 295<br />
Credit Suisse USA, Inc.,<br />
2.298%, 11/20/09 100,000 96<br />
Credit Suisse USA, Inc.,<br />
2.349%, 8/16/11 300,000 270<br />
The Goldman Sachs<br />
Group, Inc.,<br />
1.566%, 6/28/10 200,000 186<br />
The Goldman Sachs<br />
Group, Inc.,<br />
2.886%, 2/6/12 200,000 169<br />
HSBC Finance Corp.,<br />
2.638%, 5/10/10 300,000 271<br />
Wachovia Corp.,<br />
2.253%, 12/1/09 200,000 194<br />
Wells Fargo Capital X,<br />
5.95%, 12/15/36 200,000 172<br />
Total 2,501<br />
Electronics (0.3%)<br />
Hewlett-Packard Co.,<br />
2.313%, 3/1/12 300,000 267<br />
Total 267<br />
Independent Finance (0.9%)<br />
Caterpillar Financial<br />
Services Corp.,<br />
2.216%, 6/24/11 400,000 357<br />
General Electric Capital<br />
Corp., 6.75%, 3/15/32 200,000 213<br />
John Deere Capital<br />
Corp., 4.715%, 7/16/10 300,000 281<br />
Total 851<br />
Life Insurance (0.3%)<br />
Pricoa Global Funding I,<br />
4.963%, 1/15/10 144A 300,000 272<br />
Total 272<br />
Property and Casualty Insurance (0.6%)<br />
American International<br />
Group, Inc.,<br />
3.548%, 1/29/10 144A 300,000 270<br />
Shares/ Value<br />
Corporate Bonds (5.2%) $ Par $ (000's)<br />
Property and Casualty Insurance<br />
continued<br />
Metropolitan Life Global<br />
Funding I,<br />
2.189%, 5/17/10 144A 300,000 269<br />
Total 539<br />
Retail Stores (0.3%)<br />
Wal-Mart Stores, Inc.,<br />
6.20%, 4/15/38 200,000 229<br />
Total 229<br />
Total Corporate Bonds<br />
(Cost: $4,983) 4,659<br />
Governments (65.4%)<br />
Governments (65.4%)<br />
Federal Home Loan<br />
Banks, 5.625%, 6/11/21 100,000 115<br />
Federal National<br />
Mortgage Association,<br />
0.00%, 6/1/17 300,000 225<br />
Federal National<br />
Mortgage Association,<br />
5.25%, 10/1/12 300,000 300<br />
Federal National<br />
Mortgage Association,<br />
5.375%, 4/11/22 400,000 422<br />
Federal National<br />
Mortgage Association,<br />
6.25%, 5/15/29 1,900,000 2,594<br />
Federal National<br />
Mortgage Association,<br />
6.625%, 11/15/30 300,000 433<br />
Financing Corp.<br />
Stripped,<br />
0.00%, 12/27/18 500,000 343<br />
Financing Corp.<br />
Stripped,<br />
0.00%, 9/26/19 1,300,000 887<br />
Israel Government AID<br />
Bond, 0.00%, 5/15/21 200,000 129<br />
Israel Government AID<br />
Bond, 0.00%, 2/15/23 100,000 60<br />
Israel Government AID<br />
Bond, 0.00%, 5/15/23 800,000 470<br />
Residual Funding<br />
Stripped,<br />
0.00%, 10/15/20 1,800,000 1,148<br />
Residual Funding<br />
Stripped,<br />
0.00%, 4/15/30 1,600,000 742<br />
Tennessee Valley<br />
Authority,<br />
4.50%, 4/1/18 200,000 221<br />
Governments (65.4%)<br />
Shares/<br />
$ Par<br />
Value<br />
$ (000's)<br />
Governments continued<br />
Tennessee Valley<br />
Authority,<br />
5.375%, 4/1/56 1,210,000 1,533<br />
US Treasury,<br />
4.50%, 5/15/38 1,800,000 2,457<br />
US Treasury,<br />
5.25%, 11/15/28 1,400,000 1,848<br />
US Treasury,<br />
5.375%, 2/15/31 400,000 550<br />
US Treasury,<br />
6.25%, 8/15/23 700,000 955<br />
(b)US Treasury,<br />
7.125%, 2/15/23 9,300,000 13,492<br />
(b)US Treasury,<br />
8.125%, 8/15/21 5,200,000 7,909<br />
US Treasury,<br />
8.75%, 8/15/20 200,000 312<br />
US Treasury Inflation<br />
Index Bond,<br />
1.75%, 1/15/28 620,472 573<br />
US Treasury Inflation<br />
Index Bond,<br />
2.375%, 1/15/25 1,034,397 1,017<br />
US Treasury Inflation<br />
Index Bond,<br />
3.625%, 4/15/28 401,838 479<br />
(b)US Treasury Stripped,<br />
0.00%, 5/15/20 4,600,000 3,163<br />
(b)US Treasury Stripped,<br />
0.00%, 11/15/21 15,500,000 10,049<br />
US Treasury Stripped,<br />
0.00%, 8/15/22 7,200,000 4,583<br />
US Treasury Stripped,<br />
0.00%, 5/15/26 700,000 408<br />
US Treasury Stripped,<br />
0.00%, 11/15/28 3,000,000 1,610<br />
Total Governments<br />
(Cost: $55,509) 59,027<br />
Municipal Bonds (0.2%)<br />
Municipal Bonds (0.2%)<br />
Poway Unified Public<br />
School District, ,<br />
4.50%, 9/15/37 RB,<br />
AMBAC 200,000 158<br />
Puerto Rico Sales Tax<br />
Financing Corp., Series<br />
A, 0.00%, 8/1/54 RB,<br />
AMBAC 1,600,000 56<br />
Total 214<br />
Total Municipal Bonds<br />
(Cost: $329) 214<br />
The Accompanying Notes are an Integral Part of the Financial Statements.<br />
Long-Term U.S. Government Bond Portfolio 115
Long-Term U.S. Government Bond Portfolio<br />
Structured Products<br />
(19.9%)<br />
Structured Products (19.9%)<br />
Shares/<br />
$ Par<br />
Value<br />
$ (000's)<br />
American Home<br />
Mortgage Investment<br />
Trust, Series 2005-3,<br />
Class 2A2,<br />
5.00%, 9/25/35 100,000 73<br />
Bank of America Credit<br />
Card Trust, Series<br />
2006-A9, Class A9,<br />
1.205%, 2/15/13 200,000 182<br />
Bank of America Credit<br />
Card Trust, Series<br />
2007-A9, Class A9,<br />
1.235%, 11/17/14 200,000 164<br />
Bank of America Credit<br />
Card Trust, Series<br />
2008-A7, Class A7,<br />
1.895%, 12/15/14 300,000 250<br />
Bear Stearns Adjustable<br />
Rate Mortgage Trust,<br />
Series 2004-2, Class<br />
21A, 6.164%, 5/25/34 7,187 5<br />
Chase Credit Card<br />
Master Trust, Series<br />
2002-3, Class A,<br />
1.365%, 9/15/11 100,000 98<br />
Chase Issuance Trust,<br />
Series 2007-A6, Class<br />
A6, 1.195%, 4/16/12 400,000 372<br />
Chase Issuance Trust,<br />
Series 2007-A1, Class<br />
A1, 1.215%, 3/15/13 200,000 178<br />
Chase Issuance Trust,<br />
Series 2005-A8, Class<br />
A8, 1.235%, 10/15/12 500,000 456<br />
Chase Issuance Trust,<br />
Series 2007-A14, Class<br />
A14, 1.445%, 9/15/11 100,000 97<br />
Chase Issuance Trust,<br />
Series 2008-A1, Class<br />
A1, 1.645%, 1/15/12 200,000 190<br />
Chase Issuance Trust,<br />
Series 2008-A7, Class<br />
A7, 1.845%, 11/15/11 100,000 96<br />
Chase Issuance Trust,<br />
Series 2008-A10, Class<br />
A10, 1.945%, 8/17/15 200,000 158<br />
Chase Issuance Trust,<br />
Series 2008-A13, Class<br />
A13, 3.496%, 9/15/15 300,000 247<br />
Chevy Chase Mortgage<br />
Funding Corp., Series<br />
2007-2A, Class A1,<br />
0.601%, 5/25/48 144A 18,138 8<br />
Citigroup Mortgage<br />
Loan Trust, Inc., Series<br />
2007-AHL3, Class<br />
A3A, 0.531%, 7/25/45 68,320 53<br />
Countrywide Alternative<br />
Loan Trust, Series<br />
2005-81, Class A1,<br />
0.751%, 2/25/37 139,399 69<br />
Structured Products<br />
(19.9%)<br />
Shares/<br />
$ Par<br />
Value<br />
$ (000's)<br />
Structured Products continued<br />
Countrywide Home<br />
Loan Mortgage Pass<br />
Through Trust, Series<br />
2004-HYB5, Class<br />
2A1, 4.812%, 4/20/35 33,246 24<br />
Countrywide Home<br />
Loan Mortgage Pass<br />
Through Trust, Series<br />
2005-12, Class 1A2,<br />
5.25%, 5/25/35 182,560 109<br />
Credit Suisse First<br />
Boston Mortgage<br />
Securities Corp., Series<br />
2003-AR20, Class 2A1,<br />
4.626%, 8/25/33 11,144 9<br />
Credit Suisse First<br />
Boston Mortgage<br />
Securities Corp., Series<br />
2003-AR18, Class 2A3,<br />
5.047%, 7/25/33 9,259 8<br />
Federal Home Loan<br />
Mortgage Corp., Series<br />
3346, Class FA,<br />
1.425%, 2/15/19 153,492 147<br />
Federal Home Loan<br />
Mortgage Corp., Series<br />
3203, Class ZW,<br />
5.00%, 11/15/35 337,042 330<br />
Federal Home Loan<br />
Mortgage Corp., Series<br />
2752, Class EZ,<br />
5.50%, 2/15/34 651,863 647<br />
Federal Home Loan<br />
Mortgage Corp.<br />
Structured Pass-<br />
Through Securities,<br />
Series T-61, Class 1A1,<br />
3.878%, 7/25/44 43,474 39<br />
Federal National<br />
Mortgage Association,<br />
Series 2007-114, Class<br />
A6, 0.671%, 10/27/37 100,000 85<br />
Federal National<br />
Mortgage Association,<br />
Series 2007-39, Class<br />
NZ, 4.25%, 5/25/37 214,654 199<br />
Federal National<br />
Mortgage Association,<br />
5.00%, 6/1/35 1,031,023 1,055<br />
Federal National<br />
Mortgage Association,<br />
5.00%, 2/1/36 1,902,331 1,945<br />
Federal National<br />
Mortgage Association,<br />
Series 2005-47, Class<br />
PA, 5.50%, 9/25/24 26,942 27<br />
Federal National<br />
Mortgage Association,<br />
Series 2005-57, Class<br />
PA, 5.50%, 5/25/27 15,207 15<br />
Structured Products<br />
(19.9%)<br />
Shares/<br />
$ Par<br />
Value<br />
$ (000's)<br />
Structured Products continued<br />
Federal National<br />
Mortgage Association<br />
TBA, 5.00%, 1/1/39 2,000,000 2,042<br />
Federal National<br />
Mortgage Association<br />
TBA, 5.50%, 1/1/39 4,200,000 4,305<br />
Federal National<br />
Mortgage Association<br />
Whole Loan, Series<br />
2004-W9, Class 1A3,<br />
6.05%, 2/25/44 300,000 324<br />
First Franklin Mortgage<br />
Loan Asset Backed<br />
Certificates, Series<br />
2006-FF12, Class A2,<br />
0.511%, 9/25/36 25,606 24<br />
General Motors<br />
Acceptance Corp.<br />
Mortgage Corp. Loan<br />
Trust, Series 2004-<br />
AR1, Class 22A,<br />
4.287%, 6/25/34 25,845 14<br />
Honda Auto Receivables<br />
Owner Trust, Series<br />
2008-1, Class A2,<br />
3.77%, 9/20/10 400,000 394<br />
Indymac Residential<br />
Asset Backed Trust,<br />
Series 2007-B, Class<br />
2A1, 0.551%, 7/25/37 44,264 39<br />
JPMorgan Chase<br />
Commercial Mortgage<br />
Securities Corp., Series<br />
2007-CB19, Class A4,<br />
5.747%, 2/12/49 100,000 74<br />
Massachusetts<br />
Educational Financing<br />
Authority, Series 2008-<br />
1, Class A1,<br />
4.485%, 4/25/38 387,764 294<br />
MBNA Credit Card<br />
Master Note Trust,<br />
Series 2002-A5, Class<br />
A5, 1.375%, 10/17/11 200,000 196<br />
Merrill Lynch First<br />
Franklin Mortgage<br />
Loan Trust, Series<br />
2007-4, Class 2A1,<br />
0.531%, 7/25/37 55,744 50<br />
Merrill Lynch Floating<br />
Trust, Series 2008-<br />
LAQA, Class A1,<br />
2.406%, 7/9/21 144A 400,000 336<br />
Merrill Lynch Mortgage<br />
Investors, Inc., Series<br />
2003-A4, Class 3A,<br />
4.986%, 5/25/33 18,630 17<br />
Merrill Lynch Mortgage<br />
Investors, Inc., Series<br />
2003-A3, Class 1A,<br />
5.297%, 5/25/33 23,096 17<br />
The Accompanying Notes are an Integral Part of the Financial Statements.<br />
116 Long-Term U.S. Government Bond Portfolio
Long-Term U.S. Government Bond Portfolio<br />
Structured Products<br />
(19.9%)<br />
Shares/<br />
$ Par<br />
Value<br />
$ (000's)<br />
Structured Products continued<br />
MLCC Mortgage<br />
Investors, Inc., Series<br />
2005-3, Class 4A,<br />
0.721%, 11/25/35 57,253 41<br />
MLCC Mortgage<br />
Investors, Inc., Series<br />
2005-2, Class 1A,<br />
3.819%, 10/25/35 66,846 51<br />
Morgan Stanley ABS<br />
Capital I, Inc., Series<br />
2007-NC3, Class A2A,<br />
0.531%, 5/25/37 55,192 45<br />
SLC Student Loan Trust,<br />
Series 2007-1, Class<br />
A1, 2.129%, 2/15/15 77,660 76<br />
SLM Student Loan<br />
Trust, Series 2003-7A,<br />
Class A5A,3.196%,<br />
12/15/33 144A 250,000 196<br />
SLM Student Loan<br />
Trust, Series 2006-7,<br />
Class A2,<br />
3.525%, 10/25/16 25,195 25<br />
SLM Student Loan<br />
Trust, Series 2006-5,<br />
Class A2,<br />
3.525%, 7/25/17 32,024 31<br />
SLM Student Loan<br />
Trust, Series 2006-6,<br />
Class A1,<br />
3.525%, 10/25/18 38,561 37<br />
SLM Student Loan<br />
Trust, Series 2006-9,<br />
Class A2,<br />
3.535%, 4/25/17 41,961 41<br />
SLM Student Loan<br />
Trust, Series 2007-2,<br />
Class A2,<br />
3.535%, 7/25/17 500,000 438<br />
SLM Student Loan<br />
Trust, Series 2008-7,<br />
Class A2,<br />
4.035%, 10/25/17 200,000 181<br />
SLM Student Loan<br />
Trust, Series 2008-9,<br />
Class A,<br />
5.035%, 4/25/23 600,000 562<br />
Structured Products<br />
(19.9%)<br />
Shares/<br />
$ Par<br />
Value<br />
$ (000's)<br />
Structured Products continued<br />
South Carolina Student<br />
Loan Corp., Series<br />
2008-1, Class A1,<br />
2.703%, 9/2/14 251,308 245<br />
South Carolina Student<br />
Loan Corp., Series<br />
2008-1, Class A2,<br />
2.753%, 3/1/18 400,000 362<br />
Structured Adjustable<br />
Rate Mortgage Loan<br />
Trust, Series 2004-18,<br />
Class 4A1,<br />
5.19%, 12/25/34 51,556 37<br />
Structured Asset<br />
Mortgage Investments,<br />
Inc., Series 2004-AR5,<br />
Class 1A1,<br />
0.911%, 10/19/34 14,378 8<br />
Washington <strong>Mutual</strong><br />
Mortgage Pass-Through<br />
Certificates, Series<br />
2006-AR9, Class 1A,<br />
3.256%, 8/25/46 61,942 24<br />
Washington <strong>Mutual</strong><br />
Mortgage Pass-Through<br />
Certificates, Series<br />
2004-AR1, Class A,<br />
4.229%, 3/25/34 89,111 73<br />
Total Structured Products<br />
(Cost: $18,493) 17,934<br />
Short-Term Investments (30.7%)<br />
Federal Government & Agencies (11.9%)<br />
(b) Federal Home Loan<br />
Bank Corp.,<br />
0.03%, 1/5/09 10,700,000 10,700<br />
Total 10,700<br />
National Commercial Banks (0.4%)<br />
(b) Bank of America Corp.,<br />
2.55%, 1/29/09 400,000 399<br />
Total 399<br />
Other Holdings (6.9%)<br />
(b) JPMorgan Money<br />
Market Fund 6,197,207 6,197<br />
Total 6,197<br />
Short-Term Investments<br />
(30.7%)<br />
Shares/<br />
$ Par<br />
Repurchase Agreements (11.5%)<br />
Value<br />
$ (000's)<br />
(b)JPMorgan Chase Bank,<br />
0.09%, dated 12/29/08,<br />
due 1/5/09, repurchase<br />
price $3,400,051,<br />
collateralized by U.S.<br />
Government Agency<br />
Bond with a value of<br />
$3,454,206 3,400,000 3,400<br />
(b)JPMorgan Chase Bank,<br />
0.40%, dated 12/29/08,<br />
due 1/5/09, repurchase<br />
price $7,000,467,<br />
collateralized by U.S.<br />
Government Agency<br />
Bond with a value of<br />
$7,292,712 7,000,000 7,000<br />
Total 10,400<br />
Total Short-Term Investments<br />
(Cost: $27,696) 27,696<br />
Total Investments (121.4%)<br />
(Cost: $107,010)(a) 109,530<br />
Other Assets, Less<br />
Liabilities (-21.4%) (19,324)<br />
Net Assets (100.0%) 90,206<br />
The Accompanying Notes are an Integral Part of the Financial Statements.<br />
Long-Term U.S. Government Bond Portfolio 117
Long-Term U.S. Government Bond Portfolio<br />
144A after the name of a security represents a security exempt from registration under Rule 144A of the Securities Act of 1933. These securities may be<br />
resold as transactions exempt from registration, normally to qualified institutional buyers. At December 31, 2008 the value of these securities (in thousands)<br />
was $1,351, representing 1.50% of the net assets.<br />
RB — Revenue Bond<br />
AMBAC — American Municipal Bond Assurance Corp.<br />
(a)<br />
(b)<br />
At December 31, 2008 the aggregate cost of securities for federal tax purposes (in thousands) was $107,021 and the net unrealized appreciation of<br />
investments based on that cost was $2,509 which is comprised of $4,378 aggregate gross unrealized appreciation and $1,869 aggregate gross unrealized<br />
depreciation.<br />
All or a portion of the securities have been committed as collateral for open futures positions or when-issued securities. Information regarding open futures<br />
contracts as of period end is summarized below.<br />
Unrealized<br />
Appreciation/<br />
Number of<br />
(Depreciation)<br />
Issuer (000's)<br />
Contracts Expiration Date (000's)<br />
90 Day Euro $ Commodity Future (Long) (Total Notional Value at December 31, 2008, $3,129) 13 9/09 $ 80<br />
90 Day Euro $ Commodity Future (Long) (Total Notional Value at December 31, 2008, $3,119) 13 12/09 85<br />
90 Day Euro $ Commodity Future (Long) (Total Notional Value at December 31, 2008, $3,112) 13 3/10 88<br />
90 Day Euro $ Commodity Future (Long) (Total Notional Value at December 31, 2008, $3,106) 13 6/10 87<br />
US Five Year Note Commodity (Long) (Total Notional Value at December 31, 2008, $4,571) 39 3/09 73<br />
US Long Bond (CBT) Commodity (Long) (Total Notional Value at December 31, 2008, $9,143) 73 3/09 935<br />
US Ten Year Treasury Note (Long) (Total Notional Value at December 31, 2008, $17,566) 146 3/09 793<br />
118 Long-Term U.S. Government Bond Portfolio<br />
The Accompanying Notes are an Integral Part of the Financial Statements.
Inflation Protection Portfolio<br />
Objective: Portfolio Strategy: Net Assets:<br />
Pursue total return using a strategy that Invest primarily in investment grade debt securities, with $69 million<br />
seeks to protect against U.S. inflation. a majority in inflation-linked debt securities.<br />
Portfolio Overview<br />
Mason Street Advisors, the investment adviser for the Inflation Protection Portfolio, has engaged American Century<br />
Investment Management, Inc. to act as sub-adviser for the Portfolio. The Portfolio’s investment objective is to pursue total<br />
return using a strategy that seeks to protect against U.S. inflation. The Portfolio invests substantially all of its assets in<br />
investment-grade debt securities. To help protect against U.S. inflation, under normal conditions, the Portfolio will invest over<br />
50% of its net assets (plus any borrowings for investment purposes) in inflation-linked debt securities. These securities include<br />
inflation-linked U.S. Treasury Securities, inflation-linked securities issued by U.S. government agencies and instrumentalities<br />
other than the U.S. Treasury, and inflation-linked securities issued by other entities such as domestic and foreign corporations<br />
and governments. Inflation-linked securities are designed to protect the future purchasing power of the money invested in<br />
them. The Portfolio also may invest in fixed-income securities that are not linked to inflation, including mortgage- and assetbacked<br />
securities. The Portfolio invests primarily in investment grade securities, but may invest up to 10% of its total assets in<br />
high-yield securities (so called “junk bonds”). Due to Internal Revenue Code provisions governing insurance product funds, no<br />
more than 55% of the Portfolio’s assets may be invested in securities issued by the same entity, such as the U.S. Treasury.<br />
Market Overview<br />
The spiraling sub-prime credit crisis took an incredible toll on U.S. financial institutions, the economy and financial markets in<br />
2008. Nowhere was this as evident as in the fixed income markets, where risk aversion, de-leveraging and fear of deflation<br />
sent segments of the Treasury market to their best year ever, while credit-sensitive bonds endured historic underperformance.<br />
Economic conditions deteriorated sharply over the course of the year as the economy entered its first recession since 2002. In<br />
that environment, the Federal Reserve took dramatic steps, effectively cutting its short-term rate target to 0%, intervening in<br />
the mortgage, commercial and consumer debt markets, while Congress passed the $700 billion Troubled Asset Relief Program<br />
(TARP).<br />
These events had a significant impact on the shape of the Treasury yield curve. The yield on the benchmark 10-year Treasury<br />
note, for example, declined from 4.03% to 2.21% during the year, while the yield on the two-year Treasury fell from 3.06% to<br />
0.77%. The difference in yield between two- and 10-year Treasury securities started the period at 97 basis points (a basis point<br />
equals 0.01%, so 97 basis points equal 0.97%) and steepened to greater than 250 basis points in November, before worries<br />
about deflation ushered in a dramatic decline in longer-term yields. As a result, the yield gap between two- and ten-year<br />
Treasuries ended the year at 144 basis points.<br />
Inflation jumped from one extreme to another during the twelve-month period. In the first half of the year, soaring prices for<br />
oil and other commodities caused inflation to skyrocket. But sagging worldwide demand and bleak global economic growth<br />
prospects caused commodity prices to do an about-face. The Rogers International Commodities Index, a measure of various<br />
energy, agricultural and metals products, declined 41% for the year.<br />
Headline inflation, as measured by the year-to-year change in the Consumer Price Index, ended November 2008 at 1.1%, a<br />
notable decline from 5.5% at the end of July. The yield difference (or breakeven rate) between ten-year TIPS (Treasury<br />
inflation-protected securities) and nominal ten-year Treasuries started the year at 2.33 percentage points, peaked at 2.45<br />
percentage points in July and fell to 0.09 percentage points by December 31. The current breakeven rate, which represents<br />
investors’ expectations for long-term inflation, suggests concerns regarding inflation have been almost eliminated. It also<br />
illustrates how the potential for deflation has moved into the spotlight.<br />
Portfolio Results<br />
For the twelve months ended December 31, 2008, the Portfolio returned -1.38%, compared with the –1.17% return of the<br />
Citigroup U.S. Inflation-Linked Securities Index. (This Index is unmanaged, cannot be invested in directly and does not<br />
include administrative expenses or sales charges.) At the same time, the average return of the General U.S. Government Bond<br />
Funds was 3.86%, according to Lipper Analytical Services, Inc., an independent mutual fund rating agency.<br />
In the flight-to-quality environment that characterized the twelve-month period, virtually everything in the U.S. bond market<br />
that was not a nominal Treasury bond underperformed. Deflationary expectations as the year progressed hurt TIPS, which<br />
stumbled on the dramatic drop in the rate of inflation and its resulting impact on breakeven yields.<br />
Inflation Protection Portfolio 119
Inflation Protection Portfolio<br />
The Portfolio was as fully invested in TIPS as allowed by IRS portfolio diversification regulations for insurance products<br />
(55% of the Portfolio). We invested the remainder of the Portfolio in high quality agency, mortgage, corporate, and municipal<br />
securities—sectors we believe offer attractive long-term value. In addition, we complemented our spread-sector investments<br />
with inflation swaps, or strategies that synthetically create inflation-linked exposure, seeking to enhance the Portfolio’s yield<br />
and performance compared with Treasury securities.<br />
In addition, the Portfolio’s investment management team maintained a yield curve steepening bias during the first nine months<br />
of the period, which contributed positively to performance, as the slope of the yield curve steepened during this timeframe.<br />
Outlook<br />
The Portfolio’s management team believes the current breakeven rate is an overreaction. The unprecedented steps the<br />
government has taken to avoid a severe economic downturn eventually may lead to significantly higher inflation and a weaker<br />
dollar than are currently priced into the market. These factors, combined with an unusually low breakeven rate, suggest to us<br />
that TIPS currently represent good long-term value.<br />
$11,000<br />
10,800<br />
10,600<br />
10,400<br />
10,200<br />
Relative Performance<br />
10,000<br />
4/07 12/07 12/08<br />
Inflation Protection Portfolio<br />
Citigroup U.S. Inflation-Linked Index<br />
Average <strong>Annual</strong> Total Returns<br />
For Periods Ended December 31, 2008<br />
1 Year<br />
Since<br />
Inception*<br />
Inflation Protection Portfolio<br />
Citigroup U.S. Inflation-Linked Index<br />
-1.38%<br />
-1.17%<br />
3.17%<br />
4.05%<br />
Lipper Variable Insurance Products<br />
(VIP) General U.S. Government<br />
Bond Funds Average 3.86% –<br />
*Inception date of 4/30/07<br />
The performance data quoted represents past<br />
performance. Past performance is historical and does<br />
not guarantee future performance. Investment return<br />
and principal value will fluctuate, so that shares, when<br />
redeemed, may be worth more or less than their original<br />
cost. Current performance may be lower or higher than<br />
the performance data quoted. For the most recent<br />
month-end performance information visit<br />
www.nmfn.com.<br />
This chart assumes an initial investment of $10,000<br />
made on 4/30/07 (commencement of the Portfolio's<br />
operations). Returns shown reflect fee waivers,<br />
deductions for management and other portfolio<br />
expenses, and reinvestment of all dividends. In the<br />
absence of fee waivers, total return would be reduced.<br />
Returns exclude deductions for separte account sale<br />
loads and account fees. Please refer to the Benchmark<br />
Definitions section of this report for information about<br />
the indices cited in the above chart and graph.<br />
Return of principal is not guaranteed. Bond funds have<br />
the same interest rate, inflation and credit risks that are<br />
associated with the underlying bonds owned by the<br />
Portfolio. When interest rates rise, bond prices fall. With<br />
a fixed income fund, when interest rates rise, the value<br />
of the fund’s existing bonds drops, which could<br />
negatively affect overall fund performance.<br />
This Portfolio invests over 50% of its assets in inflationlinked<br />
bonds. Inflation-linked bonds issued by the U.S.<br />
Government, known as TIPs, are fixed income securities<br />
whose principal value is periodically adjusted according<br />
to the rate of inflation. Neither the current market value<br />
of the inflation-linked bonds nor the share value of the<br />
fund that invests in them is guaranteed, and either or<br />
both may fluctuate. Those portions of the Portfolio<br />
which are not invested in inflation linked securities will<br />
not be automatically protected from inflation. The<br />
Portfolio may use derivative instruments for hedging<br />
purposes as part of its investment strategy. Use of these<br />
instruments may involve certain costs and risks such as<br />
liquidity risk, interest rate risk, market risk, credit risk,<br />
management risk and the risk that the Portfolio could<br />
not close out a position when it would be most<br />
advantageous to do so. Portfolios investing in<br />
derivatives could lose more than the principal amount<br />
invested in those instruments.<br />
120 Inflation Protection Portfolio
Inflation Protection Portfolio<br />
Top 10 Fixed Income Holdings 12/31/08<br />
Security Description<br />
% of Net Assets<br />
US Treasury, Various 51.4%<br />
Federal Home Loan Mortgage Corp. Mortgage<br />
Pool, Various 8.2%<br />
Federal National Mortgage Association<br />
Mortgage Pool, Various 7.6%<br />
Federal Home Loan Mortgage Corp., Various 6.5%<br />
Tennessee Valley Authority, Various 4.0%<br />
Federal National Mortgage Association , Various 3.7%<br />
Banc of America Commercial Mortgage,<br />
Inc., Series 2004-2, Class A3, 4.05%, 11/10/38 2.1%<br />
California Educational Facilities<br />
Authority, 5.00%, 3/15/39 1.4%<br />
Massachusetts Bay Transportation<br />
Authority, 5.25%, 7/1/33 1.4%<br />
Federal Home Loan Bank, 4.875%, 5/17/17 1.2%<br />
Municipal Bonds<br />
4%<br />
Corporate Bonds<br />
5%<br />
Sector Allocation 12/31/08<br />
Structured<br />
Products<br />
23%<br />
Governments<br />
68%<br />
Sector Allocation is based on fixed income investments.<br />
Sector Allocation and Top 10 Holdings are subject to<br />
change.<br />
The Corporate Bonds sector includes bonds of companies<br />
and governments headquartered outside the United States.<br />
The Government and Structured Product categories include<br />
domestic taxable bonds.<br />
Consistent with the Portfolio’s stated parameters, no more<br />
than 20% of the Portfolio is invested in foreign securities,<br />
and no more than 10% is invested in high yield securities.<br />
Inflation Protection Portfolio 121
Inflation Protection Portfolio<br />
<strong>Northwestern</strong> <strong>Mutual</strong> Series Fund, Inc.<br />
Schedule of Investments<br />
December 31, 2008<br />
Corporate Bonds (4.7%)<br />
Banking (3.5%)<br />
Shares/<br />
$ Par<br />
Value<br />
$ (000's)<br />
Bank of America Corp.,<br />
3.125%, 6/15/12 700,000 727<br />
The Bear Stearns<br />
Companies LLC,<br />
5.61%, 1/10/14 70,000 58<br />
The Goldman Sachs<br />
Group, Inc.,<br />
3.25%, 6/15/12 400,000 417<br />
The International Bank for<br />
Reconstruction &<br />
Development,<br />
7.625%, 1/19/23 500,000 711<br />
Kreditanstalt fuer<br />
Wiederaufbau,<br />
4.75%, 5/15/12 500,000 535<br />
Total 2,448<br />
Independent Finance (0.4%)<br />
Caterpillar Financial<br />
Services Corp.,<br />
5.05%, 12/1/10 308,000 303<br />
Total 303<br />
Life Insurance (0.4%)<br />
Prudential Financial, Inc.,<br />
5.11%, 2/10/12 200,000 145<br />
(k) Prudential Financial, Inc.,<br />
5.24%, 3/10/15 240,000 130<br />
Total 275<br />
Telecommunications (0.2%)<br />
AT&T, Inc.,<br />
5.10%, 9/15/14 100,000 98<br />
Total 98<br />
Tobacco (0.2%)<br />
Altria Group, Inc.,<br />
8.50%, 11/10/13 160,000 166<br />
Total 166<br />
Total Corporate Bonds<br />
(Cost: $3,238) 3,290<br />
Governments (69.8%)<br />
Governments (69.8%)<br />
Farmer Mac Guaranteed<br />
Notes Trust 2006-2,<br />
5.125%, 4/19/17 144A 500,000 570<br />
Federal Home Loan Bank,<br />
4.875%, 5/17/17 755,000 854<br />
Federal Home Loan<br />
Mortgage Corp.,<br />
4.125%, 9/27/13 500,000 539<br />
Governments (69.8%)<br />
Shares/<br />
$ Par<br />
Value<br />
$ (000's)<br />
Governments continued<br />
Federal Home Loan<br />
Mortgage Corp.,<br />
4.50%, 4/2/14 500,000 549<br />
Federal Home Loan<br />
Mortgage Corp.,<br />
4.875%, 6/13/18 620,000 713<br />
Federal Home Loan<br />
Mortgage Corp.,<br />
5.00%, 1/30/14 2,400,000 2,683<br />
Federal National<br />
Mortgage Association,<br />
4.375%, 7/17/13 570,000 615<br />
Federal National<br />
Mortgage Association,<br />
6.077%, 2/17/09 1,951,000 1,949<br />
Financing Corp.,<br />
0.00%, 5/30/10 359,000 354<br />
Israel Government AID<br />
Bond, 0.00%, 11/1/14 500,000 436<br />
Private Export Funding<br />
Corp., 4.55%, 5/15/15 600,000 657<br />
Tennessee Valley<br />
Authority, 4.50%, 4/1/18 450,000 496<br />
Tennessee Valley<br />
Authority,<br />
4.875%, 12/15/16 450,000 502<br />
Tennessee Valley<br />
Authority,<br />
6.79%, 5/23/12 1,200,000 1,378<br />
Tennessee Valley<br />
Authority Stripped,<br />
0.00%, 7/15/09 160,000 159<br />
Tennessee Valley<br />
Authority Stripped,<br />
0.00%, 11/1/12 251,000 233<br />
US Treasury Inflation<br />
Index Bond,<br />
0.625%, 4/15/13 1,024,970 980<br />
US Treasury Inflation<br />
Index Bond,<br />
0.875%, 4/15/10 263,021 247<br />
US Treasury Inflation<br />
Index Bond,<br />
1.375%, 7/15/18 2,310,718 2,161<br />
US Treasury Inflation<br />
Index Bond,<br />
1.625%, 1/15/15 340,377 316<br />
US Treasury Inflation<br />
Index Bond,<br />
1.625%, 1/15/18 2,068,240 1,963<br />
US Treasury Inflation<br />
Index Bond,<br />
1.75%, 1/15/28 1,184,067 1,094<br />
Governments (69.8%)<br />
Shares/<br />
$ Par<br />
Value<br />
$ (000's)<br />
Governments continued<br />
US Treasury Inflation<br />
Index Bond,<br />
1.875%, 7/15/13 855,188 805<br />
US Treasury Inflation<br />
Index Bond,<br />
1.875%, 7/15/15 389,830 368<br />
US Treasury Inflation<br />
Index Bond,<br />
2.00%, 4/15/12 373,671 364<br />
US Treasury Inflation<br />
Index Bond,<br />
2.00%, 1/15/14 492,442 467<br />
US Treasury Inflation<br />
Index Bond,<br />
2.00%, 7/15/14 574,665 543<br />
US Treasury Inflation<br />
Index Bond,<br />
2.00%, 1/15/16 7,231,386 6,925<br />
(k)US Treasury Inflation<br />
Index Bond,<br />
2.00%, 1/15/26 2,183,060 2,056<br />
US Treasury Inflation<br />
Index Bond,<br />
2.375%, 4/15/11 81,861 80<br />
US Treasury Inflation<br />
Index Bond,<br />
2.375%, 1/15/17 2,846,842 2,824<br />
US Treasury Inflation<br />
Index Bond,<br />
2.375%, 1/15/25 2,643,459 2,598<br />
US Treasury Inflation<br />
Index Bond,<br />
2.375%, 1/15/27 1,691,991 1,700<br />
US Treasury Inflation<br />
Index Bond,<br />
2.50%, 7/15/16 1,716,400 1,703<br />
US Treasury Inflation<br />
Index Bond,<br />
2.625%, 7/15/17 1,646,348 1,687<br />
US Treasury Inflation<br />
Index Bond,<br />
3.00%, 7/15/12 421,722 413<br />
US Treasury Inflation<br />
Index Bond,<br />
3.375%, 1/15/12 274,520 272<br />
US Treasury Inflation<br />
Index Bond,<br />
3.375%, 4/15/32 1,556,176 1,919<br />
US Treasury Inflation<br />
Index Bond,<br />
3.50%, 1/15/11 373,428 367<br />
US Treasury Inflation<br />
Index Bond,<br />
3.625%, 4/15/28 1,473,406 1,755<br />
The Accompanying Notes are an Integral Part of the Financial Statements.<br />
122 Inflation Protection Portfolio
Inflation Protection Portfolio<br />
Governments (69.8%)<br />
Shares/<br />
$ Par<br />
Value<br />
$ (000's)<br />
Governments continued<br />
US Treasury Inflation<br />
Index Bond,<br />
3.875%, 4/15/29 1,581,408 1,953<br />
Total Governments<br />
(Cost: $48,886) 48,247<br />
Municipal Bonds (4.0%)<br />
Municipal Bonds (4.0%)<br />
California Educational<br />
Facilities Authority,<br />
5.00%, 3/15/39 RB 1,000,000 998<br />
Massachusetts Bay<br />
Transportation Authority,<br />
Series 2006A,<br />
5.25%, 7/1/33 RB 1,000,000 996<br />
Massachusetts Health &<br />
Educational Facilites<br />
Authority,<br />
5.50%, 7/1/32 RB 700,000 745<br />
Total 2,739<br />
Total Municipal Bonds<br />
(Cost: $2,628) 2,739<br />
Structured Products (23.7%)<br />
Structured Products (23.7%)<br />
Banc of America<br />
Alternative Loan Trust,<br />
Series 2007-2, Class<br />
2A4, 5.75%, 6/25/37 146,283 91<br />
Banc of America<br />
Commercial Mortgage,<br />
Inc., Series 2004-2, Class<br />
A3, 4.05%, 11/10/38 1,530,000 1,452<br />
Chase Manhattan Bank-<br />
First Union National<br />
Bank, Series 1999-1,<br />
Class B,<br />
7.619%, 8/15/31 700,000 699<br />
Citibank Credit Card<br />
Issuance Trust, Series<br />
2007-A2, Class A2,<br />
2.163%, 5/21/12 500,000 463<br />
CNH Equipment Trust,<br />
Series 2007-C, Class<br />
A3A, 5.21%, 12/15/11 400,000 394<br />
Credit Suisse Mortgage<br />
Capital Certificates,<br />
Series 2007-TF2A,<br />
Class A1,<br />
1.375%, 4/15/22 144A 500,000 402<br />
Federal Home Loan<br />
Mortgage Corp.,<br />
5.00%, 5/1/23 1,674,411 1,721<br />
Federal Home Loan<br />
Mortgage Corp., Series<br />
3234, Class PA,<br />
5.00%, 10/15/26 522,641 532<br />
Structured Products<br />
(23.7%)<br />
Shares/<br />
$ Par<br />
Value<br />
$ (000's)<br />
Structured Products continued<br />
Federal Home Loan<br />
Mortgage Corp.,<br />
5.50%, 12/1/36 450,708 462<br />
Federal Home Loan<br />
Mortgage Corp.,<br />
5.50%, 4/1/38 2,788,094 2,857<br />
Federal Home Loan<br />
Mortgage Corp.,<br />
5.752%, 1/1/38 579,678 594<br />
Federal National<br />
Mortgage Association,<br />
Series 2004-9, Class YJ,<br />
4.00%, 10/25/13 107,028 107<br />
Federal National<br />
Mortgage Association,<br />
5.50%, 9/1/35 865,597 888<br />
Federal National<br />
Mortgage Association,<br />
5.50%, 7/1/36 435,374 447<br />
Federal National<br />
Mortgage Association,<br />
5.50%, 2/1/37 2,587,454 2,656<br />
Federal National<br />
Mortgage Association,<br />
6.00%, 10/1/37 968,625 998<br />
Federal National<br />
Mortgage Association,<br />
6.00%, 7/1/38 243,822 251<br />
General Motors<br />
Acceptance Corp.<br />
Commercial Mortgage<br />
Securities, Inc., Series<br />
2005-C1, Class A2,<br />
4.471%, 5/10/43 480,892 464<br />
Government National<br />
Mortgage Association,<br />
4.625%, 7/20/31 101,388 99<br />
Government National<br />
Mortgage Association,<br />
4.875%, 12/20/31 236,982 233<br />
LB-UBS Commercial<br />
Mortgage Trust, Series<br />
2003-C3, Class A3,<br />
3.85%, 5/15/27 300,000 276<br />
Lehman Brothers Floating<br />
Rate Commercial<br />
Mortgage Trust, Series<br />
2007-LLFA, Class A1,<br />
1.495%, 6/15/22 144A 391,786 295<br />
Total Structured Products<br />
(Cost: $16,395) 16,381<br />
Short-Term Investments<br />
(0.0%)<br />
Other Holdings (0.0%)<br />
Shares/<br />
$ Par<br />
Value<br />
$ (000's)<br />
(k)JPMorgan Money Market<br />
Fund 33,467 33<br />
Total 33<br />
Total Short-Term Investments<br />
(Cost: $33) 33<br />
Total Investments (102.2%)<br />
(Cost: $71,180)(a) 70,690<br />
Other Assets, Less<br />
Liabilities (-2.2%) (1,550)<br />
Net Assets (100.0%) 69,140<br />
The Accompanying Notes are an Integral Part of the Financial Statements.<br />
Inflation Protection Portfolio 123
Inflation Protection Portfolio<br />
144A after the name of a security represents a security exempt from registration under Rule 144A of the Securities Act of 1933. These securities may be<br />
resold as transactions exempt from registration, normally to qualified institutional buyers. At December 31, 2008 the value of these securities (in thousands)<br />
was $1,267, representing 1.83% of the net assets.<br />
RB — Revenue Bond<br />
(a)<br />
At December 31, 2008 the aggregate cost of securities for federal tax purposes (in thousands) was $71,311 and the net unrealized depreciation of investments<br />
based on that cost was $621 which is comprised of $1,617 aggregate gross unrealized appreciation and $2,238 aggregate gross unrealized depreciation.<br />
(j) Swap agreements outstanding on December 31, 2008<br />
Total Return Swaps<br />
CounterParty<br />
Bank of America<br />
Bank of America<br />
Bank of America<br />
Barclays Capital<br />
Barclays Capital<br />
Barclays Capital<br />
Barclays Capital<br />
Barclays Capital<br />
UBS<br />
Reference Entity<br />
U.S. Consumer Price Index - All<br />
Urban Consumers - Not Seasonally<br />
Adjusted (CPURNSA)<br />
U.S. Consumer Price Index - All<br />
Urban Consumers - Not Seasonally<br />
Adjusted (CPURNSA)<br />
U.S. Consumer Price Index - All<br />
Urban Consumers - Not Seasonally<br />
Adjusted (CPURNSA)<br />
U.S. Consumer Price Index - All<br />
Urban Consumers - Not Seasonally<br />
Adjusted (CPURNSA)<br />
U.S. Consumer Price Index - All<br />
Urban Consumers - Not Seasonally<br />
Adjusted (CPURNSA)<br />
U.S. Consumer Price Index - All<br />
Urban Consumers - Not Seasonally<br />
Adjusted (CPURNSA)<br />
U.S. Consumer Price Index - All<br />
Urban Consumers - Not Seasonally<br />
Adjusted (CPURNSA)<br />
U.S. Consumer Price Index - All<br />
Urban Consumers - Not Seasonally<br />
Adjusted (CPURNSA)<br />
U.S. Consumer Price Index - All<br />
Urban Consumers - Not Seasonally<br />
Adjusted (CPURNSA)<br />
Payment Made by Payment Received by<br />
the Fund the Fund<br />
CPURNSA Index Synthetic Total<br />
Total Return at Return Calculation<br />
Maturity<br />
CPURNSA Index<br />
Total Return at<br />
Maturity<br />
CPURNSA Index<br />
Total Return at<br />
Maturity<br />
CPURNSA Index<br />
Total Return at<br />
Maturity<br />
CPURNSA Index<br />
Total Return at<br />
Maturity<br />
CPURNSA Index<br />
Total Return at<br />
Maturity<br />
Expiration<br />
Date<br />
Notional<br />
Amount (000's)<br />
Unrealized<br />
Appreciation/<br />
(Depreciation)<br />
(000's)<br />
at Maturity 5/13 2,500 $ (353)<br />
Synthetic Total<br />
Return Calculation<br />
at Maturity 7/13 1,725 (269)<br />
Synthetic Total<br />
Return Calculation<br />
at Maturity 5/10 2,500 (221)<br />
Synthetic Total<br />
Return Calculation<br />
at Maturity 8/12 2,500 (284)<br />
Synthetic Total<br />
Return Calculation<br />
at Maturity 6/14 1,000 (132)<br />
Synthetic Total<br />
Return Calculation<br />
at Maturity 12/27 1,700 (295)<br />
Synthetic Total<br />
CPI Index Total Return Calculation<br />
Return at Maturity at Maturity 8/17 2,000 (228)<br />
CPURNSA Index<br />
Total Return at<br />
Maturity<br />
CPURNSA Index<br />
Total Return at<br />
Maturity<br />
Synthetic Total<br />
Return Calculation<br />
at Maturity 7/10 3,000 (235)<br />
Synthetic Total<br />
Return Calculation<br />
at Maturity 11/13 2,200 (186)<br />
(2,203)<br />
(k) Securities with an aggregate value of $2,219 (in thousands) have been pledged as collateral for swap contracts outstanding on December 31, 2008<br />
124 Inflation Protection Portfolio<br />
The Accompanying Notes are an Integral Part of the Financial Statements.
High Yield Bond Portfolio<br />
Objective: Portfolio Strategy: Net Assets:<br />
Achieve high current income and Invest in diversified mix of debt securities rated below $212 million<br />
capital appreciation.<br />
investment grade.<br />
Portfolio Overview<br />
Mason Street Advisors acts as the investment adviser for the High Yield Bond Portfolio. The Portfolio seeks to achieve high<br />
current income and capital appreciation. The Portfolio seeks to achieve this objective by investing at least 80% of net assets<br />
(plus any borrowings for investment purposes) in non-investment grade debt securities. The Portfolio invests in both domestic<br />
and foreign debt securities that are rated below investment grade by at least one major rating agency or, if unrated, determined<br />
by management to be of comparable quality. Securities are selected primarily based upon rigorous industry and credit analysis<br />
performed by management to identify companies that are believed to be attractively priced, or which have stable or improving<br />
fundamental financial characteristics, relative to the overall high yield market. High yield debt securities are often called “junk<br />
bonds.”<br />
Market Overview<br />
The spiraling sub-prime credit crisis took an incredible toll on U.S. financial institutions, the economy and financial markets in<br />
2008. Economic conditions deteriorated sharply over the course of the year, as the economy entered its first recession since<br />
2002. In that environment, the Federal Reserve took dramatic steps, effectively cutting its short-term rate target to 0%,<br />
intervening in the mortgage, commercial, and consumer debt markets, while Congress passed the $700 billion Troubled Asset<br />
Relief Program (TARP).<br />
These unprecedented events sent high yield bonds reeling, as a result of massive deleveraging and forced selling for hedge<br />
funds and other large high yield market players. In that environment, measures of distress and credit rating downgrades to<br />
upgrades reached the highest levels on record, while the spread (yield over Treasuries) on the high yield market surged to an<br />
all-time high above 2000 basis points (or 20%). However, the market staged a sharp rebound in December as a result of Fed<br />
rate cuts, government loans to automakers, and the conversion of GMAC (the largest single name in the Index) to bank<br />
holding company status, giving the company access to TARP funds. Nevertheless, 2008 was the high yield market’s worst on<br />
record, with the Citigroup High-Yield Cash-Pay Index losing a quarter of its value.<br />
Portfolio Results<br />
For the twelve months ended December 31, 2008, the High Yield Bond Portfolio had a total return of –21.35%. By<br />
comparison, the Citigroup High-Yield Cash-Pay Index returned –24.74% for the year. (This Index is unmanaged, cannot be<br />
invested in directly and does not include administrative expenses or sales charges.) The average return for the Portfolio’s peer<br />
group, High Current Yield Funds, was –26.93%, according to Lipper Analytical Services, Inc., an independent mutual fund<br />
ranking agency.<br />
The Portfolio’s absolute return reflected the unprecedented turmoil affecting the economy and financial markets in what was<br />
the worst year in high yield market history. However, the Portfolio outperformed the Index and Lipper average because of its<br />
bias toward higher quality issuers rated BB and above, and corresponding underweight to CCC rated securities. Some of our<br />
security selection decisions also helped performance, as did our slightly higher than average cash weighting.<br />
Presumably unlike many of our peers, we did not consider it prudent to own the riskiest, lowest quality bonds without regard<br />
to fundamentals, preferring to own higher quality names in cash-rich, less economically sensitive sectors given the challenging<br />
market environment. That positioning helped the Portfolio hold up better than the market and its competition in 2008, when<br />
the lower a bond’s quality, the worse its performance. What’s more, some of our BB bonds also did well in the up month of<br />
December, as investors looking to enter the market gravitated toward large, liquid names, such as DirecTV and L-3<br />
Communications.<br />
It also helped that we allowed a modest cash position from bond maturities and coupon payments to build over the course of<br />
the year. Having that modest (less than 10% of assets) cash cushion benefited performance during a brutal year in high yield.<br />
In addition, we were underweight some of the worst-performing segments of the market, such as broadcasting, paper and<br />
forest products and publishing.<br />
Outlook<br />
We remain in a challenging environment for high yield bonds, because of economic weakness and a lack of liquidity in the<br />
market. Indeed, one of the key considerations is that very few high yield companies were able to come to market for additional<br />
financing in the second half of the year. Under those conditions, we expect defaults to rise significantly going forward.<br />
High Yield Bond Portfolio 125
High Yield Bond Portfolio<br />
But there are some positives—the indiscriminate selling we’ve seen in the market is presenting long-term, patient investors<br />
with opportunities to buy well-structured credits at very attractive levels. In essence, large swaths of the market have been<br />
priced to go out of business. But with spreads trading at unprecedented levels, we think that it makes sense to add select names<br />
that we believe can survive the current economic and financial stresses. We expect to put our modest cash position to work in<br />
these sorts of deals in coming months.<br />
Relative Performance<br />
The Portfolio invests in lower quality securities, which<br />
may represent a significant risk for loss of principal and<br />
interest. Bonds and other debt obligations are affected<br />
by changes in interest rates, inflation risk and the<br />
creditworthiness of their issuers. High yield bonds<br />
generally have greater price swings and higher default<br />
risks than investment grade bonds. Return of principal is<br />
not guaranteed. When interest rates rise, bond prices<br />
fall. With a fixed income fund, when interest rates rise,<br />
the value of the fund’s existing bonds drops, which could<br />
negatively affect overall fund performance. In contrast<br />
to owning individual bonds, there are ongoing fees and<br />
expenses associated with owning shares of bond funds.<br />
Average <strong>Annual</strong> Total Returns<br />
For Periods Ended December 31, 2008<br />
1 Year 5 Years 10 Years<br />
High Yield Bond Portfolio<br />
Citigroup High Yield Cash Pay Index<br />
-21.35% 0.21%<br />
-24.74% -0.68%<br />
2.36%<br />
2.51%<br />
Barclays Capital U.S. Corporate High<br />
Yield 2% Issuer Capped Index** -25.88% -0.84% 2.28%<br />
Lipper Variable Insurance Products<br />
(VIP) High Current Yield Funds<br />
Average -26.93% -1.17% 1.27%<br />
** Prior to November 1, 2008, the Barclays Capital U.S. Corporate<br />
High Yield 2% Issuer Capped Index was known as the Lehman<br />
Brothers U.S. Corporate High Yield 2% Issuer Capped Index.<br />
The performance data quoted represents past<br />
performance. Past performance is historical and does<br />
not guarantee future performance. Investment return<br />
and principal value will fluctuate, so that shares, when<br />
redeemed, may be worth more or less than their original<br />
cost. Current performance may be lower or higher than<br />
the performance data quoted. For the most recent<br />
month-end performance information visit<br />
www.nmfn.com.<br />
This chart assumes an initial investment of $10,000<br />
made on 12/31/98. Returns shown include deductions<br />
for management and other portfolio expenses, and<br />
reinvestment of all dividends. Returns exclude<br />
deductions for separte account sale loads and account<br />
fees. Please refer to the Benchmark Definitions section<br />
of this report for information about the indices cited in<br />
the above chart and graph.<br />
126 High Yield Bond Portfolio
High Yield Bond Portfolio<br />
Top 10 Fixed Income Holdings 12/31/08<br />
Security Description<br />
% of Net Assets<br />
HCA, Inc., Various 2.5%<br />
Energy Future Holdings Corp., Various 1.9%<br />
Ford Motor Credit Co. LLC, Various 1.8%<br />
Chesapeake Energy Corp., Various 1.8%<br />
EchoStar DBS Corp., Various 1.8%<br />
L-3 Communications Corp., Various 1.6%<br />
General Motors Acceptance Corp. LLC, Various 1.6%<br />
MGM MIRAGE, Inc., Various 1.6%<br />
Frontier Communications Corp., Various 1.6%<br />
CSC Holdings, Inc., Various 1.6%<br />
Sector Allocation 12/31/08<br />
Telecommunications<br />
7%<br />
Basic Materials<br />
7%<br />
Gaming/Leisure/<br />
Lodging<br />
8%<br />
Media<br />
8%<br />
Health Care/<br />
Pharmaceuticals<br />
8%<br />
Utilities<br />
10%<br />
Financials<br />
5%<br />
Short-Term<br />
Investments &<br />
Other Net Assets<br />
34%<br />
Energy<br />
13%<br />
Sector Allocation is based on Net Assets.<br />
Sector Allocation and Top 10 Holdings are subject to<br />
change.<br />
High Yield Bond Portfolio 127
High Yield Bond Portfolio<br />
<strong>Northwestern</strong> <strong>Mutual</strong> Series Fund, Inc.<br />
Schedule of Investments<br />
December 31, 2008<br />
Preferred Stocks (0.0%)<br />
Financials (0.0%)<br />
Shares/<br />
$ Par<br />
Value<br />
$ (000's)<br />
(n)* Preferred Blocker, Inc.,<br />
9.00%, 12/31/49 144A 379 95<br />
Total 95<br />
Total Preferred Stocks<br />
(Cost: $95) 95<br />
Bonds (88.8%)<br />
Aerospace/Defense (2.9%)<br />
BE Aerospace, Inc.,<br />
8.50%, 7/1/18 706,000 636<br />
Bombardier, Inc.,<br />
8.00%, 11/15/14 144A 714,000 628<br />
DRS Technologies, Inc.,<br />
7.625%, 2/1/18 680,000 680<br />
Hawker Beechcraft<br />
Acquisition Co.<br />
LLC/Hawker Beechcraft<br />
Notes Co.,<br />
8.50%, 4/1/15 412,000 169<br />
(c) Hawker Beechcraft<br />
Acquisition Co.<br />
LLC/Hawker Beechcraft<br />
Notes Co.,<br />
8.875%, 4/1/15 927,000 315<br />
Hawker Beechcraft<br />
Acquisition Co.<br />
LLC/Hawker Beechcraft<br />
Notes Co.,<br />
9.75%, 4/1/17 860,000 232<br />
L-3 Communications<br />
Corp.,<br />
6.375%, 10/15/15 2,275,000 2,127<br />
L-3 Communications<br />
Corp., 7.625%, 6/15/12 1,335,000 1,305<br />
Total 6,092<br />
Autos/Vehicle Parts (2.8%)<br />
American Axle &<br />
Manufacturing, Inc.,<br />
7.875%, 3/1/17 1,095,000 339<br />
Cooper Tire & Rubber<br />
Co., 8.00%, 12/15/19 680,000 306<br />
Ford Motor Co.,<br />
7.45%, 7/16/31 2,775,000 777<br />
Ford Motor Credit Co.<br />
LLC, 8.00%, 12/15/16 575,000 375<br />
Ford Motor Credit Co.<br />
LLC, 8.625%, 11/1/10 710,000 538<br />
Ford Motor Credit Co.<br />
LLC, 9.875%, 8/10/11 2,980,000 2,198<br />
General Motors Corp.,<br />
7.20%, 1/15/11 755,000 159<br />
Bonds (88.8%)<br />
Shares/<br />
$ Par<br />
Value<br />
$ (000's)<br />
Autos/Vehicle Parts continued<br />
General Motors Corp.,<br />
8.375%, 7/15/33 1,840,000 322<br />
Lear Corp.,<br />
5.75%, 8/1/14 340,000 126<br />
Lear Corp.,<br />
8.75%, 12/1/16 532,000 154<br />
Visteon Corp.,<br />
8.25%, 8/1/10 993,000 308<br />
Visteon Corp.,<br />
12.25%, 12/31/16 144A 1,102,000 264<br />
Total 5,866<br />
Basic Materials (7.5%)<br />
Ball Corp.,<br />
6.625%, 3/15/18 740,000 662<br />
Berry Plastics Holding<br />
Corp., 8.875%, 9/15/14 590,000 257<br />
Cascades, Inc.,<br />
7.25%, 2/15/13 504,000 257<br />
Crown Americas<br />
LLC/Crown Americas<br />
Capital Corp.,<br />
7.625%, 11/15/13 507,000 502<br />
Crown Americas<br />
LLC/Crown Americas<br />
Capital Corp.,<br />
7.75%, 11/15/15 825,000 821<br />
FMG Finance Property,<br />
Ltd.,<br />
10.625%, 9/1/16 144A 2,370,000 1,375<br />
Freeport-McMoRan<br />
Copper & Gold, Inc.,<br />
8.25%, 4/1/15 1,360,000 1,156<br />
Freeport-McMoRan<br />
Copper & Gold, Inc.,<br />
8.375%, 4/1/17 2,130,000 1,747<br />
Georgia-Pacific LLC,<br />
7.00%, 1/15/15 144A 1,853,000 1,575<br />
Georgia-Pacific LLC,<br />
7.125%, 1/15/17 144A 594,000 499<br />
Graphic Packaging<br />
International, Inc.,<br />
9.50%, 8/15/13 1,031,000 711<br />
Hexion US Finance<br />
Corp./Hexion Nova<br />
Scotia Finance ULC,<br />
9.75%, 11/15/14 1,955,000 557<br />
Huntsman International<br />
LLC, 7.375%, 1/1/15 755,000 396<br />
Huntsman LLC,<br />
11.50%, 7/15/12 745,000 596<br />
Invista,<br />
9.25%, 5/1/12 144A 875,000 613<br />
Bonds (88.8%)<br />
Shares/<br />
$ Par<br />
Value<br />
$ (000's)<br />
Basic Materials continued<br />
Momentive Performance<br />
Materials, Inc.,<br />
9.75%, 12/1/14 1,010,000 429<br />
The Mosaic Co.,<br />
7.625%, 12/1/16 144A 530,000 424<br />
NewPage Corp.,<br />
10.00%, 5/1/12 750,000 330<br />
Norampac Industries, Inc.,<br />
6.75%, 6/1/13 625,000 281<br />
Novelis, Inc.,<br />
7.25%, 2/15/15 2,098,000 1,217<br />
Peabody Energy Corp.,<br />
7.375%, 11/1/16 185,000 174<br />
Peabody Energy Corp.,<br />
7.875%, 11/1/26 1,095,000 903<br />
Smurfit-Stone Container<br />
Enterprises, Inc.,<br />
8.375%, 7/1/12 665,000 110<br />
Texas Industries, Inc.,<br />
7.25%, 7/15/13 144A 470,000 363<br />
Total 15,955<br />
Capital Goods (1.8%)<br />
Case New Holland, Inc.,<br />
7.125%, 3/1/14 1,090,000 774<br />
Da-Lite Screen Co., Inc.,<br />
9.50%, 5/15/11 675,000 594<br />
RSC Equipment Rental,<br />
Inc., 9.50%, 12/1/14 1,042,000 573<br />
SPX Corp.,<br />
7.625%, 12/15/14 144A 820,000 714<br />
Terex Corp.,<br />
8.00%, 11/15/17 1,100,000 935<br />
United Rentals North<br />
America, Inc.,<br />
6.50%, 2/15/12 390,000 308<br />
Total 3,898<br />
Consumer Products/Retailing (4.1%)<br />
Education Management<br />
LLC/Education<br />
Management Finance<br />
Corp., 10.25%, 6/1/16 1,870,000 1,356<br />
GameStop<br />
Corp./GameStop, Inc.,<br />
8.00%, 10/1/12 1,105,000 1,028<br />
Levi Strauss & Co.,<br />
8.875%, 4/1/16 1,275,000 867<br />
The Neiman Marcus<br />
Group, Inc.,<br />
10.375%, 10/15/15 740,000 318<br />
New Albertson's, Inc.,<br />
7.25%, 5/1/13 860,000 727<br />
The Accompanying Notes are an Integral Part of the Financial Statements.<br />
128 High Yield Bond Portfolio
High Yield Bond Portfolio<br />
Bonds (88.8%)<br />
Shares/<br />
$ Par<br />
Value<br />
$ (000's)<br />
Consumer Products/Retailing continued<br />
Oxford Industries, Inc.,<br />
8.875%, 6/1/11 1,693,000 1,278<br />
Phillips-Van Heusen<br />
Corp., 8.125%, 5/1/13 200,000 165<br />
Rite Aid Corp.,<br />
7.50%, 3/1/17 1,017,000 661<br />
Rite Aid Corp.,<br />
8.625%, 3/1/15 336,000 116<br />
Rite Aid Corp.,<br />
9.375%, 12/15/15 540,000 189<br />
Rite Aid Corp.,<br />
10.375%, 7/15/16 470,000 345<br />
SUPERVALU, Inc.,<br />
7.50%, 11/15/14 1,120,000 918<br />
Warnaco, Inc.,<br />
8.875%, 6/15/13 710,000 646<br />
Total 8,614<br />
Energy (13.2%)<br />
Basic Energy Services,<br />
Inc., 7.125%, 4/15/16 1,220,000 695<br />
Chaparral Energy, Inc.,<br />
8.875%, 2/1/17 1,220,000 244<br />
Chesapeake Energy Corp.,<br />
6.375%, 6/15/15 823,000 650<br />
Chesapeake Energy Corp.,<br />
6.625%, 1/15/16 1,405,000 1,110<br />
Chesapeake Energy Corp.,<br />
7.25%, 12/15/18 750,000 585<br />
Chesapeake Energy Corp.,<br />
7.50%, 9/15/13 1,120,000 963<br />
Chesapeake Energy Corp.,<br />
7.625%, 7/15/13 605,000 520<br />
Cie Generale de<br />
Geophysique-Veritas,<br />
7.50%, 5/15/15 405,000 251<br />
Cie Generale de<br />
Geophysique-Veritas,<br />
7.75%, 5/15/17 675,000 392<br />
Cimarex Energy Co.,<br />
7.125%, 5/1/17 1,015,000 792<br />
Complete Production<br />
Services, Inc.,<br />
8.00%, 12/15/16 803,000 506<br />
Connacher Oil and Gas,<br />
Ltd.,<br />
10.25%, 12/15/15 144A 730,000 292<br />
Denbury Resources, Inc.,<br />
7.50%, 12/15/15 750,000 532<br />
El Paso Corp.,<br />
7.00%, 6/15/17 1,125,000 880<br />
El Paso Corp.,<br />
7.25%, 6/1/18 1,175,000 933<br />
El Paso Corp.,<br />
7.75%, 1/15/32 1,095,000 711<br />
Forest Oil Corp.,<br />
7.25%, 6/15/19 144A 450,000 329<br />
Forest Oil Corp.,<br />
7.25%, 6/15/19 650,000 475<br />
Bonds (88.8%)<br />
Shares/<br />
$ Par<br />
Value<br />
$ (000's)<br />
Energy continued<br />
Helix Energy Solutions<br />
Group, Inc.,<br />
9.50%, 1/15/16 144A 1,090,000 578<br />
Key Energy Services, Inc.,<br />
8.375%, 12/1/14 1,100,000 726<br />
Kinder Morgan Finance<br />
Co. ULC, 5.35%, 1/5/11 1,110,000 991<br />
Kinder Morgan Finance<br />
Co. ULC, 5.70%, 1/5/16 675,000 503<br />
Linn Energy LLC,<br />
9.875%, 7/1/18 144A 705,000 412<br />
Mariner Energy, Inc.,<br />
8.00%, 5/15/17 915,000 476<br />
Newfield Exploration Co.,<br />
6.625%, 9/1/14 190,000 156<br />
Newfield Exploration Co.,<br />
6.625%, 4/15/16 1,045,000 831<br />
Newfield Exploration Co.,<br />
7.125%, 5/15/18 560,000 442<br />
OPTI Canada, Inc.,<br />
8.25%, 12/15/14 1,645,000 888<br />
Petrohawk Energy Corp.,<br />
7.875%, 6/1/15 144A 935,000 692<br />
Petrohawk Energy Corp.,<br />
9.125%, 7/15/13 1,636,000 1,325<br />
Petroplus Finance, Ltd.,<br />
6.75%, 5/1/14 144A 633,000 402<br />
Petroplus Finance, Ltd.,<br />
7.00%, 5/1/17 144A 528,000 322<br />
Plains Exploration &<br />
Production Co.,<br />
7.00%, 3/15/17 680,000 466<br />
Plains Exploration &<br />
Production Co.,<br />
7.625%, 6/1/18 470,000 322<br />
Plains Exploration &<br />
Production Co.,<br />
7.75%, 6/15/15 900,000 680<br />
Range Resources Corp.,<br />
6.375%, 3/15/15 1,119,000 906<br />
Range Resources Corp.,<br />
7.25%, 5/1/18 150,000 125<br />
Range Resources Corp.,<br />
7.50%, 5/15/16 235,000 204<br />
SandRidge Energy, Inc.,<br />
8.00%, 6/1/18 144A 470,000 261<br />
SESI LLC,<br />
6.875%, 6/1/14 1,145,000 882<br />
Sonat, Inc.,<br />
7.625%, 7/15/11 315,000 287<br />
Southwestern Energy Co.,<br />
7.50%, 2/1/18 144A 830,000 726<br />
Targa Resources Partners<br />
LP, 8.25%, 7/1/16 144A 565,000 350<br />
Tesoro Corp.,<br />
6.25%, 11/1/12 460,000 317<br />
Tesoro Corp.,<br />
6.625%, 11/1/15 2,330,000 1,351<br />
Bonds (88.8%)<br />
Shares/<br />
$ Par<br />
Value<br />
$ (000's)<br />
Energy continued<br />
W&T Offshore, Inc.,<br />
8.25%, 6/15/14 144A 1,040,000 562<br />
Whiting Petroleum Corp.,<br />
7.25%, 5/1/13 1,379,000 979<br />
Total 28,022<br />
Financials (4.8%)<br />
Bank of America Corp.,<br />
8.125%, 12/29/49 1,120,000 838<br />
Citigroup, Inc.,<br />
8.40%, 4/29/49 1,120,000 739<br />
E*TRADE Financial<br />
Corp., 7.375%, 9/15/13 55,000 20<br />
E*TRADE Financial<br />
Corp., 7.875%, 12/1/15 1,320,000 475<br />
E*TRADE Financial<br />
Corp., 8.00%, 6/15/11 1,685,000 767<br />
General Motors<br />
Acceptance Corp. LLC,<br />
7.25%, 3/2/11 2,375,000 2,018<br />
General Motors<br />
Acceptance Corp. LLC,<br />
7.75%, 1/19/10 550,000 491<br />
(n) General Motors<br />
Acceptance Corp. LLC,<br />
8.00%, 11/1/31 144A 1,519,000 903<br />
International Lease<br />
Finance Corp.,<br />
5.875%, 5/1/13 405,000 270<br />
JPMorgan Chase & Co.,<br />
7.90%, 4/29/49 1,120,000 932<br />
LaBranche & Co., Inc.,<br />
11.00%, 5/15/12 561,000 488<br />
Nuveen Investments, Inc.,<br />
10.50%, 11/15/15 144A 825,000 183<br />
Wachovia Corp.,<br />
7.98%, 2/28/49 560,000 477<br />
Wells Fargo Capital XV,<br />
9.75%, 12/29/49 1,500,000 1,515<br />
Total 10,116<br />
Foods (2.3%)<br />
Constellation Brands, Inc.,<br />
7.25%, 9/1/16 1,070,000 1,011<br />
Constellation Brands, Inc.,<br />
7.25%, 5/15/17 870,000 822<br />
Constellation Brands, Inc.,<br />
8.375%, 12/15/14 455,000 432<br />
(d)Pilgrim's Pride Corp.,<br />
7.625%, 5/1/15 843,000 228<br />
Pinnacle Foods Finance<br />
LLC/Pinnacle Foods<br />
Finance Corp.,<br />
9.25%, 4/1/15 735,000 474<br />
Pinnacle Foods Finance<br />
LLC/Pinnacle Foods<br />
Finance Corp.,<br />
10.625%, 4/1/17 1,415,000 764<br />
The Accompanying Notes are an Integral Part of the Financial Statements.<br />
High Yield Bond Portfolio 129
High Yield Bond Portfolio<br />
Bonds (88.8%)<br />
Shares/<br />
$ Par<br />
Value<br />
$ (000's)<br />
Foods continued<br />
Smithfield Foods, Inc.,<br />
7.75%, 5/15/13 1,310,000 842<br />
Smithfield Foods, Inc.,<br />
7.75%, 7/1/17 760,000 433<br />
Total 5,006<br />
Gaming/Leisure/Lodging (7.6%)<br />
AMC Entertainment, Inc.,<br />
11.00%, 2/1/16 678,000 474<br />
Caesars Entertainment,<br />
Inc., 7.875%, 3/15/10 740,000 488<br />
Caesars Entertainment,<br />
Inc., 8.125%, 5/15/11 1,775,000 870<br />
Felcor Lodging LP,<br />
8.50%, 6/1/11 1,117,000 827<br />
Harrah's Operating Co.,<br />
Inc., 5.50%, 7/1/10 750,000 476<br />
Harrah's Operating Co.,<br />
Inc.,<br />
10.75%, 2/1/16 144A 2,655,000 757<br />
The Hertz Corp.,<br />
8.875%, 1/1/14 840,000 517<br />
Host Hotels & Resorts LP,<br />
7.125%, 11/1/13 2,865,000 2,306<br />
Las Vegas Sands Corp.,<br />
6.375%, 2/15/15 1,845,000 1,070<br />
Mandalay Resort Group,<br />
9.375%, 2/15/10 660,000 482<br />
Mashantucket Western<br />
Pequot Tribe,<br />
8.50%, 11/15/15 144A 1,375,000 540<br />
MGM MIRAGE,<br />
7.50%, 6/1/16 1,800,000 1,141<br />
MGM MIRAGE, Inc.,<br />
6.75%, 9/1/12 1,485,000 1,039<br />
MGM MIRAGE, Inc.,<br />
8.375%, 2/1/11 1,125,000 669<br />
Mohegan Tribal Gaming<br />
Authority,<br />
6.875%, 2/15/15 1,095,000 553<br />
Mohegan Tribal Gaming<br />
Authority,<br />
8.00%, 4/1/12 375,000 229<br />
Royal Caribbean Cruises,<br />
Ltd., 7.00%, 6/15/13 875,000 499<br />
Seminole Hard Rock<br />
Entertainment, Inc.,<br />
4.496%, 3/15/14 144A 540,000 274<br />
Station Casinos, Inc.,<br />
6.00%, 4/1/12 1,475,000 295<br />
Station Casinos, Inc.,<br />
6.625%, 3/15/18 615,000 35<br />
Station Casinos, Inc.,<br />
6.875%, 3/1/16 685,000 39<br />
Universal City<br />
Development Partners,<br />
11.75%, 4/1/10 907,000 585<br />
Bonds (88.8%)<br />
Shares/<br />
$ Par<br />
Value<br />
$ (000's)<br />
Gaming/Leisure/Lodging continued<br />
Universal City Florida<br />
Holding Co. I & II,<br />
8.375%, 5/1/10 400,000 182<br />
Wynn Las Vegas<br />
LLC/Wynn Las Vegas<br />
Capital Corp.,<br />
6.625%, 12/1/14 2,395,000 1,808<br />
Total 16,155<br />
Health Care/Pharmaceuticals (8.5%)<br />
(c) Biomet, Inc.,<br />
10.375%, 10/15/17 2,229,500 1,761<br />
Catalent Pharma<br />
Solutions, Inc.,<br />
9.50%, 4/15/15 997,000 379<br />
CHS/Community Health<br />
Systems, Inc.,<br />
8.875%, 7/15/15 2,585,000 2,378<br />
DaVita, Inc.,<br />
7.25%, 3/15/15 1,110,000 1,054<br />
FMC Finance III SA,<br />
6.875%, 7/15/17 1,265,000 1,183<br />
Fresenius Medical Care<br />
Capital Trust IV,<br />
7.875%, 6/15/11 410,000 389<br />
HCA, Inc.,<br />
6.75%, 7/15/13 905,000 570<br />
HCA, Inc.,<br />
9.125%, 11/15/14 782,000 725<br />
HCA, Inc.,<br />
9.25%, 11/15/16 3,164,000 2,903<br />
(c) HCA, Inc.,<br />
9.625%, 11/15/16 1,273,000 993<br />
Health Management<br />
Associates, Inc.,<br />
6.125%, 4/15/16 1,110,000 688<br />
Senior Housing Properties<br />
Trust, 8.625%, 1/15/12 610,000 525<br />
Service Corp.<br />
International,<br />
6.75%, 4/1/15 855,000 675<br />
Service Corp.<br />
International,<br />
6.75%, 4/1/16 825,000 627<br />
Service Corp.<br />
International,<br />
7.375%, 10/1/14 175,000 149<br />
Tenet Healthcare Corp.,<br />
7.375%, 2/1/13 985,000 702<br />
Tenet Healthcare Corp.,<br />
9.875%, 7/1/14 1,110,000 894<br />
Ventas Realty LP/Ventas<br />
Capital Corp.,<br />
6.50%, 6/1/16 1,095,000 802<br />
Ventas Realty LP/Ventas<br />
Capital Corp.,<br />
9.00%, 5/1/12 750,000 668<br />
Total 18,065<br />
Bonds (88.8%)<br />
Media (7.7%)<br />
Shares/<br />
$ Par<br />
Value<br />
$ (000's)<br />
CCH I Holdings<br />
LLC/CCH I Holdings<br />
Capital Corp.,<br />
11.00%, 10/1/15 2,565,000 398<br />
CCH I Holdings<br />
LLC/CCH I Holdings<br />
Capital Corp.,<br />
11.75%, 5/15/14 905,000 46<br />
CCH II LLC/CCH II<br />
Capital Corp.,<br />
10.25%, 9/15/10 1,000,000 440<br />
CSC Holdings, Inc.,<br />
7.625%, 4/1/11 2,055,000 1,937<br />
CSC Holdings, Inc.,<br />
7.875%, 2/15/18 1,740,000 1,366<br />
Dex Media, Inc.,<br />
8.00%, 11/15/13 1,300,000 240<br />
DirecTV Holdings<br />
LLC/DirecTV Financing<br />
Co., 7.625%, 5/15/16 2,035,000 1,974<br />
EchoStar DBS Corp.,<br />
7.00%, 10/1/13 1,675,000 1,453<br />
EchoStar DBS Corp.,<br />
7.125%, 2/1/16 1,310,000 1,094<br />
EchoStar DBS Corp.,<br />
7.75%, 5/31/15 1,405,000 1,194<br />
Kabel Deutschland<br />
GmbH, 10.625%, 7/1/14 1,215,000 1,081<br />
Lamar Media Corp.,<br />
6.625%, 8/15/15 1,875,000 1,355<br />
LIN Television Corp.,<br />
6.50%, 5/15/13 780,000 371<br />
Mediacom Broadband<br />
LLC/Mediacom<br />
Broadband Corp.,<br />
8.50%, 10/15/15 1,185,000 772<br />
Mediacom<br />
LLC/Mediacom Capital<br />
Corp., 7.875%, 2/15/11 390,000 305<br />
Quebecor Media, Inc.,<br />
7.75%, 3/15/16 1,100,000 742<br />
R.H. Donnelley Corp.,<br />
6.875%, 1/15/13 930,000 125<br />
R.H. Donnelley Corp.,<br />
8.875%, 10/15/17 365,000 55<br />
(c)Univision<br />
Communications, Inc.,<br />
9.75%, 3/15/15 144A 1,180,000 148<br />
Videotron Ltee,<br />
6.375%, 12/15/15 340,000 267<br />
Videotron Ltee,<br />
6.875%, 1/15/14 838,000 742<br />
Videotron Ltee,<br />
9.125%, 4/15/18 144A 185,000 172<br />
Total 16,277<br />
The Accompanying Notes are an Integral Part of the Financial Statements.<br />
130 High Yield Bond Portfolio
High Yield Bond Portfolio<br />
Bonds (88.8%)<br />
Real Estate (0.7%)<br />
Shares/<br />
$ Par<br />
Value<br />
$ (000's)<br />
Icahn Enterprises<br />
LP/Icahn Enterprises<br />
Finance Corp.,<br />
7.125%, 2/15/13 1,510,000 1,042<br />
The Rouse Co. LP,<br />
7.20%, 9/15/12 1,175,000 399<br />
Total 1,441<br />
Services (1.7%)<br />
Allied Waste North<br />
America, Inc.,<br />
6.125%, 2/15/14 565,000 512<br />
Allied Waste North<br />
America, Inc.,<br />
7.25%, 3/15/15 1,411,000 1,312<br />
Crum & Forster Holdings<br />
Corp., 7.75%, 5/1/17 772,000 544<br />
UnumProvident Finance<br />
Co. PLC,<br />
6.85%, 11/15/15 144A 825,000 675<br />
WCA Waste Corp.,<br />
9.25%, 6/15/14 880,000 651<br />
Total 3,694<br />
Technology (3.6%)<br />
Expedia, Inc.,<br />
8.50%, 7/1/16 144A 95,000 71<br />
First Data Corp.,<br />
9.875%, 9/24/15 1,285,000 777<br />
Flextronics International,<br />
Ltd., 6.50%, 5/15/13 1,130,000 893<br />
Freescale Semiconductor,<br />
Inc., 8.875%, 12/15/14 981,000 432<br />
(c) Freescale Semiconductor,<br />
Inc., 9.125%, 12/15/14 1,442,000 332<br />
Iron Mountain, Inc.,<br />
7.75%, 1/15/15 890,000 799<br />
Iron Mountain, Inc.,<br />
8.00%, 6/15/20 1,440,000 1,156<br />
Nortel Networks, Ltd.,<br />
10.75%, 7/15/16 144A 1,110,000 294<br />
Sabre Holdings Corp.,<br />
8.35%, 3/15/16 915,000 203<br />
STATS ChipPAC, Ltd.,<br />
6.75%, 11/15/11 662,000 491<br />
STATS ChipPAC, Ltd.,<br />
7.50%, 7/19/10 675,000 555<br />
Sungard Data Systems,<br />
Inc.,<br />
10.625%, 5/15/15 144A 800,000 684<br />
SunGard Data Systems,<br />
Inc., 9.125%, 8/15/13 670,000 579<br />
Travelport LLC,<br />
11.875%, 9/1/16 300,000 84<br />
Unisys Corp.,<br />
8.00%, 10/15/12 810,000 227<br />
Total 7,577<br />
Shares/<br />
Bonds (88.8%)<br />
$ Par<br />
Telecommunications (7.5%)<br />
Value<br />
$ (000's)<br />
(c) ALLTEL<br />
Communications LLC,<br />
10.375%, 12/1/17 144A 1,095,000 1,226<br />
American Tower Corp.,<br />
7.00%, 10/15/17 144A 825,000 734<br />
Cricket Communications,<br />
Inc.,<br />
10.00%, 7/15/15 144A 470,000 430<br />
Frontier Communications<br />
Corp., 9.00%, 8/15/31 2,205,000 1,389<br />
Frontier Communications<br />
Corp., 9.25%, 5/15/11 2,025,000 1,924<br />
Intelsat Corp.,<br />
9.25%, 8/15/14 144A 755,000 702<br />
Intelsat Jackson Holdings,<br />
Ltd., 11.25%, 6/15/16 740,000 673<br />
Intelsat, Ltd.,<br />
7.625%, 4/15/12 755,000 506<br />
Qwest Corp.,<br />
6.50%, 6/1/17 1,035,000 766<br />
Qwest Corp.,<br />
7.50%, 10/1/14 221,000 184<br />
Qwest Corp.,<br />
7.625%, 6/15/15 750,000 615<br />
Qwest Corp.,<br />
7.875%, 9/1/11 986,000 907<br />
Rogers Wireless, Inc.,<br />
8.00%, 12/15/12 1,220,000 1,168<br />
Sprint Capital Corp.,<br />
8.375%, 3/15/12 1,495,000 1,196<br />
Sprint Nextel Corp.,<br />
6.00%, 12/1/16 1,120,000 790<br />
Windstream Corp.,<br />
7.00%, 3/15/19 680,000 524<br />
Windstream Corp.,<br />
8.125%, 8/1/13 1,150,000 1,058<br />
Windstream Corp.,<br />
8.625%, 8/1/16 1,220,000 1,080<br />
Total 15,872<br />
Transportation (2.0%)<br />
American Railcar<br />
Industries, Inc.,<br />
7.50%, 3/1/14 320,000 211<br />
Kansas City Southern de<br />
Mexico SAB de CV,<br />
7.375%, 6/1/14 1,150,000 941<br />
Kansas City Southern de<br />
Mexico SAB de CV,<br />
7.625%, 12/1/13 470,000 385<br />
Kansas City Southern de<br />
Mexico SAB de CV,<br />
9.375%, 5/1/12 933,000 854<br />
Stena AB,<br />
7.50%, 11/1/13 2,675,000 1,769<br />
Total 4,160<br />
Bonds (88.8%)<br />
Utilities (10.1%)<br />
Shares/<br />
$ Par<br />
Value<br />
$ (000's)<br />
The AES Corp.,<br />
7.75%, 10/15/15 1,495,000 1,256<br />
The AES Corp.,<br />
8.00%, 10/15/17 825,000 677<br />
The AES Corp.,<br />
8.00%, 6/1/20 144A 755,000 585<br />
Aquila, Inc.,<br />
7.95%, 2/1/11 78,000 76<br />
Aquila, Inc.,<br />
11.875%, 7/1/12 755,000 763<br />
Dynegy Holdings, Inc.,<br />
7.50%, 6/1/15 1,300,000 910<br />
Dynegy Holdings, Inc.,<br />
7.75%, 6/1/19 815,000 562<br />
Dynegy Holdings, Inc.,<br />
8.375%, 5/1/16 1,465,000 1,040<br />
Edison Mission Energy,<br />
7.00%, 5/15/17 1,585,000 1,379<br />
Edison Mission Energy,<br />
7.20%, 5/15/19 1,846,000 1,514<br />
Elwood Energy LLC,<br />
8.159%, 7/5/26 1,069,095 725<br />
Energy Future Holdings<br />
Corp.,<br />
10.875%, 11/1/17 144A 1,100,000 781<br />
Indiantown Cogeneration<br />
LP, 9.77%, 12/15/20 1,740,000 1,378<br />
Mirant Americas<br />
Generation LLC,<br />
8.50%, 10/1/21 2,265,000 1,721<br />
NRG Energy, Inc.,<br />
7.25%, 2/1/14 925,000 865<br />
NRG Energy, Inc.,<br />
7.375%, 2/1/16 665,000 619<br />
NRG Energy, Inc.,<br />
7.375%, 1/15/17 816,000 751<br />
NSG Holdings LLC/NSG<br />
Holdings, Inc.,<br />
7.75%, 12/15/25 144A 948,000 739<br />
NV Energy, Inc.,<br />
8.625%, 3/15/14 392,000 353<br />
Reliant Energy, Inc.,<br />
7.625%, 6/15/14 1,855,000 1,540<br />
Texas Competitive<br />
Electric Holdings Co.<br />
LLC,<br />
10.50%, 11/1/15 144A 4,500,000 3,195<br />
Total 21,429<br />
Total Bonds<br />
(Cost: $261,807) 188,239<br />
The Accompanying Notes are an Integral Part of the Financial Statements.<br />
High Yield Bond Portfolio 131
High Yield Bond Portfolio<br />
Short-Term Investments<br />
(8.8%)<br />
Aircraft (2.4%)<br />
Shares/<br />
$ Par<br />
Value<br />
$ (000's)<br />
Kitty Hawk Funding<br />
Corp., 0.35%, 1/5/09 5,000,000 5,000<br />
Total 5,000<br />
Federal Government & Agencies (1.0%)<br />
Federal Home Loan Bank,<br />
0.28%, 1/16/09 2,100,000 2,099<br />
Total 2,099<br />
Finance Services (2.3%)<br />
Gemini Securitization<br />
Corp. LLC,<br />
1.30%, 1/12/09 5,000,000 4,998<br />
Total 4,998<br />
Oil and Gas (3.1%)<br />
Devon Energy Corp.,<br />
0.95%, 1/2/09 5,000,000 5,000<br />
Sempra Global,<br />
1.00%, 1/2/09 1,500,000 1,500<br />
Total 6,500<br />
Total Short-Term Investments<br />
(Cost: $18,597) 18,597<br />
Total Investments (97.6%)<br />
(Cost: $280,499)(a) 206,931<br />
Other Assets, Less<br />
Liabilities (2.4%) 5,072<br />
Net Assets (100.0%) 212,003<br />
* Non-Income Producing<br />
144A after the name of a security represents a security exempt from registration under Rule 144A of the Securities Act of 1933. These securities may be<br />
resold as transactions exempt from registration, normally to qualified institutional buyers. At December 31, 2008 the value of these securities (in thousands)<br />
was $24,569. representing 11.59% of the net assets.<br />
(a)<br />
(c)<br />
(d)<br />
(n)<br />
At December 31, 2008 the aggregate cost of securities for federal tax purposes (in thousands) was $281,467 and the net unrealized depreciation of<br />
investments based on that cost was $74,536 which is comprised of $892 aggregate gross unrealized appreciation and $75,428 aggregate gross unrealized<br />
depreciation.<br />
PIK - Payment In Kind<br />
Defaulted Security<br />
At December 31, 2008 portfolio securities with a aggregate value of $998 (in thousands) were valued with reference to securities whose values are more<br />
readily available.<br />
The Accompanying Notes are an Integral Part of the Financial Statements.<br />
132 High Yield Bond Portfolio
Multi-Sector Bond Portfolio<br />
Objective: Portfolio Strategy: Net Assets:<br />
Seek maximum total return as is<br />
consistent with prudent investment<br />
management.<br />
Invest primarily in a diversified portfolio of debt securities<br />
of varying maturities.<br />
$94 million<br />
Portfolio Overview<br />
Mason Street Advisors, the investment adviser for the Multi-Sector Bond Portfolio, has engaged Pacific Investment<br />
Management Company LLC to act as sub-adviser for the Portfolio. The Portfolio investment objective is to seek maximum<br />
total return, consist with prudent investment management. Normally, the Portfolio seeks to achieve its investment objective by<br />
investing at least 80% of its net assets (plus any borrowings for investment purposes) in a diversified portfolio of fixed income<br />
instruments of varying maturities. The Portfolio may invest all of its assets in high yield securities subject to maximum of 10%<br />
of its total assets in securities rated below B by Moody’s or by S&P or, if unrated, determined to be of comparable quality (so<br />
called “junk bonds”). The Portfolio may also invest in securities denominated in foreign currencies and U.S.-dollarsdenominated<br />
in foreign issuers. The Portfolio may have foreign currency exposure (from non-U.S. dollar denominated<br />
securities or currencies) up to 100% of its total assets. In addition, the Portfolio may invest without limit in fixed income<br />
securities of issuers that are economically tied to emerging securities markets, or in preferred stocks. The Portfolio may invest<br />
all of its assets in derivative instruments, such as options, futures, contracts or swap agreements, or in mortgage-backed<br />
securities such as those issued by Ginnie Mae, Fannie Mae and Freddie Mac. The Portfolio may, without limitation, seek to<br />
obtain market exposure to the securities in which it primarily invests by entering into a series of purchase and sale contracts or<br />
by using other investment techniques (such as buy backs or dollar rolls).<br />
Market Overview<br />
The year 2008 will be remembered for the massive wave of de-leveraging that followed the bursting of the U.S. housing<br />
bubble and produced a financial system crisis that continues to roil markets and economies worldwide. The fourth quarter saw<br />
this crisis spread from the finance realm to the real economy and from the U.S. to around the globe. By year end, the world’s<br />
leading developed economies were experiencing a full-blown economic recession and major emerging economies, though<br />
avoiding outright contraction, faced strong headwinds as exports to the developed world slowed and credit markets slammed<br />
shut. Widespread destruction of demand and wealth had left a large and growing stock of excess capacity and decimated<br />
production and employment. Awakening during the quarter to the reality of a global recession, central banks around the world<br />
shifted into crisis mode and sought additional tools to stimulate the economy. Policy makers’ unconventional moves reflected<br />
the seriousness of the economic downturn, but also made clear that governments were intent on doing whatever was necessary<br />
to promote the resumption of growth. Fiscal plans in various forms were announced in an effort to substitute public balance<br />
sheets for those of the private sector, with the objective of restoring normal intermediation between savers and private<br />
borrowers. Still, the effectiveness of these policies remained to be seen, as risk appetites in the private sector continued to<br />
weaken over the quarter, and saw only modest recovery in December.<br />
Portfolio Results<br />
The Multi-Sector Bond Portfolio returned –6.86% for the twelve months ended December 31, 2008. By comparison, the<br />
Barclays Capital Global Credit Hedged USD Index returned –5.89% for the same period. (This Index is unmanaged, cannot be<br />
invested in directly and does not include administrative expenses or sales charges.) The average return for the Portfolio’s peer<br />
group, General Bond Funds, was –9.18%, according to Lipper Analytical Services, Inc., an independent mutual fund ranking<br />
agency.<br />
Favorable asset allocation helped returns, including an emphasis on emerging markets (EM) and de-emphasis on high yield<br />
and investment grade credit. An underweight to spread duration during the majority of the year helped returns as credit spreads<br />
widened. An off-benchmark allocation to EM currencies helped returns, as the U.S. dollar weakened against these currencies<br />
over the first half of the year. However, these currencies gave back some of their returns in the second half. An underweight to<br />
the high yield credit sector helped performance, as high yield spreads widened to historic levels.<br />
An allocation to high quality financial issues detracted from performance amid de-leveraging in the financial system. Prices<br />
for these securities bounced back in the fourth quarter as this sector benefited from government capital injections and debt<br />
guarantees. An underweight to the consumer non-cyclical sector detracted from performance as that sector outperformed amid<br />
an economic slowdown.<br />
Outlook<br />
We expect the fallout from the financial crisis to push developed economies into one of the most severe global recessions since<br />
World War II. As 2008 ended, the world’s largest developed economies were either already in or quickly headed towards<br />
Multi-Sector Bond Portfolio 133
Multi-Sector Bond Portfolio<br />
recession from which we believe they are not likely to emerge until 2010. Fortunately, the reality of a recession appears to be<br />
bringing clarity to policymakers who by their actions have made it clear they will do whatever it takes to promote the<br />
resumption of growth.<br />
We do not expect major emerging economies such as Brazil, Mexico and Russia to contract, but they will likely face strong<br />
headwinds as their exports to developed countries slow and credit markets remain restrictive. Weaker external demand could<br />
also help cool China’s rapid expansion, though the Chinese government’s plan for massive fiscal stimulus indicates to us that<br />
it will do what is necessary to prop up domestic demand.<br />
We have a cautious outlook for corporates going into 2009. Government policy responses have been aimed at restoring health<br />
to systemically vital financial institutions. While a full recovery will likely take some time, we believe current valuations can<br />
present compelling investment opportunity within the appropriate investment horizon. In high yield, buffeted by a sustained<br />
bout of volatility, the fundamentals continued to deteriorate. Defaults have jumped more than four-fold already this year, and<br />
the prolonged freezing of credit markets, alongside the ailing economy, has the potential to exacerbate the pace of this<br />
deterioration.<br />
Relative Performance<br />
Average <strong>Annual</strong> Total Returns<br />
For Periods Ended December 31, 2008<br />
1 Year<br />
Since<br />
Inception*<br />
Multi-Sector Bond Portfolio -6.86% -3.54%<br />
Barclays Capital Global Credit<br />
Hedged USD Index** -5.89% -2.69%<br />
Equal Weighted Composite of<br />
Barclays Capital Global Aggregate<br />
— Credit Component, Hedged<br />
USD; Merrill Lynch Global High<br />
Yield BB-B Rated Constrained<br />
Index; JP Morgan EMBI Global -12.84% -7.16%<br />
Lipper Variable Insurance Products<br />
(VIP) General Bond Funds Average -9.18% –%<br />
*Inception date of 4/30/07<br />
** Prior to November 1, 2008, the Barclays Capital Global Credit<br />
Hedged USD Index was known as the Lehman Brothers Global Credit<br />
Hedged USD Index.<br />
The performance data quoted represents past<br />
performance. Past performance is historical and does<br />
not guarantee future performance. Investment return<br />
and principal value will fluctuate, so that shares, when<br />
redeemed, may be worth more or less than their original<br />
cost. Current performance may be lower or higher than<br />
the performance data quoted. For the most recent<br />
month-end performance information visit<br />
www.nmfn.com.<br />
This chart assumes an initial investment of $10,000<br />
made on 4/30/07 (commencement of the Portfolio's<br />
operations). Returns shown reflect fee waivers,<br />
deductions for management and other portfolio<br />
expenses, and reinvestment of all dividends. In the<br />
absence of fee waivers, total return would be reduced.<br />
Returns exclude deductions for separte account sale<br />
loads and account fees. Please refer to the Benchmark<br />
Definitions section of this report for information about<br />
the indices cited in the above chart and graph.<br />
The Portfolio invests in lower-quality securities, which<br />
may present a significant risk for loss of principal and<br />
interest. Bonds and other debt obligations are affected<br />
by changes in interest rates, inflation risk and the<br />
creditworthiness of their issuers. High yield bonds<br />
generally have greater price swings and higher default<br />
risks than investment grade bonds. Return of principal is<br />
not guaranteed. When interest rates rise, bond prices<br />
fall. With a fixed income fund, when interest rates rise,<br />
the value of the fund's existing bonds drops, which could<br />
negatively affect overall fund performance.<br />
134 Multi-Sector Bond Portfolio
Multi-Sector Bond Portfolio<br />
The Portfolio may use derivative instruments for hedging<br />
purposes as part of its investment strategy. Use of these<br />
instruments may involve certain costs and risks such as<br />
liquidity risk, interest rate risk, market risk, credit risk,<br />
management risk and the risk that the Portfolio could<br />
not close out a position when it would be most<br />
advantageous to do so. Portfolios investing in<br />
derivatives could lose more than the principal amount<br />
invested in those instruments.<br />
Top 10 Fixed Income Holdings 12/31/08<br />
Security Description<br />
% of Net Assets<br />
Federal National Mortgage Association , Various 38.0%<br />
Brazilian Government International Bond,<br />
Various 3.7%<br />
Bank of America Corp., Various 2.7%<br />
South Africa Government<br />
Bond, 13.00%, 8/31/10 2.6%<br />
Uruguay Government International Bond,<br />
Various 2.6%<br />
GAZ Capital SA, 8.625%, 4/28/34 2.0%<br />
SLM Corp., Various 1.8%<br />
Russian Government International<br />
Bond, 7.50%, 3/31/30 1.8%<br />
General Electric Capital Corp., Various 1.7%<br />
Citigroup, Inc., Various 1.7%<br />
Sector Allocation 12/31/08<br />
Foreign Bonds<br />
6%<br />
Municipal Bonds<br />
1%<br />
Structured<br />
Products<br />
42%<br />
Corporate<br />
Bonds<br />
51%<br />
Sector Allocation is based on fixed income investments.<br />
Sector Allocation and Top 10 Holdings are subject to<br />
change.<br />
Multi-Sector Bond Portfolio 135
Multi-Sector Bond Portfolio<br />
<strong>Northwestern</strong> <strong>Mutual</strong> Series Fund, Inc.<br />
Schedule of Investments<br />
December 31, 2008<br />
Corporate Bonds<br />
(54.4%)<br />
Aerospace/Defense (0.0%)<br />
Shares/<br />
$ Par<br />
Value<br />
$ (000's)<br />
Northwest Airlines, Inc.,<br />
7.626%, 4/1/10 45,236 37<br />
Total 37<br />
Auto Manufacturing (0.2%)<br />
American Honda<br />
Finance Corp.,<br />
3.259%, 2/5/10 144A 200,000 198<br />
Total 198<br />
Banking (20.3%)<br />
American Express Bank<br />
FSB, 1.275%, 7/13/10 250,000 229<br />
Bank of America Corp.,<br />
1.878%, 6/22/12 900,000 904<br />
Bank of America Corp.,<br />
5.75%, 12/1/17 700,000 699<br />
Bank of America Corp.,<br />
8.00%, 12/29/49 500,000 357<br />
Bank of America Corp.,<br />
8.125%, 12/29/49 800,000 598<br />
Barclays Bank PLC,<br />
5.45%, 9/12/12 250,000 253<br />
Barclays Bank PLC,<br />
7.70%, 4/26/49 144A 700,000 463<br />
Barclays Bank PLC New<br />
York, 2.498%, 8/10/09 200,000 199<br />
The Bear Stearns<br />
Companies LLC,<br />
2.356%, 5/18/10 100,000 97<br />
The Bear Stearns<br />
Companies LLC,<br />
3.765%, 1/30/09 100,000 100<br />
The Bear Stearns<br />
Companies LLC,<br />
6.40%, 10/2/17 325,000 338<br />
The Bear Stearns<br />
Companies LLC,<br />
7.25%, 2/1/18 200,000 219<br />
Citigroup Capital XXI,<br />
8.30%, 12/21/57 300,000 231<br />
Citigroup Funding, Inc.,<br />
3.556%, 5/7/10 200,000 190<br />
(b) Citigroup, Inc.,<br />
1.496%, 12/28/09 1,100,000 1,038<br />
Citigroup, Inc.,<br />
8.40%, 4/29/49 800,000 528<br />
(b) Countrywide Financial<br />
Corp., 4.348%, 1/5/09 1,000,000 1,000<br />
Credit Suisse/New York<br />
NY, 5.00%, 5/15/13 300,000 289<br />
The Goldman Sachs<br />
Group, Inc.,<br />
1.766%, 6/28/10 1,000,000 915<br />
Corporate Bonds<br />
(54.4%)<br />
Shares/<br />
$ Par<br />
Value<br />
$ (000's)<br />
Banking continued<br />
The Goldman Sachs<br />
Group, Inc.,<br />
6.15%, 4/1/18 200,000 192<br />
The Goldman Sachs<br />
Group, Inc.,<br />
6.75%, 10/1/37 450,000 365<br />
HBOS PLC,<br />
5.92%, 9/1/49 144A 660,000 250<br />
HSBC Holdings PLC,<br />
6.50%, 5/2/36 760,000 772<br />
JPMorgan Chase & Co.,<br />
6.00%, 1/15/18 100,000 106<br />
(b) JPMorgan Chase Bank<br />
NA, 2.326%, 6/13/16 1,500,000 1,127<br />
(d) Lehman Brothers<br />
Holdings, Inc.,<br />
2.951%, 5/25/10 200,000 18<br />
(d) Lehman Brothers<br />
Holdings, Inc.,<br />
3.053%, 11/10/09 200,000 18<br />
(d) Lehman Brothers<br />
Holdings, Inc.,<br />
6.00%, 7/19/12 300,000 28<br />
(d) Lehman Brothers<br />
Holdings, Inc.,<br />
6.20%, 9/26/14 100,000 10<br />
Merrill Lynch & Co.,<br />
6.875%, 4/25/18 800,000 837<br />
Morgan Stanley,<br />
4.233%, 5/14/10 100,000 93<br />
Morgan Stanley,<br />
5.75%, 8/31/12 100,000 93<br />
Morgan Stanley,<br />
5.95%, 12/28/17 200,000 166<br />
Morgan Stanley,<br />
6.00%, 4/28/15 500,000 431<br />
Rabobank Nederland<br />
NV,<br />
2.639%, 5/19/10 144A 400,000 398<br />
(b) Regions Financial Corp.,<br />
1.636%, 6/26/12 1,300,000 1,047<br />
Santander Perpetual SA<br />
Unipersonal,<br />
6.671%, 10/24/49 144A 300,000 191<br />
UBS AG/Stamford<br />
Branch,<br />
3.779%, 5/5/10 100,000 100<br />
UBS AG/Stamford<br />
Branch,<br />
3.824%, 7/23/09 700,000 696<br />
UBS AG/Stamford<br />
Branch,<br />
5.75%, 4/25/18 300,000 272<br />
UBS AG/Stamford<br />
Branch,<br />
5.875%, 12/20/17 100,000 92<br />
Corporate Bonds<br />
(54.4%)<br />
Shares/<br />
$ Par<br />
Value<br />
$ (000's)<br />
Banking continued<br />
Unicredito Italiano/New<br />
York NY,<br />
1.795%, 5/15/09 800,000 800<br />
Wachovia Bank NA,<br />
3.033%, 5/14/10 900,000 864<br />
Wachovia Bank NA,<br />
3.573%, 11/3/14 500,000 395<br />
Wachovia Corp.,<br />
5.50%, 5/1/13 100,000 99<br />
Wells Fargo & Co.,<br />
4.375%, 1/31/13 400,000 392<br />
Wells Fargo & Co.,<br />
5.25%, 10/23/12 410,000 418<br />
Wells Fargo Capital<br />
XIII, 7.70%, 12/29/49 200,000 165<br />
Total 19,082<br />
Basic Materials (1.0%)<br />
Berry Plastics Holding<br />
Corp., 8.875%, 9/15/14 100,000 44<br />
C8 Capital SPV, Ltd.,<br />
6.64%, 12/31/49 1,000,000 511<br />
Georgia-Pacific LLC,<br />
7.125%, 1/15/17 144A 400,000 336<br />
Total 891<br />
Electric Utilities (0.9%)<br />
Dominion Resources,<br />
Inc., 2.921%, 6/17/10 600,000 557<br />
Enel Finance<br />
International SA,<br />
5.70%, 1/15/13 144A 100,000 92<br />
Nevada Power Co.,<br />
6.75%, 7/1/37 50,000 45<br />
Reliant Energy, Inc.,<br />
6.75%, 12/15/14 75,000 67<br />
Sierra Pacific Power Co.,<br />
6.75%, 7/1/37 75,000 67<br />
Total 828<br />
Electronics (0.1%)<br />
Celestica, Inc.,<br />
7.875%, 7/1/11 150,000 136<br />
Total 136<br />
Energy (0.1%)<br />
SandRidge Energy, Inc.,<br />
8.00%, 6/1/18 144A 150,000 83<br />
Total 83<br />
Food Processors (0.1%)<br />
New Albertson's, Inc.,<br />
7.45%, 8/1/29 125,000 74<br />
Total 74<br />
The Accompanying Notes are an Integral Part of the Financial Statements<br />
136 Multi-Sector Bond Portfolio
Multi-Sector Bond Portfolio<br />
Corporate Bonds<br />
(54.4%)<br />
Shares/<br />
$ Par<br />
Value<br />
$ (000's)<br />
Gaming/Lodging/Leisure (0.3%)<br />
The Hertz Corp.,<br />
8.875%, 1/1/14 150,000 92<br />
MGM MIRAGE,<br />
7.50%, 6/1/16 200,000 127<br />
Wynn Las Vegas<br />
LLC/Wynn Las Vegas<br />
Capital Corp.,<br />
6.625%, 12/1/14 95,000 72<br />
Total 291<br />
Gas Pipelines (0.4%)<br />
El Paso Corp.,<br />
7.00%, 6/15/17 325,000 254<br />
(d) SemGroup LP,<br />
8.75%, 11/15/15 144A 500,000 17<br />
Williams Companies,<br />
Inc., 7.625%, 7/15/19 125,000 98<br />
Total 369<br />
Health Care / Pharmaceuticals (1.2%)<br />
Biomet, Inc.,<br />
10.00%, 10/15/17 38,000 37<br />
(c) Biomet, Inc.,<br />
10.375%, 10/15/17 189,000 149<br />
Biomet, Inc.,<br />
11.625%, 10/15/17 198,000 169<br />
CHS/Community Health<br />
Systems, Inc.,<br />
8.875%, 7/15/15 325,000 299<br />
HCA, Inc.,<br />
9.25%, 11/15/16 550,000 505<br />
Total 1,159<br />
Independent Finance (6.4%)<br />
Caterpillar Financial<br />
Services Corp.,<br />
2.216%, 6/24/11 900,000 805<br />
CIT Group, Inc.,<br />
2.269%, 8/17/09 300,000 288<br />
CIT Group, Inc.,<br />
2.303%, 6/8/09 400,000 391<br />
CIT Group, Inc.,<br />
6.875%, 11/1/09 600,000 576<br />
Deutsche Telekom<br />
International Finance<br />
BV, 1.678%, 3/23/09 200,000 198<br />
(b) General Electric Capital<br />
Corp., 4.398%, 10/6/15 1,300,000 940<br />
General Electric Capital<br />
Corp., 4.625%, 9/15/66 980,000 750<br />
General Electric Capital<br />
Corp., 5.45%, 1/15/13 650,000 655<br />
General Motors<br />
Acceptance Corp. LLC,<br />
3.399%, 5/15/09 300,000 287<br />
General Motors<br />
Acceptance Corp. LLC,<br />
5.625%, 5/15/09 200,000 192<br />
International Lease<br />
Finance Corp.,<br />
4.95%, 2/1/11 200,000 144<br />
Corporate Bonds<br />
(54.4%)<br />
Shares/<br />
$ Par<br />
Value<br />
$ (000's)<br />
Independent Finance continued<br />
John Deere Capital<br />
Corp., 2.939%, 6/10/11 900,000 821<br />
Total 6,047<br />
Information/Data Technology (1.4%)<br />
(b) Oracle Corp.,<br />
5.00%, 1/15/11 1,300,000 1,335<br />
Total 1,335<br />
Life Insurance (0.6%)<br />
Allstate Life Global<br />
Funding II,<br />
2.823%, 5/21/10 200,000 178<br />
Genworth Global<br />
Funding Trusts,<br />
4.943%, 4/15/14 300,000 138<br />
Hartford Life Global<br />
Funding Trusts,<br />
2.176%, 6/16/14 300,000 205<br />
Total 521<br />
Media (1.5%)<br />
Charter Communications<br />
Operating LLC/Charter<br />
Communications<br />
Operating Capital,<br />
8.00%, 4/30/12 144A 125,000 103<br />
Charter Communications<br />
Operating LLC/Charter<br />
Communications<br />
Operating Capital,<br />
8.375%, 4/30/14 144A 125,000 96<br />
CSC Holdings, Inc.,<br />
7.625%, 4/1/11 150,000 141<br />
Dex Media West<br />
LLC/Dex Media West<br />
Finance Co.,<br />
8.50%, 8/15/10 75,000 45<br />
EchoStar DBS Corp.,<br />
7.125%, 2/1/16 325,000 271<br />
Quebecor Media, Inc.,<br />
7.75%, 3/15/16 125,000 84<br />
Viacom, Inc.,<br />
5.75%, 4/30/11 690,000 627<br />
Total 1,367<br />
Natural Gas Distributors (0.1%)<br />
AmeriGas Partners<br />
LP/AmeriGas Eagle<br />
Finance Corp.,<br />
7.125%, 5/20/16 150,000 120<br />
Total 120<br />
Oil and Gas (4.8%)<br />
Chesapeake Energy<br />
Corp., 6.875%, 1/15/16 300,000 240<br />
Citic Resources Finance,<br />
Ltd.,<br />
6.75%, 5/15/14 144A 200,000 130<br />
(b) GAZ Capital SA,<br />
8.625%, 4/28/34 2,400,000 1,920<br />
Corporate Bonds<br />
(54.4%)<br />
Shares/<br />
$ Par<br />
Value<br />
$ (000's)<br />
Oil and Gas continued<br />
(b) Marathon Oil Corp.,<br />
6.00%, 10/1/17 1,000,000 853<br />
(b)Pemex Project Funding<br />
Master Trust,<br />
6.625%, 6/15/35 1,000,000 846<br />
Pemex Project Funding<br />
Master Trust,<br />
6.625%, 6/15/38 144A 100,000 83<br />
TransCapitalInvest, Ltd.<br />
for OJSC AK<br />
Transneft,<br />
6.103%, 6/27/12 144A 200,000 150<br />
Valero Energy Corp.,<br />
6.125%, 6/15/17 205,000 175<br />
Valero Energy Corp.,<br />
6.875%, 4/15/12 50,000 50<br />
XTO Energy, Inc.,<br />
7.50%, 4/15/12 100,000 99<br />
Total 4,546<br />
Other Finance (3.2%)<br />
National Rural Utilities<br />
Cooperative Finance<br />
Corp., 4.658%, 7/1/10 900,000 821<br />
SLM Corp.,<br />
2.196%, 3/15/11 200,000 155<br />
SLM Corp.,<br />
3.675%, 7/27/09 200,000 189<br />
SLM Corp.,<br />
3.695%, 7/26/10 100,000 85<br />
(b) SLM Corp.,<br />
3.765%, 10/25/11 1,700,000 1,303<br />
Teco Finance, Inc.,<br />
6.75%, 5/1/15 100,000 82<br />
Vale Overseas, Ltd.,<br />
8.25%, 1/17/34 325,000 345<br />
Total 2,980<br />
Paper and Forest Products (0.0%)<br />
Verso Paper Holdings<br />
LLC/Verso Paper, Inc.,<br />
9.125%, 8/1/14 75,000 30<br />
Total 30<br />
Property and Casualty Insurance (0.7%)<br />
American International<br />
Group, Inc.,<br />
5.85%, 1/16/18 500,000 335<br />
American International<br />
Group, Inc.,<br />
8.25%, 8/15/18 144A 100,000 73<br />
American International<br />
Group, Inc.,<br />
8.625%, 5/22/38 100,000 44<br />
Metropolitan Life Global<br />
Funding I,<br />
2.246%, 3/15/12 144A 300,000 237<br />
Total 689<br />
The Accompanying Notes are an Integral Part of the Financial Statements.<br />
Multi-Sector Bond Portfolio 137
Multi-Sector Bond Portfolio<br />
Corporate Bonds<br />
(54.4%)<br />
Shares/<br />
$ Par<br />
Value<br />
$ (000's)<br />
Real Estate Investment Trusts (0.1%)<br />
Ventas Realty LP/Ventas<br />
Capital Corp.,<br />
6.75%, 4/1/17 150,000 114<br />
Total 114<br />
Retail: Food/Drug (0.2%)<br />
Tesco PLC,<br />
5.50%, 11/15/17 144A 150,000 139<br />
Total 139<br />
Services (0.3%)<br />
Allied Waste North<br />
America, Inc.,<br />
7.25%, 3/15/15 100,000 93<br />
ARAMARK Corp.,<br />
6.693%, 2/1/15 250,000 189<br />
Total 282<br />
Technology (0.3%)<br />
First Data Corp.,<br />
9.875%, 9/24/15 175,000 106<br />
SunGard Data Systems,<br />
Inc., 9.125%, 8/15/13 150,000 130<br />
Total 236<br />
Telecommunications (2.4%)<br />
(b) America Movil SAB de<br />
CV, 5.75%, 1/15/15 1,000,000 919<br />
France Telecom SA,<br />
7.75%, 3/1/11 300,000 316<br />
Frontier<br />
Communications Corp.,<br />
7.125%, 3/15/19 125,000 84<br />
(d) Hawaiian Telcom<br />
Communications, Inc.,<br />
9.75%, 5/1/13 100,000 7<br />
Nortel Networks, Ltd.,<br />
10.125%, 7/15/13 275,000 73<br />
Qwest Communications<br />
International, Inc.,<br />
7.50%, 2/15/14 150,000 107<br />
Qwest Corp.,<br />
7.25%, 9/15/25 500,000 335<br />
Qwest Corp.,<br />
8.875%, 3/15/12 75,000 69<br />
Sprint Nextel Corp.,<br />
6.00%, 12/1/16 450,000 317<br />
Total 2,227<br />
Tobacco (0.0%)<br />
Reynolds American,<br />
Inc., 6.75%, 6/15/17 50,000 40<br />
Total 40<br />
Transportation (0.1%)<br />
BW Gas, Ltd.,<br />
6.625%, 6/28/17 144A 130,000 100<br />
Total 100<br />
Corporate Bonds<br />
(54.4%)<br />
Utilities (1.1%)<br />
Shares/<br />
$ Par<br />
Value<br />
$ (000's)<br />
The AES Corp.,<br />
8.00%, 10/15/17 100,000 82<br />
Dynegy Holdings, Inc.,<br />
7.50%, 6/1/15 325,000 227<br />
Energy Future Holdings<br />
Corp.,<br />
10.875%, 11/1/17 144A 425,000 302<br />
Nalco Co.,<br />
7.75%, 11/15/11 20,000 19<br />
Nalco Co.,<br />
8.875%, 11/15/13 20,000 17<br />
NRG Energy, Inc.,<br />
7.375%, 1/15/17 430,000 396<br />
Total 1,043<br />
Vehicle Parts (0.2%)<br />
ArvinMeritor, Inc.,<br />
8.125%, 9/15/15 65,000 29<br />
ArvinMeritor, Inc.,<br />
8.75%, 3/1/12 65,000 35<br />
Cooper-Standard<br />
Automotive, Inc.,<br />
7.00%, 12/15/12 150,000 45<br />
Tenneco,<br />
8.625%, 11/15/14 100,000 38<br />
Total 147<br />
Yankee Sovereign (6.4%)<br />
Brazilian Government<br />
International Bond,<br />
6.00%, 1/17/17 1,000,000 1,032<br />
Brazilian Government<br />
International Bond,<br />
8.25%, 1/20/34 200,000 245<br />
Brazilian Government<br />
International Bond,<br />
8.875%, 4/15/24 500,000 620<br />
(b) Brazilian Government<br />
International Bond,<br />
11.00%, 8/17/40 1,200,000 1,566<br />
Colombia Government<br />
International Bond,<br />
7.375%, 1/27/17 200,000 208<br />
Mexico Government<br />
International Bond,<br />
8.30%, 8/15/31 300,000 368<br />
(b) Russian Government<br />
International Bond,<br />
7.50%, 3/31/30 1,960,000 1,709<br />
United Mexican States,<br />
5.95%, 3/19/19 300,000 300<br />
Total 6,048<br />
Total Corporate Bonds<br />
(Cost: $60,598) 51,159<br />
Shares/ Value<br />
Foreign Bonds (6.4%) $ Par $ (000's)<br />
Cable/Media/Broadcasting/Satellite (0.1%)<br />
UnityMedia Hessen<br />
GmBH & Co. KG,<br />
7.702%, 4/15/13 75,000 84<br />
Total 84<br />
Independent Finance (0.2%)<br />
Punch Taverns Finance<br />
PLC, 6.468%, 4/15/33 200,000 186<br />
Total 186<br />
Telecommunications (0.1%)<br />
BCM Ireland Finance,<br />
Ltd., 9.245%, 8/15/16 150,000 103<br />
Total 103<br />
Yankee Sovereign (6.0%)<br />
(k) Brazilian Government<br />
International Bond,<br />
12.50%, 1/5/22 1,650,000 738<br />
(b) South Africa<br />
Government Bond,<br />
13.00%, 8/31/10 21,300,000 2,463<br />
(n)Uruguay Government<br />
International Bond,<br />
3.70%, 6/26/37 3,459,943 61<br />
(b)Uruguay Government<br />
International Bond,<br />
6.875%, 1/19/16 2,000,000 2,347<br />
Total 5,609<br />
Total Foreign Bonds<br />
(Cost: $8,122) 5,982<br />
Municipal Bonds (1.4%)<br />
Municipal Bonds (1.4%)<br />
Buckeye Tobacco<br />
Settlement Financing<br />
Authority, Series 2007-<br />
A2, 5.875%, 6/1/30 RB 100,000 61<br />
Buckeye Tobacco<br />
Settlement Financing<br />
Authority, Series 2007-<br />
A2,5.875%, 6/1/47 RB 100,000 54<br />
California Educational<br />
Facilities Authority,<br />
Series 2007-A,<br />
4.75%, 10/1/37 RB 100,000 89<br />
Clovis Unified School<br />
District of California,<br />
Series 2001-B,<br />
0.00%, 8/1/20 GO,<br />
FGIC 100,000 53<br />
East Bay Municipal<br />
Utility District, Series<br />
2007-A,<br />
5.00%, 6/1/32 RB ,<br />
FGIC 400,000 382<br />
The Accompanying Notes are an Integral Part of the Financial Statements.<br />
138 Multi-Sector Bond Portfolio
Multi-Sector Bond Portfolio<br />
Municipal Bonds (1.4%)<br />
Shares/<br />
$ Par<br />
Value<br />
$ (000's)<br />
Municipal Bonds continued<br />
Golden State Tobacco<br />
Securitization Corp.,<br />
Series 2007-A2,<br />
0.00%, 6/1/37 RB 100,000 35<br />
Golden State Tobacco<br />
Securitization Corp.,<br />
Series 2007-A1,<br />
5.75%, 6/1/47 RB 100,000 56<br />
Los Angeles Community<br />
College District, Series<br />
2007-A,<br />
5.00%, 8/1/32 GO,<br />
FGIC 100,000 94<br />
Los Angeles Unified<br />
School District, Series<br />
2007-A1,<br />
4.50%, 7/1/23 GO,<br />
FSA 100,000 92<br />
North Texas Municipal<br />
Water District Water<br />
System, Series 2006,<br />
5.00%, 9/1/35 RB ,<br />
MBIA 100,000 94<br />
Northern Tobacco<br />
Securitization Corp.,<br />
Series 2006-A,<br />
5.00%, 6/1/46 RB 200,000 96<br />
State of Florida<br />
Department of<br />
Transportation, Series<br />
2008-A,<br />
5.25%, 7/1/37 GO 100,000 97<br />
State of Washington<br />
Motor Vehicle Fuel<br />
Tax, Series 2008-D,<br />
5.00%, 1/1/33 GO 100,000 96<br />
Tobacco Securitization<br />
Authority of Southern<br />
California, Series A1-<br />
SNR, 5.00%, 6/1/37 RB 100,000 50<br />
Total 1,349<br />
Total Municipal Bonds<br />
(Cost: $1,634) 1,349<br />
Structured Products (44.5%)<br />
Structured Products (44.5%)<br />
American Home<br />
Mortgage Assets, Series<br />
2006-4, Class 1A12,<br />
0.681%, 10/25/46 77,015 27<br />
American Home<br />
Mortgage Investment<br />
Trust, Series 2005-2,<br />
Class 4A1,<br />
5.66%, 9/25/45 24,629 12<br />
Banc of America<br />
Commercial Mortgage,<br />
Inc., Series 2007-3,<br />
Class A4,<br />
5.658%, 6/10/49 100,000 73<br />
Structured Products<br />
(44.5%)<br />
Shares/<br />
$ Par<br />
Value<br />
$ (000's)<br />
Structured Products continued<br />
Banc of America<br />
Commercial Mortgage,<br />
Inc., Series 2007-4,<br />
Class A4,<br />
5.745%, 2/10/51 100,000 72<br />
(b) Banc of America<br />
Funding Corp., Series<br />
2005-H, Class 5A1,<br />
5.357%, 11/20/35 641,925 626<br />
Bear Sterns Adjustable<br />
Rate Mortgage Trust,<br />
Series 2007-3, Class<br />
1A1, 5.472%, 5/25/47 86,749 50<br />
Citigroup Mortgage<br />
Loan Trust, Inc., Series<br />
2007-10, Class 22AA,<br />
6.014%, 9/25/37 89,361 47<br />
(b) Commercial Mortgage<br />
Pass-Through<br />
Certificates, Series<br />
2001-JF1A, Class A2F,<br />
1.54%, 2/16/34 144A 781,101 690<br />
Commercial Mortgage<br />
Pass-Through<br />
Certificates, Series<br />
2006-C8, Class A4,<br />
5.306%, 12/10/46 100,000 73<br />
Countrywide Alternative<br />
Loan Trust, Series<br />
2006-0A17, Class<br />
1A1A,<br />
0.703%, 12/20/46 114,083 50<br />
Countrywide Alternative<br />
Loan Trust, Series<br />
2006-0A9, Class 2A1A,<br />
0.718%, 7/20/46 51,457 21<br />
Countrywide Alternative<br />
Loan Trust, Series<br />
2005-59, Class 1A1,<br />
0.838%, 11/20/35 26,855 13<br />
Countrywide Alternative<br />
Loan Trust, Series<br />
2005-62, Class 2A1,<br />
3.256%, 12/25/35 31,704 16<br />
(b) Encore Credit<br />
Receivables Trust,<br />
Series 2005-3, Class<br />
2A2,<br />
0.741%, 10/25/35 122,995 117<br />
(b) Federal Home Loan<br />
Mortgage Corp., Series<br />
3346, Class FA,<br />
1.425%, 2/15/19 767,460 737<br />
(b) Federal National<br />
Mortgage Association,<br />
Series 2007-114, Class<br />
A6, 0.671%, 10/27/37 300,000 255<br />
Federal National<br />
Mortgage Association,<br />
Series 2003-W6, Class<br />
F, 0.821%, 9/25/42 99,236 86<br />
Structured Products<br />
(44.5%)<br />
Shares/<br />
$ Par<br />
Value<br />
$ (000's)<br />
Structured Products continued<br />
(b)Federal National<br />
Mortgage Association,<br />
5.50%, 12/1/38 2,000,000 2,052<br />
Federal National<br />
Mortgage Association<br />
TBA, 5.00%, 1/1/39 8,700,000 8,882<br />
(k)Federal National<br />
Mortgage Association<br />
TBA, 5.50%, 1/1/39 17,800,000 18,245<br />
(k)Federal National<br />
Mortgage Association<br />
TBA, 6.00%, 1/1/39 6,400,000 6,588<br />
GSR Mortgage Loan<br />
Trust, Series 2006-<br />
AR1, Class 2A1,<br />
5.181%, 1/25/36 18,207 13<br />
HSI Asset Securitization<br />
Corp. Trust, Series<br />
2006-OPT4, Class 2A2,<br />
0.581%, 3/25/36 59,469 58<br />
Indymac Indx Mortgage<br />
Loan Trust, Series<br />
2005-AR12, Class<br />
2A1A,<br />
0.711%, 7/25/35 9,132 4<br />
JPMorgan Chase<br />
Commercial Mortgage<br />
Securities Corp., Series<br />
2006-LDP9, Class A3,<br />
5.336%, 5/15/47 100,000 75<br />
JPMorgan Chase<br />
Commercial Mortgage<br />
Securities Corp., Series<br />
2007-CB19, Class A4,<br />
5.747%, 2/12/49 100,000 73<br />
JPMorgan Chase<br />
Commercial Mortgage<br />
Securities Corp., Series<br />
2007-CB20, Class A4,<br />
5.794%, 2/12/51 100,000 73<br />
LB-UBS Commercial<br />
Mortgage Trust, Series<br />
2007-C2, Class A3,<br />
5.43%, 2/15/40 84,000 60<br />
(b)Lehman XS Trust, Series<br />
2006-8, Class 3A1A,<br />
0.591%, 6/25/36 594,154 518<br />
Long Beach Mortgage<br />
Loan Trust, Series<br />
2006-11, Class 2A1,<br />
0.531%, 12/25/36 33,870 29<br />
(b)Massachusetts<br />
Educational Financing<br />
Authority, Series 2008-<br />
1, Class A1,<br />
4.485%, 4/25/38 872,469 662<br />
Morgan Stanley Capital I<br />
Trust, Series 2007-<br />
IQ16, Class A4,<br />
5.809%, 12/12/49 100,000 75<br />
The Accompanying Notes are an Integral Part of the Financial Statements.<br />
Multi-Sector Bond Portfolio 139
Multi-Sector Bond Portfolio<br />
Structured Products (44.5%)<br />
Structured Products continued<br />
(b) Nelnet Student Loan<br />
Trust, Series 2006-1,<br />
Class A2,<br />
2.163%, 2/23/16 414,398 407<br />
(b) SLM Student Loan<br />
Trust, Series 2008-9,<br />
Class A,<br />
5.035%, 4/25/23 1,000,000 937<br />
Structured Asset<br />
Securities Corp., Series<br />
2006-GEL4, Class A1,<br />
0.591%, 10/25/36 144<br />
A 106,878 92<br />
United Air Lines Pass-<br />
Through Certificates,<br />
7.73%, 7/1/10 26,074 24<br />
WaMu Mortgage Pass-<br />
Through Certificates,<br />
Series 2007-0A1, Class<br />
A1A, 2.956%, 2/25/47 55,248 21<br />
WaMu Mortgage Pass-<br />
Through Certificates,<br />
Series 2007-HY1, Class<br />
4A1, 5.449%, 2/25/37 62,109 37<br />
Wells Fargo Mortgage<br />
Backed Securities<br />
Trust, Series 2006-<br />
AR10, Class 5A6,<br />
5.594%, 7/25/36 19,132 11<br />
Total Structured Products<br />
(Cost: $42,059) 41,901<br />
Short-Term Investments (20.0%)<br />
Federal Government & Agencies (10.5%)<br />
(b) Federal Home Loan<br />
Mortgage Corp.,<br />
0.12%, 1/22/09 4,600,000 4,600<br />
(k) US Treasury Bill,<br />
0.003%, 3/19/09 910,000 910<br />
(k) US Treasury Bill,<br />
0.03%, 3/26/09 3,050,000 3,049<br />
Short-Term Investments (20.0%)<br />
Federal Government & Agencies continued<br />
(k) US Treasury Bill,<br />
0.08%, 2/26/09 650,000 650<br />
(k) US Treasury Bill,<br />
0.09%, 2/26/09 140,000 140<br />
(k) US Treasury Bill,<br />
0.18%, 2/12/09 500,000 500<br />
(k) US Treasury Bill,<br />
0.22%, 6/11/09 70,000 70<br />
Total 9,919<br />
National Commercial Banks (1.0%)<br />
(b) Nordea North America,<br />
Inc., 2.05%, 1/16/09 900,000 899<br />
Total 899<br />
Repurchase Agreements (8.5%)<br />
(b) US Treasury<br />
Repurchase, 0.03%,<br />
dated 12/30/08, due<br />
1/5/09, repurchase price<br />
$8,000,040,<br />
collateralized by U.S.<br />
Government Agency<br />
Bond with a value of<br />
$8,073,503,<br />
0.03%, 1/5/09 8,000,000 8,000<br />
Total 8,000<br />
Total Short-Term Investments<br />
(Cost: $18,818) 18,818<br />
Total Investments (126.7%)<br />
(Cost: $131,231)(a) 119,209<br />
Other Assets, Less<br />
Liabilities (-26.7%) (25,088)<br />
Net Assets (100.0%) 94,121<br />
144A after the name of a security represents a security exempt from registration under Rule 144A of the Securities Act of 1933. These securities may be<br />
resold as transactions exempt from registration, normally to qualified institutional buyers. At December 31, 2008 the value of these securities (in thousands)<br />
was $4,223, representing 4.49% of the net assets.<br />
GO — General Obligation<br />
RB — Revenue Bond<br />
FGIC — Financial Guaranty Insurance Co.<br />
FSA — Financial Security Assurance<br />
MBIA — Municipal Bond Insurance Association<br />
The Accompanying Notes are an Integral Part of the Financial Statements.<br />
140 Multi-Sector Bond Portfolio
Multi-Sector Bond Portfolio<br />
(a)<br />
(b)<br />
At December 31, 2008 the aggregate cost of securities for federal tax purposes (in thousands) was $131,582 and the net unrealized depreciation of<br />
investments based on that cost was $12,373 which is comprised of $978 aggregate gross unrealized appreciation and $13,351 aggregate gross unrealized<br />
depreciation.<br />
All or a portion of the securities have been committed as collateral for open futures positions or when-issued securities. Information regarding open futures<br />
contracts as of period end is summarized below.<br />
Unrealized<br />
Appreciation/<br />
Number of<br />
(Depreciation)<br />
Issuer (000's)<br />
Contracts Expiration Date (000's)<br />
90 Day Euro $ Commodity Future (Long) (Total Notional Value at December 31, 2008, $176,460) 732 12/09 $ 3,950<br />
90 Day Sterling (Long) (Total Notional Value at December 31, 2008, $2,609) 11 3/09 89<br />
Euro Bund Future (Long) (Total Notional Value at December 31, 2008, $2,961) 19 3/09 59<br />
(c)<br />
(d)<br />
PIK - Payment In Kind<br />
Defaulted Security<br />
(h) Forward foreign currency contracts outstanding on December 31, 2008<br />
Principal<br />
Amount<br />
Covered by<br />
Contract (000's)<br />
Unrealized<br />
Appreciation<br />
(000's)<br />
Unrealized<br />
(Depreciation)<br />
(000's)<br />
Net Unrealized<br />
Appreciation/<br />
(Depreciation)<br />
(000's)<br />
Settlement<br />
Type<br />
Month<br />
Buy BRL 1,516 2/09 $ — $ (3) $ (3 )<br />
Sell BRL 3,076 2/09 88 — 88<br />
Buy CLP 19,826 5/09 — (11) (11 )<br />
Sell CLP 15,137 5/09 — —(m) —<br />
Buy CNY 6,565 9/09 8 — 8<br />
Sell EUR 3,104 1/09 — (413) (413 )<br />
Sell GBP 383 1/09 10 — 10<br />
Sell HUF 174,749 5/09 — (123) (123 )<br />
Buy IDR 885,725 3/09 — (5) (5 )<br />
Buy JPY 3,788 1/09 2 — 2<br />
Buy MXN 108 5/09 — (2) (2 )<br />
Buy MYR 111 2/09 1 — 1<br />
Buy MYR 106 4/09 1 — 1<br />
Buy PHP 23,841 2/09 — (21) (21 )<br />
Buy PHP 10,162 5/09 2 — 2<br />
Buy PHP 700 12/10 — (2) (2 )<br />
Sell PHP 700 12/10 1 — 1<br />
Buy PLN 68 5/09 — (7) (7 )<br />
Buy RON 1,478 1/09 — (90) (90 )<br />
Sell RON 1,478 1/09 38 — 38<br />
Buy RUB 14,853 5/09 — (179) (179 )<br />
Sell RUB 14,853 5/09 14 — 14<br />
Buy SGD 1,184 7/09 26 — 26<br />
Sell SGD 717 1/09 — (22) (22 )<br />
Sell ZAR 22,453 5/09 — (271) (271 )<br />
$ 191 $ (1,149) $ (958 )<br />
BRL - Brazilian Real<br />
CLP - Chilean Peso<br />
CNY - China Yuan Renminbi<br />
EUR - Euro<br />
GBP - British Pound<br />
HUF - Hungarian Forint<br />
IDR - Indonesian Rupiah<br />
JPY - Japanese Yen<br />
MXN - Mexican New Peso<br />
MYR - Malaysian Ringgit<br />
PHP - Philippines Peso<br />
PLN - Poland Zloty<br />
RON - Romanian Leu<br />
RUB - Russian Ruble<br />
SGD - Singapore Dollar<br />
ZAR - South African Rand<br />
The Accompanying Notes are an Integral Part of the Financial Statements.<br />
Multi-Sector Bond Portfolio 141
Multi-Sector Bond Portfolio<br />
(j) Swap agreements outstanding on December 31, 2008<br />
Interest Rate Swaps<br />
Unrealized<br />
Appreciation/<br />
Floating Rate Pay/Receive Fixed Expiration Notional (Depreciation)<br />
Counterparty<br />
Index<br />
Floating Rate Rate Date Amount (000's) (000's)<br />
JPMorgan Chase 6 Month GBP-LIBOR Pay 4.75% 9/10 GBP 2,700 $ 131<br />
Morgan Stanley Capital Services, Inc. 3 Month USD-LIBOR Receive 4.00% 6/11 USD 15,100 (137)<br />
Morgan Stanley Capital Services, Inc. 3 Month USD-LIBOR Receive 5.00% 12/38 USD 1,200 (569)<br />
28 Day Mexico Interbank<br />
TIIE Banxico Pay 8.17% 11/16 MXN 2,800 2<br />
Morgan Stanley Capital Services, Inc.<br />
Morgan Stanley Capital Services, Inc. 3 Month USD-LIBOR Pay 5.00% 12/18 USD 2,200 449<br />
$ (124)<br />
Credit Default Swaps<br />
CounterParty<br />
JPMorgan Chase<br />
JPMorgan Chase<br />
Morgan Stanley Capital<br />
Services, Inc.<br />
Morgan Stanley Capital<br />
Services, Inc.<br />
Morgan Stanley Capital<br />
Services, Inc.<br />
Reference Entity<br />
Dow Jones CDX NA Emerging<br />
Markets Index, Series 10<br />
Dow Jones CDX NA Emerging<br />
Markets Index, Series 9<br />
Philippine Government<br />
International Bond, 10.625%,<br />
3/16/25<br />
Dow Jones CDX NA High Yield<br />
Index, Series 9<br />
Dow Jones CDX NA Emerging<br />
Markets Index, Series 9<br />
Buy/Sell<br />
Protection<br />
Unrealized<br />
Appreciation/<br />
(Depreciation)<br />
(000's)<br />
(Pay)/Receive Expiration Notional<br />
Fixed Rate Date Amount (000's)<br />
Sell 3.35% 12/13 USD 2,000 $ 5<br />
Sell 2.65% 6/13 USD 11,000 (1,824)<br />
Sell 2.44% 9/17 USD 100 (8)<br />
Sell 3.75% 12/12 USD 4,900 (643)<br />
Sell 2.65% 6/13 USD 10,000 (1,622)<br />
$ (4,092)<br />
(k) Securities with an aggregate value of $30,890 (in thousands) have been pledged as collateral for swap contracts and short sales outstanding on December 31,<br />
2008<br />
(m) Amount is less than one thousand.<br />
(n)<br />
At December 31, 2008 portfolio securities with a aggregate value of $61 (in thousands) were valued with reference to securities whose values are more<br />
readily available.<br />
(o) Short sales outstanding on December 31, 2008<br />
Maturity Principal Proceeds Value<br />
Description<br />
Coupon Date Amount (000's) (000's) (000's)<br />
Federal National Mortgage Association TBA 6.50% 1/39 $ 700 $ 720 $ 727<br />
The Accompanying Notes are an Integral Part of the Financial Statements.<br />
142 Multi-Sector Bond Portfolio
Balanced Portfolio<br />
Objective: Portfolio Strategy: Net Assets:<br />
Realize as high a level of total return<br />
as is consistent with prudent investment<br />
risk, through income and capital<br />
appreciation.<br />
Capitalize on changing financial market and economic<br />
conditions by actively managing a diversified portfolio<br />
allocated across equity, debt and cash market sectors.<br />
$2.0 billion<br />
Portfolio Overview<br />
Mason Street Advisors acts as the investment adviser for the Balanced Portfolio. The investment objective of the Portfolio is to<br />
realize as high a level of long-term total return as is consistent with prudent investment risk, through income and capital<br />
appreciation. The Balanced Portfolio invests in seven categories of assets: large-capitalization stocks, mid-capitalization<br />
stocks, small-capitalization stocks, foreign stocks, investment-grade bonds, below investment-grade bonds, and cash<br />
equivalents. The proportion of investments in each category is adjusted as appropriate to take advantage of market trends and<br />
opportunities, and securities within each category are actively managed by an investment professional with experience in that<br />
category. Under normal conditions, the Portfolio will typically allocate between 35% and 55% of assets to equity securities<br />
and between 40%-60% to fixed income securities. The Portfolio is managed to maintain broad diversification, while blending<br />
asset classes to attempt to achieve both capital appreciation and current income.<br />
Market Overview<br />
Financial markets endured a brutal 2008, which saw the failure of a number of leading financial institutions, credit markets<br />
freeze up, and the U.S. government take a series of extraordinary steps to support the economy and financial system. The crisis<br />
was a result of the ongoing sub-prime mortgage meltdown, which spread rapidly through the financial sector and into virtually<br />
every segment of global financial markets. Economic conditions deteriorated sharply over the course of the year, as<br />
unemployment jumped above 7% and the economy entered its first recession since 2002.<br />
Against that backdrop, the S&P 500 ® Index fell 37.00%. Equity returns were negative across all market capitalization ranges,<br />
sectors, and investment styles. Fixed income returns varied widely, with the Citigroup U.S. Broad Investment Grade Bond<br />
Index (a broad-based bond index) up 7.02%, as Treasury and government-backed mortgage debt had positive returns, while<br />
corporate bonds endured their worst year ever. What’s more, the Citigroup High-Yield Cash-Pay Index suffered its most<br />
difficult year on record, falling 24.74%. Meanwhile, cash-equivalent investments had modest returns as the Fed slashed shortterm<br />
rates. For the full year, the Merrill Lynch Three-Month T-Bill Index was up 2.06%. International equities offered no<br />
relief, as the MSCI EAFE Index—a measure of large-cap stock performance in Europe, Australasia, and the Far East—<br />
tumbled 43.06%.<br />
Portfolio Results<br />
The Balanced Portfolio returned –22.72% for the twelve months ended December 31, 2008. That compares with the –37.00%<br />
return of the broad stock market, as measured by the S&P 500 ® Index. At the same time, the Balanced Portfolio Blended<br />
Composite Benchmark returned –20.19%. (The Portfolio’s blended benchmark weights are detailed in the “Benchmark<br />
Definitions” section of this annual report.) The Portfolio outperformed its Mixed-Asset Target Allocation Moderate Funds<br />
peer group, which had an average return of –25.34%, according to Lipper Analytical Services, Inc., an independent mutual<br />
fund ranking agency.<br />
The Portfolio’s absolute return reflected the unprecedented turmoil affecting the economy and financial markets in a year in<br />
which only cash and government-backed securities had positive returns. The Portfolio outperformed the equity-only S&P 500 ®<br />
Index thanks to positive performance from its cash and bond allocations. Relative to the blended benchmark, it helped to be<br />
underrepresented in equities overall, and international stocks in particular. It was also beneficial to be underweight high yield<br />
bonds; in addition, our allocation to this market segment outperformed its underlying benchmark. However, our stock and<br />
investment grade bond allocations lagged their underlying benchmarks, which accounted for the bulk of the Portfolio’s<br />
underperformance of the blended index.<br />
Many of the changes we made to the Portfolio’s asset mix over the course of the year were to address imbalances created by<br />
sharp volatility in the markets. For example, stocks’ poor performance shrank the equity slice of the Portfolio, so we<br />
consistently used our cash allocation to bring equities back closer to neutral. Nevertheless, equities finished the year a little<br />
below our target allocation at 46% of assets. The fixed income allocation ended the year a little above our neutral weight at<br />
49% of assets, though we maintained a bias toward high quality bonds and an underweight position in high yield debt. The<br />
Portfolio’s cash allocation at year-end was essentially neutral.<br />
Outlook<br />
After the unprecedented events of 2008, we have a somewhat hopeful outlook for 2009—we are hoping for the reemergence of<br />
a more rational, less volatile market environment where fundamentals matter again. Unfortunately, the economic fundamentals<br />
remain challenging, and it is difficult to see a quick rebound.<br />
Balanced Portfolio 143
Balanced Portfolio<br />
In terms of the Portfolio’s asset allocation, the extreme market conditions of the last year have created some significant<br />
disparities in valuations across and within asset classes. So, for example, at a time when cash yields are approaching zero and<br />
Treasury bond yields are at record lows, we find that stocks and credit-sensitive bonds are very attractive by comparison. As a<br />
result, we expect to reduce our cash position, adding to both our equity and bond allocations. Within equities, we expect to<br />
favor growth-oriented shares, which historically have done better than value when investors desire earnings certainty. And<br />
within fixed income, we favor high quality assets trading at distressed levels, particularly those with government backing.<br />
$20,000<br />
15,000<br />
10,000<br />
5,000<br />
Relative Performance<br />
0<br />
12/98 12/00 12/02 12/04 12/06 12/08<br />
Balanced Portfolio<br />
S&P 500 Index<br />
Citigroup U.S. Broad Investment Grade Index<br />
Balanced Portfolio Blended Composite Benchmark<br />
Average <strong>Annual</strong> Total Returns<br />
For Periods Ended December 31, 2008<br />
1 Year 5 Years 10 Years<br />
Balanced Portfolio<br />
S&P 500 Index<br />
-22.72% 0.25%<br />
-37.00% -2.19%<br />
1.73%<br />
-1.38%<br />
Citigroup U.S. Broad Investment<br />
Grade Index 7.02% 5.10% 5.85%<br />
Balanced Portfolio Blended<br />
Composite Benchmark -20.19% 1.92% 2.84%<br />
Lipper Variable Insurance Products<br />
(VIP) Mixed Asset Target<br />
Allocation Moderate Funds<br />
Average -25.34% 0.07% 1.46%<br />
Investors should be aware of the risks of investments in<br />
foreign securities, particularly investments in securities<br />
of companies in developing nations. These include the<br />
risks of currency fluctuation, of political and economic<br />
instability and of less well-developed government<br />
supervision and regulation of business and industry<br />
practices, as well as differences in accounting<br />
standards. Small cap stocks also may carry additional<br />
risk. Smaller or newer issuers are more likely to realize<br />
more substantial growth as well as suffer more<br />
significant losses than larger or more established<br />
issuers. Investments in such companies can be both<br />
volatile and more speculative. Bonds and other debt<br />
obligations are affected by changes in interest rates,<br />
inflation risk and the creditworthiness of their issuers.<br />
High yield bonds generally have greater price swings<br />
and higher default risks than investment grade bonds.<br />
The Portfolio may use derivative instruments for hedging<br />
purposes as part of its investment strategy. Use of these<br />
instruments may involve certain costs and risks such as<br />
liquidity risk, interest rate risk, market risk, credit risk,<br />
management risk and the risk that the Portfolio could<br />
not close out a position when it would be most<br />
advantageous to do so. Portfolios investing in<br />
derivatives could lose more than the principal amount<br />
invested in those instruments.<br />
The performance data quoted represents past<br />
performance. Past performance is historical and does<br />
not guarantee future performance. Investment return<br />
and principal value will fluctuate, so that shares, when<br />
redeemed, may be worth more or less than their original<br />
cost. Current performance may be lower or higher than<br />
the performance data quoted. For the most recent<br />
month-end performance information visit<br />
www.nmfn.com.<br />
This chart assumes an initial investment of $10,000<br />
made on 12/31/98. Returns shown include deductions<br />
for management and other portfolio expenses, and<br />
reinvestment of all dividends. Returns exclude<br />
deductions for separte account sale loads and account<br />
fees. Please refer to the Benchmark Definitions section<br />
of this report for information about the indices cited in<br />
the above chart and graph.<br />
144 Balanced Portfolio
Balanced Portfolio<br />
Top 5 Equity Holdings 12/31/08<br />
Security Description<br />
% of Net Assets<br />
Microsoft Corp. 0.7%<br />
Celgene Corp. 0.5%<br />
Hewlett-Packard Co. 0.5%<br />
Google, Inc. - Class A 0.5%<br />
Wal-Mart Stores, Inc. 0.5%<br />
Top 5 Fixed Income Holdings 12/31/08<br />
Security Description<br />
% of Net Assets<br />
Federal National Mortgage Association, Various 10.2%<br />
Federal Home Loan Mortgage Corp., Various 4.6%<br />
Federal Home Loan Mortgage Corp.,<br />
4.875%, 6/13/18 1.6%<br />
AEP Texas Central Transition Funding LLC,<br />
5.306%, 7/01/21 1.0%<br />
US Treasury, Various 0.9%<br />
Sector Allocation 12/31/08<br />
Governments<br />
5%<br />
Below Investment<br />
Grade Segment<br />
6%<br />
Foreign Stocks<br />
7%<br />
Mid Cap Stocks<br />
8%<br />
Investment Grade<br />
Segment<br />
13%<br />
Small Cap Stocks<br />
2%<br />
Structured<br />
Products<br />
24%<br />
Large Cap<br />
Stocks<br />
18%<br />
Short-Term<br />
Investments<br />
& Other<br />
Net Assets<br />
17%<br />
Sector Allocation is based on Net Assets.<br />
Sector Allocation and Top 10 Holdings are subject to<br />
change.<br />
Balanced Portfolio 145
Balanced Portfolio<br />
<strong>Northwestern</strong> <strong>Mutual</strong> Series Fund, Inc.<br />
Schedule of Investments<br />
December 31, 2008<br />
Domestic Common Stocks and<br />
Warrants (27.5%)<br />
Large Cap Common Stocks (17.7%)<br />
Consumer Discretionary (1.7%)<br />
Shares/<br />
$ Par<br />
Value<br />
$ (000's)<br />
Abercrombie & Fitch Co. -<br />
Class A 66,200 1,527<br />
* Amazon.com, Inc. 28,000 1,436<br />
Comcast Corp. - Class A 288,200 4,865<br />
Johnson Controls, Inc. 158,200 2,873<br />
* Kohl's Corp. 129,800 4,699<br />
Lowe's Cos., Inc. 138,600 2,983<br />
McDonald's Corp. 57,800 3,594<br />
The McGraw-Hill Cos., Inc. 118,400 2,746<br />
NIKE, Inc. - Class B 78,600 4,009<br />
Omnicom Group, Inc. 97,300 2,619<br />
Target Corp. 78,700 2,717<br />
Total 34,068<br />
Consumer Staples (2.9%)<br />
Avon Products, Inc. 134,400 3,230<br />
The Coca-Cola Co. 138,200 6,256<br />
CVS Caremark Corp. 250,500 7,199<br />
* Energizer Holdings, Inc. 47,200 2,555<br />
* Hansen Natural Corp. 125,400 4,205<br />
The Kroger Co. 211,600 5,588<br />
PepsiCo, Inc. 122,800 6,726<br />
Philip Morris International,<br />
Inc. 183,600 7,989<br />
The Procter & Gamble Co. 62,400 3,858<br />
Wal-Mart Stores, Inc. 172,500 9,670<br />
Total 57,276<br />
Energy (1.5%)<br />
Exxon Mobil Corp. 82,000 6,546<br />
Halliburton Co. 117,600 2,138<br />
Hess Corp. 37,400 2,006<br />
* National-Oilwell Varco, Inc. 194,400 4,751<br />
Occidental Petroleum Corp. 72,200 4,331<br />
Schlumberger, Ltd. 102,700 4,347<br />
* Transocean, Ltd. 27,700 1,309<br />
XTO Energy, Inc. 104,575 3,689<br />
Total 29,117<br />
Financials (0.4%)<br />
American Express Co. 61,000 1,132<br />
CME Group, Inc. 6,900 1,436<br />
The Goldman Sachs Group,<br />
Inc. 19,600 1,654<br />
Prudential Financial, Inc. 51,000 1,543<br />
State Street Corp. 86,100 3,386<br />
Total 9,151<br />
Health Care (3.1%)<br />
Abbott Laboratories 174,000 9,286<br />
Domestic Common Stocks and<br />
Warrants (27.5%)<br />
Shares/<br />
$ Par<br />
Value<br />
$ (000's)<br />
Health Care continued<br />
Allergan, Inc. 84,100 3,391<br />
Baxter International, Inc. 144,600 7,749<br />
Bristol-Myers Squibb Co. 39,600 921<br />
*Celgene Corp. 183,900 10,166<br />
*Genentech, Inc. 53,800 4,461<br />
*Genzyme Corp. 43,700 2,900<br />
*Gilead Sciences, Inc. 135,800 6,945<br />
Johnson & Johnson 44,900 2,686<br />
*Medco Health Solutions, Inc. 176,000 7,376<br />
*St. Jude Medical, Inc. 69,800 2,301<br />
*Thermo Fisher Scientific,<br />
Inc. 53,500 1,823<br />
UnitedHealth Group, Inc. 99,700 2,652<br />
Total 62,657<br />
Industrials (1.8%)<br />
Danaher Corp. 68,700 3,889<br />
Deere & Co. 57,000 2,184<br />
FedEx Corp. 50,200 3,220<br />
*First Solar, Inc. 17,700 2,442<br />
Honeywell International, Inc. 139,400 4,577<br />
Lockheed Martin Corp. 28,000 2,354<br />
Norfolk Southern Corp. 77,700 3,656<br />
Raytheon Co. 62,500 3,190<br />
Textron, Inc. 118,800 1,648<br />
Union Pacific Corp. 86,700 4,144<br />
United Technologies Corp. 86,700 4,647<br />
Total 35,951<br />
Information Technology (5.1%)<br />
Accenture, Ltd. - Class A 122,300 4,010<br />
*Apple, Inc. 82,600 7,050<br />
Applied Materials, Inc. 108,300 1,097<br />
*Broadcom Corp. - Class A 174,900 2,968<br />
*Cisco Systems, Inc. 542,900 8,849<br />
Corning, Inc. 200,400 1,910<br />
*eBay, Inc. 161,600 2,256<br />
*Electronic Arts, Inc. 92,700 1,487<br />
*Google, Inc. - Class A 31,700 9,752<br />
Hewlett-Packard Co. 270,200 9,806<br />
Intel Corp. 545,700 8,000<br />
International Business<br />
Machines Corp. 104,500 8,795<br />
MasterCard, Inc. 5,600 800<br />
*MEMC Electronic Materials,<br />
Inc. 111,900 1,598<br />
Microsoft Corp. 694,300 13,497<br />
*Oracle Corp. 377,800 6,698<br />
QUALCOMM, Inc. 242,800 8,700<br />
*Research In Motion, Ltd. 44,000 1,786<br />
Visa, Inc. - Class A 34,200 1,794<br />
*Yahoo!, Inc. 86,000 1,049<br />
Total 101,902<br />
The Accompanying Notes are an Integral Part of the Financial Statements.<br />
146 Balanced Portfolio
Balanced Portfolio<br />
Domestic Common Stocks and<br />
Warrants (27.5%)<br />
Materials (0.8%)<br />
Shares/<br />
$ Par<br />
Value<br />
$ (000's)<br />
Ecolab, Inc. 50,400 1,772<br />
Freeport-McMoRan Copper<br />
& Gold, Inc. 55,900 1,366<br />
Monsanto Co. 92,300 6,493<br />
Praxair, Inc. 93,300 5,538<br />
Total 15,169<br />
Telecommunication Services (0.3%)<br />
* American Tower Corp. -<br />
Class A 114,700 3,363<br />
* NII Holdings, Inc. 111,400 2,025<br />
Total 5,388<br />
Utilities (0.1%)<br />
Exelon Corp. 53,400 2,970<br />
Total 2,970<br />
Total Large Cap Common Stocks 353,649<br />
Mid Cap Common Stocks (7.7%)<br />
Consumer Discretionary (1.1%)<br />
* Collective Brands, Inc. 274,000 3,211<br />
DeVry, Inc. 87,300 5,012<br />
* Dollar Tree, Inc. 120,900 5,054<br />
* Focus Media Holding, Ltd.,<br />
ADR 103,000 936<br />
* GameStop Corp. - Class A 182,000 3,942<br />
* O'Reilly Automotive, Inc. 86,050 2,645<br />
* Urban Outfitters, Inc. 129,900 1,946<br />
Total 22,746<br />
Energy (0.8%)<br />
* Cameron International Corp. 198,700 4,073<br />
Diamond Offshore Drilling,<br />
Inc. 42,600 2,511<br />
Range Resources Corp. 81,700 2,810<br />
* SandRidge Energy, Inc. 70,300 432<br />
Smith International, Inc. 54,200 1,240<br />
* Southwestern Energy Co. 184,800 5,354<br />
Total 16,420<br />
Financials (0.8%)<br />
Assured Guaranty, Ltd. 90,000 1,026<br />
* IntercontinentalExchange,<br />
Inc. 15,500 1,278<br />
* MBIA, Inc. 147,000 598<br />
Northern Trust Corp. 64,600 3,368<br />
Raymond James Financial,<br />
Inc. 142,900 2,448<br />
SEI Investments Co. 88,100 1,384<br />
Synovus Financial Corp. 173,200 1,438<br />
T. Rowe Price Group, Inc. 57,025 2,021<br />
W.R. Berkley Corp. 42,100 1,305<br />
Total 14,866<br />
Domestic Common Stocks and<br />
Warrants (27.5%)<br />
Health Care (0.9%)<br />
Shares/<br />
$ Par<br />
Value<br />
$ (000's)<br />
*Cerner Corp. 68,100 2,619<br />
*Charles River Laboratories<br />
International, Inc. 58,100 1,522<br />
*DaVita, Inc. 90,500 4,486<br />
*Express Scripts, Inc. 67,700 3,722<br />
*Immucor, Inc. 196,024 5,210<br />
*Intuitive Surgical, Inc. 9,700 1,232<br />
Total 18,791<br />
Industrials (1.7%)<br />
C.H. Robinson Worldwide,<br />
Inc. 83,900 4,617<br />
*Corrections Corp. of<br />
America 279,050 4,565<br />
Cummins, Inc. 20,600 551<br />
Expeditors International of<br />
Washington, Inc. 77,000 2,562<br />
*Foster Wheeler, Ltd. 116,300 2,719<br />
*FTI Consulting, Inc. 7,700 344<br />
Harsco Corp. 87,800 2,430<br />
J.B. Hunt Transport<br />
Services, Inc. 113,000 2,969<br />
L-3 Communications<br />
Holdings, Inc. 24,600 1,815<br />
MSC Industrial Direct Co.,<br />
Inc. - Class A 34,100 1,256<br />
Ritchie Bros. Auctioneers,<br />
Inc. 104,448 2,237<br />
*Spirit AeroSystems<br />
Holdings, Inc. - Class A 330,600 3,362<br />
*Stericycle, Inc. 75,600 3,937<br />
Total 33,364<br />
Information Technology (2.0%)<br />
*Activision Blizzard, Inc. 122,700 1,060<br />
*Alliance Data Systems Corp. 87,700 4,081<br />
Amphenol Corp. - Class A 114,100 2,736<br />
*Citrix Systems, Inc. 73,000 1,721<br />
*Cognizant Technology<br />
Solutions Corp. - Class A 106,200 1,918<br />
FactSet Research Systems,<br />
Inc. 65,300 2,889<br />
Global Payments, Inc. 120,600 3,954<br />
Intersil Corp. - Class A 288,800 2,654<br />
KLA-Tencor Corp. 139,300 3,035<br />
*McAfee, Inc. 118,900 4,110<br />
*Mettler-Toledo International,<br />
Inc. 49,400 3,330<br />
Microchip Technology, Inc. 144,500 2,822<br />
*Varian Semiconductor<br />
Equipment Associates,<br />
Inc. 189,000 3,425<br />
*VeriFone Holdings, Inc. 145,200 712<br />
Western Union Co. 74,000 1,061<br />
Total 39,508<br />
Materials (0.2%)<br />
*Owens-Illinois, Inc. 104,000 2,842<br />
The Accompanying Notes are an Integral Part of the Financial Statements.<br />
Balanced Portfolio 147
Balanced Portfolio<br />
Domestic Common Stocks and<br />
Warrants (27.5%)<br />
Shares/<br />
$ Par<br />
Value<br />
$ (000's)<br />
Materials continued<br />
Titanium Metals Corp. 141,500 1,247<br />
Total 4,089<br />
Utilities (0.2%)<br />
Equitable Resources, Inc. 92,400 3,100<br />
Total 3,100<br />
Total Mid Cap Common Stocks 152,884<br />
Small Cap Common Stocks (2.1%)<br />
Consumer Discretionary (0.3%)<br />
* Aeropostale, Inc. 225 4<br />
* American Public Education,<br />
Inc. 11,600 431<br />
Arbitron, Inc. 325 4<br />
* Buffalo Wild Wings, Inc. 8,150 209<br />
* The Cheesecake Factory,<br />
Inc. 400 4<br />
Cracker Barrel Old Country<br />
Store, Inc. 175 4<br />
* Exide Technologies 800 4<br />
* Fossil, Inc. 250 4<br />
* J. Crew Group, Inc. 325 4<br />
* Jack in the Box, Inc. 149,000 3,292<br />
* Jos. A. Bank Clothiers, Inc. 150 4<br />
* Life Time Fitness, Inc. 325 4<br />
* LKQ Corp. 32,100 374<br />
* Lumber Liquidators, Inc. 18,350 194<br />
The Men's Wearhouse, Inc. 275 4<br />
* New Oriental Education &<br />
Technology Group, Inc.,<br />
ADR 10,000 549<br />
PetSmart, Inc. 12,350 228<br />
Polaris Industries, Inc. 150 4<br />
* Retail Ventures, Inc. 1,225 4<br />
Sinclair Broadcast Group,<br />
Inc. - Class A 1,275 4<br />
* Skechers U.S.A., Inc. - Class<br />
A 325 4<br />
Snap-on, Inc. 3,550 140<br />
Sotheby's 450 4<br />
Tempur-Pedic International,<br />
Inc. 675 5<br />
* True Religion Apparel, Inc. 11,325 141<br />
Tupperware Brands Corp. 175 4<br />
* The Warnaco Group, Inc. 200 4<br />
* Zumiez, Inc. 17,900 133<br />
Total 5,764<br />
Consumer Staples (0.1%)<br />
* AgFeed Industries, Inc. 1,750 3<br />
Alberto-Culver Co. 12,700 311<br />
* Central European<br />
Distribution Corp. 6,800 134<br />
* Darling International, Inc. 750 4<br />
Flowers Foods, Inc. 13,900 339<br />
* TreeHouse Foods, Inc. 5,850 159<br />
Total 950<br />
Domestic Common Stocks and<br />
Warrants (27.5%)<br />
Energy (0.1%)<br />
Shares/<br />
$ Par<br />
Value<br />
$ (000's)<br />
*Arena Resources, Inc. 10,800 303<br />
*ATP Oil & Gas Corp. 575 3<br />
Berry Petroleum Co. 500 4<br />
*Bill Barrett Corp. 200 4<br />
*Carrizo Oil & Gas, Inc. 9,250 149<br />
*Contango Oil & Gas Co. 4,300 242<br />
Crosstex Energy, Inc. 1,500 6<br />
*Dril-Quip, Inc. 225 5<br />
Energy XXI, Ltd. 5,500 4<br />
*EXCO Resources, Inc. 18,000 163<br />
*Gasco Energy, Inc. 5,500 2<br />
General Maritime Corp. 350 4<br />
*IHS, Inc. - Class A 4,450 167<br />
*ION Geophysical Corp. 34,475 118<br />
*McMoRan Exploration Co. 375 4<br />
*Oceaneering International,<br />
Inc. 5,100 149<br />
*Parker Drilling Co. 1,350 4<br />
Penn Virginia Corp. 150 4<br />
*PetroQuest Energy, Inc. 650 4<br />
Ship Finance International,<br />
Ltd. 350 4<br />
*Stone Energy Corp. 400 4<br />
*T-3 Energy Services, Inc. 9,186 87<br />
*Whiting Petroleum Corp. 7,500 251<br />
*Willbros Group, Inc. 475 4<br />
Total 1,689<br />
Financials (0.2%)<br />
Boston Private Financial<br />
Holdings, Inc. 46,900 321<br />
Digital Realty Trust, Inc. 9,400 309<br />
*Encore Bancshares, Inc. 4,819 53<br />
*FCStone Group, Inc. 800 4<br />
GFI Group, Inc. 1,200 4<br />
*Investment Technology<br />
Group, Inc. 104,200 2,367<br />
*KBW, Inc. 8,400 193<br />
MFA Mortgage Investments,<br />
Inc. 69,900 412<br />
optionsXpress Holdings, Inc. 325 4<br />
*Portfolio Recovery<br />
Associates, Inc. 2,450 83<br />
Total 3,750<br />
Health Care (0.5%)<br />
*Affymetrix, Inc. 1,475 4<br />
*Alkermes, Inc. 400 4<br />
*athenahealth, Inc. 9,150 344<br />
*BioMarin Pharmaceutical,<br />
Inc. 21,200 377<br />
*CardioNet, Inc. 9,400 232<br />
*Genoptix, Inc. 14,755 503<br />
*Illumina, Inc. 16,800 438<br />
*IPC The Hospitalist Co. 7,600 128<br />
*K-V Pharmaceutical Co. -<br />
Class A 750 2<br />
*Masimo Corp. 24,667 736<br />
The Accompanying Notes are an Integral Part of the Financial Statements.<br />
148 Balanced Portfolio
Balanced Portfolio<br />
Domestic Common Stocks and<br />
Warrants (27.5%)<br />
Shares/<br />
$ Par<br />
Value<br />
$ (000's)<br />
Health Care continued<br />
Meridian Bioscience, Inc. 14,250 363<br />
* NuVasive, Inc. 8,150 282<br />
* PAREXEL International<br />
Corp. 450 4<br />
* Phase Forward, Inc. 18,814 236<br />
* Psychiatric Solutions, Inc. 205,100 5,712<br />
* Thoratec Corp. 10,438 339<br />
* United Therapeutics Corp. 1,450 91<br />
Total 9,795<br />
Industrials (0.4%)<br />
* AAR Corp. 225 4<br />
Actuant Corp. 250 5<br />
Acuity Brands, Inc. 125 4<br />
* Aerovironment, Inc. 5,950 219<br />
* Allegiant Travel Co. 2,500 121<br />
* Astec Industries, Inc. 3,950 124<br />
* Astronics Corp. 26,143 233<br />
* Axsys Technologies, Inc. 2,798 153<br />
Belden, Inc. 200 4<br />
Bucyrus International, Inc. 7,330 136<br />
* Chart Industries, Inc. 350 4<br />
* Cornell Cos., Inc. 22,800 424<br />
Deluxe Corp. 250 4<br />
Eagle Bulk Shipping, Inc. 525 4<br />
* EMCOR Group, Inc. 200 4<br />
* Energy Recovery, Inc. 8,197 62<br />
* EnerSys 400 4<br />
* Flow International Corp. 1,950 5<br />
* Force Protection, Inc. 800 5<br />
Genco Shipping & Trading,<br />
Ltd. 275 4<br />
* GrafTech International, Ltd. 525 4<br />
* Hawaiian Holdings, Inc. 775 5<br />
Herman Miller, Inc. 300 4<br />
* Hexcel Corp. 475 4<br />
* Hill International, Inc. 11,900 84<br />
* Hub Group, Inc. - Class A 11,800 313<br />
* Huron Consulting Group,<br />
Inc. 6,937 397<br />
* ICF International, Inc. 13,800 339<br />
Kaydon Corp. 6,100 210<br />
Knight Transportation, Inc. 191,409 3,086<br />
Knoll, Inc. 450 4<br />
* Korn/Ferry International 350 4<br />
* Perini Corp. 175 4<br />
* Stanley, Inc. 12,950 469<br />
* TBS International, Ltd. -<br />
Class A 425 4<br />
* Team, Inc. 24,956 691<br />
* Titan Machinery, Inc. 16,400 231<br />
* TransDigm Group, Inc. 10,500 352<br />
Total 7,728<br />
Information Technology (0.4%)<br />
* Advanced Energy Industries,<br />
Inc. 25,278 251<br />
* Amkor Technology, Inc. 1,950 4<br />
Domestic Common Stocks and<br />
Warrants (27.5%)<br />
Shares/<br />
$ Par<br />
Value<br />
$ (000's)<br />
Information Technology continued<br />
*Atheros Communications,<br />
Inc. 13,200 189<br />
*Bankrate, Inc. 11,819 449<br />
*Blackboard, Inc. 5,250 138<br />
*comScore, Inc. 13,973 178<br />
*Comtech<br />
Telecommunications Corp. 3,000 137<br />
*Concur Technologies, Inc. 8,300 272<br />
*CyberSource Corp. 14,600 175<br />
*DG Fastchannel, Inc. 20,200 252<br />
*Diodes, Inc. 30,850 187<br />
*EarthLink, Inc. 600 4<br />
*F5 Networks, Inc. 13,300 304<br />
*Harmonic, Inc. 675 4<br />
*Infinera Corp. 450 4<br />
*j2 Global Communications,<br />
Inc. 6,500 130<br />
*Mellanox Technologies, Ltd. 22,500 177<br />
*Netlogic Microsystems, Inc. 16,800 370<br />
*NeuStar, Inc. - Class A 137,300 2,627<br />
*Novatel Wireless, Inc. 975 5<br />
*Omniture, Inc. 28,450 303<br />
*OmniVision Technologies,<br />
Inc. 800 4<br />
*PMC-Sierra, Inc. 850 4<br />
*Rubicon Technology, Inc. 16,165 69<br />
*Sigma Designs, Inc. 400 4<br />
*Skyworks Solutions, Inc. 725 4<br />
*Switch and Data Facilities<br />
Co., Inc. 42,900 317<br />
*Synchronoss Technologies,<br />
Inc. 34,800 371<br />
*Take-Two Interactive<br />
Software, Inc. 475 4<br />
*TeleTech Holdings, Inc. 450 4<br />
*TiVo, Inc. 600 4<br />
*TriQuint Semiconductor, Inc. 93,000 320<br />
*VanceInfo Technologies,<br />
Inc., ADR 69,470 330<br />
*VistaPrint, Ltd. 23,700 441<br />
*Vocus, Inc. 14,600 266<br />
Total 8,302<br />
Materials (0.0%)<br />
*Apex Silver Mines, Ltd. 2,950 3<br />
*Calgon Carbon Corp. 22,100 339<br />
*Flotek Industries, Inc. 1,725 4<br />
Silgan Holdings, Inc. 8,300 397<br />
*W.R. Grace & Co. 700 4<br />
Worthington Industries, Inc. 325 4<br />
Total 751<br />
Other Holdings (0.1%)<br />
Financial Select Sector<br />
SPDR Fund 20,450 258<br />
iShares Nasdaq<br />
Biotechnology Index Fund 4,550 324<br />
SPDR Metals & Mining 40,600 1,128<br />
Total 1,710<br />
The Accompanying Notes are an Integral Part of the Financial Statements.<br />
Balanced Portfolio 149
Balanced Portfolio<br />
Domestic Common Stocks and<br />
Warrants (27.5%)<br />
Telecommunication Services (0.0%)<br />
Shares/<br />
$ Par<br />
Value<br />
$ (000's)<br />
* Centennial Communications<br />
Corp. 32,200 260<br />
Total 260<br />
Utilities (0.0%)<br />
ITC Holdings Corp. 14,800 646<br />
Total 646<br />
Total Small Cap Common Stocks 41,345<br />
Total Domestic Common Stocks and Warrants<br />
(Cost: $729,669) 547,878<br />
Foreign Common Stocks<br />
(7.4%) Country<br />
Consumer Discretionary (0.4%)<br />
Bridgestone Corp. Japan 11,600 174<br />
Compass Group PLC United<br />
Kingdom 210,110 1,058<br />
Denso Corp. Japan 12,100 201<br />
Fast Retailing Co., Ltd. Japan 600 87<br />
Grupo Televisa SA, ADR Mexico 77,000 1,150<br />
Hennes & Mauritz AB - B<br />
Shares Sweden 23,359 922<br />
Honda Motor Co., Ltd. Japan 18,300 397<br />
Kingfisher PLC<br />
United<br />
Kingdom 244,160 485<br />
Next PLC<br />
United<br />
Kingdom 21,445 341<br />
Oriental Land Co., Ltd. Japan 1,900 156<br />
Panasonic Corp. Japan 24,000 300<br />
Reed Elsevier PLC United<br />
Kingdom 32,460 240<br />
Sekisui House, Ltd. Japan 13,000 114<br />
Toyota Industries Corp. Japan 7,500 161<br />
Vivendi France 48,340 1,582<br />
Yamada Denki Co., Ltd. Japan 2,020 140<br />
Yamaha Motor Co., Ltd. Japan 14,400 151<br />
Total 7,659<br />
Consumer Staples (0.8%)<br />
Aeon Co., Ltd. Japan 16,300 163<br />
Ajinomoto Co., Inc. Japan 13,000 141<br />
Asahi Breweries, Ltd. Japan 8,100 139<br />
British American Tobacco<br />
PLC<br />
United<br />
Kingdom 27,934 737<br />
Cadbury PLC<br />
United<br />
Kingdom 29,100 259<br />
Imperial Tobacco Group<br />
PLC<br />
United<br />
Kingdom 26,062 707<br />
ITC, Ltd. India 91,656 326<br />
Japan Tobacco, Inc. Japan 59 195<br />
Kao Corp. Japan 7,000 212<br />
Kerry Group PLC - Class A Ireland 36,269 665<br />
Kirin Holdings Co., Ltd. Japan 15,000 198<br />
Foreign Common Stocks<br />
(7.4%) Country<br />
Shares/<br />
$ Par<br />
Value<br />
$ (000's)<br />
Consumer Staples continued<br />
Koninklijke Ahold NV Netherlands 44,140 545<br />
*KT&G Corp. South Korea 9,961 621<br />
Lawson, Inc. Japan 2,400 138<br />
Nestle SA Switzerland 76,205 2,995<br />
Pernod-Ricard SA France 10,444 778<br />
Reckitt Benckiser Group<br />
PLC<br />
United<br />
Kingdom 18,490 699<br />
Seven & I Holdings Co., Ltd. Japan 8,900 305<br />
Shiseido Co., Ltd. Japan 10,000 204<br />
Shoppers Drug Mart Corp. Canada 36,565 1,444<br />
Tesco PLC<br />
United<br />
Kingdom 125,405 663<br />
Unilever NV Netherlands 61,460 1,496<br />
UNY Co., Ltd. Japan 14,000 154<br />
Wal-Mart de Mexico SAB<br />
de CV Mexico 286,200 772<br />
Woolworths, Ltd. Australia 64,505 1,228<br />
Total 15,784<br />
Energy (0.8%)<br />
*Artumas Group, Inc. Norway 92,300 38<br />
BG Group PLC<br />
United<br />
Kingdom 20,225 285<br />
BP PLC<br />
United<br />
Kingdom 341,935 2,659<br />
CNOOC, Ltd. Hong Kong 1,078,000 1,024<br />
Eni SPA Italy 93,000 2,215<br />
INPEX Corp. Japan 22 174<br />
Nexen, Inc. Canada 81,700 1,440<br />
Oil Search, Ltd. Australia 185,275 618<br />
Petroleo Brasileiro SA, ADR Brazil 56,400 1,381<br />
Reliance Industries, Ltd. India 35,446 905<br />
Royal Dutch Shell PLC -<br />
Class A<br />
United<br />
Kingdom 94,230 2,500<br />
Saipem SPA Italy 60,295 1,018<br />
Seadrill, Ltd. Norway 27,100 222<br />
Suncor Energy, Inc. Canada 42,435 827<br />
Total 15,306<br />
Financials (1.4%)<br />
Allianz SE Germany 5,382 580<br />
AXA SA France 29,053 651<br />
Banco Espirito Santo SA Portugal 61,655 582<br />
Banco Santander SA Spain 167,950 1,629<br />
The Bank of Yokohama, Ltd. Japan 24,000 142<br />
BNP Paribas France 27,980 1,187<br />
Cathay Financial Holding<br />
Co., Ltd. Taiwan 435,150 489<br />
Cheung Kong Holdings, Ltd. Hong Kong 40,000 381<br />
China Life Insurance Co.,<br />
Ltd. China 202,000 622<br />
China Overseas Land &<br />
Investment, Ltd. Hong Kong 290,000 408<br />
(n)*China Overseas Land &<br />
Investment, Ltd. - Rights Hong Kong 11,600 4<br />
The Chugoku Bank, Ltd. Japan 8,000 123<br />
Credit Suisse Group AG Switzerland 26,150 715<br />
Daito Trust Construction<br />
Co., Ltd. Japan 1,500 78<br />
The Accompanying Notes are an Integral Part of the Financial Statements.<br />
150 Balanced Portfolio
Balanced Portfolio<br />
Foreign Common Stocks<br />
(7.4%) Country<br />
Shares/<br />
$ Par<br />
Value<br />
$ (000's)<br />
Financials continued<br />
Erste Group Bank AG Austria 17,900 422<br />
Hang Seng Bank, Ltd. Hong Kong 51,100 675<br />
Housing Development<br />
Finance Corp., Ltd. India 34,146 1,067<br />
HSBC Holdings PLC, ADR United<br />
Kingdom 36,400 1,772<br />
Industrial and Commercial<br />
Bank of China, Ltd. -<br />
Class H China 2,111,000 1,122<br />
Intesa Sanpaolo SPA Italy 222,495 805<br />
Julius Baer Holding AG Switzerland 28,600 1,097<br />
Man Group PLC<br />
United<br />
Kingdom 72,880 255<br />
Manulife Financial Corp. Canada 60,555 1,031<br />
Mitsubishi Estate Co., Ltd. Japan 13,000 214<br />
Mitsubishi UFJ Financial<br />
Group, Inc. Japan 102,500 635<br />
Mitsui Fudosan Co., Ltd. Japan 11,000 183<br />
Mizuho Financial Group,<br />
Inc. Japan 131 390<br />
Muenchener<br />
Rueckversicherungs-<br />
Gesellschaft AG Germany 3,261 515<br />
National Bank of Greece SA Greece 19,655 366<br />
Nomura Real Estate<br />
Holdings, Inc. Japan 6,000 120<br />
Piraeus Bank SA Greece 34,957 316<br />
* QBE Insurance Group, Ltd. Australia 32,030 594<br />
Resona Holdings, Inc. Japan 74 117<br />
Samsung Fire & Marine<br />
Insurance Co., Ltd. South Korea 8,839 1,341<br />
Societe Generale France 9,185 468<br />
Sompo Japan Insurance, Inc. Japan 18,000 132<br />
Sony Financial Holdings,<br />
Inc. Japan 59 226<br />
Standard Chartered PLC United<br />
Kingdom 24,165 314<br />
Sumitomo Mitsui Financial<br />
Group, Inc. Japan 94 407<br />
The Sumitomo Trust and<br />
Banking Co., Ltd. Japan 26,000 154<br />
T&D Holdings, Inc. Japan 4,300 180<br />
TAG Tegernsee Immobilien<br />
und Beteiligungs AG Germany 63,416 180<br />
Tokio Marine Holdings, Inc. Japan 8,900 261<br />
The Toronto-Dominion Bank Canada 40,205 1,436<br />
* Turkiye Garanti Bankasi AS Turkey 169,988 291<br />
Unicredit SPA Italy 254,675 637<br />
Westpac Banking Corp. Australia 87,315 1,061<br />
Zurich Financial Services<br />
AG Switzerland 9,919 2,147<br />
Total 28,522<br />
Health Care (1.0%)<br />
* Actelion, Ltd. Switzerland 7,130 400<br />
Astellas Pharma, Inc. Japan 5,700 232<br />
CSL, Ltd. Australia 64,752 1,560<br />
Daiichi Sankyo Co., Ltd. Japan 9,300 221<br />
Eisai Co., Ltd. Japan 4,600 190<br />
Foreign Common Stocks<br />
(7.4%) Country<br />
Shares/<br />
$ Par<br />
Value<br />
$ (000's)<br />
Health Care continued<br />
Fresenius Medical Care AG<br />
& Co. KGaA Germany 23,846 1,124<br />
Hisamitsu Pharmaceutical<br />
Co., Inc. Japan 2,800 114<br />
Novartis AG Switzerland 54,135 2,705<br />
Novo Nordisk A/S Denmark 13,444 688<br />
Roche Holding AG Switzerland 18,310 2,811<br />
Synthes, Inc. Switzerland 6,070 765<br />
Taisho Pharmaceutical Co.,<br />
Ltd. Japan 6,000 127<br />
Takeda Pharmaceutical Co.,<br />
Ltd. Japan 7,900 409<br />
Terumo Corp. Japan 2,500 117<br />
Teva Pharmaceutical<br />
Industries, Ltd., ADR Israel 169,180 7,202<br />
Total 18,665<br />
Industrials (0.7%)<br />
ABB, Ltd., ADR Switzerland 55,790 837<br />
All Nippon Airways Co.,<br />
Ltd. Japan 22,000 87<br />
Alstom SA France 16,125 957<br />
Asahi Glass Co., Ltd. Japan 30,000 170<br />
*BAE Systems PLC United<br />
Kingdom 334,445 1,850<br />
Balfour Beatty PLC United<br />
Kingdom 60,525 293<br />
Central Japan Railway Co. Japan 23 199<br />
Chemring Group PLC United<br />
Kingdom 27,930 798<br />
*China Railway Construction<br />
Corp. - Class H China 398,000 597<br />
ComfortDelGro Corp., Ltd. Singapore 286,000 291<br />
Companhia de Concessoes<br />
Rodoviarias Brazil 45,400 468<br />
Dai Nippon Printing Co.,<br />
Ltd. Japan 14,000 154<br />
East Japan Railway Co. Japan 46 359<br />
Fanuc, Ltd. Japan 2,900 206<br />
IHI Corp. Japan 97,000 123<br />
Itochu Corp. Japan 33,000 166<br />
The Japan Steel Works, Ltd. Japan 8,000 112<br />
JTEKT Corp. Japan 22,200 171<br />
Kamigumi Co., Ltd. Japan 13,000 116<br />
Keio Corp. Japan 29,000 174<br />
Kintetsu Corp. Japan 41,000 188<br />
Komatsu, Ltd. Japan 17,800 225<br />
*LG Corp. South Korea 19,884 693<br />
Marubeni Corp. Japan 48,000 183<br />
Mitsubishi Corp. Japan 17,000 239<br />
Mitsubishi Electric Corp. Japan 30,000 188<br />
Mitsubishi Heavy Industries,<br />
Ltd. Japan 46,000 205<br />
Mitsui & Co., Ltd. Japan 25,000 256<br />
Mitsui OSK Lines, Ltd. Japan 25,000 153<br />
*Morphic Technologies AB Sweden 353,158 60<br />
Nippon Yusen Kabushiki<br />
Kaisha Japan 25,000 154<br />
Secom Co., Ltd. Japan 5,100 263<br />
The Accompanying Notes are an Integral Part of the Financial Statements.<br />
Balanced Portfolio 151
Balanced Portfolio<br />
Foreign Common Stocks<br />
(7.4%) Country<br />
Industrials continued<br />
Serco Group PLC<br />
Shares/<br />
$ Par<br />
Value<br />
$ (000's)<br />
United<br />
Kingdom 122,660 810<br />
SMC Corp. Japan 1,400 143<br />
Sumitomo Corp. Japan 17,100 151<br />
Tokyu Corp. Japan 30,000 151<br />
Toppan Printing Co., Ltd. Japan 17,000 131<br />
Vinci SA France 14,130 598<br />
West Japan Railway Co. Japan 37 168<br />
Yamato Holdings Co., Ltd. Japan 10,000 130<br />
Total 13,217<br />
Information Technology (0.3%)<br />
* Autonomy Corp. PLC United<br />
Kingdom 115,910 1,619<br />
Canon, Inc. Japan 12,400 389<br />
EVS Broadcast Equipment<br />
SA Belgium 10,070 361<br />
Fujitsu, Ltd. Japan 41,000 198<br />
* Gresham Computing PLC United<br />
Kingdom 203,462 109<br />
Hitachi, Ltd. Japan 49,000 190<br />
Hoya Corp. Japan 13,000 226<br />
Kontron AG Germany 49,650 517<br />
NEC Corp. Japan 60,000 201<br />
Nintendo Co., Ltd. Japan 1,000 384<br />
Ricoh Co., Ltd. Japan 13,000 165<br />
Samsung Electronics Co.,<br />
Ltd. South Korea 2,619 948<br />
* Temenos Group AG Switzerland 95,145 1,266<br />
Total 6,573<br />
Materials (0.7%)<br />
Angang Steel Co., Ltd. China 534,000 604<br />
Anglo American PLC United<br />
Kingdom 27,574 639<br />
* Anhui Conch Cement Co.,<br />
Ltd. China 108,000 502<br />
Asahi Kasei Corp. Japan 49,000 215<br />
BHP Billiton, Ltd. Australia 59,145 1,271<br />
Companhia Vale do Rio<br />
Doce, ADR Brazil 56,650 686<br />
Givaudan SA Switzerland 390 306<br />
Goldcorp, Inc. Canada 55,170 1,740<br />
Huabao International<br />
Holdings, Ltd. Hong Kong 960,000 631<br />
* Intex Resources ASA Norway 404,600 77<br />
JFE Holdings, Inc. Japan 7,200 190<br />
K+S AG Germany 20,535 1,185<br />
Mitsubishi Chemical<br />
Holdings Corp. Japan 31,500 139<br />
Mitsubishi Materials Corp. Japan 54,000 136<br />
Nippon Steel Corp. Japan 69,000 226<br />
POSCO South Korea 1,338 394<br />
Potash Corp. of<br />
Saskatchewan, Inc. Canada 15,545 1,138<br />
Rio Tinto PLC, ADR United<br />
Kingdom 3,565 317<br />
Shin-Etsu Chemical Co.,<br />
Ltd. Japan 5,100 234<br />
Foreign Common Stocks<br />
(7.4%) Country<br />
Shares/<br />
$ Par<br />
Value<br />
$ (000's)<br />
Materials continued<br />
Sumitomo Metal Industries,<br />
Ltd. Japan 55,000 136<br />
Syngenta AG Switzerland 5,997 1,159<br />
Total 11,925<br />
Other Holdings (0.3%)<br />
Hang Seng Investment Index<br />
Funds Series - H-Share Hong Kong 73,600 764<br />
iShares MSCI EAFE Index<br />
Fund United States 30,900 1,387<br />
iShares MSCI Emerging<br />
Markets Index United States 8,625 215<br />
iShares MSCI Hong Kong<br />
Index Fund Hong Kong 145,929 1,513<br />
iShares MSCI Japan Index<br />
Fund Japan 27,928 268<br />
iShares MSCI Singapore<br />
Index Fund Singapore 162,857 1,151<br />
iShares MSCI South Korea<br />
Index Fund South Korea 26,114 728<br />
iShares MSCI Taiwan Index<br />
Fund Taiwan 156,458 1,188<br />
Total 7,214<br />
Telecommunication Services (0.6%)<br />
*Bharti Airtel, Ltd. India 22,813 338<br />
China Mobile, Ltd. Hong Kong 33,000 335<br />
Chunghwa Telecom Co.,<br />
Ltd. Taiwan 932,910 1,491<br />
Deutsche Telekom AG Germany 104,622 1,597<br />
France Telecom SA France 41,369 1,163<br />
KDDI Corp. Japan 33 235<br />
Koninklijke (Royal) KPN<br />
NV Netherlands 133,403 1,944<br />
Nippon Telegraph and<br />
Telephone Corp. Japan 60 322<br />
NTT DoCoMo, Inc. Japan 153 301<br />
SOFTBANK Corp. Japan 7,900 143<br />
Telefonica SA Spain 107,715 2,426<br />
Turkcell Iletisim Hizmetleri<br />
AS Turkey 79,056 456<br />
Vodafone Group PLC United<br />
Kingdom 810,864 1,657<br />
Total 12,408<br />
Utilities (0.4%)<br />
Centrica PLC<br />
United<br />
Kingdom 129,025 503<br />
CEZ<br />
Czech<br />
Republic 10,325 422<br />
Chubu Electric Power Co.,<br />
Inc. Japan 8,500 258<br />
The Chugoku Electric Power<br />
Co., Inc. Japan 6,500 171<br />
E.ON AG Germany 20,030 814<br />
Electricite de France France 10,045 587<br />
Enagas Spain 34,895 769<br />
GDF Suez France 44,310 2,205<br />
Hokuriku Electric Power Co. Japan 4,100 116<br />
The Accompanying Notes are an Integral Part of the Financial Statements.<br />
152 Balanced Portfolio
Balanced Portfolio<br />
Foreign Common Stocks<br />
(7.4%) Country<br />
Shares/<br />
$ Par<br />
Value<br />
$ (000's)<br />
Utilities continued<br />
The Kansai Electric Power<br />
Co., Inc. Japan 9,400 272<br />
Kyushu Electric Power Co.,<br />
Inc. Japan 7,200 191<br />
National Grid PLC United<br />
Kingdom 78,190 784<br />
Osaka Gas Co., Ltd. Japan 38,000 176<br />
PT Perusahaan Gas Negara Indonesia 2,110,000 382<br />
RWE AG Germany 10,415 941<br />
Shikoku Electric Power Co.,<br />
Inc. Japan 4,800 162<br />
Toho Gas Co., Ltd. Japan 19,000 125<br />
Tohoku Electric Power Co.,<br />
Inc. Japan 7,400 200<br />
The Tokyo Electric Power<br />
Co., Inc. Japan 12,300 410<br />
Tokyo Gas Co., Ltd. Japan 34,000 172<br />
Total 9,660<br />
Total Foreign Common Stocks<br />
(Cost: $208,489) 146,933<br />
Investment Grade Segment (13.3%)<br />
Aerospace/Defense (0.3%)<br />
BAE Systems Holdings, Inc.,<br />
5.20%, 8/15/15 144A 180,000 167<br />
General Dynamics Corp., 4.25%, 5/15/13 765,000 765<br />
Lockheed Martin Corp., 6.15%, 9/1/36 1,720,000 1,865<br />
Raytheon Co., 5.50%, 11/15/12 3,584,000 3,623<br />
Total 6,420<br />
Auto Manufacturing (0.1%)<br />
Daimler Finance North America LLC,<br />
5.75%, 5/18/09 2,590,000 2,514<br />
Daimler Finance North America LLC,<br />
8.50%, 1/18/31 315,000 230<br />
Total 2,744<br />
Banking (2.5%)<br />
American Express Bank, FSB,<br />
3.15%, 12/9/11 2,210,000 2,228<br />
BA Covered Bond Issuer,<br />
5.50%, 6/14/12 144A 2,105,000 2,168<br />
Bank of America Corp., 5.42%, 3/15/17 515,000 458<br />
Bank of America Corp., 5.65%, 5/1/18 2,655,000 2,671<br />
Bank of America Corp., 8.125%, 12/29/49 1,175,000 879<br />
The Bank of New York Mellon Corp.,<br />
4.95%, 11/1/12 310,000 315<br />
Bank One Corp., 5.25%, 1/30/13 4,480,000 4,369<br />
Barclays Bank PLC, 6.05%, 12/4/17 144A 210,000 185<br />
Barclays Bank PLC, 7.70%, 4/26/49 144A 480,000 317<br />
The Bear Stearns Companies LLC,<br />
7.25%, 2/1/18 480,000 526<br />
BNP Paribas, 7.195%, 6/29/49 144A 300,000 191<br />
Citigroup Capital XXI, 8.30%, 12/21/57 245,000 189<br />
Citigroup, Inc., 5.125%, 5/5/14 1,985,000 1,865<br />
Citigroup, Inc., 8.40%, 4/29/49 890,000 588<br />
Countrywide Financial Corp.,<br />
5.80%, 6/7/12 730,000 711<br />
Countrywide Home Loans, Inc.,<br />
4.00%, 3/22/11 1,155,000 1,100<br />
Shares/<br />
$ Par<br />
Value<br />
$ (000's)<br />
Investment Grade Segment (13.3%)<br />
Banking continued<br />
Countrywide Home Loans, Inc.,<br />
4.125%, 9/15/09 235,000 232<br />
Credit Agricole SA/London,<br />
6.637%, 5/31/49 144A 310,000 139<br />
Credit Suisse Guernsey, Ltd.,<br />
5.86%, 5/29/49 105,000 49<br />
Credit Suisse/New York NY,<br />
6.00%, 2/15/18 90,000 83<br />
Deutsche Bank Capital Funding Trust VII,<br />
5.628%, 1/19/49 144A 1,080,000 462<br />
Fifth Third Bancorp, 8.25%, 3/1/38 425,000 351<br />
The Goldman Sachs Group, Inc.,<br />
5.15%, 1/15/14 3,465,000 3,121<br />
HSBC Holdings PLC, 6.80%, 6/1/38 390,000 412<br />
HSBC USA, Inc., 3.125%, 12/16/11 2,200,000 2,285<br />
JPMorgan Chase & Co., 4.75%, 3/1/15 110,000 103<br />
JPMorgan Chase & Co., 7.90%, 4/29/49 1,675,000 1,393<br />
(d)Lehman Brothers Holdings, Inc.,<br />
5.50%, 4/4/16 490,000 47<br />
M&I Marshall & Ilsley Bank,<br />
5.15%, 2/22/12 2,480,000 2,242<br />
Mellon Bank NA, 5.45%, 4/1/16 1,390,000 1,358<br />
Merrill Lynch & Co., 6.22%, 9/15/26 375,000 346<br />
Merrill Lynch & Co., 6.40%, 8/28/17 2,185,000 2,189<br />
Morgan Stanley, 2.00%, 9/22/11 2,210,000 2,224<br />
Morgan Stanley, 5.375%, 10/15/15 700,000 603<br />
Morgan Stanley, 6.25%, 8/28/17 700,000 596<br />
Morgan Stanley, 6.25%, 8/9/26 830,000 675<br />
Northern Trust Corp., 5.30%, 8/29/11 795,000 810<br />
State Street Bank and Trust Co.,<br />
5.30%, 1/15/16 1,780,000 1,740<br />
SunTrust Bank, 3.00%, 11/16/11 2,210,000 2,285<br />
UBS AG/Stamford Branch, 5.75%, 4/25/18 920,000 835<br />
UBS Preferred Funding Trust V,<br />
6.243%, 5/29/49 200,000 109<br />
UnionBanCal Corp., 5.25%, 12/16/13 810,000 690<br />
Wachovia Bank NA, 6.60%, 1/15/38 515,000 559<br />
Wachovia Corp., 5.35%, 3/15/11 2,080,000 1,985<br />
Wachovia Corp., 7.98%, 2/28/49 570,000 486<br />
(d)(m) Washington <strong>Mutual</strong> Bank, 6.75%, 5/20/36 580,000 0<br />
(d)(m) Washington <strong>Mutual</strong> Bank, 6.875%, 6/15/11 1,115,000 0<br />
Wells Fargo Capital XIII, 7.70%, 12/29/49 2,150,000 1,774<br />
Zions Bancorporation, 5.50%, 11/16/15 2,290,000 1,619<br />
Total 50,562<br />
Beverage/Bottling (0.5%)<br />
Anheuser-Busch Companies, Inc.,<br />
4.50%, 4/1/18 40,000 34<br />
Anheuser-Busch Companies, Inc.,<br />
5.75%, 4/1/36 255,000 207<br />
Bottling Group LLC, 4.625%, 11/15/12 535,000 541<br />
Bottling Group LLC, 5.50%, 4/1/16 1,120,000 1,121<br />
The Coca-Cola Co., 5.35%, 11/15/17 985,000 1,063<br />
Diageo Capital PLC, 4.375%, 5/3/10 1,578,000 1,563<br />
Dr. Pepper Snapple Group, Inc.,<br />
6.82%, 5/1/18 144A 665,000 656<br />
Dr. Pepper Snapple Group, Inc.,<br />
7.45%, 5/1/38 144A 145,000 144<br />
PepsiCo, Inc., 4.65%, 2/15/13 540,000 555<br />
PepsiCo, Inc., 5.00%, 6/1/18 330,000 342<br />
PepsiCo, Inc., 7.90%, 11/1/18 85,000 104<br />
SABMiller PLC, 6.20%, 7/1/11 144A 2,595,000 2,570<br />
Total 8,900<br />
The Accompanying Notes are an Integral Part of the Financial Statements.<br />
Balanced Portfolio 153
Balanced Portfolio<br />
Shares/<br />
$ Par<br />
Value<br />
$ (000's)<br />
Investment Grade Segment (13.3%)<br />
Building Products (0.0%)<br />
CRH America, Inc., 6.00%, 9/30/16 810,000 504<br />
CRH America, Inc., 8.125%, 7/15/18 335,000 242<br />
Total 746<br />
Cable/Media/Broadcasting/Satellite<br />
(0.7%)<br />
CBS Corp., 6.625%, 5/15/11 460,000 408<br />
Comcast Corp., 5.90%, 3/15/16 2,270,000 2,167<br />
Comcast Corp., 6.40%, 5/15/38 740,000 738<br />
Comcast Corp., 6.50%, 11/15/35 190,000 189<br />
Cox Communications, Inc.,<br />
4.625%, 1/15/10 1,390,000 1,345<br />
Historic TW, Inc., 6.625%, 5/15/29 565,000 501<br />
Historic TW, Inc., 6.875%, 6/15/18 195,000 174<br />
Rogers Cable, Inc., 5.50%, 3/15/14 1,625,000 1,499<br />
Rogers Cable, Inc., 6.25%, 6/15/13 200,000 192<br />
TCI Communications, Inc., 8.75%, 8/1/15 1,030,000 1,096<br />
Time Warner Cable, Inc., 5.40%, 7/2/12 1,310,000 1,223<br />
Time Warner Cable, Inc., 6.75%, 7/1/18 170,000 164<br />
Time Warner Cable, Inc., 8.75%, 2/14/19 425,000 462<br />
Time Warner Entertainment Co. LP,<br />
8.375%, 3/15/23 1,650,000 1,662<br />
Viacom, Inc., 5.75%, 4/30/11 1,080,000 981<br />
Viacom, Inc., 6.125%, 10/5/17 185,000 153<br />
Total 12,954<br />
Conglomerate/Diversified Manufacturing<br />
(0.0%)<br />
The Dow Chemical Co., 5.70%, 5/15/18 45,000 40<br />
Monsanto Co., 5.125%, 4/15/18 135,000 142<br />
Total 182<br />
Consumer Products (0.1%)<br />
Colgate-Palmolive Co., 4.20%, 5/15/13 280,000 287<br />
Fortune Brands, Inc., 5.375%, 1/15/16 720,000 601<br />
The Procter & Gamble Co., 5.55%, 3/5/37 645,000 716<br />
Total 1,604<br />
Electric Utilities (2.8%)<br />
Bruce Mansfield Unit, 6.85%, 6/1/34 510,000 435<br />
Carolina Power & Light, Inc.,<br />
5.15%, 4/1/15 420,000 421<br />
Carolina Power & Light, Inc.,<br />
6.50%, 7/15/12 415,000 409<br />
CenterPoint Energy Houston Electric LLC,<br />
5.70%, 3/15/13 260,000 247<br />
CenterPoint Energy Houston Electric LLC,<br />
6.95%, 3/15/33 270,000 248<br />
CenterPoint Energy, Inc., 6.50%, 5/1/18 380,000 310<br />
CMS Energy Corp., 6.875%, 12/15/15 1,270,000 1,083<br />
Commonwealth Edison Co., 5.875%, 2/1/33 115,000 96<br />
Connecticut Light and Power Co.,<br />
5.65%, 5/1/18 150,000 149<br />
Consolidated Edison Co. of New York, Inc.,<br />
5.375%, 12/15/15 560,000 550<br />
Consolidated Edison Co. of New York, Inc.,<br />
5.50%, 9/15/16 605,000 599<br />
Consolidated Natural Gas Co.,<br />
5.00%, 12/1/14 2,050,000 1,882<br />
Dominion Resources, Inc., 6.00%, 11/30/17 40,000 38<br />
Dominion Resources, Inc., 6.40%, 6/15/18 160,000 157<br />
DTE Energy Co., 7.05%, 6/1/11 7,520,000 7,439<br />
Duke Energy Carolinas LLC,<br />
6.45%, 10/15/32 1,675,000 1,773<br />
Shares/<br />
$ Par<br />
Value<br />
$ (000's)<br />
Investment Grade Segment (13.3%)<br />
Electric Utilities continued<br />
Duquesne Light Holdings, Inc.,<br />
5.50%, 8/15/15 1,000,000 839<br />
Entergy Louisiana LLC, 6.50%, 9/1/18 360,000 342<br />
Entergy Mississippi, Inc., 6.25%, 4/1/34 1,030,000 872<br />
Exelon Generation Co. LLC,<br />
6.20%, 10/1/17 1,070,000 920<br />
Florida Power & Light Co., 5.625%, 4/1/34 245,000 260<br />
Florida Power Corp., 4.50%, 6/1/10 3,636,000 3,601<br />
Indiana Michigan Power Co.,<br />
5.05%, 11/15/14 2,660,000 2,396<br />
Kiowa Power Partners LLC,<br />
4.811%, 12/30/13 144A 1,061,731 993<br />
Kiowa Power Partners LLC,<br />
5.737%, 3/30/21 144A 1,185,000 907<br />
MidAmerican Energy Holdings Co.,<br />
5.95%, 5/15/37 260,000 236<br />
Monongahela Power Co.,<br />
5.70%, 3/15/17 144A 860,000 722<br />
Nevada Power Co., 5.875%, 1/15/15 1,941,000 1,858<br />
Nevada Power Co., 5.95%, 3/15/16 60,000 57<br />
Northern States Power Co., 5.25%, 10/1/18 270,000 269<br />
Ohio Edison Co., 6.875%, 7/15/36 145,000 132<br />
Oncor Electric Delivery Co.,<br />
6.375%, 1/15/15 1,340,000 1,284<br />
Oncor Electric Delivery Co., 7.00%, 9/1/22 240,000 224<br />
Pacific Gas & Electric Co., 5.80%, 3/1/37 255,000 265<br />
Pacific Gas & Electric Co., 6.05%, 3/1/34 415,000 441<br />
PacifiCorp, 5.45%, 9/15/13 4,040,000 4,132<br />
Potomac Electric Power Co.,<br />
6.50%, 11/15/37 180,000 176<br />
PPL Electric Utilities Corp., 4.30%, 6/1/13 2,475,000 2,324<br />
PPL Electric Utilities Corp., 6.25%, 8/15/09 215,000 216<br />
PPL Energy Supply LLC, 6.00%, 12/15/36 425,000 275<br />
PPL Energy Supply LLC, 6.50%, 5/1/18 340,000 276<br />
Public Service Co. of Colorado,<br />
5.50%, 4/1/14 1,320,000 1,254<br />
Public Service Electric & Gas Co.,<br />
5.00%, 1/1/13 1,500,000 1,463<br />
Public Service Electric & Gas Co.,<br />
5.70%, 12/1/36 1,600,000 1,477<br />
Puget Sound Energy, Inc., 6.274%, 3/15/37 1,125,000 1,001<br />
San Diego Gas & Electric Co.,<br />
5.30%, 11/15/15 250,000 257<br />
San Diego Gas & Electric Co.,<br />
6.125%, 9/15/37 200,000 220<br />
SCANA Corp., 6.25%, 4/1/20 115,000 106<br />
Sierra Pacific Power Co., 6.75%, 7/1/37 525,000 468<br />
South Carolina Electric & Gas Co.,<br />
6.05%, 1/15/38 295,000 308<br />
Southern California Edison Co.,<br />
5.55%, 1/15/37 320,000 337<br />
Southern California Edison Co.,<br />
5.625%, 2/1/36 85,000 90<br />
Tampa Electric Co., 6.10%, 5/15/18 2,305,000 2,098<br />
Tampa Electric Co., 6.15%, 5/15/37 385,000 313<br />
Tampa Electric Co., 6.55%, 5/15/36 520,000 445<br />
The Toledo Edison Co., 6.15%, 5/15/37 1,265,000 1,017<br />
Union Electric Co., 6.40%, 6/15/17 180,000 164<br />
Union Electric Co., 6.70%, 2/1/19 180,000 164<br />
Virginia Electric and Power Co.,<br />
5.25%, 12/15/15 3,790,000 3,683<br />
Xcel Energy, Inc., 6.50%, 7/1/36 780,000 716<br />
Total 55,434<br />
The Accompanying Notes are an Integral Part of the Financial Statements.<br />
154 Balanced Portfolio
Balanced Portfolio<br />
Shares/<br />
$ Par<br />
Value<br />
$ (000's)<br />
Investment Grade Segment (13.3%)<br />
Food Processors (0.4%)<br />
General Mills, Inc., 5.70%, 2/15/17 970,000 975<br />
H.J. Heinz Co., 5.35%, 7/15/13 1,370,000 1,359<br />
Kellogg Co., 6.60%, 4/1/11 875,000 916<br />
Kraft Foods, Inc., 6.25%, 6/1/12 4,020,000 4,158<br />
Kraft Foods, Inc., 6.50%, 8/11/17 430,000 432<br />
Kraft Foods, Inc., 6.875%, 1/26/39 500,000 501<br />
Total 8,341<br />
Gaming/Lodging/Leisure (0.0%)<br />
Harrah's Operating Co., 5.75%, 10/1/17 590,000 91<br />
Total 91<br />
Gas Pipelines (0.1%)<br />
CenterPoint Energy Resources Corp.,<br />
6.125%, 11/1/17 140,000 118<br />
Kinder Morgan Energy Partners LP,<br />
6.50%, 2/1/37 280,000 214<br />
Kinder Morgan Energy Partners LP,<br />
7.30%, 8/15/33 1,520,000 1,262<br />
Rockies Express Pipeline LLC,<br />
6.85%, 7/15/18 144A 300,000 277<br />
Southern Natural Gas Co.,<br />
5.90%, 4/1/17 144A 200,000 158<br />
Tennessee Gas Pipeline Co., 7.50%, 4/1/17 200,000 176<br />
Total 2,205<br />
Health Care/Pharmaceuticals (0.2%)<br />
Bristol-Myers Squibb Co.,<br />
5.875%, 11/15/36 65,000 69<br />
Bristol-Myers Squibb Co., 6.125%, 5/1/38 470,000 516<br />
GlaxoSmithKline Capital, Inc.,<br />
5.65%, 5/15/18 570,000 599<br />
Wyeth, 5.50%, 2/1/14 1,060,000 1,077<br />
Wyeth, 5.95%, 4/1/37 685,000 760<br />
Total 3,021<br />
Independent Finance (0.7%)<br />
American General Finance Corp.,<br />
5.40%, 12/1/15 95,000 35<br />
American General Finance Corp.,<br />
6.90%, 12/15/17 470,000 203<br />
General Electric Capital Corp.,<br />
5.375%, 10/20/16 1,000,000 989<br />
General Electric Capital Corp.,<br />
5.625%, 5/1/18 4,365,000 4,397<br />
General Electric Capital Corp.,<br />
5.875%, 1/14/38 195,000 191<br />
General Motors Acceptance Corp. LLC,<br />
6.00%, 12/15/11 144A 1,351,000 1,093<br />
(n) General Motors Acceptance Corp. LLC,<br />
7.50%, 12/31/13 144A 238,000 174<br />
(n) General Motors Acceptance Corp. LLC,<br />
8.00%, 12/31/18 144A 286,000 143<br />
HSBC Finance Corp., 4.125%, 11/16/09 4,400,000 4,359<br />
International Lease Finance Corp.,<br />
4.75%, 1/13/12 2,190,000 1,531<br />
iStar Financial, Inc., 5.15%, 3/1/12 1,580,000 498<br />
iStar Financial, Inc., 8.625%, 6/1/13 565,000 175<br />
Total 13,788<br />
Industrials - Other (0.0%)<br />
Centex Corp., 7.875%, 2/1/11 335,000 296<br />
D.R. Horton, Inc., 5.375%, 6/15/12 540,000 398<br />
Shares/<br />
$ Par<br />
Value<br />
$ (000's)<br />
Investment Grade Segment (13.3%)<br />
Industrials - Other continued<br />
D.R. Horton, Inc., 7.875%, 8/15/11 160,000 138<br />
Total 832<br />
Information/Data Technology (0.1%)<br />
Fiserv, Inc., 6.125%, 11/20/12 1,075,000 1,010<br />
Fiserv, Inc., 6.80%, 11/20/17 1,075,000 952<br />
Seagate Technology HDD Holdings,<br />
6.80%, 10/1/16 715,000 372<br />
Total 2,334<br />
Life Insurance (0.0%)<br />
Prudential Financial, Inc., 5.70%, 12/14/36 170,000 106<br />
Total 106<br />
Machinery (0.1%)<br />
Case Corp., 7.25%, 1/15/16 2,085,000 1,449<br />
Total 1,449<br />
Metals/Mining (0.1%)<br />
Alcoa, Inc., 5.55%, 2/1/17 1,000,000 787<br />
Alcoa, Inc., 5.90%, 2/1/27 465,000 306<br />
Alcoa, Inc., 6.75%, 7/15/18 355,000 290<br />
Barrick North America Fiance LLC,<br />
6.80%, 9/15/18 370,000 331<br />
Freeport-McMoRan Copper & Gold, Inc.,<br />
8.25%, 4/1/15 195,000 166<br />
Rio Tinto Finance USA, Ltd.,<br />
6.50%, 7/15/18 365,000 268<br />
Total 2,148<br />
Natural Gas Distributors (0.1%)<br />
NiSource Finance Corp., 5.25%, 9/15/17 415,000 252<br />
NiSource Finance Corp., 5.40%, 7/15/14 785,000 537<br />
NiSource Finance Corp., 5.45%, 9/15/20 180,000 96<br />
NiSource Finance Corp., 6.40%, 3/15/18 210,000 131<br />
Total 1,016<br />
Oil & Gas Field Machines and Services<br />
(0.0%)<br />
Pride International, Inc., 7.375%, 7/15/14 805,000 749<br />
Total 749<br />
Oil and Gas (0.8%)<br />
Anadarko Finance Co., 7.50%, 5/1/31 930,000 822<br />
Apache Corp., 6.90%, 9/15/18 125,000 135<br />
Canadian Natural Resources, Ltd.,<br />
5.70%, 5/15/17 430,000 375<br />
Canadian Natural Resources, Ltd.,<br />
5.85%, 2/1/35 90,000 67<br />
Canadian Natural Resources, Ltd.,<br />
6.25%, 3/15/38 585,000 460<br />
Canadian Natural Resources, Ltd.,<br />
6.45%, 6/30/33 335,000 271<br />
Devon Energy Corp., 7.95%, 4/15/32 250,000 276<br />
Devon Financing Corp. ULC,<br />
6.875%, 9/30/11 3,040,000 3,068<br />
EnCana Corp., 6.50%, 2/1/38 340,000 273<br />
EnCana Corp., 6.625%, 8/15/37 70,000 56<br />
EnCana Holdings Finance Corp.,<br />
5.80%, 5/1/14 1,075,000 1,007<br />
Hess Corp., 7.125%, 3/15/33 355,000 316<br />
Marathon Oil Corp., 6.60%, 10/1/37 140,000 106<br />
Nexen, Inc., 5.875%, 3/10/35 1,855,000 1,397<br />
Nexen, Inc., 6.40%, 5/15/37 160,000 125<br />
The Accompanying Notes are an Integral Part of the Financial Statements.<br />
Balanced Portfolio 155
Balanced Portfolio<br />
Shares/<br />
$ Par<br />
Value<br />
$ (000's)<br />
Investment Grade Segment (13.3%)<br />
Oil and Gas continued<br />
Pemex Project Funding Master Trust,<br />
6.625%, 6/15/35 144A 245,000 207<br />
Petro-Canada, 5.95%, 5/15/35 820,000 564<br />
Pioneer Natural Resources Co.,<br />
6.875%, 5/1/18 1,840,000 1,287<br />
Suncor Energy, Inc., 6.50%, 6/15/38 415,000 314<br />
Suncor Energy, Inc., 6.85%, 6/1/39 265,000 211<br />
Sunoco, Inc., 5.75%, 1/15/17 825,000 686<br />
Talisman Energy, Inc., 5.85%, 2/1/37 910,000 633<br />
Tesoro Corp., 6.50%, 6/1/17 2,615,000 1,435<br />
Valero Energy Corp., 6.625%, 6/15/37 1,200,000 883<br />
XTO Energy, Inc., 5.30%, 6/30/15 260,000 237<br />
XTO Energy, Inc., 6.50%, 12/15/18 335,000 324<br />
XTO Energy, Inc., 6.75%, 8/1/37 290,000 271<br />
Total 15,806<br />
Other Finance (0.3%)<br />
Capmark Financial Group, Inc.,<br />
6.30%, 5/10/17 320,000 88<br />
Eaton Vance Corp., 6.50%, 10/2/17 100,000 89<br />
PNC Financial Services Group, Inc.,<br />
8.25%, 5/21/13 2,310,000 1,861<br />
SLM Corp., 5.375%, 1/15/13 80,000 59<br />
SLM Corp., 5.375%, 5/15/14 520,000 351<br />
SLM Corp., 5.45%, 4/25/11 4,560,000 3,599<br />
Total 6,047<br />
Other Services (0.1%)<br />
Waste Management, Inc., 5.00%, 3/15/14 855,000 734<br />
Waste Management, Inc., 6.10%, 3/15/18 925,000 800<br />
Total 1,534<br />
Paper and Forest Products (0.0%)<br />
International Paper Co., 7.95%, 6/15/18 390,000 308<br />
International Paper Co., 8.70%, 6/15/38 375,000 262<br />
Weyerhaeuser Co., 6.875%, 12/15/33 130,000 87<br />
Total 657<br />
Property and Casualty Insurance (0.0%)<br />
The Progressive Corp., 6.70%, 6/15/37 315,000 155<br />
Total 155<br />
Railroads (0.1%)<br />
Burlington Northern Santa Fe Corp.,<br />
6.15%, 5/1/37 175,000 161<br />
Canadian National Railway Co.,<br />
5.85%, 11/15/17 140,000 145<br />
Canadian Pacific Railway Co.,<br />
5.95%, 5/15/37 185,000 130<br />
CSX Corp., 5.60%, 5/1/17 985,000 875<br />
Union Pacific Corp., 5.65%, 5/1/17 625,000 600<br />
Union Pacific Corp., 5.75%, 11/15/17 315,000 299<br />
Union Pacific Corp., 6.65%, 1/15/11 390,000 389<br />
Total 2,599<br />
Real Estate Investment Trusts (0.7%)<br />
AvalonBay Communities, Inc.,<br />
5.50%, 1/15/12 500,000 400<br />
BRE Properties, Inc., 5.50%, 3/15/17 420,000 214<br />
Colonial Realty LP, 6.05%, 9/1/16 360,000 210<br />
Developers Diversified Realty Corp.,<br />
5.375%, 10/15/12 1,535,000 644<br />
Duke Realty LP, 5.95%, 2/15/17 835,000 417<br />
ERP Operating LP, 5.25%, 9/15/14 1,950,000 1,303<br />
ERP Operating LP, 5.75%, 6/15/17 515,000 355<br />
Shares/<br />
$ Par<br />
Value<br />
$ (000's)<br />
Investment Grade Segment (13.3%)<br />
Real Estate Investment Trusts continued<br />
First Industrial LP, 5.25%, 6/15/09 1,925,000 1,777<br />
HCP, Inc., 6.00%, 1/30/17 400,000 193<br />
HCP, Inc., 6.70%, 1/30/18 200,000 96<br />
HRPT Properties Trust, 5.75%, 11/1/15 1,225,000 652<br />
ProLogis, 5.50%, 3/1/13 2,000,000 1,160<br />
ProLogis, 5.75%, 4/1/16 1,190,000 593<br />
Rouse Co. LP/TRC Co-Issuer, Inc.,<br />
6.75%, 5/1/13 144A 3,640,000 1,310<br />
Simon Property Group LP, 5.375%, 6/1/11 3,555,000 3,004<br />
Simon Property Group LP, 5.60%, 9/1/11 890,000 744<br />
Simon Property Group LP, 6.10%, 5/1/16 1,560,000 997<br />
Total 14,069<br />
Restaurants (0.1%)<br />
Darden Restaurants, Inc., 6.20%, 10/15/17 140,000 104<br />
Darden Restaurants, Inc., 6.80%, 10/15/37 635,000 410<br />
Yum! Brands, Inc., 6.875%, 11/15/37 800,000 634<br />
Total 1,148<br />
Retail Food and Drug (0.2%)<br />
CVS/Caremark Corp., 4.875%, 9/15/14 985,000 909<br />
CVS/Caremark Corp., 6.125%, 8/15/16 445,000 431<br />
CVS/Caremark Corp., 6.25%, 6/1/27 715,000 665<br />
Delhaize Group, 6.50%, 6/15/17 770,000 699<br />
The Kroger Co., 6.15%, 1/15/20 395,000 390<br />
The Kroger Co., 7.00%, 5/1/18 245,000 256<br />
Total 3,350<br />
Retail Stores (0.5%)<br />
The Home Depot, Inc., 5.875%, 12/16/36 1,160,000 910<br />
J.C. Penney Corp., 5.75%, 2/15/18 130,000 86<br />
J.C. Penney Corp., 6.375%, 10/15/36 260,000 157<br />
J.C. Penney Corp., 6.875%, 10/15/15 515,000 410<br />
J.C. Penney Corp., 7.95%, 4/1/17 610,000 465<br />
Kohl's Corp., 6.25%, 12/15/17 720,000 577<br />
Kohl's Corp., 6.875%, 12/15/37 540,000 384<br />
Macy's Retail Holdings, Inc., 6.30%, 4/1/09 3,785,000 3,691<br />
Macy's Retail Holdings, Inc.,<br />
6.65%, 7/15/24 90,000 50<br />
Macy's Retail Holdings, Inc.,<br />
7.00%, 2/15/28 120,000 66<br />
Macy's Retail Holdings, Inc.,<br />
7.875%, 7/15/15 780,000 562<br />
Nordstrom, Inc., 7.00%, 1/15/38 265,000 157<br />
Target Corp., 5.375%, 5/1/17 595,000 541<br />
Target Corp., 6.50%, 10/15/37 735,000 631<br />
Wal-Mart Stores, Inc., 5.875%, 4/5/27 685,000 722<br />
Total 9,409<br />
Telecommunications (1.2%)<br />
AT&T Corp., 8.00%, 11/15/31 2,380,000 2,990<br />
AT&T Mobility LLC, 7.125%, 12/15/31 2,740,000 2,880<br />
British Telecommunications PLC,<br />
9.125%, 12/15/30 620,000 659<br />
Deutsche Telekom International Finance<br />
BV, 5.75%, 3/23/16 665,000 636<br />
Embarq Corp., 6.738%, 6/1/13 835,000 706<br />
Embarq Corp., 7.082%, 6/1/16 1,940,000 1,494<br />
Embarq Corp., 7.995%, 6/1/36 230,000 155<br />
France Telecom SA, 8.50%, 3/1/31 975,000 1,224<br />
Rogers Wireless, Inc., 6.375%, 3/1/14 875,000 832<br />
Sprint Capital Corp., 8.375%, 3/15/12 3,625,000 2,900<br />
Sprint Capital Corp., 8.75%, 3/15/32 470,000 317<br />
Telecom Italia Capital SA, 4.00%, 1/15/10 2,360,000 2,171<br />
The Accompanying Notes are an Integral Part of the Financial Statements.<br />
156 Balanced Portfolio
Balanced Portfolio<br />
Shares/<br />
$ Par<br />
Value<br />
$ (000's)<br />
Investment Grade Segment (13.3%)<br />
Telecommunications continued<br />
Telecom Italia Capital SA, 6.20%, 7/18/11 1,620,000 1,438<br />
Verizon Communications, Inc.,<br />
5.85%, 9/15/35 1,425,000 1,418<br />
Verizon Communications, Inc.,<br />
6.10%, 4/15/18 2,125,000 2,117<br />
Verizon Communications, Inc.,<br />
8.95%, 3/1/39 400,000 517<br />
Vodafone Group PLC, 5.50%, 6/15/11 1,980,000 1,973<br />
Total 24,427<br />
Tobacco (0.3%)<br />
Altria Group, Inc., 9.70%, 11/10/18 555,000 600<br />
Altria Group, Inc., 9.95%, 11/10/38 680,000 740<br />
Philip Morris International, Inc.,<br />
5.65%, 5/16/18 735,000 729<br />
Philip Morris International, Inc.,<br />
6.375%, 5/16/38 735,000 764<br />
Reynolds American, Inc., 6.75%, 6/15/17 215,000 171<br />
Reynolds American, Inc., 7.25%, 6/15/37 215,000 145<br />
Reynolds American, Inc., 7.625%, 6/1/16 2,175,000 1,811<br />
Total 4,960<br />
Vehicle Parts (0.1%)<br />
Johnson Controls, Inc., 5.25%, 1/15/11 1,390,000 1,277<br />
Johnson Controls, Inc., 5.50%, 1/15/16 845,000 655<br />
Johnson Controls, Inc., 6.00%, 1/15/36 520,000 329<br />
Total 2,261<br />
Yankee Sovereign (0.1%)<br />
Mexico Government International Bond,<br />
5.625%, 1/15/17 2,050,000 2,050<br />
Mexico Government International Bond,<br />
6.05%, 1/11/40 490,000 475<br />
Total 2,525<br />
Total Investment Grade Segment (Cost:<br />
$298,720) 264,573<br />
Governments (5.0%)<br />
Governments (5.0%)<br />
Federal Home Loan Mortgage Corp.,<br />
4.875%, 6/13/18 27,553,000 31,667<br />
Israel Government AID Bond,<br />
0.00%, 11/15/22 11,600,000 7,045<br />
Israel Government AID Bond,<br />
0.00%, 11/15/23 11,500,000 6,656<br />
Israel Government AID Bond,<br />
5.50%, 4/26/24 9,840,000 12,223<br />
(n) Overseas Private Investment,<br />
4.10%, 11/15/14 2,604,160 2,570<br />
(e) Tennesse Valley Authority Stripped,<br />
0.00%, 4/15/42 6,100,000 5,368<br />
US Department of Housing and Urban<br />
Development, 6.17%, 8/1/14 14,981,000 16,502<br />
(g) US Treasury, 2.00%, 11/30/13 1,000,000 1,026<br />
US Treasury, 3.75%, 11/15/18 85,000 96<br />
(g) US Treasury, 4.375%, 2/15/38 4,370,000 5,853<br />
US Treasury Inflation Index Bond,<br />
2.00%, 4/15/12 5,928,549 5,781<br />
Governments (5.0%)<br />
Shares/<br />
$ Par<br />
Value<br />
$ (000's)<br />
Governments continued<br />
US Treasury Inflation Index Bond,<br />
2.625%, 7/15/17 5,522,320 5,659<br />
Total Governments (Cost: $87,174) 100,446<br />
Municipal Bonds (0.1%)<br />
Municipal Bonds (0.1%)<br />
Indiana Finance Authority Environmental<br />
Facillities, Series 2006A,<br />
4.47%, 9/1/41 RB, AMBAC 2,835,000 2,835<br />
Total Municipal Bonds<br />
(Cost: $2,835) 2,835<br />
Structured Products (24.3%)<br />
Structured Products (24.3%)<br />
AEP Texas Central Transition Funding<br />
LLC, Series 2006-A, Class A5,<br />
5.306%, 7/1/21 22,665,000 20,240<br />
Asset Securitization Corp., Series 1997-D5,<br />
Class PS1,<br />
1.418%, 2/14/43 IO 51,118,153 1,432<br />
Banc of America Alternative Loan<br />
Trust, Series 2006-3, Class 1CB1,<br />
6.00%, 4/25/36 1,891,437 907<br />
Banc of America Alternative Loan<br />
Trust, Series 2006-4, Class 4CB1,<br />
6.50%, 5/25/46 2,250,904 1,099<br />
Banc of America Commercial Mortgage,<br />
Inc., Series 2007-3, Class A4,<br />
5.658%, 6/10/49 2,907,000 2,126<br />
Banc of America Commercial Mortgage,<br />
Inc., Series 2007-2, Class A4,<br />
5.688%, 4/10/49 11,274,000 8,565<br />
Banc of America Funding Corp., Series<br />
2007-1, Class TA1A,<br />
0.531%, 1/25/37 2,564,839 1,216<br />
Banc of America Funding Corp., Series<br />
2007-4, Class TA1A,<br />
0.561%, 5/25/37 3,495,777 3,037<br />
Banc of America Mortgage Securities,<br />
Inc., Series 2004-G, Class 2A6,<br />
4.648%, 8/25/34 5,332,000 5,122<br />
CenterPoint Energy Transition Bond Co.<br />
LLC,<br />
5.17%, 8/1/19 2,580,000 2,603<br />
Citigroup Commercial Mortgage<br />
Trust, Series 2007-C6, Class A4,<br />
5.70%, 12/10/49 6,462,000 4,871<br />
Citigroup Mortgage Loan Trust, Inc., Series<br />
2004-NCM2, Class 2CB1,<br />
5.50%, 8/25/34 852,820 746<br />
Citigroup Mortgage Loan Trust, Inc., Series<br />
2005-1, Class 3A1,<br />
6.50%, 4/25/35 1,325,933 1,271<br />
Countrywide Alternative Loan Trust, Series<br />
2003-J1, Class 1A8,<br />
5.25%, 10/25/33 1,070,235 855<br />
The Accompanying Notes are an Integral Part of the Financial Statements.<br />
Balanced Portfolio 157
Balanced Portfolio<br />
Structured Products (24.3%)<br />
Shares/<br />
$ Par<br />
Value<br />
$ (000's)<br />
Structured Products continued<br />
Countrywide Home Loan Mortgage Pass<br />
Through Trust, Series 2005-31, Class<br />
2A1,<br />
5.471%, 1/25/36 1,365,688 980<br />
Credit Suisse First Boston Mortgage<br />
Securities Corp., Series 2005-7, Class<br />
6A1,<br />
5.50%, 8/25/20 2,413,577 2,235<br />
(n) Credit Suisse Mortgage Capital<br />
Certificates, Series 2007-5, Class 3A9,<br />
6.00%, 8/25/37 2,074,558 1,411<br />
(n) Credit Suisse Mortgage Capital<br />
Certificates, Series 2007-5, Class 3A19,<br />
6.00%, 8/25/37 2,783,252 2,033<br />
(n) Criimi Mae Commercial Mortgage<br />
Trust, Series 1998-C1, Class B,<br />
7.00%, 6/2/33 144A 2,978,778 2,979<br />
DLJ Commercial Mortgage Corp., Series<br />
1998-CF1, Class S,<br />
0.728%, 2/18/31 IO 31,358,421 714<br />
DLJ Mortgage Acceptance Corp., Series<br />
1997-CF2, Class S,<br />
0.62%, 10/15/30 IO 144A 1,474,252 29<br />
Federal Home Loan Mortgage Corp.,<br />
4.00%, 10/1/20 1,924,267 1,945<br />
Federal Home Loan Mortgage Corp.,<br />
4.50%, 5/1/19 2,329,677 2,391<br />
Federal Home Loan Mortgage Corp., Series<br />
3065, Class TN,<br />
4.50%, 10/15/33 1,907,273 1,945<br />
Federal Home Loan Mortgage Corp., Series<br />
3248, Class LN,<br />
4.50%, 7/15/35 13,744,894 14,028<br />
Federal Home Loan Mortgage Corp.,<br />
5.00%, 10/1/19 1,405,620 1,448<br />
Federal Home Loan Mortgage Corp.,<br />
5.00%, 2/1/20 652,621 671<br />
Federal Home Loan Mortgage Corp.,<br />
5.00%, 5/1/20 2,554,815 2,630<br />
Federal Home Loan Mortgage Corp.,<br />
5.00%, 11/1/35 17,789,184 18,204<br />
Federal Home Loan Mortgage Corp.,<br />
5.00%, 12/1/35 17,723,182 18,137<br />
Federal Home Loan Mortgage Corp.,<br />
5.00%, 6/1/38 16,453,282 16,832<br />
Federal Home Loan Mortgage Corp.,<br />
5.50%, 9/1/19 934,307 965<br />
Federal Home Loan Mortgage Corp.,<br />
5.50%, 11/1/19 1,842,662 1,903<br />
Federal Home Loan Mortgage Corp.,<br />
5.50%, 12/1/19 345,026 356<br />
Federal Home Loan Mortgage Corp.,<br />
5.50%, 3/1/20 2,499,319 2,580<br />
Federal Home Loan Mortgage Corp.,<br />
5.50%, 6/1/35 3,834,667 3,930<br />
Structured Products (24.3%)<br />
Shares/<br />
$ Par<br />
Value<br />
$ (000's)<br />
Structured Products continued<br />
Federal Home Loan Mortgage Corp., Series<br />
K001, Class A2,<br />
5.651%, 4/25/16 7,523,644 7,846<br />
Federal Home Loan Mortgage Corp., Series<br />
2840, Class LK,<br />
6.00%, 11/15/17 3,159,644 3,271<br />
Federal Home Loan Mortgage Corp., Series<br />
2439, Class LH,<br />
6.00%, 4/15/32 2,125,000 2,189<br />
Federal Home Loan Mortgage Corp.,<br />
6.00%, 10/1/37 19,549,969 20,161<br />
Federal Home Loan Mortgage Corp.,<br />
6.50%, 4/1/11 278,865 290<br />
Federal National Mortgage Association,<br />
4.00%, 6/1/19 1,250,703 1,271<br />
Federal National Mortgage Association,<br />
4.50%, 6/1/19 8,923,333 9,156<br />
Federal National Mortgage Association,<br />
4.50%, 12/1/19 1,058,174 1,086<br />
Federal National Mortgage Association,<br />
5.00%, 3/1/20 3,155,731 3,250<br />
Federal National Mortgage Association,<br />
5.00%, 4/1/20 1,246,073 1,282<br />
Federal National Mortgage Association,<br />
5.00%, 5/1/20 4,829,454 4,971<br />
Federal National Mortgage Association,<br />
5.00%, 4/1/35 3,627,053 3,708<br />
Federal National Mortgage Association,<br />
5.00%, 7/1/35 4,804,664 4,912<br />
Federal National Mortgage Association,<br />
5.00%, 10/1/35 1,924,575 1,968<br />
Federal National Mortgage Association,<br />
5.32%, 4/1/14 2,634,229 2,738<br />
Federal National Mortgage Association,<br />
5.38%, 1/1/17 2,848,000 2,939<br />
Federal National Mortgage Association,<br />
5.50%, 4/1/21 2,198,051 2,268<br />
Federal National Mortgage Association,<br />
5.50%, 9/1/34 994,457 1,021<br />
Federal National Mortgage Association,<br />
5.50%, 3/1/35 8,349,754 8,569<br />
Federal National Mortgage Association,<br />
5.50%, 7/1/35 1,808,710 1,856<br />
Federal National Mortgage Association,<br />
5.50%, 8/1/35 3,191,816 3,276<br />
Federal National Mortgage Association,<br />
5.50%, 9/1/35 18,154,161 18,631<br />
Federal National Mortgage Association,<br />
5.50%, 10/1/35 8,367,936 8,588<br />
Federal National Mortgage Association,<br />
5.50%, 11/1/35 19,635,363 20,152<br />
Federal National Mortgage Association,<br />
5.50%, 2/1/38 36,345,063 37,296<br />
Federal National Mortgage Association,<br />
6.00%, 5/1/35 403,122 416<br />
The Accompanying Notes are an Integral Part of the Financial Statements.<br />
158 Balanced Portfolio
Balanced Portfolio<br />
Structured Products (24.3%)<br />
Shares/<br />
$ Par<br />
Value<br />
$ (000's)<br />
Structured Products continued<br />
Federal National Mortgage Association,<br />
6.00%, 6/1/35 1,087,653 1,121<br />
Federal National Mortgage Association,<br />
6.00%, 7/1/35 6,826,762 7,038<br />
Federal National Mortgage Association,<br />
6.00%, 10/1/35 1,625,650 1,676<br />
Federal National Mortgage Association,<br />
6.00%, 11/1/35 7,408,981 7,637<br />
Federal National Mortgage Association,<br />
6.00%, 9/1/36 3,636,408 3,748<br />
Federal National Mortgage Association,<br />
6.00%, 1/1/38 6,664,892 6,868<br />
Federal National Mortgage Association,<br />
6.00%, 3/1/38 1,721,635 1,774<br />
Federal National Mortgage Association,<br />
6.00%, 6/1/38 10,384,699 10,702<br />
Federal National Mortgage<br />
Association, Series 2002-W4, Class A4,<br />
6.25%, 5/25/42 6,527,883 6,681<br />
Federal National Mortgage Association,<br />
6.50%, 9/1/37 7,702,846 8,009<br />
Federal National Mortgage Association,<br />
6.50%, 9/1/38 15,937,080 16,570<br />
Federal National Mortgage<br />
Association, Series 1989-20, Class A,<br />
6.75%, 4/25/18 1,937,101 2,029<br />
Federal National Mortgage Association<br />
Aces, Series 2006-M1, Class C,<br />
5.355%, 2/25/16 10,762,000 11,180<br />
(n) Final Maturity Amortizing Notes, Series<br />
2004-1, Class 1,<br />
4.45%, 8/25/12 7,446,995 7,492<br />
First Horizon Alternative Mortgage<br />
Securities, Series 2004-FA1, Class 1A1,<br />
6.25%, 10/25/34 3,516,053 2,983<br />
First Union National Bank Commercial<br />
Mortgage Trust, Series 1999-C4, Class E,<br />
7.939%, 12/15/31 144A 3,100,000 2,928<br />
Government National Mortgage<br />
Association,<br />
5.00%, 7/15/33 1,954,109 2,012<br />
Government National Mortgage<br />
Association,<br />
5.50%, 1/15/32 172,050 178<br />
Government National Mortgage<br />
Association,<br />
5.50%, 2/15/32 1,907,430 1,972<br />
Government National Mortgage<br />
Association,<br />
5.50%, 9/15/32 56,373 58<br />
Greenwich Capital Commerical Funding<br />
Corp., Series 2006-FL4A, Class A1,<br />
1.98%, 11/5/21 144A 733,206 542<br />
Louisiana Public Facilities Authority, Series<br />
2008,<br />
6.65%, 8/1/20 RB 2,250,000 2,208<br />
Structured Products (24.3%)<br />
Shares/<br />
$ Par<br />
Value<br />
$ (000's)<br />
Structured Products continued<br />
Massachusetts RRB Special Purpose<br />
Trust, Series 2001-1, Class A,<br />
6.53%, 6/1/15 1,470,609 1,516<br />
MASTR Asset Securitization Trust, Series<br />
2003-12, Class 1A1,<br />
5.25%, 12/25/24 1,126,860 1,087<br />
Merrill Lynch Alternative Note Asset, Series<br />
2007-A1, Class A2A,<br />
0.541%, 1/25/37 3,504,766 1,828<br />
Merrill Lynch/Countrywide Commercial<br />
Mortgage Trust, Series 2007-7, Class A4,<br />
5.749%, 6/12/50 2,817,000 2,000<br />
Nissan Auto Receivables Owner<br />
Trust, Series 2006-A, Class A3,<br />
4.74%, 9/15/09 888,267 888<br />
Nordstrom Private Label Credit Card Master<br />
Note Trust, Series 2007-1A, Class A,<br />
4.92%, 5/15/13 144A 7,031,000 6,710<br />
(n)RMF Commercial Mortgage Pass-Through<br />
Certificates, Series 1997-1, Class F,<br />
7.471%, 1/15/19 144A 538,446 431<br />
TBW Mortgage Backed Pass Through<br />
Certificates, Series 2007-1, Class A1,<br />
0.561%, 3/25/37 2,839,957 2,501<br />
Thornburg Mortgage Securities Trust, Series<br />
2006-5, Class A1,<br />
0.591%, 9/25/46 3,309,461 2,742<br />
Thornburg Mortgage Securities Trust, Series<br />
2006-1, Class A3,<br />
0.641%, 1/25/46 8,382,697 8,351<br />
Thornburg Mortgage Securities Trust, Series<br />
2007-1, Class A1,<br />
1.505%, 3/25/37 2,441,040 2,016<br />
Thornburg Mortgage Securities Trust, Series<br />
2007-2, Class A3A,<br />
1.525%, 6/25/37 3,908,786 3,259<br />
Washington <strong>Mutual</strong> Alternative Mortgage<br />
Pass-Through Certficates, Series 2006-6,<br />
Class 4A,<br />
6.708%, 11/25/34 1,510,578 1,297<br />
Washington <strong>Mutual</strong> Commercial Mortgage<br />
Securities Trust, Series 2003-C1A,<br />
Class A,<br />
3.83%, 1/25/35 144A 2,124,742 2,015<br />
Wells Fargo Mortgage Backed<br />
Securities, Series 2006-2, Class 1A1,<br />
5.00%, 3/25/36 2,413,789 1,861<br />
Wells Fargo Mortgage Backed Securities<br />
Trust, Series 2004-N, Class A6,<br />
4.00%, 8/25/34 8,006,000 7,648<br />
Wells Fargo Mortgage Backed Securities<br />
Trust, Series 2005-1, Class 2A1,<br />
5.00%, 1/25/20 1,271,076 1,235<br />
Wells Fargo Mortgage Backed Securities<br />
Trust, Series 2005-7, Class A1,<br />
5.25%, 9/25/35 4,569,553 3,907<br />
The Accompanying Notes are an Integral Part of the Financial Statements.<br />
Balanced Portfolio 159
Balanced Portfolio<br />
Structured Products (24.3%)<br />
Shares/<br />
$ Par<br />
Value<br />
$ (000's)<br />
Structured Products continued<br />
Wells Fargo Mortgage Backed Securities<br />
Trust, Series 2005-11, Class 1A1,<br />
5.50%, 11/25/35 4,212,115 3,580<br />
Total Structured Products<br />
(Cost: $493,560) 485,825<br />
Below Investment Grade Segment (5.7%)<br />
Aerospace/Defense (0.4%)<br />
BE Aerospace, Inc., 8.50%, 7/1/18 381,000 343<br />
Bombardier, Inc., 8.00%, 11/15/14 144A 150,000 132<br />
DRS Technologies, Inc., 7.625%, 2/1/18 500,000 500<br />
(c) Hawker Beechcraft Acquisition Co.<br />
LLC/Hawker Beechcraft Notes Co.,<br />
8.875%, 4/1/15 390,000 133<br />
Hawker Beechcraft Acquisition Co.<br />
LLC/Hawker Beechcraft Notes Co.,<br />
9.75%, 4/1/17 465,000 125<br />
L-3 Communications Corp.,<br />
6.375%, 10/15/15 5,735,000 5,362<br />
L-3 Communications Corp.,<br />
7.625%, 6/15/12 850,000 831<br />
Total 7,426<br />
Autos/Vehicle Parts (0.1%)<br />
American Axle & Manufacturing, Inc.,<br />
7.875%, 3/1/17 588,000 182<br />
Ford Motor Co., 7.45%, 7/16/31 1,155,000 323<br />
Ford Motor Credit Co. LLC,<br />
8.00%, 12/15/16 320,000 209<br />
Ford Motor Credit Co. LLC,<br />
9.875%, 8/10/11 2,000,000 1,476<br />
General Motors Corp., 7.20%, 1/15/11 405,000 85<br />
General Motors Corp., 8.375%, 7/15/33 1,080,000 189<br />
Lear Corp., 5.75%, 8/1/14 385,000 143<br />
Lear Corp., 8.75%, 12/1/16 615,000 178<br />
Visteon Corp., 8.25%, 8/1/10 516,000 160<br />
Visteon Corp., 12.25%, 12/31/16 144A 543,000 130<br />
Total 3,075<br />
Basic Materials (0.4%)<br />
Ball Corp., 6.625%, 3/15/18 395,000 353<br />
Berry Plastics Holding Corp.,<br />
8.875%, 9/15/14 450,000 196<br />
Cascades, Inc., 7.25%, 2/15/13 350,000 178<br />
Crown Americas LLC/Crown Americas<br />
Capital Corp., 7.625%, 11/15/13 310,000 307<br />
FMG Finance Property, Ltd.,<br />
10.625%, 9/1/16 144A 1,200,000 696<br />
Freeport-McMoRan Copper & Gold, Inc.,<br />
8.375%, 4/1/17 1,955,000 1,603<br />
Georgia-Pacific LLC, 7.00%, 1/15/15 144A 1,250,000 1,062<br />
Georgia-Pacific LLC,<br />
7.125%, 1/15/17 144A 370,000 311<br />
Graphic Packaging International, Inc.,<br />
9.50%, 8/15/13 600,000 414<br />
Hexion US Finance Corp./Hexion Nova<br />
Scotia Finance ULC, 9.75%, 11/15/14 1,250,000 356<br />
Huntsman International LLC,<br />
7.375%, 1/1/15 405,000 213<br />
Momentive Performance Materials, Inc.,<br />
9.75%, 12/1/14 305,000 130<br />
The Mosaic Co., 7.625%, 12/1/16 144A 285,000 228<br />
Below Investment Grade Segment (5.7%)<br />
Shares/<br />
$ Par<br />
Value<br />
$ (000's)<br />
Basic Materials continued<br />
NewPage Corp., 10.00%, 5/1/12 405,000 178<br />
Novelis, Inc., 7.25%, 2/15/15 784,000 455<br />
Peabody Energy Corp., 7.375%, 11/1/16 330,000 310<br />
Peabody Energy Corp., 7.875%, 11/1/26 670,000 553<br />
Texas Industries, Inc., 7.25%, 7/15/13 144A 255,000 197<br />
Total 7,740<br />
Capital Goods (0.1%)<br />
Case New Holland, Inc., 7.125%, 3/1/14 680,000 483<br />
RSC Equipment Rental, Inc.,<br />
9.50%, 12/1/14 345,000 190<br />
SPX Corp., 7.625%, 12/15/14 144A 510,000 443<br />
Terex Corp., 8.00%, 11/15/17 675,000 574<br />
United Rentals North America, Inc.,<br />
6.50%, 2/15/12 270,000 213<br />
Total 1,903<br />
Consumer Products/Retailing (0.1%)<br />
Education Management LLC/Education<br />
Management Finance Corp.,<br />
10.25%, 6/1/16 1,185,000 859<br />
Levi Strauss & Co., 8.875%, 4/1/16 850,000 578<br />
The Neiman Marcus Group, Inc.,<br />
10.375%, 10/15/15 395,000 170<br />
New Albertson's, Inc., 7.25%, 5/1/13 485,000 410<br />
Rite Aid Corp., 9.375%, 12/15/15 325,000 114<br />
Rite Aid Corp., 10.375%, 7/15/16 255,000 187<br />
Total 2,318<br />
Energy (0.9%)<br />
Basic Energy Services, Inc.,<br />
7.125%, 4/15/16 825,000 470<br />
Chaparral Energy, Inc., 8.875%, 2/1/17 800,000 160<br />
Chesapeake Energy Corp., 6.625%, 1/15/16 1,000,000 790<br />
Chesapeake Energy Corp., 7.25%, 12/15/18 420,000 328<br />
Chesapeake Energy Corp., 7.625%, 7/15/13 170,000 146<br />
Cimarex Energy Co., 7.125%, 5/1/17 585,000 456<br />
Complete Production Services, Inc.,<br />
8.00%, 12/15/16 500,000 315<br />
Connacher Oil and Gas, Ltd.,<br />
10.25%, 12/15/15 144A 450,000 180<br />
El Paso Corp., 7.00%, 6/15/17 1,110,000 869<br />
El Paso Corp., 7.25%, 6/1/18 640,000 508<br />
El Paso Corp., 7.75%, 1/15/32 670,000 435<br />
Forest Oil Corp., 7.25%, 6/15/19 144A 250,000 183<br />
Forest Oil Corp., 7.25%, 6/15/19 390,000 285<br />
Helix Energy Solutions Group, Inc.,<br />
9.50%, 1/15/16 144A 680,000 360<br />
Key Energy Services, Inc., 8.375%, 12/1/14 675,000 446<br />
Kinder Morgan Finance Co. ULC,<br />
5.35%, 1/5/11 3,030,000 2,704<br />
Linn Energy LLC, 9.875%, 7/1/18 144A 380,000 222<br />
Mariner Energy, Inc., 8.00%, 5/15/17 548,000 285<br />
Newfield Exploration Co., 6.625%, 4/15/16 850,000 676<br />
Newfield Exploration Co., 7.125%, 5/15/18 315,000 249<br />
OPTI Canada, Inc., 8.25%, 12/15/14 395,000 213<br />
Petrohawk Energy Corp.,<br />
7.875%, 6/1/15 144A 520,000 385<br />
Petrohawk Energy Corp., 9.125%, 7/15/13 1,150,000 931<br />
Petroplus Finance, Ltd., 6.75%, 5/1/14 144A 420,000 267<br />
Petroplus Finance, Ltd., 7.00%, 5/1/17 144A 350,000 213<br />
Plains Exploration & Production Co.,<br />
7.625%, 6/1/18 260,000 178<br />
The Accompanying Notes are an Integral Part of the Financial Statements.<br />
160 Balanced Portfolio
Balanced Portfolio<br />
Shares/<br />
$ Par<br />
Value<br />
$ (000's)<br />
Below Investment Grade Segment (5.7%)<br />
Energy continued<br />
Plains Exploration & Production Co.,<br />
7.75%, 6/15/15 550,000 415<br />
Range Resources Corp., 6.375%, 3/15/15 750,000 607<br />
Range Resources Corp., 7.25%, 5/1/18 85,000 71<br />
SandRidge Energy, Inc.,<br />
8.00%, 6/1/18 144A 260,000 144<br />
Sonat, Inc., 7.625%, 7/15/11 190,000 173<br />
Southwestern Energy Co.,<br />
7.50%, 2/1/18 144A 490,000 429<br />
Targa Resources Partners LP,<br />
8.25%, 7/1/16 144A 305,000 189<br />
Tesoro Corp., 6.25%, 11/1/12 2,340,000 1,615<br />
Tesoro Corp., 6.625%, 11/1/15 660,000 383<br />
W&T Offshore, Inc., 8.25%, 6/15/14 144A 620,000 335<br />
Whiting Petroleum Corp., 7.25%, 5/1/13 850,000 604<br />
Total 17,219<br />
Financials (0.2%)<br />
E*TRADE Financial Corp.,<br />
7.375%, 9/15/13 35,000 13<br />
E*TRADE Financial Corp.,<br />
7.875%, 12/1/15 755,000 272<br />
E*TRADE Financial Corp., 8.00%, 6/15/11 775,000 353<br />
General Motors Acceptance Corp. LLC,<br />
7.25%, 3/2/11 1,415,000 1,202<br />
General Motors Acceptance Corp. LLC,<br />
7.75%, 1/19/10 330,000 294<br />
General Motors Acceptance Corp. LLC,<br />
8.00%, 11/1/31 144A 859,000 511<br />
International Lease Finance Corp.,<br />
5.875%, 5/1/13 215,000 143<br />
Nuveen Investments, Inc.,<br />
10.50%, 11/15/15 144A 500,000 111<br />
Wells Fargo Capital XV, 9.75%, 12/29/49 820,000 828<br />
Total 3,727<br />
Foods (0.3%)<br />
Constellation Brands, Inc., 7.25%, 9/1/16 2,265,000 2,141<br />
Constellation Brands, Inc., 7.25%, 5/15/17 575,000 543<br />
Constellation Brands, Inc.,<br />
8.375%, 12/15/14 285,000 271<br />
Pinnacle Foods Finance LLC/Pinnacle<br />
Foods Finance Corp., 9.25%, 4/1/15 450,000 290<br />
Pinnacle Foods Finance LLC/Pinnacle<br />
Foods Finance Corp., 10.625%, 4/1/17 950,000 513<br />
Smithfield Foods, Inc., 7.75%, 5/15/13 1,875,000 1,205<br />
Smithfield Foods, Inc., 7.75%, 7/1/17 455,000 259<br />
Total 5,222<br />
Gaming/Lodging/Leisure (0.5%)<br />
AMC Entertainment, Inc., 11.00%, 2/1/16 175,000 122<br />
Caesars Entertainment, Inc.,<br />
7.875%, 3/15/10 435,000 287<br />
Caesars Entertainment, Inc.,<br />
8.125%, 5/15/11 1,250,000 612<br />
Felcor Lodging LP, 8.50%, 6/1/11 750,000 555<br />
Harrah's Operating Co., Inc., 5.50%, 7/1/10 415,000 264<br />
Harrah's Operating Co., Inc.,<br />
10.75%, 2/1/16 144A 1,495,000 426<br />
Host Hotels & Resorts LP, 7.125%, 11/1/13 1,000,000 805<br />
Las Vegas Sands Corp., 6.375%, 2/15/15 1,090,000 632<br />
Mashantucket Western Pequot Tribe,<br />
8.50%, 11/15/15 144A 840,000 330<br />
MGM MIRAGE, 7.50%, 6/1/16 1,100,000 697<br />
Shares/<br />
$ Par<br />
Value<br />
$ (000's)<br />
Below Investment Grade Segment (5.7%)<br />
Gaming/Lodging/Leisure continued<br />
MGM MIRAGE, Inc., 6.75%, 9/1/12 1,230,000 861<br />
MGM MIRAGE, Inc., 8.375%, 2/1/11 620,000 369<br />
Mohegan Tribal Gaming Authority,<br />
6.875%, 2/15/15 675,000 341<br />
Mohegan Tribal Gaming Authority,<br />
8.00%, 4/1/12 210,000 128<br />
Royal Caribbean Cruises, Ltd.,<br />
7.00%, 6/15/13 1,555,000 886<br />
Station Casinos, Inc., 6.00%, 4/1/12 875,000 175<br />
Wynn Las Vegas LLC/Wynn Las Vegas<br />
Capital Corp., 6.625%, 12/1/14 4,295,000 3,243<br />
Total 10,733<br />
Health Care/Pharmaceuticals (0.4%)<br />
(c)Biomet, Inc., 10.375%, 10/15/17 1,195,000 944<br />
CHS/Community Health Systems, Inc.,<br />
8.875%, 7/15/15 1,530,000 1,408<br />
DaVita, Inc., 7.25%, 3/15/15 590,000 560<br />
FMC Finance III SA, 6.875%, 7/15/17 760,000 711<br />
HCA, Inc., 6.75%, 7/15/13 650,000 409<br />
HCA, Inc., 9.25%, 11/15/16 2,250,000 2,064<br />
(c)HCA, Inc., 9.625%, 11/15/16 900,000 702<br />
Health Management Associates, Inc.,<br />
6.125%, 4/15/16 590,000 366<br />
Service Corp. International, 6.75%, 4/1/15 600,000 474<br />
Tenet Healthcare Corp., 7.375%, 2/1/13 550,000 392<br />
Tenet Healthcare Corp., 9.875%, 7/1/14 590,000 475<br />
Ventas Realty LP/Ventas Capital Corp.,<br />
6.50%, 6/1/16 405,000 297<br />
Total 8,802<br />
Media (0.5%)<br />
CCH I Holdings LLC/CCH I Holdings<br />
Capital Corp., 11.00%, 10/1/15 2,235,000 346<br />
CCH I Holdings LLC/CCH I Holdings<br />
Capital Corp., 11.75%, 5/15/14 555,000 29<br />
CCH II LLC/CCH II Capital Corp.,<br />
10.25%, 9/15/10 720,000 317<br />
CSC Holdings, Inc., 7.625%, 4/1/11 2,250,000 2,121<br />
CSC Holdings, Inc., 7.875%, 2/15/18 1,005,000 789<br />
Dex Media, Inc., 8.00%, 11/15/13 805,000 149<br />
DirecTV Holdings LLC/DirecTV Financing<br />
Co., 7.625%, 5/15/16 1,120,000 1,086<br />
EchoStar DBS Corp., 7.00%, 10/1/13 435,000 377<br />
EchoStar DBS Corp., 7.125%, 2/1/16 775,000 647<br />
EchoStar DBS Corp., 7.75%, 5/31/15 785,000 667<br />
Kabel Deutschland GmbH, 10.625%, 7/1/14 215,000 191<br />
Lamar Media Corp., 6.625%, 8/15/15 1,140,000 823<br />
LIN Television Corp., 6.50%, 5/15/13 425,000 202<br />
Mediacom Broadband LLC/Mediacom<br />
Broadband Corp., 8.50%, 10/15/15 600,000 391<br />
Quebecor Media, Inc., 7.75%, 3/15/16 660,000 446<br />
R.H. Donnelley Corp., 6.875%, 1/15/13 880,000 119<br />
R.H. Donnelley Corp., 8.875%, 10/15/17 220,000 33<br />
(c)Univision Communications, Inc.,<br />
9.75%, 3/15/15 144A 710,000 89<br />
Videotron Ltee, 6.875%, 1/15/14 491,000 435<br />
Videotron Ltee, 9.125%, 4/15/18 144A 110,000 102<br />
Total 9,359<br />
Real Estate (0.0%)<br />
Icahn Enterprises LP/Icahn Enterprises<br />
Finance Corp., 7.125%, 2/15/13 500,000 345<br />
Total 345<br />
The Accompanying Notes are an Integral Part of the Financial Statements.<br />
Balanced Portfolio 161
Balanced Portfolio<br />
Shares/<br />
$ Par<br />
Value<br />
$ (000's)<br />
Below Investment Grade Segment (5.7%)<br />
Services (0.1%)<br />
Allied Waste North America, Inc.,<br />
6.125%, 2/15/14 305,000 276<br />
Allied Waste North America, Inc.,<br />
7.25%, 3/15/15 1,000,000 930<br />
Crum & Forster Holdings Corp.,<br />
7.75%, 5/1/17 562,000 396<br />
Total 1,602<br />
Structured Products (0.4%)<br />
CDX North America High Yield,<br />
8.875%, 6/29/13 144A 10,000,000 9,000<br />
Total 9,000<br />
Technology (0.2%)<br />
Expedia, Inc., 8.50%, 7/1/16 144A 50,000 37<br />
First Data Corp., 9.875%, 9/24/15 775,000 469<br />
Flextronics International, Ltd.,<br />
6.50%, 5/15/13 750,000 593<br />
Freescale Semiconductor, Inc.,<br />
8.875%, 12/15/14 650,000 286<br />
(c) Freescale Semiconductor, Inc.,<br />
9.125%, 12/15/14 900,000 207<br />
Iron Mountain, Inc., 7.75%, 1/15/15 470,000 422<br />
Iron Mountain, Inc., 8.00%, 6/15/20 775,000 622<br />
Nortel Networks, Ltd.,<br />
10.75%, 7/15/16 144A 590,000 156<br />
Sabre Holdings Corp., 8.35%, 3/15/16 500,000 111<br />
STATS ChipPAC, Ltd., 7.50%, 7/19/10 360,000 296<br />
Sungard Data Systems, Inc.,<br />
10.625%, 5/15/15 144A 425,000 363<br />
Unisys Corp., 8.00%, 10/15/12 450,000 126<br />
Total 3,688<br />
Telecommunications (0.4%)<br />
(c) ALLTEL Communications LLC,<br />
10.375%, 12/1/17 144A 680,000 762<br />
American Tower Corp.,<br />
7.00%, 10/15/17 144A 500,000 445<br />
Cricket Communications, Inc.,<br />
10.00%, 7/15/15 144A 255,000 233<br />
Frontier Communications Corp.,<br />
9.00%, 8/15/31 1,480,000 932<br />
Frontier Communications Corp.,<br />
9.25%, 5/15/11 1,370,000 1,302<br />
Intelsat Corp., 9.25%, 8/15/14 144A 400,000 372<br />
Intelsat Jackson Holdings, Ltd.,<br />
11.25%, 6/15/16 395,000 359<br />
Intelsat, Ltd., 7.625%, 4/15/12 400,000 268<br />
Qwest Corp., 6.50%, 6/1/17 750,000 555<br />
Qwest Corp., 7.625%, 6/15/15 415,000 340<br />
Sprint Nextel Corp., 6.00%, 12/1/16 950,000 670<br />
Windstream Corp., 7.00%, 3/15/19 500,000 385<br />
Windstream Corp., 8.625%, 8/1/16 865,000 766<br />
Total 7,389<br />
Transportation (0.1%)<br />
American Railcar Industries, Inc.,<br />
7.50%, 3/1/14 235,000 155<br />
Kansas City Southern de Mexico SAB de<br />
CV, 7.375%, 6/1/14 1,500,000 1,228<br />
Stena AB, 7.50%, 11/1/13 200,000 132<br />
Total 1,515<br />
Shares/<br />
$ Par<br />
Value<br />
$ (000's)<br />
Below Investment Grade Segment (5.7%)<br />
Utilities (0.6%)<br />
The AES Corp., 7.75%, 10/15/15 795,000 668<br />
The AES Corp., 8.00%, 10/15/17 500,000 410<br />
The AES Corp., 8.00%, 6/1/20 144A 405,000 314<br />
Aquila, Inc., 11.875%, 7/1/12 405,000 409<br />
Dynegy Holdings, Inc., 7.50%, 6/1/15 730,000 511<br />
Dynegy Holdings, Inc., 7.75%, 6/1/19 485,000 335<br />
Dynegy Holdings, Inc., 8.375%, 5/1/16 1,075,000 763<br />
Edison Mission Energy, 7.00%, 5/15/17 1,050,000 913<br />
Edison Mission Energy, 7.20%, 5/15/19 1,225,000 1,005<br />
Elwood Energy LLC, 8.159%, 7/5/26 543,608 369<br />
Energy Future Holdings Corp.,<br />
10.875%, 11/1/17 144A 670,000 476<br />
Indiantown Cogeneration LP,<br />
9.77%, 12/15/20 1,280,000 1,014<br />
Mirant Americas Generation LLC,<br />
8.50%, 10/1/21 1,215,000 923<br />
NRG Energy, Inc., 7.25%, 2/1/14 500,000 467<br />
NRG Energy, Inc., 7.375%, 2/1/16 130,000 121<br />
NRG Energy, Inc., 7.375%, 1/15/17 490,000 451<br />
Reliant Energy, Inc., 7.625%, 6/15/14 1,015,000 842<br />
Texas Competitive Electric Holdings Co.<br />
LLC, 10.50%, 11/1/15 144A 2,660,000 1,889<br />
Total 11,880<br />
Total Below Investment Grade Segment<br />
(Cost: $153,575) 112,943<br />
Preferred Stocks (0.0%)<br />
Financials (0.0%)<br />
Preferred Blocker, Inc.,<br />
(n)* 9.00%, 12/31/49 144A 500 125<br />
Total 125<br />
Total Preferred Stocks<br />
(Cost: $125) 125<br />
Short-Term Investments (15.7%)<br />
Aircraft (2.0%)<br />
(b)Kitty Hawk Funding Corp.,<br />
0.28%, 1/20/09 10,000,000 9,999<br />
(b)Kitty Hawk Funding Corp.,<br />
0.40%, 1/26/09 10,000,000 9,997<br />
(b)Textron, Inc., 6.25%, 1/5/09<br />
10,000,000 9,993<br />
(b)Textron, Inc., 6.25%, 1/6/09<br />
10,000,000 9,991<br />
Total 39,980<br />
Autos (1.5%)<br />
(b)American Honda Finance<br />
Corp., 2.319%, 8/26/09<br />
144A 3,200,000 3,178<br />
(b)American Honda Finance<br />
Corp., 2.989%, 5/5/09<br />
144A 2,370,000 2,363<br />
(b)American Honda Finance<br />
Corp., 4.389%, 1/8/09<br />
144A 3,600,000 3,601<br />
The Accompanying Notes are an Integral Part of the Financial Statements.<br />
162 Balanced Portfolio
Balanced Portfolio<br />
Short-Term Investments<br />
(15.7%)<br />
Shares/<br />
S Par<br />
Value<br />
$ (000's)<br />
Autos continued<br />
(b) Toyota Motor Credit Corp.,<br />
1.15%, 1/14/09 20,000,000 19,992<br />
Total 29,134<br />
Commercial Banks Non-US (0.6%)<br />
(b) Bank of Scotland PLC,<br />
1.868%, 10/9/09 144A 3,000,000 2,994<br />
(b) Barclays US Funding Corp.,<br />
1.79%, 1/12/09 10,000,000 9,995<br />
Total 12,989<br />
Electric Utilities (0.5%)<br />
(b) Duke Energy Corp.,<br />
4.00%, 1/6/09 10,000,000 9,994<br />
Total 9,994<br />
Federal Government & Agencies (1.4%)<br />
(b) Federal Home Loan Bank,<br />
0.65%, 3/13/09 7,300,000 7,299<br />
(b) Federal National Mortgage<br />
Association,<br />
0.20%, 3/30/09 21,500,000 21,498<br />
Total 28,797<br />
Finance Lessors (0.7%)<br />
(b) International Lease Finance<br />
Corp., 3.50%, 4/1/09 3,530,000 3,352<br />
(b) Thunder Bay Funding LLC,<br />
0.60%, 1/15/09 10,000,000 9,998<br />
Total 13,350<br />
Finance Services (4.0%)<br />
(b) Alpine Securitization Corp.,<br />
1.35%, 1/7/09 10,000,000 9,998<br />
(b) Alpine Securitization Corp.,<br />
1.35%, 1/9/09 10,000,000 9,997<br />
(b) Atlantic Asset Securitization<br />
LLC, 0.65%, 1/12/09 10,000,000 9,998<br />
(b) Barton Capital LLC,<br />
1.45%, 1/2/09 10,000,000 9,999<br />
(b) Bryant Park Funding LLC,<br />
0.45%, 1/15/09 10,000,000 9,998<br />
(b) Bryant Park Funding LLC,<br />
1.20%, 1/5/09 10,000,000 9,999<br />
(b) Gemini Securitization Corp.<br />
LLC, 0.50%, 1/23/09 10,000,000 9,997<br />
(b) Gemini Securitization Corp.<br />
LLC, 1.45%, 1/8/09 10,000,000 9,997<br />
Total 79,983<br />
Short-Term Investments<br />
(15.7%)<br />
Industrial - Other (0.3%)<br />
Shares/<br />
S Par<br />
Value<br />
$ (000's)<br />
(b)John Deere Capital Corp.,<br />
0.55%, 1/16/09 5,000,000 4,999<br />
Total 4,999<br />
Miscellaneous Business Credit Institutions (0.3%)<br />
(b)General Electric Capital<br />
Corp., 1.971%, 2/2/09 6,200,000 6,192<br />
Total 6,192<br />
Oil and Gas (1.9%)<br />
(b)Devon Energy Corp.,<br />
1.15%, 1/2/09 7,500,000 7,500<br />
Devon Energy Corp.,<br />
1.25%, 1/2/09 10,390,000 10,389<br />
Sempra Global,<br />
4.50%, 1/5/09 10,000,000 9,995<br />
Sempra Global,<br />
4.50%, 1/6/09 10,000,000 9,994<br />
Total 37,878<br />
Personal Credit Institutions (1.2%)<br />
(b)Associates Corp. of North<br />
America, 8.55%, 7/15/09 4,440,000 4,433<br />
HSBC Finance Corp.,<br />
0.30%, 1/6/09 9,000,000 9,000<br />
HSBC Finance Corp.,<br />
0.35%, 1/13/09 10,000,000 9,999<br />
Total 23,432<br />
Short Term Business Credit (1.3%)<br />
(b)Caterpillar Financial<br />
Services Corp.,<br />
2.259%, 3/10/09 6,320,000 6,296<br />
Liberty Street Funding LLC,<br />
0.55%, 2/17/09 10,000,000 9,993<br />
Old Line Funding LLC,<br />
0.35%, 1/15/09 10,000,000 9,999<br />
Total 26,288<br />
Total Short-Term Investments<br />
(Cost: $313,340) 313,016<br />
Total Investments (99.0%)<br />
(Cost: $2,287,487)(a) 1,974,574<br />
Other Assets, Less<br />
Liabilities (1.0%) 20,127<br />
Net Assets (100.0%) 1,994,701<br />
* Non-Income Producing<br />
ADR after the name of a security represents—American Depositary Receipt.<br />
144A after the name of a security represents a security exempt from registration under Rule 144A of the Securities Act of 1933. These securities may be<br />
resold as transactions exempt from registration, normally to qualified institutional buyers. At December 31, 2008 the value of these securities (in thousands)<br />
was $62,599 representing 3.14% of the net assets.<br />
The Accompanying Notes are an Integral Part of the Financial Statements.<br />
Balanced Portfolio 163
Balanced Portfolio<br />
IO — Interest Only Security<br />
RB — Revenue Bond<br />
AMBAC — American Municipal Bond Assurance Corp.<br />
(a)<br />
(b)<br />
At December 31, 2008 the aggregate cost of securities for federal tax purposes (in thousands) was $2,298,705 and the net unrealized depreciation of<br />
investments based on that cost was $324,131 which is comprised of $74,293 aggregate gross unrealized appreciation and $398,424 aggregate gross<br />
unrealized depreciation.<br />
All or a portion of the securities have been committed as collateral for open futures positions or when-issued securities. Information regarding open futures<br />
contracts as of period end is summarized below.<br />
Unrealized<br />
Appreciation/<br />
Number of<br />
(Depreciation)<br />
Issuer (000's)<br />
Contracts Expiration Date (000's)<br />
Midcap 400 Index Futures (Long) (Total Notional Value at December 31, 2008, $7,597) 29 3/09 $ 193<br />
Russell 2000 Mini Index Future (Long) (Total Notional Value at December 31, 2008, $21,098) 440 3/09 807<br />
S&P 500 Index Futures (Long) (Total Notional Value at December 31, 2008, $190,288) 834 3/09 (2,621)<br />
US Five Year Note Commodity (Long) (Total Notional Value at December 31, 2008, $38,338) 330 3/09 949<br />
US Long Bond (CBT) Commodity (Short) (Total Notional Value at December 31, 2008, $28,367) 207 3/09 (210)<br />
US Ten Year Treasury Note (Short) (Total Notional Value at December 31, 2008, $102,867) 865 3/09 (5,909)<br />
US Two Year Treasury Note (Long) (Total Notional Value at December 31, 2008, $66,043) 307 3/09 901<br />
(c)<br />
(d)<br />
(e)<br />
(g)<br />
PIK - Payment In Kind<br />
Defaulted Security<br />
Step bond security that presently receives no coupon payments. At the predetermined date the stated coupon rate becomes effective.<br />
All or portion of the securities have been loaned. See Note 2M in the Notes to Financial Statements.<br />
(j) Swap agreements outstanding on December 31, 2008<br />
Total Return Swaps<br />
CounterParty<br />
Credit Suisse Securities<br />
(Europe) Ltd.<br />
Credit Suisse Securities<br />
(Europe) Ltd.<br />
Credit Suisse Securities<br />
(Europe) Ltd.<br />
Credit Suisse Securities<br />
(Europe) Ltd.<br />
Credit Suisse Securities<br />
(Europe) Ltd.<br />
Credit Suisse Securities<br />
(Europe) Ltd.<br />
Reference<br />
Payment Made by<br />
the Fund<br />
Russell Midcap Value Index 3 Month USD-<br />
LIBOR - 8 Basis<br />
Points (Bps)<br />
Russell 2000 Growth Index Russell 2000<br />
Growth Index<br />
Total Return<br />
Russell 1000 Growth Index Russell 1000<br />
Growth Index<br />
Total Return<br />
Russell 2000 Value Index 3 Month USD-<br />
LIBOR - 90 Bps<br />
Russell Midcap Growth Index Russell Midcap<br />
Growth Index<br />
Total Return<br />
Russell 1000 Value Index 3 Month USD-<br />
LIBOR + 4 Bps<br />
Goldman Sachs International Russell 1000 Value Index 3 Month USD-<br />
LIBOR + 10 Bps<br />
Goldman Sachs International Russell 1000 Growth Index Russell 1000<br />
Growth Index<br />
Total Return<br />
Payment Received<br />
by the Fund<br />
Russell Midcap<br />
Value Index<br />
Total Return<br />
3 Month USD-<br />
LIBOR + 125<br />
Bps<br />
3 Month USD-<br />
LIBOR - 19 Bps<br />
Russell 2000<br />
Value Index<br />
Total Return<br />
3 Month USD-<br />
LIBOR - 35 Bps<br />
Russell 1000<br />
Value Index<br />
Total Return<br />
Russell 1000<br />
Value Index<br />
Total Return<br />
3 Month USD-<br />
LIBOR - 13 Bps<br />
Expiration<br />
Date<br />
Notional<br />
Amount (000's)<br />
Unrealized<br />
Appreciation/<br />
(Depreciation)<br />
(000's)<br />
5/09 65,212 $ (2,455)<br />
5/09 15,195 607<br />
5/09 89,315 4,057<br />
5/09 16,231 (205 )<br />
5/09 65,109 3,080<br />
5/09 87,279 (3,822)<br />
5/09 67,942 (2,975 )<br />
5/09 67,093 3,048<br />
The Accompanying Notes are an Integral Part of the Financial Statements.<br />
164 Balanced Portfolio
Balanced Portfolio<br />
CounterParty<br />
JPMorgan Chase<br />
JPMorgan Chase<br />
Reference<br />
Russell 2000 Growth<br />
Biotechnology Industry<br />
Index<br />
Morgan Stanley Capital<br />
International (MSCI) Daily<br />
Net Japan<br />
Payment Made by<br />
the Fund<br />
3 Month USD-<br />
LIBOR -120 Bps<br />
3 Month USD-<br />
LIBOR +15 Bps<br />
Payment Received<br />
by the Fund<br />
Russell 2000<br />
Growth<br />
Biotechnology<br />
Industry Index<br />
Total Return<br />
MSCI Daily Net<br />
Japan Total<br />
Return<br />
Expiration<br />
Date<br />
Notional<br />
Amount (000's)<br />
Unrealized<br />
Appreciation/<br />
(Depreciation)<br />
(000's)<br />
12/09 700 83<br />
3/09 9,481 295<br />
$ 1,713<br />
(l)<br />
As of December 31, 2008, portfolio securities with an aggregate value of $116,838 (in thousands) were fair valued under procedures adopted by the Board<br />
of Directors.<br />
(m) Amount is less than one thousand.<br />
(n)<br />
At December 31, 2008 portfolio securities with a aggregate value of $17,362 (in thousands) were valued with reference to securities whose values are more<br />
readily available.<br />
The Accompanying Notes are an Integral Part of the Financial Statements.<br />
Balanced Portfolio 165
Asset Allocation Portfolio<br />
Objective: Portfolio Strategy: Net Assets:<br />
Realize as high a level of total return<br />
as is consistent with reasonable<br />
investment risk.<br />
Actively manage the Portfolio through a flexible policy of<br />
allocating assets among stocks, bonds and cash, adjusting the<br />
mix to capitalize on changing financial markets and economic<br />
conditions.<br />
$200 million<br />
Portfolio Overview<br />
Mason Street Advisors acts as the investment adviser for the Asset Allocation Portfolio. The investment objective of the<br />
Portfolio is to realize as high a level of total return as is consistent with reasonable investment risk. The Portfolio will follow a<br />
flexible policy for allocating assets among equity securities, debt investments, and cash or cash equivalents. The Asset<br />
Allocation Portfolio invests in seven categories of assets: large-capitalization stocks, medium-capitalization stocks, smallcapitalization<br />
stocks, foreign stocks, investment-grade bonds, below investment-grade bonds, and cash equivalents. The<br />
proportion of investments in each category is adjusted as appropriate to take advantage of market trends and opportunities, and<br />
securities within each category are actively managed by an investment professional with experience in that category. Under<br />
normal conditions, the Portfolio will typically invest between 55% and 75% of its assets in equity securities and between 25%-<br />
45% of its assets in fixed income securities. The Portfolio is managed to maintain broad diversification, while blending asset<br />
classes to attempt to achieve both capital appreciation and current income.<br />
Market Overview<br />
Financial markets endured a brutal 2008, which saw the failure of a number of leading financial institutions, credit markets<br />
freeze up, and the U.S. government take a series of extraordinary steps to support the economy and financial system. The crisis<br />
was a result of the ongoing sub-prime mortgage meltdown, which spread rapidly through the financial sector and into virtually<br />
every segment of global financial markets. Economic conditions deteriorated sharply over the course of the year, as<br />
unemployment jumped above 7% and the economy entered its first recession since 2002.<br />
Against that backdrop, the S&P 500 ® Stock Index fell 37.00%. Equity returns were negative across all market capitalization<br />
ranges, sectors, and investment styles. Fixed income returns varied widely, with the Citigroup U.S. Broad Investment Grade<br />
Bond Index (a broad-based bond index) up 7.02%, as Treasury and government-backed mortgage debt had positive returns,<br />
while corporate bonds endured their worst year ever. What’s more, the Citigroup High-Yield Cash-Pay Index suffered its most<br />
difficult year on record, falling 24.74%. Meanwhile, cash-equivalent investments had modest returns as the Fed slashed shortterm<br />
rates. For the full year, the Merrill Lynch Three-Month T-Bill Index was up 2.06%. International equities offered no<br />
relief, as the MSCI EAFE Index—a measure of large-cap stock performance in Europe, Australasia, and the Far East—<br />
tumbled 43.06%.<br />
Portfolio Results<br />
The Asset Allocation Portfolio returned –30.13% for the twelve months ended December 31, 2008. That compares with the –<br />
37.00% return of the broad stock market, as measured by the S&P 500 ® Index. At the same time, the Asset Allocation<br />
Portfolio Blended Composite Benchmark returned –28.17%. (The Portfolio’s blended benchmark weights are detailed in the<br />
“Benchmark Definitions” section of this annual report.) The Mixed-Asset Target Allocation Growth Funds peer group had an<br />
average return of –29.60%, according to Lipper Analytical Services, Inc., an independent mutual fund ranking agency.<br />
The Portfolio’s absolute return reflected the unprecedented turmoil affecting the economy and financial markets in a year in<br />
which only cash and government-backed securities had positive returns. The Portfolio outperformed the equity-only S&P 500 ®<br />
Index thanks to positive performance from its cash and bond allocations. Relative to the blended benchmark, it helped to be<br />
underrepresented in equities overall, and international stocks in particular. It was also beneficial to be overweight investment<br />
grade bonds and underweight high yield. However, our stock allocation has a growth bias, which hurt in a year when value<br />
outperformed growth. Our stock selection also detracted from performance. In the fixed income slice, our sector allocation<br />
decisions among investment grade bonds hurt, as we were underrepresented in Treasuries during one of the best years for<br />
Treasuries on record.<br />
Many of the changes we made to the Portfolio’s asset mix over the course of the year were to address imbalances created by<br />
sharp volatility in the markets. For example, stocks’ poor performance shrank the equity slice of the Portfolio, so we<br />
consistently used our cash allocation to bring equities back closer to neutral. Nevertheless, equities finished the year a little<br />
below our target allocation at 64% of assets. The fixed income allocation ended the year a little above our neutral weight at<br />
34% of assets. Within this slice, we maintained a bias toward high quality bonds and an underweight position in high yield<br />
debt. We ended the year with cash below our target allocation at just 2% of assets, preferring to put this money to work in<br />
more attractively valued segments of the market.<br />
166 Asset Allocation Portfolio
Asset Allocation Portfolio<br />
Outlook<br />
After the unprecedented events of 2008, we have a somewhat hopeful outlook for 2009—we are hoping for the reemergence of<br />
a more rational, less volatile market environment where fundamentals matter again. Unfortunately, the economic fundamentals<br />
remain challenging, and it’s difficult to see a quick rebound.<br />
In terms of the Portfolio’s asset allocation, the extreme market conditions of the last year have created some significant<br />
disparities in valuations across and within asset classes. So, for example, at a time when cash yields are approaching zero and<br />
Treasury bond yields are at record lows, we find that stocks and credit-sensitive bonds are very attractive by comparison. As a<br />
result, we expect to underweight cash in favor of our equity and bond allocations. Within equities, we anticipate favoring<br />
growth-oriented shares, which historically have done better than value when investors desire earnings certainty. And within<br />
fixed income, we favor high quality assets trading at distressed levels, particularly those with government backing.<br />
$20,000<br />
15,000<br />
10,000<br />
5,000<br />
Relative Performance<br />
0<br />
7/01 12/01 12/02 12/03 12/04 12/05 12/06 12/07 12/08<br />
Asset Allocation Portfolio<br />
S&P 500 Index<br />
Citigroup U.S. Broad Investment Grade Index<br />
Asset Allocation Portfolio Blended Composite Benchmark<br />
Average <strong>Annual</strong> Total Returns<br />
For Periods Ended December 31, 2008<br />
1 Year 5 Years<br />
Since<br />
Inception*<br />
Asset Allocation Portfolio<br />
S&P 500 Index<br />
-30.13% -0.22%<br />
-37.00% -2.19%<br />
0.64%<br />
-2.08%<br />
Citigroup U.S. Broad Investment<br />
Grade Index 7.02% 5.10% 5.67%<br />
Asset Allocation Portfolio Blended<br />
Composite Benchmark -28.17% 0.81% 1.66%<br />
Lipper Variable Insurance Products<br />
(VIP) Mixed Asset Target<br />
Allocation Growth Funds Average -29.60% -0.50% –<br />
*Inception date of 7/31/01<br />
The performance data quoted represents past<br />
performance. Past performance is historical and does<br />
not guarantee future performance. Investment return<br />
and principal value will fluctuate, so that shares, when<br />
redeemed, may be worth more or less than their original<br />
cost. Current performance may be lower or higher than<br />
the performance data quoted. For the most recent<br />
month-end performance information visit<br />
www.nmfn.com.<br />
This chart assumes an initial investment of $10,000<br />
made on 7/31/01 (commencement of the Portfolio's<br />
operations). Returns shown reflect fee waivers,<br />
deductions for management and other portfolio<br />
expenses, and reinvestment of all dividends. In the<br />
absence of fee waivers, total return would be reduced.<br />
Returns exclude deductions for separte account sale<br />
loads and account fees. Please refer to the Benchmark<br />
Definitions section of this report for information about<br />
the indices cited in the above chart and graph.<br />
Investors should be aware of the risks of investments in<br />
foreign securities, particularly investments in securities<br />
of companies in developing nations. These include the<br />
risks of currency fluctuation, of political and economic<br />
instability and of less well-developed government<br />
supervision and regulation of business and industry<br />
practices, as well as differences in accounting<br />
standards. Small cap stocks also may carry additional<br />
risk. Smaller or newer issuers are more likely to realize<br />
more substantial growth as well as suffer more<br />
significant losses than larger or more established<br />
issuers. Investments in such companies can be both<br />
volatile and more speculative. Bonds and other debt<br />
obligations are affected by changes in interest rates,<br />
inflation risk and the creditworthiness of their issuers.<br />
High yield bonds generally have greater price swings<br />
and higher default risks than investment grade bonds.<br />
The Portfolio may use derivative instruments for hedging<br />
purposes as part of its investment strategy. Use of these<br />
instruments may involve certain costs and risks such as<br />
liquidity risk, interest rate risk, market risk, credit risk,<br />
management risk and the risk that the Portfolio could<br />
not close out a position when it would be most<br />
advantageous to do so. Portfolios investing in<br />
derivatives could lose more than the principal amount<br />
invested in those instruments.<br />
Asset Allocation Portfolio 167
Asset Allocation Portfolio<br />
Top 5 Equity Holdings 12/31/08<br />
Security Description<br />
% of Net Assets<br />
Microsoft Corp. 0.8%<br />
Celgene Corp. 0.6%<br />
Hewlett-Packard Co. 0.6%<br />
Wal-Mart Stores, Inc. 0.6%<br />
Abbott Laboratories 0.5%<br />
Top 5 Fixed Income Holdings 12/31/08<br />
Security Description<br />
% of Net Assets<br />
Federal National Mortgage Association, Various 7.7%<br />
US Treasury, Various 2.2%<br />
Federal Home Loan Mortgage Corp., Various 1.6%<br />
Federal Home Loan Mortgage Corp. ,<br />
4.875%, 6/13/18 1.1%<br />
AEP Texas Central Transition Funding LLC,<br />
5.306%, 7/01/21 0.5%<br />
Sector Allocation 12/31/08<br />
Governments<br />
4%<br />
Below Investment<br />
Grade Segment<br />
7%<br />
Investment Grade<br />
Segment<br />
9%<br />
Mid Cap Stocks<br />
9%<br />
Small Cap Stocks<br />
3%<br />
Short-Term<br />
Investments &<br />
Other Net Assets<br />
22%<br />
Large Cap<br />
Stocks<br />
20%<br />
Foreign Stocks<br />
12%<br />
Structured Products<br />
14%<br />
Sector Allocation is based on Net Assets.<br />
Sector Allocation and Top 10 Holdings are subject to<br />
change.<br />
168 Asset Allocation Portfolio
Asset Allocation Portfolio<br />
<strong>Northwestern</strong> <strong>Mutual</strong> Series Fund, Inc.<br />
Schedule of Investments<br />
December 31, 2008<br />
Domestic Common Stocks and<br />
Warrants (32.8%)<br />
Large Cap Common Stocks (20.4%)<br />
Consumer Discretionary (1.9%)<br />
Shares/<br />
$ Par<br />
Value<br />
$ (000's)<br />
Abercrombie & Fitch Co. -<br />
Class A 7,200 166<br />
* Amazon.com, Inc. 3,200 164<br />
Comcast Corp. - Class A 32,750 553<br />
Johnson Controls, Inc. 18,100 329<br />
* Kohl's Corp. 14,300 518<br />
Lowe's Companies, Inc. 15,500 334<br />
McDonald's Corp. 6,600 410<br />
The McGraw-Hill Companies,<br />
Inc. 13,500 313<br />
NIKE, Inc. - Class B 9,100 464<br />
Omnicom Group, Inc. 11,200 301<br />
Target Corp. 8,800 304<br />
Total 3,856<br />
Consumer Staples (3.2%)<br />
Avon Products, Inc. 15,200 365<br />
The Coca-Cola Co. 15,400 697<br />
CVS Caremark Corp. 28,005 805<br />
* Energizer Holdings, Inc. 5,300 287<br />
* Hansen Natural Corp. 14,400 483<br />
The Kroger Co. 23,900 631<br />
PepsiCo, Inc. 14,100 772<br />
Philip Morris International,<br />
Inc. 21,000 914<br />
The Procter & Gamble Co. 7,200 445<br />
Wal-Mart Stores, Inc. 19,400 1,088<br />
Total 6,487<br />
Energy (1.7%)<br />
Exxon Mobil Corp. 9,200 734<br />
Halliburton Co. 13,100 238<br />
Hess Corp. 4,200 225<br />
* National-Oilwell Varco, Inc. 22,700 555<br />
Occidental Petroleum Corp. 8,200 492<br />
Schlumberger, Ltd. 11,800 500<br />
* Transocean, Ltd. 3,100 146<br />
XTO Energy, Inc. 11,700 413<br />
Total 3,303<br />
Financials (0.5%)<br />
American Express Co. 6,900 128<br />
CME Group, Inc. 800 166<br />
The Goldman Sachs Group,<br />
Inc. 2,300 194<br />
Prudential Financial, Inc. 5,800 176<br />
State Street Corp. 9,700 382<br />
Total 1,046<br />
Domestic Common Stocks and<br />
Warrants (32.8%)<br />
Health Care (3.6%)<br />
Shares/<br />
$ Par<br />
Value<br />
$ (000's)<br />
Abbott Laboratories 20,000 1,067<br />
Allergan, Inc. 9,300 375<br />
Baxter International, Inc. 16,200 868<br />
Bristol-Myers Squibb Co. 4,600 107<br />
*Celgene Corp. 20,400 1,128<br />
*Genentech, Inc. 6,100 506<br />
*Genzyme Corp. 5,100 339<br />
*Gilead Sciences, Inc. 15,700 803<br />
Johnson & Johnson 5,100 305<br />
*Medco Health Solutions, Inc. 19,800 830<br />
*St. Jude Medical, Inc. 7,900 260<br />
*Thermo Fisher Scientific, Inc. 6,200 211<br />
UnitedHealth Group, Inc. 11,300 301<br />
Total 7,100<br />
Industrials (2.0%)<br />
Danaher Corp. 7,800 441<br />
Deere & Co. 6,700 257<br />
FedEx Corp. 5,700 366<br />
*First Solar, Inc. 2,000 276<br />
Honeywell International, Inc. 15,900 522<br />
Lockheed Martin Corp. 3,200 269<br />
Norfolk Southern Corp. 8,900 419<br />
Raytheon Co. 7,100 362<br />
Textron, Inc. 12,900 179<br />
Union Pacific Corp. 9,800 468<br />
United Technologies Corp. 9,900 531<br />
Total 4,090<br />
Information Technology (5.7%)<br />
Accenture, Ltd. - Class A 14,100 462<br />
*Apple, Inc. 9,300 794<br />
Applied Materials, Inc. 12,100 123<br />
*Broadcom Corp. - Class A 19,800 336<br />
*Cisco Systems, Inc. 60,700 989<br />
Corning, Inc. 22,700 216<br />
*eBay, Inc. 17,600 246<br />
*Electronic Arts, Inc. 10,400 167<br />
*Google, Inc. - Class A 3,400 1,046<br />
Hewlett-Packard Co. 30,600 1,111<br />
Intel Corp. 62,100 910<br />
International Business<br />
Machines Corp. 11,800 993<br />
MasterCard, Inc. 600 86<br />
*MEMC Electronic Materials,<br />
Inc. 12,700 181<br />
Microsoft Corp. 80,000 1,555<br />
*Oracle Corp. 42,600 755<br />
QUALCOMM, Inc. 27,700 993<br />
*Research In Motion, Ltd. 4,800 195<br />
Visa, Inc. - Class A 3,800 199<br />
*Yahoo!, Inc. 9,600 117<br />
Total 11,474<br />
The Accompanying Notes are an Integral Part of the Financial Statements.<br />
Asset Allocation Portfolio 169
Asset Allocation Portfolio<br />
Domestic Common Stocks and<br />
Warrants (32.8%)<br />
Materials (0.9%)<br />
Shares/<br />
$ Par<br />
Value<br />
$ (000's)<br />
Ecolab, Inc. 5,800 204<br />
Freeport-McMoRan Copper &<br />
Gold, Inc. 6,300 154<br />
Monsanto Co. 10,500 739<br />
Praxair, Inc. 11,100 659<br />
Total 1,756<br />
Other Holdings (0.4%)<br />
iShares Russell 1000 Growth<br />
Index Fund 20,000 741<br />
Total 741<br />
Telecommunication Services (0.3%)<br />
* American Tower Corp. - Class<br />
A 13,000 381<br />
* NII Holdings, Inc. 12,500 227<br />
Total 608<br />
Utilities (0.2%)<br />
Exelon Corp. 6,100 339<br />
Total 339<br />
Total Large Cap Common Stocks 40,800<br />
Mid Cap Common Stocks (9.5%)<br />
Consumer Discretionary (1.4%)<br />
* Collective Brands, Inc. 33,700 395<br />
DeVry, Inc. 11,100 637<br />
* Dollar Tree, Inc. 15,500 648<br />
* Focus Media Holding, Ltd.,<br />
ADR 13,200 120<br />
* GameStop Corp. - Class A 22,800 494<br />
* O'Reilly Automotive, Inc. 10,550 324<br />
* Urban Outfitters, Inc. 11,600 174<br />
Total 2,792<br />
Energy (1.0%)<br />
* Cameron International Corp. 24,100 494<br />
Diamond Offshore Drilling,<br />
Inc. 4,900 289<br />
Range Resources Corp. 10,100 347<br />
* SandRidge Energy, Inc. 8,900 55<br />
Smith International, Inc. 6,700 153<br />
* Southwestern Energy Co. 22,300 646<br />
Total 1,984<br />
Financials (0.9%)<br />
Assured Guaranty, Ltd. 11,500 131<br />
* IntercontinentalExchange, Inc. 1,815 150<br />
* MBIA, Inc. 18,500 75<br />
Northern Trust Corp. 8,200 428<br />
Raymond James Financial,<br />
Inc. 18,200 312<br />
SEI Investments Co. 11,100 174<br />
Synovus Financial Corp. 21,400 178<br />
T. Rowe Price Group, Inc. 6,500 230<br />
Domestic Common Stocks and<br />
Warrants (32.8%)<br />
Shares/<br />
$ Par<br />
Value<br />
$ (000's)<br />
Financials continued<br />
W.R. Berkley Corp. 5,200 161<br />
Total 1,839<br />
Health Care (1.2%)<br />
*Cerner Corp. 8,400 323<br />
*Charles River Laboratories<br />
International, Inc. 7,200 189<br />
*DaVita, Inc. 11,250 558<br />
*Express Scripts, Inc. 8,500 467<br />
*Immucor, Inc. 24,576 653<br />
*Intuitive Surgical, Inc. 1,200 152<br />
Total 2,342<br />
Industrials (2.0%)<br />
C.H. Robinson Worldwide,<br />
Inc. 10,650 586<br />
*Corrections Corp. of America 33,150 542<br />
Cummins, Inc. 2,600 69<br />
Expeditors International of<br />
Washington, Inc. 9,600 319<br />
*Foster Wheeler, Ltd. 13,500 316<br />
*FTI Consulting, Inc. 1,000 45<br />
Harsco Corp. 10,800 299<br />
J.B. Hunt Transport Services,<br />
Inc. 13,900 365<br />
L-3 Communications<br />
Holdings, Inc. 3,100 229<br />
MSC Industrial Direct Co.,<br />
Inc. - Class A 4,200 155<br />
Ritchie Bros. Auctioneers, Inc. 13,100 281<br />
*Spirit AeroSystems Holdings,<br />
Inc. - Class A 38,600 392<br />
*Stericycle, Inc. 9,500 495<br />
Total 4,093<br />
Information Technology (2.5%)<br />
*Activision Blizzard, Inc. 15,142 131<br />
*Alliance Data Systems Corp. 11,100 516<br />
Amphenol Corp. - Class A 14,100 338<br />
*Citrix Systems, Inc. 9,100 215<br />
*Cognizant Technology<br />
Solutions Corp. - Class A 13,200 238<br />
FactSet Research Systems,<br />
Inc. 8,300 367<br />
Global Payments, Inc. 15,400 505<br />
Intersil Corp. - Class A 36,000 331<br />
KLA-Tencor Corp. 17,200 375<br />
*McAfee, Inc. 15,200 525<br />
*Mettler-Toledo International,<br />
Inc. 6,200 418<br />
Microchip Technology, Inc. 18,400 359<br />
*Varian Semiconductor<br />
Equipment Associates, Inc. 23,100 419<br />
*VeriFone Holdings, Inc. 18,200 89<br />
Western Union Co. 9,100 131<br />
Total 4,957<br />
The Accompanying Notes are an Integral Part of the Financial Statements.<br />
170 Asset Allocation Portfolio
Asset Allocation Portfolio<br />
Domestic Common Stocks and<br />
Warrants (32.8%)<br />
Shares/<br />
$ Par<br />
Value<br />
$ (000's)<br />
Materials (0.3%)<br />
* Owens-Illinois, Inc. 12,900 353<br />
Titanium Metals Corp. 18,100 159<br />
Total 512<br />
Utilities (0.2%)<br />
Equitable Resources, Inc. 11,800 396<br />
Total 396<br />
Total Mid Cap Common Stocks 18,915<br />
Small Cap Common Stocks (2.9%)<br />
Consumer Discretionary (0.4%)<br />
(m)* Aeropostale, Inc. 25 0<br />
* American Public Education,<br />
Inc. 1,700 63<br />
Arbitron, Inc. 50 1<br />
* Buffalo Wild Wings, Inc. 1,150 29<br />
(m)* The Cheesecake Factory, Inc. 50 0<br />
(m) Cracker Barrel Old Country<br />
Store, Inc. 25 0<br />
* Exide Technologies 125 1<br />
* Fossil, Inc. 50 1<br />
* J. Crew Group, Inc. 50 1<br />
* Jack in the Box, Inc. 18,500 409<br />
* Jos. A. Bank Clothiers, Inc. 25 1<br />
* Life Time Fitness, Inc. 50 1<br />
* LKQ Corp. 4,800 56<br />
* Lumber Liquidators, Inc. 2,750 29<br />
The Men's Wearhouse, Inc. 50 1<br />
* New Oriental Education &<br />
Technology Group, Inc.,<br />
ADR 1,500 82<br />
PetSmart, Inc. 1,850 34<br />
Polaris Industries, Inc. 25 1<br />
(m)* Retail Ventures, Inc. 175 0<br />
Sinclair Broadcast Group, Inc.<br />
- Class A 200 1<br />
* Skechers U.S.A., Inc. - Class<br />
A 50 1<br />
Snap-on, Inc. 550 22<br />
Sotheby's 75 1<br />
Tempur-Pedic International,<br />
Inc. 100 1<br />
* True Religion Apparel, Inc. 1,700 21<br />
(m) Tupperware Brands Corp. 25 0<br />
(m)* The Warnaco Group, Inc. 25 0<br />
* Zumiez, Inc. 2,700 20<br />
Total 777<br />
Consumer Staples (0.1%)<br />
(m)* AgFeed Industries, Inc. 250 0<br />
Alberto-Culver Co. 1,900 47<br />
* Central European Distribution<br />
Corp. 1,000 20<br />
(m)* Darling International, Inc. 100 0<br />
Flowers Foods, Inc. 2,000 49<br />
* TreeHouse Foods, Inc. 900 24<br />
Total 140<br />
Domestic Common Stocks and<br />
Warrants (32.8%)<br />
Energy (0.1%)<br />
Shares/<br />
$ Par<br />
Value<br />
$ (000's)<br />
* Arena Resources, Inc. 1,800 51<br />
(m)* ATP Oil & Gas Corp. 75 0<br />
Berry Petroleum Co. 75 1<br />
(m)* Bill Barrett Corp. 25 0<br />
* Carrizo Oil & Gas, Inc. 1,325 21<br />
* Contango Oil & Gas Co. 600 34<br />
Crosstex Energy, Inc. 225 1<br />
(m)* Dril-Quip, Inc. 25 0<br />
Energy XXI, Ltd. 825 1<br />
* EXCO Resources, Inc. 2,600 24<br />
(m)* Gasco Energy, Inc. 900 0<br />
(m) General Maritime Corp. 50 0<br />
* IHS, Inc. - Class A 900 34<br />
* ION Geophysical Corp. 4,900 17<br />
(m)* McMoRan Exploration Co. 50 0<br />
* Oceaneering International, Inc. 700 20<br />
* Parker Drilling Co. 200 1<br />
Penn Virginia Corp. 25 1<br />
* PetroQuest Energy, Inc. 100 1<br />
Ship Finance International,<br />
Ltd. 50 1<br />
(m)* Stone Energy Corp. 50 0<br />
* T-3 Energy Services, Inc. 1,400 13<br />
* Whiting Petroleum Corp. 1,100 37<br />
* Willbros Group, Inc. 75 1<br />
Total 259<br />
Financials (0.3%)<br />
Boston Private Financial<br />
Holdings, Inc. 6,600 45<br />
Digital Realty Trust, Inc. 1,400 46<br />
* Encore Bancshares, Inc. 961 10<br />
(m)* FCStone Group, Inc. 125 0<br />
GFI Group, Inc. 175 1<br />
* Investment Technology<br />
Group, Inc. 13,300 302<br />
* KBW, Inc. 1,291 30<br />
MFA Mortgage Investments,<br />
Inc. 10,300 61<br />
optionsXpress Holdings, Inc. 50 1<br />
* Portfolio Recovery Associates,<br />
Inc. 350 12<br />
Total 508<br />
Health Care (0.6%)<br />
* Affymetrix, Inc. 225 1<br />
*Alkermes, Inc. 50 1<br />
* athenahealth, Inc. 1,350 51<br />
* BioMarin Pharmaceutical, Inc. 3,100 55<br />
* CardioNet, Inc. 1,400 35<br />
* Genoptix, Inc. 2,208 75<br />
* Illumina, Inc. 2,400 63<br />
* IPC The Hospitalist Co. 1,150 19<br />
(m)* K-V Pharmaceutical Co. -<br />
Class A 100 0<br />
* Masimo Corp. 3,564 106<br />
The Accompanying Notes are an Integral Part of the Financial Statements.<br />
Asset Allocation Portfolio 171
Asset Allocation Portfolio<br />
Domestic Common Stocks and<br />
Warrants (32.8%)<br />
Shares/<br />
$ Par<br />
Value<br />
$ (000's)<br />
Health Care continued<br />
Meridian Bioscience, Inc. 2,900 74<br />
* NuVasive, Inc. 1,200 42<br />
* PAREXEL International Corp. 75 1<br />
* Phase Forward, Inc. 3,145 39<br />
* Psychiatric Solutions, Inc. 23,500 654<br />
* Thoratec Corp. 1,600 52<br />
* United Therapeutics Corp. 200 12<br />
Total 1,280<br />
Industrials (0.5%)<br />
(m)* AAR Corp. 25 0<br />
(m) Actuant Corp. 25 0<br />
Acuity Brands, Inc. 25 1<br />
* Aerovironment, Inc. 900 33<br />
* Allegiant Travel Co. 350 17<br />
* Astec Industries, Inc. 550 17<br />
* Astronics Corp. 3,777 34<br />
* Axsys Technologies, Inc. 382 21<br />
(m) Belden, Inc. 25 0<br />
Bucyrus International, Inc. 1,100 20<br />
(m)* Chart Industries, Inc. 50 0<br />
* Cornell Cos., Inc. 3,400 63<br />
Deluxe Corp. 50 1<br />
(m) Eagle Bulk Shipping, Inc. 75 0<br />
* EMCOR Group, Inc. 25 1<br />
* Energy Recovery, Inc. 1,233 9<br />
(m)* EnerSys 50 0<br />
* Flow International Corp. 300 1<br />
* Force Protection, Inc. 125 1<br />
Genco Shipping & Trading,<br />
Ltd. 50 1<br />
* GrafTech International, Ltd. 75 1<br />
* Hawaiian Holdings, Inc. 125 1<br />
Herman Miller, Inc. 50 1<br />
* Hexcel Corp. 75 1<br />
* Hill International, Inc. 1,700 12<br />
* Hub Group, Inc. - Class A 1,750 46<br />
* Huron Consulting Group, Inc. 1,000 57<br />
* ICF International, Inc. 2,050 50<br />
Kaydon Corp. 900 31<br />
Knight Transportation, Inc. 24,899 401<br />
Knoll, Inc. 75 1<br />
* Korn/Ferry International 50 1<br />
* Perini Corp. 25 1<br />
* Stanley, Inc. 1,950 71<br />
* TBS International, Ltd. - Class<br />
A 75 1<br />
* Team, Inc. 3,600 100<br />
* Titan Machinery, Inc. 2,450 34<br />
* TransDigm Group, Inc. 1,600 54<br />
Total 1,084<br />
Information Technology (0.6%)<br />
* Advanced Energy Industries,<br />
Inc. 3,741 37<br />
* Amkor Technology, Inc. 300 1<br />
* Atheros Communications, Inc. 2,000 29<br />
* Bankrate, Inc. 1,779 68<br />
Domestic Common Stocks and<br />
Warrants (32.8%)<br />
Shares/<br />
$ Par<br />
Value<br />
$ (000's)<br />
Information Technology continued<br />
* Blackboard, Inc. 800 21<br />
* comScore, Inc. 2,099 27<br />
* Comtech Telecommunications<br />
Corp. 400 18<br />
* Concur Technologies, Inc. 1,250 41<br />
* CyberSource Corp. 2,200 26<br />
* DG Fastchannel, Inc. 3,000 37<br />
* Diodes, Inc. 4,600 28<br />
* EarthLink, Inc. 100 1<br />
* F5 Networks, Inc. 2,000 46<br />
* Harmonic, Inc. 100 1<br />
* Infinera Corp. 75 1<br />
* j2 Global Communications,<br />
Inc. 950 19<br />
* Mellanox Technologies, Ltd. 4,100 32<br />
* Netlogic Microsystems, Inc. 2,500 55<br />
* NeuStar, Inc. - Class A 16,900 323<br />
* Novatel Wireless, Inc. 150 1<br />
* Omniture, Inc. 4,200 45<br />
* OmniVision Technologies,<br />
Inc. 125 1<br />
* PMC-Sierra, Inc. 125 1<br />
* Rubicon Technology, Inc. 2,401 10<br />
(m)* Sigma Designs, Inc. 50 0<br />
(m)* Skyworks Solutions, Inc. 100 0<br />
* Switch and Data Facilities Co.,<br />
Inc. 6,132 45<br />
* Synchronoss Technologies,<br />
Inc. 5,000 53<br />
* Take-Two Interactive<br />
Software, Inc. 75 1<br />
* TeleTech Holdings, Inc. 75 1<br />
* TiVo, Inc. 100 1<br />
* TriQuint Semiconductor, Inc. 13,800 47<br />
* VanceInfo Technologies, Inc.,<br />
ADR 9,950 47<br />
* VistaPrint, Ltd. 3,500 65<br />
* Vocus, Inc. 2,100 38<br />
Total 1,167<br />
Materials (0.1%)<br />
(m)* Apex Silver Mines, Ltd. 450 0<br />
* Calgon Carbon Corp. 3,300 51<br />
* Flotek Industries, Inc. 250 1<br />
Silgan Holdings, Inc. 1,250 60<br />
* W.R. Grace & Co. 100 1<br />
(m) Worthington Industries, Inc. 50 0<br />
Total 113<br />
Other Holdings (0.1%)<br />
Financial Select Sector SPDR<br />
Fund 3,050 38<br />
iShares Nasdaq Biotechnology<br />
Index Fund 650 46<br />
SPDR Metals & Mining 4,600 128<br />
Total 212<br />
The Accompanying Notes are an Integral Part of the Financial Statements.<br />
172 Asset Allocation Portfolio
Asset Allocation Portfolio<br />
Domestic Common Stocks and<br />
Warrants (32.8%)<br />
Shares/<br />
$ Par<br />
Value<br />
$ (000's)<br />
Telecommunication Services (0.0%)<br />
* Centennial Communications<br />
Corp. 4,800 39<br />
Total 39<br />
Utilities (0.1%)<br />
ITC Holdings Corp. 2,200 96<br />
Total 96<br />
Total Small Cap Common Stocks 5,675<br />
Total Domestic Common Stocks and Warrants<br />
(Cost: $88,715) 65,390<br />
Foreign Common Stocks<br />
(11.7%) Country<br />
Consumer Discretionary (0.6%)<br />
Bridgestone Corp. Japan 1,800 27<br />
Compass Group PLC United<br />
Kingdom 34,745 175<br />
Denso Corp. Japan 1,900 32<br />
Fast Retailing Co., Ltd. Japan 200 29<br />
Grupo Televisa SA, ADR Mexico 12,400 185<br />
Hennes & Mauritz AB - B<br />
Shares Sweden 3,717 147<br />
Honda Motor Co., Ltd. Japan 2,900 63<br />
Kingfisher PLC<br />
United<br />
Kingdom 38,970 77<br />
Next PLC<br />
United<br />
Kingdom 3,410 54<br />
Oriental Land Co., Ltd. Japan 400 33<br />
Panasonic Corp. Japan 4,000 50<br />
Reed Elsevier PLC United<br />
Kingdom 5,170 38<br />
Sekisui House, Ltd. Japan 2,000 17<br />
Toyota Industries Corp. Japan 1,200 26<br />
Vivendi France 7,790 255<br />
Yamada Denki Co., Ltd. Japan 320 22<br />
Yamaha Motor Co., Ltd. Japan 2,300 24<br />
Total 1,254<br />
Consumer Staples (1.3%)<br />
Aeon Co., Ltd. Japan 2,600 26<br />
Ajinomoto Co., Inc. Japan 2,000 22<br />
Asahi Breweries, Ltd. Japan 1,400 24<br />
British American Tobacco<br />
PLC<br />
United<br />
Kingdom 4,511 119<br />
Cadbury PLC<br />
United<br />
Kingdom 4,720 42<br />
Imperial Tobacco Group PLC United<br />
Kingdom 4,225 115<br />
ITC, Ltd. India 14,693 52<br />
Japan Tobacco, Inc. Japan 9 30<br />
Kao Corp. Japan 2,000 61<br />
Kerry Group PLC - Class A Ireland 5,949 109<br />
Kirin Holdings Co., Ltd. Japan 2,000 26<br />
Koninklijke Ahold NV Netherlands 7,025 87<br />
* KT&G Corp. South Korea 1,610 100<br />
Lawson, Inc. Japan 500 29<br />
Foreign Common Stocks<br />
(11.7%) Country<br />
Shares/<br />
$ Par<br />
Value<br />
$ (000's)<br />
Consumer Staples continued<br />
Nestle SA Switzerland 12,240 481<br />
Pernod-Ricard SA France 1,685 126<br />
Reckitt Benckiser Group PLC United<br />
Kingdom 2,945 111<br />
Seven & I Holdings Co., Ltd. Japan 1,500 51<br />
Shiseido Co., Ltd. Japan 1,000 20<br />
Shoppers Drug Mart Corp. Canada 5,975 236<br />
Tesco PLC<br />
United<br />
Kingdom 20,145 107<br />
Unilever NV Netherlands 10,030 244<br />
UNY Co., Ltd. Japan 3,000 33<br />
Wal-Mart de Mexico SAB de<br />
CV Mexico 46,100 124<br />
Woolworths, Ltd. Australia 10,270 196<br />
Total 2,571<br />
Energy (1.2%)<br />
*Artumas Group, Inc. Norway 15,020 6<br />
BG Group PLC<br />
United<br />
Kingdom 3,220 45<br />
BP PLC<br />
United<br />
Kingdom 55,620 433<br />
CNOOC, Ltd. Hong Kong 175,000 166<br />
Eni SPA Italy 15,200 362<br />
INPEX Corp. Japan 3 24<br />
Nexen, Inc. Canada 13,440 237<br />
Oil Search, Ltd. Australia 30,075 100<br />
Petroleo Brasileiro SA, ADR Brazil 9,300 228<br />
Reliance Industries, Ltd. India 5,848 149<br />
Royal Dutch Shell PLC -<br />
Class A<br />
United<br />
Kingdom 15,085 400<br />
Saipem SPA Italy 9,890 167<br />
Seadrill, Ltd. Norway 4,400 36<br />
Suncor Energy, Inc. Canada 7,005 137<br />
Total 2,490<br />
Financials (2.3%)<br />
Allianz SE Germany 868 93<br />
AXA SA France 4,677 105<br />
Banco Espirito Santo SA Portugal 9,975 94<br />
Banco Santander SA Spain 27,550 267<br />
The Bank of Yokohama, Ltd. Japan 3,000 18<br />
BNP Paribas France 4,520 192<br />
Cathay Financial Holding Co.,<br />
Ltd. Taiwan 70,200 79<br />
Cheung Kong Holdings, Ltd. Hong Kong 6,000 57<br />
China Life Insurance Co., Ltd. China 32,000 99<br />
China Overseas Land &<br />
Investment, Ltd. Hong Kong 44,000 62<br />
(n)*China Overseas Land &<br />
Investment, Ltd. - Rights Hong Kong 1,760 1<br />
The Chugoku Bank, Ltd. Japan 1,000 15<br />
Credit Suisse Group AG Switzerland 4,205 115<br />
Daito Trust Construction Co.,<br />
Ltd. Japan 300 16<br />
Erste Group Bank AG Austria 2,900 68<br />
Hang Seng Bank, Ltd. Hong Kong 8,300 110<br />
Housing Development Finance<br />
Corp., Ltd. India 5,624 176<br />
The Accompanying Notes are an Integral Part of the Financial Statements.<br />
Asset Allocation Portfolio 173
Asset Allocation Portfolio<br />
Foreign Common Stocks<br />
(11.7%) Country<br />
Financials continued<br />
HSBC Holdings PLC, ADR<br />
Shares/<br />
$ Par<br />
Value<br />
$ (000's)<br />
United<br />
Kingdom 5,800 282<br />
Industrial and Commercial<br />
Bank of China, Ltd. - Class<br />
H China 341,000 181<br />
Intesa Sanpaolo Italy 36,505 132<br />
Julius Baer Holding AG Switzerland 4,630 178<br />
Man Group PLC<br />
United<br />
Kingdom 11,765 41<br />
Manulife Financial Corp. Canada 10,020 171<br />
Mitsubishi Estate Co., Ltd. Japan 2,000 33<br />
Mitsubishi UFJ Financial<br />
Group, Inc. Japan 16,600 103<br />
Mitsui Fudosan Co., Ltd. Japan 1,000 17<br />
Mizuho Financial Group, Inc. Japan 21 62<br />
Muenchener<br />
Rueckversicherungs-<br />
Gesellschaft AG Germany 525 83<br />
National Bank of Greece SA Greece 3,165 59<br />
Nomura Real Estate Holdings,<br />
Inc. Japan 900 18<br />
Piraeus Bank SA Greece 5,854 53<br />
QBE Insurance Group, Ltd. Australia 5,115 95<br />
Resona Holdings, Inc. Japan 12 19<br />
Samsung Fire & Marine<br />
Insurance Co., Ltd. South Korea 1,443 219<br />
Societe Generale France 1,480 75<br />
Sompo Japan Insurance, Inc. Japan 2,000 15<br />
Sony Financial Holdings, Inc. Japan 9 34<br />
Standard Chartered PLC United<br />
Kingdom 4,045 52<br />
Sumitomo Mitsui Financial<br />
Group, Inc. Japan 15 65<br />
The Sumitomo Trust and<br />
Banking Co., Ltd. Japan 4,000 24<br />
T&D Holdings, Inc. Japan 700 29<br />
TAG Tegernsee Immobilien<br />
und Beteiligungs AG Germany 9,926 28<br />
Tokio Marine Holdings, Inc. Japan 1,400 41<br />
The Toronto-Dominion Bank Canada 6,570 235<br />
* Turkiye Garanti Bankasi AS Turkey 27,508 47<br />
Unicredit SPA Italy 41,985 105<br />
Westpac Banking Corp. Australia 14,086 171<br />
Zurich Financial Services AG Switzerland 1,600 346<br />
Total 4,580<br />
Health Care (1.4%)<br />
* Actelion, Ltd. Switzerland 1,135 64<br />
Astellas Pharma, Inc. Japan 1,000 41<br />
CSL, Ltd. Australia 10,307 248<br />
Daiichi Sankyo Co., Ltd. Japan 1,500 36<br />
Eisai Co., Ltd. Japan 800 33<br />
Fresenius Medical Care AG &<br />
Co. KGaA Germany 3,872 182<br />
Hisamitsu Pharmaceutical Co.,<br />
Inc. Japan 500 20<br />
Novartis AG Switzerland 8,930 446<br />
Novo Nordisk A/S Denmark 2,141 109<br />
Roche Holding AG Switzerland 2,930 450<br />
Synthes, Inc. Switzerland 965 122<br />
Foreign Common Stocks<br />
(11.7%) Country<br />
Shares/<br />
$ Par<br />
Value<br />
$ (000's)<br />
Health Care continued<br />
Takeda Pharmaceutical Co.,<br />
Ltd. Japan 1,200 62<br />
Terumo Corp. Japan 400 19<br />
Teva Pharmaceutical<br />
Industries, Ltd., ADR Israel 22,000 937<br />
Total 2,769<br />
Industrials (1.1%)<br />
ABB, Ltd., ADR Switzerland 9,150 137<br />
All Nippon Airways Co., Ltd. Japan 3,000 12<br />
Alstom SA France 2,650 157<br />
Asahi Glass Co., Ltd. Japan 4,000 23<br />
*BAE Systems PLC United<br />
Kingdom 54,975 304<br />
Balfour Beatty PLC United<br />
Kingdom 9,645 47<br />
Central Japan Railway Co. Japan 4 35<br />
Chemring Group PLC United<br />
Kingdom 4,520 129<br />
China Railway Construction<br />
Corp. - Class H China 63,000 95<br />
ComfortDelGro Corp., Ltd. Singapore 45,000 46<br />
Companhia de Concessoes<br />
Rodoviarias Brazil 7,200 74<br />
Dai Nippon Printing Co., Ltd. Japan 2,000 22<br />
East Japan Railway Co. Japan 7 55<br />
Fanuc, Ltd. Japan 400 28<br />
IHI Corp. Japan 15,000 19<br />
Itochu Corp. Japan 6,000 30<br />
The Japan Steel Works, Ltd. Japan 2,000 28<br />
JTEKT Corp. Japan 3,600 28<br />
Kamigumi Co., Ltd. Japan 2,000 18<br />
Keio Corp. Japan 5,000 30<br />
Kintetsu Corp. Japan 6,000 28<br />
Komatsu, Ltd. Japan 2,900 37<br />
*LG Corp. South Korea 3,235 113<br />
Marubeni Corp. Japan 8,000 30<br />
Mitsubishi Corp. Japan 2,800 39<br />
Mitsubishi Electric Corp. Japan 4,000 25<br />
Mitsubishi Heavy Industries,<br />
Ltd. Japan 8,000 36<br />
Mitsui & Co., Ltd. Japan 5,000 51<br />
Mitsui OSK Lines, Ltd. Japan 5,000 31<br />
*Morphic Technologies AB Sweden 58,066 10<br />
Nippon Yusen Kabushiki<br />
Kaisha Japan 5,000 31<br />
Secom Co., Ltd. Japan 800 41<br />
Serco Group PLC<br />
United<br />
Kingdom 19,690 130<br />
SMC Corp. Japan 200 20<br />
Sumitomo Corp. Japan 2,800 25<br />
Tokyu Corp. Japan 4,000 20<br />
Toppan Printing Co., Ltd. Japan 2,000 15<br />
Vinci SA France 2,250 95<br />
West Japan Railway Co. Japan 6 27<br />
Yamato Holdings Co., Ltd. Japan 1,000 13<br />
Total 2,134<br />
The Accompanying Notes are an Integral Part of the Financial Statements.<br />
174 Asset Allocation Portfolio
Asset Allocation Portfolio<br />
Foreign Common Stocks<br />
(11.7%) Country<br />
Shares/<br />
$ Par<br />
Value<br />
$ (000's)<br />
Information Technology (0.5%)<br />
* Autonomy Corp. PLC United<br />
Kingdom 18,997 265<br />
Canon, Inc. Japan 2,000 63<br />
EVS Broadcast Equipment SA Belgium 1,650 59<br />
Fujitsu, Ltd. Japan 6,000 29<br />
* Gresham Computing PLC United<br />
Kingdom 36,400 20<br />
Hitachi, Ltd. Japan 8,000 31<br />
Hoya Corp. Japan 2,100 36<br />
Kontron AG Germany 8,130 85<br />
NEC Corp. Japan 9,000 30<br />
Nintendo Co., Ltd. Japan 200 77<br />
Ricoh Co., Ltd. Japan 2,000 25<br />
Samsung Electronics Co., Ltd. South Korea 422 153<br />
* Temenos Group AG Switzerland 15,563 207<br />
Total 1,080<br />
Materials (1.0%)<br />
Angang Steel Co., Ltd. China 84,000 95<br />
Anglo American PLC United<br />
Kingdom 4,519 105<br />
* Anhui Conch Cement Co.,<br />
Ltd. China 16,000 74<br />
Asahi Kasei Corp. Japan 8,000 35<br />
BHP Billiton, Ltd. Australia 9,755 209<br />
Companhia Vale do Rio Doce,<br />
ADR Brazil 9,435 114<br />
Givaudan SA Switzerland 60 47<br />
Goldcorp, Inc. Canada 8,875 280<br />
Huabao International<br />
Holdings, Ltd. Hong Kong 155,000 102<br />
* Intex Resources ASA Norway 63,255 12<br />
JFE Holdings, Inc. Japan 1,200 32<br />
K+S AG Germany 3,332 192<br />
Mitsubishi Chemical Holdings<br />
Corp. Japan 5,000 22<br />
Mitsubishi Materials Corp. Japan 8,000 20<br />
Nippon Steel Corp. Japan 11,000 36<br />
POSCO South Korea 214 63<br />
Potash Corp. of Saskatchewan,<br />
Inc. Canada 2,580 189<br />
Rio Tinto PLC, ADR United<br />
Kingdom 575 51<br />
Shin-Etsu Chemical Co., Ltd. Japan 800 37<br />
Sumitomo Metal Industries,<br />
Ltd. Japan 8,000 20<br />
Syngenta AG Switzerland 988 191<br />
Total 1,926<br />
Other Holdings (0.5%)<br />
Hang Seng Investment Index<br />
Funds Series - H-Share Hong Kong 11,800 123<br />
iShares MSCI Hong Kong<br />
Index Fund Hong Kong 23,416 243<br />
iShares MSCI Japan Index<br />
Fund Japan 6,730 65<br />
iShares MSCI Singapore<br />
Index Fund Singapore 26,506 187<br />
Foreign Common Stocks<br />
(11.7%) Country<br />
Shares/<br />
$ Par<br />
Value<br />
$ (000's)<br />
Other Holdings continued<br />
iShares MSCI South Korea<br />
Index Fund South Korea 4,184 117<br />
iShares MSCI Taiwan Index<br />
Fund Taiwan 25,098 190<br />
Total 925<br />
Telecommunication Services (1.0%)<br />
*Bharti Airtel, Ltd. India 3,657 54<br />
China Mobile, Ltd. Hong Kong 5,000 51<br />
Chunghwa Telecom Co., Ltd. Taiwan 150,040 240<br />
Deutsche Telekom AG Germany 16,914 258<br />
France Telecom SA France 6,663 187<br />
KDDI Corp. Japan 6 43<br />
Koninklijke (Royal) KPN NV Netherlands 21,511 313<br />
Nippon Telegraph and<br />
Telephone Corp. Japan 10 54<br />
NTT DoCoMo, Inc. Japan 25 49<br />
SOFTBANK Corp. Japan 1,200 22<br />
Telefonica SA Spain 17,426 392<br />
Turkcell Iletisim Hizmetleri<br />
AS Turkey 12,793 74<br />
Vodafone Group PLC United<br />
Kingdom 130,733 267<br />
Total 2,004<br />
Utilities (0.8%)<br />
Centrica PLC<br />
United<br />
Kingdom 20,545 80<br />
CEZ Czech Republic 1,675 68<br />
Chubu Electric Power Co.,<br />
Inc. Japan 1,400 43<br />
The Chugoku Electric Power<br />
Co., Inc. Japan 1,000 26<br />
E.ON AG Germany 3,270 133<br />
Electricite de France France 1,600 93<br />
Enagas Spain 5,555 123<br />
GDF Suez France 7,245 361<br />
Hokuriku Electric Power Co. Japan 600 17<br />
The Kansai Electric Power<br />
Co., Inc. Japan 1,500 43<br />
Kyushu Electric Power Co.,<br />
Inc. Japan 1,200 32<br />
National Grid PLC<br />
United<br />
Kingdom 12,450 125<br />
Osaka Gas Co., Ltd. Japan 7,000 32<br />
PT Perusahaan Gas Negara Indonesia 345,000 62<br />
RWE AG Germany 1,660 150<br />
Shikoku Electric Power Co.,<br />
Inc. Japan 700 24<br />
Toho Gas Co., Ltd. Japan 4,000 26<br />
Tohoku Electric Power Co.,<br />
Inc. Japan 1,200 33<br />
The Tokyo Electric Power<br />
Co., Inc. Japan 2,000 67<br />
Tokyo Gas Co., Ltd. Japan 6,000 30<br />
Total 1,568<br />
Total Foreign Common Stocks (Cost: $32,626) 23,301<br />
The Accompanying Notes are an Integral Part of the Financial Statements.<br />
Asset Allocation Portfolio 175
Asset Allocation Portfolio<br />
Investment Grade Segment (8.2%)<br />
Shares/<br />
$ Par<br />
Value<br />
$ (000's)<br />
Aerospace/Defense (0.2%)<br />
BAE Systems Holdings, Inc.,<br />
5.20%, 8/15/15 144A 15,000 14<br />
General Dynamics Corp., 4.25%, 5/15/13 55,000 55<br />
Raytheon Co., 5.50%, 11/15/12 305,000 308<br />
Total 377<br />
Auto Manufacturing (0.1%)<br />
Daimler Finance North America LLC,<br />
5.75%, 5/18/09 155,000 150<br />
Daimler Finance North America LLC,<br />
8.50%, 1/18/31 20,000 15<br />
Total 165<br />
Banking (1.7%)<br />
American Express Bank, FSB, 3.15%, 12/9/11 140,000 141<br />
BA Covered Bond Issuer, 5.50%, 6/14/12 144A 195,000 201<br />
Bank of America Corp., 5.65%, 5/1/18 145,000 146<br />
Bank of America Corp., 8.125%, 12/29/49 110,000 82<br />
The Bank of New York Mellon Corp.,<br />
4.95%, 11/1/12 15,000 15<br />
Bank One Corp., 5.25%, 1/30/13 235,000 229<br />
Barclays Bank PLC, 6.05%, 12/4/17 144A 15,000 13<br />
The Bear Stearns Companies LLC,<br />
7.25%, 2/1/18 25,000 27<br />
Citigroup Capital XXI, 8.3%, 12/21/57 10,000 8<br />
Citigroup, Inc., 5.125%, 5/5/14 120,000 113<br />
Citigroup, Inc., 8.40%, 4/29/49 85,000 56<br />
Countrywide Financial Corp., 5.80%, 6/7/12 40,000 39<br />
Countrywide Home Loans, Inc.,<br />
4.00%, 3/22/11 55,000 52<br />
Countrywide Home Loans, Inc.,<br />
4.125%, 9/15/09 15,000 15<br />
Credit Suisse Guernsey, Ltd., 5.86%, 5/29/49 5,000 2<br />
Credit Suisse/New York NY, 6.00%, 2/15/18 10,000 9<br />
Deutsche Bank Capital Funding Trust VII,<br />
5.628%, 1/19/49 144A 60,000 26<br />
Fifth Third Bancorp, 8.25%, 3/1/38 25,000 21<br />
The Goldman Sachs Group, Inc.,<br />
5.15%, 1/15/14 180,000 162<br />
HSBC USA, Inc., 3.125%, 12/16/11 140,000 145<br />
JPMorgan Chase & Co., 4.75%, 3/1/15 5,000 5<br />
JPMorgan Chase & Co., 7.90%, 4/29/49 85,000 71<br />
(d) Lehman Brothers Holdings, Inc.,<br />
5.50%, 4/4/16 35,000 3<br />
(d) Lehman Brothers Holdings, Inc.,<br />
6.875%, 5/2/18 25,000 2<br />
M&I Marshall & Ilsley Bank, 5.25%, 9/4/12 250,000 225<br />
Mellon Funding Corp., 6.375%, 2/15/10 260,000 265<br />
Merrill Lynch & Co., 6.22%, 9/15/26 20,000 19<br />
Merrill Lynch & Co., 6.40%, 8/28/17 120,000 120<br />
Morgan Stanley, 2.00%, 9/22/11 140,000 141<br />
Morgan Stanley, 5.375%, 10/15/15 100,000 86<br />
Morgan Stanley, 6.25%, 8/9/26 50,000 41<br />
Northern Trust Corp., 5.30%, 8/29/11 45,000 46<br />
Pemex Project Funding Master Trust,<br />
6.625%, 6/15/35 144A 15,000 13<br />
State Street Bank and Trust Co.,<br />
5.30%, 1/15/16 250,000 244<br />
SunTrust Bank, 3.00%, 11/16/11 140,000 145<br />
UBS AG/Stamford Branch, 5.75%, 4/25/18 100,000 91<br />
UnionBanCal Corp., 5.25%, 12/16/13 50,000 43<br />
Wachovia Corp., 5.35%, 3/15/11 175,000 167<br />
Wachovia Corp., 7.98%, 2/28/49 40,000 34<br />
Wells Fargo Capital XIII, 7.70%, 12/29/49 125,000 103<br />
Shares/<br />
$ Par<br />
Value<br />
$ (000's)<br />
Investment Grade Segment (8.2%)<br />
Banking continued<br />
Zions Bancorporation, 5.50%, 11/16/15 125,000 88<br />
Total 3,454<br />
Beverage/Bottling (0.3%)<br />
Anheuser-Busch Companies, Inc.,<br />
4.50%, 4/1/18 5,000 4<br />
Anheuser-Busch Companies, Inc.,<br />
5.75%, 4/1/36 15,000 12<br />
Bottling Group LLC, 4.625%, 11/15/12 35,000 35<br />
Bottling Group LLC, 5.50%, 4/1/16 65,000 65<br />
The Coca-Cola Co., 5.35%, 11/15/17 50,000 54<br />
Diageo Capital PLC, 4.375%, 5/3/10 45,000 45<br />
Dr. Pepper Snapple Group, Inc.,<br />
6.82%, 5/1/18 144A 35,000 34<br />
Dr. Pepper Snapple Group, Inc.,<br />
7.45%, 5/1/38 144A 30,000 30<br />
PepsiCo, Inc., 4.65%, 2/15/13 30,000 31<br />
PepsiCo, Inc., 5.00%, 6/1/18 20,000 21<br />
PepsiCo, Inc., 7.90%, 11/1/18 40,000 49<br />
SABMiller PLC, 6.20%, 7/1/11 144A 155,000 154<br />
Total 534<br />
Building Products (0.0%)<br />
CRH America, Inc., 6.00%, 9/30/16 40,000 25<br />
CRH America, Inc., 8.125%, 7/15/18 50,000 36<br />
Total 61<br />
Cable/Media/Broadcasting/Satellite (0.3%)<br />
CBS Corp., 6.625%, 5/15/11 25,000 22<br />
Comcast Corp., 5.90%, 3/15/16 115,000 110<br />
Comcast Corp., 6.40%, 5/15/38 40,000 40<br />
Comcast Corp., 6.50%, 11/15/35 15,000 15<br />
Cox Communications, Inc., 4.625%, 1/15/10 45,000 44<br />
Historic TW, Inc., 6.625%, 5/15/29 90,000 80<br />
Historic TW, Inc., 6.875%, 6/15/18 10,000 9<br />
News America, Inc., 6.15%, 3/1/37 40,000 37<br />
Rogers Cable, Inc., 6.25%, 6/15/13 10,000 10<br />
TCI Communications, Inc., 8.75%, 8/1/15 60,000 64<br />
Time Warner Cable, Inc., 5.40%, 7/2/12 40,000 37<br />
Time Warner Cable, Inc., 6.75%, 7/1/18 10,000 10<br />
Time Warner Cable, Inc., 8.75%, 2/14/19 25,000 27<br />
Time Warner Entertainment Co. LP,<br />
8.375%, 3/15/23 55,000 55<br />
Viacom, Inc., 5.75%, 4/30/11 65,000 59<br />
Viacom, Inc., 6.125%, 10/5/17 10,000 8<br />
Total 627<br />
Conglomerate/Diversified Manufacturing<br />
(0.0%)<br />
The Dow Chemical Co., 5.70%, 5/15/18 5,000 5<br />
Monsanto Co., 5.125%, 4/15/18 5,000 5<br />
United Technologies Corp., 6.35%, 3/1/11 60,000 63<br />
Total 73<br />
Consumer Products (0.0%)<br />
Colgate-Palmolive Co., 4.20%, 5/15/13 15,000 15<br />
Fortune Brands, Inc., 5.375%, 1/15/16 35,000 29<br />
The Procter & Gamble Co., 5.55%, 3/5/37 40,000 45<br />
Total 89<br />
Electric Utilities (1.8%)<br />
Bruce Mansfield Unit, 6.85%, 6/1/34 30,000 26<br />
Carolina Power & Light, Inc., 5.15%, 4/1/15 25,000 25<br />
Carolina Power & Light, Inc., 6.50%, 7/15/12 20,000 20<br />
The Accompanying Notes are an Integral Part of the Financial Statements.<br />
176 Asset Allocation Portfolio
Asset Allocation Portfolio<br />
Shares/<br />
$ Par<br />
Value<br />
$ (000's)<br />
Investment Grade Segment (8.2%)<br />
Electric Utilities continued<br />
CenterPoint Energy Houston Electric LLC,<br />
5.70%, 3/15/13 15,000 14<br />
CenterPoint Energy Houston Electric LLC,<br />
6.95%, 3/15/33 15,000 14<br />
CenterPoint Energy, Inc., 6.50%, 5/1/18 20,000 16<br />
CMS Energy Corp., 6.875%, 12/15/15 100,000 85<br />
Connecticut Light and Power Co.,<br />
5.65%, 5/1/18 10,000 10<br />
Consolidated Edison Co. of New York, Inc.,<br />
5.375%, 12/15/15 30,000 29<br />
Consolidated Edison Co. of New York, Inc.,<br />
5.50%, 9/15/16 35,000 35<br />
Consolidated Natural Gas Co., 5.00%, 12/1/14 130,000 119<br />
Consumers Energy Co., 4.80%, 2/17/09 310,000 309<br />
Dominion Resources, Inc., 6.00%, 11/30/17 10,000 10<br />
Dominion Resources, Inc., 6.40%, 6/15/18 5,000 5<br />
DTE Energy Co., 7.05%, 6/1/11 380,000 376<br />
Duke Energy Carolinas LLC, 6.45%, 10/15/32 100,000 106<br />
Duquesne Light Holdings, Inc., 5.50%, 8/15/15 55,000 46<br />
Entergy Louisiana LLC, 6.50%, 9/1/18 25,000 24<br />
Entergy Mississippi, Inc., 6.25%, 4/1/34 55,000 47<br />
Exelon Generation Co. LLC, 6.20%, 10/1/17 60,000 52<br />
Florida Power & Light Co., 5.625%, 4/1/34 15,000 16<br />
Florida Power Corp., 4.50%, 6/1/10 178,000 176<br />
Florida Power Corp., 6.40%, 6/15/38 20,000 22<br />
Indiana Michigan Power Co., 5.05%, 11/15/14 160,000 144<br />
Kiowa Power Partners LLC,<br />
4.811%, 12/30/13 144A 47,258 44<br />
Kiowa Power Partners LLC,<br />
5.737%, 3/30/21 144A 100,000 77<br />
MidAmerican Energy Holdings Co.,<br />
5.95%, 5/15/37 15,000 14<br />
Monongahela Power Co., 5.70%, 3/15/17 144A 45,000 38<br />
Nevada Power Co., 5.875%, 1/15/15 115,000 110<br />
Nevada Power Co., 5.95%, 3/15/16 10,000 10<br />
Northern States Power Co., 5.25%, 10/1/18 15,000 15<br />
Ohio Edison Co., 6.875%, 7/15/36 5,000 5<br />
Oncor Electric Delivery Co., 6.375%, 1/15/15 75,000 72<br />
Oncor Electric Delivery Co., 7.00%, 9/1/22 15,000 14<br />
Pacific Gas & Electric Co., 5.80%, 3/1/37 15,000 16<br />
Pacific Gas & Electric Co., 6.05%, 3/1/34 25,000 27<br />
PacifiCorp, 5.45%, 9/15/13 240,000 245<br />
PacifiCorp, 5.75%, 4/1/37 55,000 54<br />
Potomac Electric Power Co., 6.50%, 11/15/37 5,000 5<br />
PPL Electric Utilities Corp., 4.30%, 6/1/13 125,000 117<br />
PPL Electric Utilities Corp., 6.25%, 8/15/09 10,000 10<br />
PPL Energy Supply LLC, 6.00%, 12/15/36 25,000 16<br />
PPL Energy Supply LLC, 6.50%, 5/1/18 20,000 16<br />
Progress Energy, Inc., 6.85%, 4/15/12 60,000 60<br />
Public Service Co. of Colorado, 5.50%, 4/1/14 110,000 104<br />
Public Service Electric & Gas Co.,<br />
5.00%, 1/1/13 100,000 98<br />
Public Service Electric & Gas Co.,<br />
5.70%, 12/1/36 95,000 88<br />
Puget Sound Energy, Inc., 6.274%, 3/15/37 60,000 53<br />
San Diego Gas & Electric Co.,<br />
5.30%, 11/15/15 15,000 15<br />
San Diego Gas & Electric Co.,<br />
6.125%, 9/15/37 10,000 11<br />
SCANA Corp., 6.25%, 4/1/20 20,000 18<br />
Sierra Pacific Power Co., 6.75%, 7/1/37 30,000 27<br />
South Carolina Electric & Gas Co.,<br />
6.05%, 1/15/38 15,000 16<br />
Shares/<br />
$ Par<br />
Value<br />
$ (000's)<br />
Investment Grade Segment (8.2%)<br />
Electric Utilities continued<br />
Southern California Edison Co.,<br />
5.55%, 1/15/37 10,000 10<br />
Southern California Edison Co.,<br />
5.625%, 2/1/36 5,000 5<br />
Tampa Electric Co., 6.10%, 5/15/18 125,000 114<br />
Tampa Electric Co., 6.15%, 5/15/37 25,000 20<br />
Tampa Electric Co., 6.55%, 5/15/36 30,000 26<br />
The Toledo Edison Co., 6.15%, 5/15/37 75,000 60<br />
Union Electric Co., 6.40%, 6/15/17 10,000 9<br />
Union Electric Co., 6.70%, 2/1/19 10,000 9<br />
Virginia Electric and Power Co.,<br />
5.25%, 12/15/15 210,000 204<br />
Xcel Energy, Inc., 6.50%, 7/1/36 50,000 46<br />
Total 3,624<br />
Food Processors (0.2%)<br />
General Mills, Inc., 5.25%, 8/15/13 10,000 10<br />
General Mills, Inc., 5.70%, 2/15/17 55,000 55<br />
H.J. Heinz Co., 5.35%, 7/15/13 90,000 89<br />
Kellogg Co., 6.60%, 4/1/11 95,000 100<br />
Kraft Foods, Inc., 6.25%, 6/1/12 165,000 171<br />
Kraft Foods, Inc., 6.50%, 8/11/17 25,000 25<br />
Kraft Foods, Inc., 6.875%, 1/26/39 25,000 25<br />
Total 475<br />
Gaming/Lodging/Leisure (0.0%)<br />
Harrah's Operating Co., 5.75%, 10/1/17 40,000 6<br />
Total 6<br />
Gas Pipelines (0.1%)<br />
CenterPoint Energy Resources Corp.,<br />
6.125%, 11/1/17 10,000 8<br />
Kinder Morgan Energy Partners LP,<br />
6.50%, 2/1/37 15,000 11<br />
Kinder Morgan Energy Partners LP,<br />
7.30%, 8/15/33 85,000 71<br />
Rockies Express Pipeline LLC,<br />
6.85%, 7/15/18 144A 20,000 19<br />
Southern Natural Gas Co., 5.90%, 4/1/17 144A 20,000 16<br />
TransCanada Pipelines, Ltd., 5.85%, 3/15/36 10,000 9<br />
TransCanada Pipelines, Ltd., 6.20%, 10/15/37 5,000 4<br />
Total 138<br />
Health Care/Pharmaceuticals (0.2%)<br />
Bristol-Myers Squibb Co., 5.875%, 11/15/36 5,000 5<br />
Bristol-Myers Squibb Co., 6.125%, 5/1/38 25,000 28<br />
Eli Lilly and Co., 5.55%, 3/15/37 40,000 41<br />
GlaxoSmithKline Capital, Inc., 5.65%, 5/15/18 30,000 32<br />
GlaxoSmithKline Capital, Inc.,<br />
6.375%, 5/15/38 45,000 51<br />
Johnson & Johnson, 5.95%, 8/15/37 40,000 49<br />
Wyeth, 5.50%, 2/1/14 60,000 61<br />
Wyeth, 5.95%, 4/1/37 40,000 44<br />
Total 311<br />
Independent Finance (0.3%)<br />
General Electric Capital Corp., 5.625%, 5/1/18 270,000 272<br />
General Electric Capital Corp.,<br />
5.875%, 1/14/38 10,000 10<br />
General Motors Acceptance Corp. LLC,<br />
6.00%, 12/15/11 144A 79,000 64<br />
(n)General Motors Acceptance Corp. LLC,<br />
7.50%, 12/31/13 144A 13,000 9<br />
(n)General Motors Acceptance Corp. LLC,<br />
8.00%, 12/31/18 144A 16,000 8<br />
The Accompanying Notes are an Integral Part of the Financial Statements.<br />
Asset Allocation Portfolio 177
Asset Allocation Portfolio<br />
Shares/<br />
$ Par<br />
Value<br />
$ (000's)<br />
Investment Grade Segment (8.2%)<br />
Independent Finance continued<br />
HSBC Finance Corp., 4.125%, 11/16/09 195,000 193<br />
International Lease Finance Corp.,<br />
4.75%, 1/13/12 100,000 70<br />
iStar Financial, Inc., 5.15%, 3/1/12 75,000 24<br />
iStar Financial, Inc., 8.625%, 6/1/13 30,000 9<br />
Total 659<br />
Industrials - Other (0.0%)<br />
Centex Corp., 7.875%, 2/1/11 15,000 13<br />
D.R. Horton, Inc., 5.375%, 6/15/12 30,000 22<br />
D.R. Horton, Inc., 7.875%, 8/15/11 10,000 9<br />
Total 44<br />
Information/Data Technology (0.1%)<br />
Fiserv, Inc., 6.125%, 11/20/12 65,000 61<br />
Fiserv, Inc., 6.80%, 11/20/17 65,000 57<br />
Seagate Technology HDD Holdings,<br />
6.80%, 10/1/16 40,000 21<br />
Total 139<br />
Life Insurance (0.0%)<br />
Prudential Financial, Inc., 5.70%, 12/14/36 5,000 3<br />
Total 3<br />
Machinery (0.0%)<br />
Case Corp., 7.25%, 1/15/16 110,000 76<br />
Total 76<br />
Metals/Mining (0.1%)<br />
Alcoa, Inc., 5.90%, 2/1/27 20,000 13<br />
Alcoa, Inc., 6.75%, 7/15/18 30,000 25<br />
Barrick North America Fiance LLC,<br />
6.80%, 9/15/18 25,000 22<br />
Rio Tinto Finance USA, Ltd., 6.50%, 7/15/18 40,000 29<br />
Total 89<br />
Natural Gas Distributors (0.0%)<br />
NiSource Finance Corp., 5.25%, 9/15/17 35,000 21<br />
NiSource Finance Corp., 5.40%, 7/15/14 45,000 31<br />
NiSource Finance Corp., 5.45%, 9/15/20 10,000 6<br />
NiSource Finance Corp., 6.40%, 3/15/18 10,000 6<br />
Total 64<br />
Oil & Gas Field Machines and Services<br />
(0.0%)<br />
Pride International, Inc., 7.375%, 7/15/14 45,000 42<br />
Total 42<br />
Oil and Gas (0.5%)<br />
Anadarko Finance Co., 7.50%, 5/1/31 55,000 49<br />
Apache Corp., 6.00%, 1/15/37 20,000 19<br />
Apache Corp., 6.90%, 9/15/18 5,000 5<br />
Canadian Natural Resources, Ltd.,<br />
5.70%, 5/15/17 30,000 26<br />
Canadian Natural Resources, Ltd.,<br />
5.85%, 2/1/35 5,000 4<br />
Canadian Natural Resources, Ltd.,<br />
6.25%, 3/15/38 90,000 71<br />
Canadian Natural Resources, Ltd.,<br />
6.45%, 6/30/33 45,000 36<br />
Devon Energy Corp., 7.95%, 4/15/32 25,000 28<br />
Devon Financing Corp. ULC, 6.875%, 9/30/11 130,000 131<br />
EnCana Corp., 6.50%, 2/1/38 15,000 12<br />
EnCana Corp., 6.625%, 8/15/37 5,000 4<br />
Shares/<br />
$ Par<br />
Value<br />
$ (000's)<br />
Investment Grade Segment (8.2%)<br />
Oil and Gas continued<br />
EnCana Holdings Finance Corp.,<br />
5.80%, 5/1/14 60,000 56<br />
Hess Corp., 7.125%, 3/15/33 20,000 18<br />
Marathon Oil Corp., 6.60%, 10/1/37 10,000 8<br />
Nexen, Inc., 5.875%, 3/10/35 150,000 113<br />
Nexen, Inc., 6.40%, 5/15/37 10,000 8<br />
Petro-Canada, 5.95%, 5/15/35 45,000 31<br />
Pioneer Natural Resources Co., 6.875%, 5/1/18 110,000 77<br />
Suncor Energy, Inc., 6.50%, 6/15/38 20,000 15<br />
Suncor Energy, Inc., 6.85%, 6/1/39 15,000 12<br />
Sunoco, Inc., 5.75%, 1/15/17 65,000 54<br />
Talisman Energy, Inc., 5.85%, 2/1/37 53,000 37<br />
Tesoro Corp., 6.50%, 6/1/17 140,000 77<br />
Valero Energy Corp., 6.625%, 6/15/37 90,000 66<br />
XTO Energy, Inc., 5.30%, 6/30/15 15,000 14<br />
XTO Energy, Inc., 6.50%, 12/15/18 50,000 48<br />
XTO Energy, Inc., 6.75%, 8/1/37 10,000 9<br />
Total 1,028<br />
Other Finance (0.2%)<br />
Capmark Financial Group, Inc.,<br />
6.30%, 5/10/17 5,000 1<br />
Eaton Vance Corp., 6.50%, 10/2/17 5,000 5<br />
PNC Financial Services Group, Inc.,<br />
8.25%, 5/21/13 125,000 101<br />
SLM Corp., 5.375%, 1/15/13 10,000 7<br />
SLM Corp., 5.375%, 5/15/14 35,000 24<br />
SLM Corp., 5.45%, 4/25/11 255,000 201<br />
Total 339<br />
Other Services (0.1%)<br />
Waste Management, Inc., 5.00%, 3/15/14 50,000 43<br />
Waste Management, Inc., 6.10%, 3/15/18 65,000 56<br />
Total 99<br />
Paper and Forest Products (0.0%)<br />
International Paper Co., 7.95%, 6/15/18 40,000 32<br />
International Paper Co., 8.70%, 6/15/38 35,000 24<br />
Total 56<br />
Property and Casualty Insurance (0.0%)<br />
The Progressive Corp., 6.70%, 6/15/37 15,000 7<br />
Total 7<br />
Railroads (0.3%)<br />
Burlington Northern Santa Fe Corp.,<br />
6.15%, 5/1/37 35,000 32<br />
Burlington Northern Santa Fe Corp.,<br />
6.20%, 8/15/36 35,000 32<br />
Canadian National Railway Co.,<br />
5.85%, 11/15/17 5,000 5<br />
Canadian National Railway Co.,<br />
6.375%, 11/15/37 20,000 22<br />
Canadian Pacific Railway Co., 5.95%, 5/15/37 5,000 4<br />
CSX Corp., 5.60%, 5/1/17 55,000 49<br />
Norfolk Southern Corp., 6.20%, 4/15/09 45,000 45<br />
Union Pacific Corp., 5.65%, 5/1/17 15,000 14<br />
Union Pacific Corp., 5.75%, 11/15/17 5,000 5<br />
Union Pacific Corp., 6.65%, 1/15/11 45,000 45<br />
Union Pacific Corp., 7.375%, 9/15/09 240,000 241<br />
Total 494<br />
Real Estate Investment Trusts (0.4%)<br />
AvalonBay Communities, Inc., 5.50%, 1/15/12 25,000 20<br />
BRE Properties, Inc., 5.50%, 3/15/17 25,000 13<br />
The Accompanying Notes are an Integral Part of the Financial Statements.<br />
178 Asset Allocation Portfolio
Asset Allocation Portfolio<br />
Shares/<br />
$ Par<br />
Value<br />
$ (000's)<br />
Investment Grade Segment (8.2%)<br />
Real Estate Investment Trusts continued<br />
Colonial Realty LP, 6.05%, 9/1/16 20,000 12<br />
Developers Diversified Realty Corp.,<br />
5.375%, 10/15/12 80,000 33<br />
Duke Realty LP, 5.95%, 2/15/17 45,000 22<br />
ERP Operating LP, 5.25%, 9/15/14 120,000 80<br />
ERP Operating LP, 5.75%, 6/15/17 25,000 17<br />
First Industrial LP, 5.25%, 6/15/09 50,000 46<br />
HCP, Inc., 6.00%, 1/30/17 25,000 12<br />
HCP, Inc., 6.70%, 1/30/18 10,000 5<br />
HRPT Properties Trust, 5.75%, 11/1/15 65,000 35<br />
ProLogis, 5.50%, 3/1/13 115,000 67<br />
ProLogis, 5.75%, 4/1/16 65,000 32<br />
Rouse Co. LP/TRC Co-Issuer, Inc.,<br />
6.75%, 5/1/13 144A 220,000 79<br />
Simon Property Group LP, 5.375%, 6/1/11 195,000 165<br />
Simon Property Group LP, 5.60%, 9/1/11 50,000 42<br />
Simon Property Group LP, 6.10%, 5/1/16 95,000 61<br />
Total 741<br />
Restaurants (0.0%)<br />
Darden Restaurants, Inc., 6.20%, 10/15/17 10,000 7<br />
Darden Restaurants, Inc., 6.80%, 10/15/37 35,000 23<br />
Yum! Brands, Inc., 6.875%, 11/15/37 45,000 36<br />
Total 66<br />
Retail Food and Drug (0.1%)<br />
CVS/Caremark Corp., 4.875%, 9/15/14 60,000 55<br />
CVS/Caremark Corp., 6.125%, 8/15/16 25,000 24<br />
CVS/Caremark Corp., 6.25%, 6/1/27 40,000 37<br />
Delhaize Group, 6.50%, 6/15/17 40,000 36<br />
The Kroger Co., 6.15%, 1/15/20 25,000 25<br />
The Kroger Co., 7.00%, 5/1/18 20,000 21<br />
The Kroger Co., 7.50%, 4/1/31 40,000 45<br />
Total 243<br />
Retail Stores (0.3%)<br />
The Home Depot, Inc., 5.875%, 12/16/36 105,000 82<br />
J.C. Penney Corp., 5.75%, 2/15/18 5,000 3<br />
J.C. Penney Corp., 6.375%, 10/15/36 10,000 6<br />
J.C. Penney Corp., 6.875%, 10/15/15 30,000 24<br />
J.C. Penney Corp., 7.95%, 4/1/17 40,000 31<br />
Kohl's Corp., 6.25%, 12/15/17 20,000 16<br />
Kohl's Corp., 6.875%, 12/15/37 15,000 11<br />
Macy's Retail Holdings, Inc., 6.30%, 4/1/09 320,000 312<br />
Macy's Retail Holdings, Inc., 6.65%, 7/15/24 5,000 3<br />
Macy's Retail Holdings, Inc., 7.00%, 2/15/28 10,000 5<br />
Macy's Retail Holdings, Inc., 7.875%, 7/15/15 50,000 36<br />
Nordstrom, Inc., 7.00%, 1/15/38 15,000 9<br />
Target Corp., 5.375%, 5/1/17 35,000 32<br />
Target Corp., 6.50%, 10/15/37 20,000 17<br />
Total 587<br />
Telecommunications (0.6%)<br />
AT&T Corp., 8.00%, 11/15/31 200,000 251<br />
British Telecommunications PLC,<br />
9.125%, 12/15/30 35,000 37<br />
Deutsche Telekom International Finance BV,<br />
5.75%, 3/23/16 35,000 33<br />
Embarq Corp., 6.738%, 6/1/13 50,000 42<br />
Embarq Corp., 7.082%, 6/1/16 35,000 27<br />
Embarq Corp., 7.995%, 6/1/36 10,000 7<br />
France Telecom SA, 8.50%, 3/1/31 55,000 69<br />
Rogers Communications, Inc., 6.80%, 8/15/18 50,000 50<br />
Rogers Wireless, Inc., 6.375%, 3/1/14 50,000 48<br />
Shares/<br />
$ Par<br />
Value<br />
$ (000's)<br />
Investment Grade Segment (8.2%)<br />
Telecommunications continued<br />
Sprint Capital Corp., 8.375%, 3/15/12 295,000 236<br />
Sprint Capital Corp., 8.75%, 3/15/32 30,000 20<br />
Telecom Italia Capital SA, 4.00%, 1/15/10 130,000 120<br />
Telecom Italia Capital SA, 6.20%, 7/18/11 100,000 89<br />
Verizon Communications, Inc., 5.85%, 9/15/35 80,000 80<br />
Verizon Communications, Inc., 6.10%, 4/15/18 115,000 115<br />
Verizon Communications, Inc., 8.95%, 3/1/39 30,000 39<br />
Total 1,263<br />
Tobacco (0.1%)<br />
Altria Group, Inc., 9.70%, 11/10/18 35,000 38<br />
Altria Group, Inc., 9.95%, 11/10/38 40,000 43<br />
Philip Morris International, Inc.,<br />
5.65%, 5/16/18 40,000 40<br />
Philip Morris International, Inc.,<br />
6.375%, 5/16/38 30,000 31<br />
Reynolds American, Inc., 6.75%, 6/15/17 15,000 12<br />
Reynolds American, Inc., 7.25%, 6/15/37 15,000 10<br />
Reynolds American, Inc., 7.625%, 6/1/16 115,000 96<br />
Total 270<br />
Vehicle Parts (0.1%)<br />
Johnson Controls, Inc., 5.25%, 1/15/11 45,000 41<br />
Johnson Controls, Inc., 5.50%, 1/15/16 45,000 35<br />
Johnson Controls, Inc., 6.00%, 1/15/36 30,000 19<br />
Total 95<br />
Yankee Sovereign (0.1%)<br />
Mexico Government International Bond,<br />
5.625%, 1/15/17 110,000 110<br />
Mexico Government International Bond,<br />
6.05%, 1/11/40 25,000 24<br />
Total 134<br />
Total Investment Grade Segment<br />
(Cost: $18,300) 16,472<br />
Governments (3.8%)<br />
Governments (3.8%)<br />
Federal Home Loan Mortgage Corp.,<br />
4.875%, 6/13/18 1,956,000 2,248<br />
(n)Overseas Private Investment, 4.10%, 11/15/14 75,120 74<br />
(e)Tennesse Valley Authority Stripped,<br />
0.00%, 4/15/42 1,000,000 880<br />
US Department of Housing & Urban<br />
Development, 6.08%, 8/1/13 100,000 110<br />
US Treasury, 1.50%, 10/31/10 350,000 355<br />
US Treasury, 2.75%, 10/31/13 1,480,000 1,573<br />
US Treasury, 3.75%, 11/15/18 5,000 6<br />
US Treasury, 4.00%, 8/15/18 335,000 387<br />
US Treasury, 4.375%, 2/15/38 200,000 268<br />
US Treasury, 5.25%, 2/15/29 986,000 1,308<br />
US Treasury Inflation Index Bond,<br />
2.00%, 4/15/12 167,618 163<br />
US Treasury Inflation Index Bond,<br />
2.625%, 7/15/17 288,503 296<br />
Total Governments (Cost: $7,091) 7,668<br />
The Accompanying Notes are an Integral Part of the Financial Statements.<br />
Asset Allocation Portfolio 179
Asset Allocation Portfolio<br />
Municipal Bonds (0.3%)<br />
Shares/<br />
$ Par<br />
Value<br />
$ (000's)<br />
Municipal Bonds (0.3%)<br />
Indiana Finance Authority Environmental<br />
Facillities, Series 2006A,<br />
4.47%, 9/1/41 RB, AMBAC 555,000 555<br />
Total Municipal Bonds<br />
(Cost: $555) 555<br />
Structured Products (14.1%)<br />
Structured Products (14.1%)<br />
AEP Texas Central Transition Funding<br />
LLC, Series 2006-A, Class A5,<br />
5.306%, 7/1/21 1,183,000 1,056<br />
Asset Securitization Corp., Series 1997-D5,<br />
Class PS1, 1.418%, 2/14/43 IO 2,893,344 81<br />
Banc of America Alternative Loan Trust, Series<br />
2006-3, Class 1CB1, 6.00%, 4/25/36 98,427 47<br />
Banc of America Alternative Loan Trust, Series<br />
2006-4, Class 4CB1,<br />
6.50%, 5/25/46 117,258 57<br />
Banc of America Commercial Mortgage,<br />
Inc., Series 2007-2, Class A4,<br />
5.658%, 4/10/49 724,000 550<br />
Banc of America Commercial Mortgage,<br />
Inc., Series 2007-3, Class A4,<br />
5.688%, 6/10/49 151,000 110<br />
Banc of America Funding Corp., Series 2007-1,<br />
Class TA1A,<br />
0.531%, 1/25/37 137,218 65<br />
Banc of America Funding Corp., Series 2007-4,<br />
Class TA1A,<br />
0.561%, 5/25/37 197,670 172<br />
Banc of America Mortgage Securities,<br />
Inc., Series 2004-G, Class 2A6,<br />
4.648%, 8/25/34 288,000 277<br />
CenterPoint Energy Transition Bond Co. LLC,<br />
5.17%, 8/1/19 140,000 141<br />
Citigroup Commercial Mortgage Trust, Series<br />
2007-C6, Class A4,<br />
5.70%, 12/10/49 336,000 253<br />
Citigroup Mortgage Loan Trust, Inc., Series<br />
2004-NCM2, Class 2CB1,<br />
5.50%, 8/25/34 47,023 41<br />
Citigroup Mortgage Loan Trust, Inc., Series<br />
2005-1, Class 3A1,<br />
6.50%, 4/25/35 69,238 66<br />
Countrywide Alternative Loan Trust, Series<br />
2003-J1, Class 1A8,<br />
5.25%, 10/25/33 1,144,902 914<br />
Countrywide Home Loan Mortgage Pass<br />
Through Trust, Series 2005-31, Class 2A1,<br />
5.471%, 1/25/36 71,170 51<br />
Credit Suisse First Boston Mortgage Securities<br />
Corp., Series 2005-7, Class 6A1,<br />
5.50%, 8/25/20 147,496 137<br />
(n) Credit Suisse Mortgage Capital<br />
Certificates, Series 2007-5, Class 3A9,<br />
6.00%, 8/25/37 131,072 89<br />
Structured Products (14.1%)<br />
Shares/<br />
$ Par<br />
Value<br />
$ (000's)<br />
Structured Products continued<br />
(n)Credit Suisse Mortgage Capital<br />
Certificates, Series 2007-5, Class 3A19,<br />
6.00%, 8/25/37 143,728 105<br />
Federal Home Loan Mortgage Corp.,<br />
4.00%, 10/1/20 118,668 120<br />
Federal Home Loan Mortgage Corp.,<br />
4.50%, 5/1/19 166,406 171<br />
Federal Home Loan Mortgage Corp.,<br />
4.50%, 7/1/20 376,526 386<br />
Federal Home Loan Mortgage Corp., Series<br />
3065, Class TN, 4.50%, 10/15/33 101,732 104<br />
Federal Home Loan Mortgage Corp.,<br />
5.00%, 11/1/19 242,926 250<br />
Federal Home Loan Mortgage Corp.,<br />
5.00%, 2/1/20 31,719 33<br />
Federal Home Loan Mortgage Corp.,<br />
5.00%, 5/1/20 125,157 129<br />
Federal Home Loan Mortgage Corp.,<br />
5.00%, 10/1/20 135,860 140<br />
Federal Home Loan Mortgage Corp.,<br />
5.50%, 9/1/19 45,576 47<br />
Federal Home Loan Mortgage Corp.,<br />
5.50%, 11/1/19 134,942 140<br />
Federal Home Loan Mortgage Corp.,<br />
5.50%, 12/1/19 25,317 26<br />
Federal Home Loan Mortgage Corp.,<br />
5.50%, 3/1/20 185,305 191<br />
Federal Home Loan Mortgage Corp.,<br />
5.50%, 4/1/22 483,840 499<br />
Federal Home Loan Mortgage Corp.,<br />
5.50%, 6/1/35 123,769 127<br />
Federal Home Loan Mortgage Corp.,<br />
5.50%, 5/1/37 741,107 759<br />
Federal Home Loan Mortgage Corp., Series<br />
K001, Class A2,<br />
5.651%, 4/25/16 410,893 428<br />
Federal Home Loan Mortgage Corp., Series<br />
2840, Class LK,<br />
6.00%, 11/15/17 156,156 162<br />
Federal Home Loan Mortgage Corp., Series<br />
2439, Class LH,<br />
6.00%, 4/15/32 125,000 129<br />
Federal Home Loan Mortgage Corp.,<br />
6.00%, 8/1/37 170,636 176<br />
Federal National Mortgage Association,<br />
4.50%, 6/1/19 323,538 332<br />
Federal National Mortgage Association,<br />
4.50%, 12/1/19 38,553 40<br />
Federal National Mortgage Association,<br />
4.50%, 7/1/20 199,120 204<br />
Federal National Mortgage Association,<br />
5.00%, 3/1/20 154,013 159<br />
Federal National Mortgage Association,<br />
5.00%, 4/1/20 61,016 63<br />
The Accompanying Notes are an Integral Part of the Financial Statements.<br />
180 Asset Allocation Portfolio
Asset Allocation Portfolio<br />
Structured Products (14.1%)<br />
Shares/<br />
$ Par<br />
Value<br />
$ (000's)<br />
Structured Products continued<br />
Federal National Mortgage Association,<br />
5.00%, 5/1/20 250,893 259<br />
Federal National Mortgage Association,<br />
5.00%, 11/1/34 886,823 907<br />
Federal National Mortgage Association,<br />
5.00%, 4/1/35 132,929 136<br />
Federal National Mortgage Association,<br />
5.00%, 7/1/35 372,973 381<br />
Federal National Mortgage Association,<br />
5.00%, 10/1/35 65,971 67<br />
Federal National Mortgage Association,<br />
5.32%, 4/1/14 135,660 141<br />
Federal National Mortgage Association,<br />
5.38%, 1/1/17 151,000 156<br />
Federal National Mortgage Association,<br />
5.50%, 4/1/21 145,179 150<br />
Federal National Mortgage Association,<br />
5.50%, 10/1/34 488,846 502<br />
Federal National Mortgage Association,<br />
5.50%, 3/1/35 160,002 165<br />
Federal National Mortgage Association,<br />
5.50%, 7/1/35 64,777 66<br />
Federal National Mortgage Association,<br />
5.50%, 8/1/35 110,652 114<br />
Federal National Mortgage Association,<br />
5.50%, 9/1/35 1,089,464 1,118<br />
Federal National Mortgage Association,<br />
5.50%, 10/1/35 1,193,355 1,225<br />
Federal National Mortgage Association,<br />
5.50%, 11/1/35 829,921 852<br />
Federal National Mortgage Association,<br />
5.50%, 2/1/37 738,830 758<br />
Federal National Mortgage Association,<br />
5.50%, 2/1/38 2,000,736 2,054<br />
Federal National Mortgage Association,<br />
5.50%, 4/1/38 2,894,453 2,970<br />
Federal National Mortgage Association,<br />
6.00%, 10/1/34 425,456 439<br />
Federal National Mortgage Association,<br />
6.00%, 11/1/34 318,891 329<br />
Federal National Mortgage Association,<br />
6.00%, 5/1/35 14,575 15<br />
Federal National Mortgage Association,<br />
6.00%, 6/1/35 3,147 3<br />
Federal National Mortgage Association,<br />
6.00%, 7/1/35 170,266 176<br />
Federal National Mortgage Association,<br />
6.00%, 10/1/35 143,006 147<br />
Federal National Mortgage Association,<br />
6.00%, 11/1/35 276,684 285<br />
Federal National Mortgage Association,<br />
6.00%, 9/1/36 125,829 130<br />
Federal National Mortgage Association, Series<br />
2002-W4, Class A4,<br />
6.25%, 5/25/42 353,331 362<br />
Structured Products (14.1%)<br />
Shares/<br />
$ Par<br />
Value<br />
$ (000's)<br />
Structured Products continued<br />
Federal National Mortgage Association,<br />
6.50%, 12/1/37 1,060,116 1,102<br />
Federal National Mortgage Association<br />
Aces, Series 2006-M1, Class C,<br />
5.355%, 2/25/16 555,000 577<br />
(n)Final Maturity Amortizing Notes, Series 2004-<br />
1, Class 1,<br />
4.45%, 8/25/12 361,067 363<br />
First Horizon Alternative Mortgage<br />
Securities, Series 2004-FA1, Class 1A1,<br />
6.25%, 10/25/34 192,294 163<br />
Greenwich Capital Commerical Funding<br />
Corp., Series 2006-FL4A, Class A1,<br />
1.98%, 11/5/21 144A 40,134 30<br />
Louisiana Public Facilities Authority, Series<br />
2008, 6.65%, 8/1/20 RB 150,000 147<br />
Massachusetts RRB Special Purpose<br />
Trust, Series 2001-1, Class A,<br />
6.53%, 6/1/15 75,537 78<br />
MASTR Asset Securitization Trust, Series<br />
2003-12, Class 1A1,<br />
5.25%, 12/25/24 68,592 66<br />
Merrill Lynch Alternative Note Asset, Series<br />
2007-A1, Class A2A,<br />
0.541%, 1/25/37 190,784 100<br />
Merrill Lynch/Countrywide Commercial<br />
Mortgage Trust, Series 2007-7, Class A4,<br />
5.749%, 6/12/50 147,000 104<br />
Nordstrom Private Label Credit Card Master<br />
Note Trust, Series 2007-1A, Class A,<br />
4.92%, 5/15/13 144A 387,000 369<br />
TBW Mortgage Backed Pass Through<br />
Certificates, Series 2007-1, Class A1,<br />
0.561%, 3/25/37 154,594 136<br />
Thornburg Mortgage Securities Trust, Series<br />
2006-5, Class A1,<br />
0.591%, 9/25/46 174,926 145<br />
Thornburg Mortgage Securities Trust, Series<br />
2006-1, Class A3,<br />
0.641%, 1/25/09 438,694 437<br />
Thornburg Mortgage Securities Trust, Series<br />
2007-1, Class A1,<br />
1.505%, 3/25/37 126,881 105<br />
Thornburg Mortgage Securities Trust, Series<br />
2007-2, Class A3A,<br />
1.525%, 6/25/37 206,520 172<br />
Washington <strong>Mutual</strong> Alternative Mortgage Pass-<br />
Through Certficates, Series 2006-6, Class<br />
4A, 6.708%, 11/25/34 78,265 67<br />
Washington <strong>Mutual</strong> Commercial Mortgage<br />
Securities Trust, Series 2003-C1A, Class A,<br />
3.83%, 1/25/35 144A 130,379 124<br />
Wells Fargo Mortgage Backed<br />
Securities, Series 2006-2, Class 1A1,<br />
5.00%, 3/25/36 166,468 128<br />
The Accompanying Notes are an Integral Part of the Financial Statements.<br />
Asset Allocation Portfolio 181
Asset Allocation Portfolio<br />
Structured Products (14.1%)<br />
Shares/<br />
$ Par<br />
Value<br />
$ (000's)<br />
Structured Products continued<br />
Wells Fargo Mortgage Backed Securities<br />
Trust, Series 2004-N, Class A6,<br />
4.00%, 8/25/34 437,000 417<br />
Wells Fargo Mortgage Backed Securities<br />
Trust, Series 2005-1, Class 2A1,<br />
5.00%, 1/25/20 80,793 78<br />
Wells Fargo Mortgage Backed Securities<br />
Trust, Series 2005-7, Class A1,<br />
5.25%, 9/25/35 251,482 215<br />
Wells Fargo Mortgage Backed Securities<br />
Trust, Series 2005-11, Class 1A1,<br />
5.50%, 11/25/35 217,940 185<br />
Total Structured Products (Cost: $28,744) 28,242<br />
Below Investment Grade Segment (7.4%)<br />
Aerospace/Defense (0.3%)<br />
BE Aerospace, Inc., 8.50%, 7/1/18 53,000 48<br />
Bombardier, Inc., 8.00%, 11/15/14 144A 55,000 48<br />
DRS Technologies, Inc., 7.625%, 2/1/18 55,000 55<br />
Hawker Beechcraft Acquisition Co.<br />
LLC/Hawker Beechcraft Notes Co.,<br />
8.50%, 4/1/15 32,000 13<br />
(c) Hawker Beechcraft Acquisition Co.<br />
LLC/Hawker Beechcraft Notes Co.,<br />
8.875%, 4/1/15 72,000 24<br />
Hawker Beechcraft Acquisition Co.<br />
LLC/Hawker Beechcraft Notes Co.,<br />
9.75%, 4/1/17 65,000 18<br />
L-3 Communications Corp., 6.375%, 10/15/15 410,000 383<br />
L-3 Communications Corp., 7.625%, 6/15/12 105,000 103<br />
Total 692<br />
Autos/Vehicle Parts (0.2%)<br />
American Axle & Manufacturing, Inc.,<br />
7.875%, 3/1/17 80,000 25<br />
Cooper Tire & Rubber Co., 8.00%, 12/15/19 60,000 27<br />
Ford Motor Co., 7.45%, 7/16/31 215,000 60<br />
Ford Motor Credit Co. LLC, 8.00%, 12/15/16 45,000 29<br />
Ford Motor Credit Co. LLC, 8.625%, 11/1/10 55,000 42<br />
Ford Motor Credit Co. LLC, 9.875%, 8/10/11 225,000 166<br />
General Motors Corp., 7.20%, 1/15/11 55,000 12<br />
General Motors Corp., 8.375%, 7/15/33 150,000 26<br />
Lear Corp., 5.75%, 8/1/14 25,000 9<br />
Lear Corp., 8.75%, 12/1/16 39,000 11<br />
Visteon Corp., 8.25%, 8/1/10 75,000 23<br />
Visteon Corp., 12.25%, 12/31/16 144A 90,000 22<br />
Total 452<br />
Basic Materials (0.6%)<br />
Ball Corp., 6.625%, 3/15/18 55,000 49<br />
Berry Plastics Holding Corp., 8.875%, 9/15/14 40,000 17<br />
Cascades, Inc., 7.25%, 2/15/13 35,000 18<br />
Crown Americas LLC/Crown Americas Capital<br />
Corp., 7.625%, 11/15/13 36,000 36<br />
Crown Americas LLC/Crown Americas Capital<br />
Corp., 7.75%, 11/15/15 50,000 50<br />
FMG Finance Property, Ltd.,<br />
10.625%, 9/1/16 144A 185,000 107<br />
Shares/<br />
$ Par<br />
Value<br />
$ (000's)<br />
Below Investment Grade Segment (7.4%)<br />
Basic Materials continued<br />
Freeport-McMoRan Copper & Gold, Inc.,<br />
8.25%, 4/1/15 135,000 115<br />
Freeport-McMoRan Copper & Gold, Inc.,<br />
8.375%, 4/1/17 210,000 172<br />
Georgia-Pacific LLC, 7.00%, 1/15/15 144A 137,000 117<br />
Georgia-Pacific LLC, 7.125%, 1/15/17 144A 52,000 44<br />
Graphic Packaging International, Inc.,<br />
9.50%, 8/15/13 65,000 45<br />
Hexion US Finance Corp./Hexion Nova Scotia<br />
Finance ULC, 9.75%, 11/15/14 145,000 41<br />
Huntsman International LLC, 7.375%, 1/1/15 55,000 29<br />
Huntsman LLC, 11.50%, 7/15/12 50,000 40<br />
Invista, 9.25%, 5/1/12 144A 55,000 39<br />
Momentive Performance Materials, Inc.,<br />
9.75%, 12/1/14 75,000 32<br />
The Mosaic Co., 7.625%, 12/1/16 144A 40,000 32<br />
NewPage Corp., 10.00%, 5/1/12 60,000 26<br />
Norampac Industries, Inc., 6.75%, 6/1/13 45,000 20<br />
Novelis, Inc., 7.25%, 2/15/15 162,000 94<br />
Peabody Energy Corp., 7.375%, 11/1/16 15,000 14<br />
Peabody Energy Corp., 7.875%, 11/1/26 90,000 74<br />
Smurfit-Stone Container Enterprises, Inc.,<br />
8.375%, 7/1/12 50,000 8<br />
Texas Industries, Inc., 7.25%, 7/15/13 144A 35,000 27<br />
Total 1,246<br />
Capital Goods (0.2%)<br />
Case New Holland, Inc., 7.125%, 3/1/14 100,000 71<br />
Da-Lite Screen Co., Inc., 9.50%, 5/15/11 45,000 40<br />
RSC Equipment Rental, Inc., 9.50%, 12/1/14 88,000 48<br />
SPX Corp., 7.625%, 12/15/14 144A 75,000 65<br />
Terex Corp., 8.00%, 11/15/17 85,000 72<br />
United Rentals North America, Inc.,<br />
6.50%, 2/15/12 25,000 20<br />
Total 316<br />
Consumer Products/Retailing (0.3%)<br />
Education Management LLC/Education<br />
Management Finance Corp., 10.25%, 6/1/16 135,000 98<br />
GameStop Corp./GameStop, Inc.,<br />
8.00%, 10/1/12 80,000 74<br />
Levi Strauss & Co., 8.875%, 4/1/16 90,000 61<br />
The Neiman Marcus Group, Inc.,<br />
10.375%, 10/15/15 55,000 24<br />
New Albertson's, Inc., 7.25%, 5/1/13 70,000 59<br />
Oxford Industries, Inc., 8.875%, 6/1/11 118,000 89<br />
Phillips-Van Heusen Corp., 8.125%, 5/1/13 50,000 41<br />
Rite Aid Corp., 7.50%, 3/1/17 86,000 56<br />
Rite Aid Corp., 8.625%, 3/1/15 31,000 11<br />
Rite Aid Corp., 9.375%, 12/15/15 45,000 16<br />
Rite Aid Corp., 10.375%, 7/15/16 35,000 26<br />
SUPERVALU, Inc., 7.50%, 11/15/14 80,000 65<br />
Warnaco, Inc., 8.875%, 6/15/13 45,000 41<br />
Total 661<br />
Energy (1.2%)<br />
Basic Energy Services, Inc., 7.125%, 4/15/16 95,000 54<br />
Chaparral Energy, Inc., 8.875%, 2/1/17 90,000 18<br />
Chesapeake Energy Corp., 6.375%, 6/15/15 58,000 46<br />
Chesapeake Energy Corp., 6.625%, 1/15/16 99,000 78<br />
Chesapeake Energy Corp., 7.25%, 12/15/18 55,000 43<br />
Chesapeake Energy Corp., 7.50%, 9/15/13 45,000 39<br />
Chesapeake Energy Corp., 7.625%, 7/15/13 45,000 39<br />
The Accompanying Notes are an Integral Part of the Financial Statements.<br />
182 Asset Allocation Portfolio
Asset Allocation Portfolio<br />
Shares/<br />
$ Par<br />
Value<br />
$ (000's)<br />
Below Investment Grade Segment (7.4%)<br />
Energy continued<br />
Cie Generale de Geophysique-Veritas,<br />
7.50%, 5/15/15 33,000 20<br />
Cie Generale de Geophysique-Veritas,<br />
7.75%, 5/15/17 55,000 32<br />
Cimarex Energy Co., 7.125%, 5/1/17 80,000 62<br />
Complete Production Services, Inc.,<br />
8.00%, 12/15/16 60,000 38<br />
Connacher Oil and Gas, Ltd.,<br />
10.25%, 12/15/15 144A 60,000 24<br />
Denbury Resources, Inc., 7.50%, 12/15/15 60,000 43<br />
El Paso Corp., 7.00%, 6/15/17 110,000 86<br />
El Paso Corp., 7.25%, 6/1/18 90,000 71<br />
El Paso Corp., 7.75%, 1/15/32 90,000 58<br />
Forest Oil Corp., 7.25%, 6/15/19 144A 35,000 26<br />
Forest Oil Corp., 7.25%, 6/15/19 55,000 40<br />
Helix Energy Solutions Group, Inc.,<br />
9.50%, 1/15/16 144A 100,000 53<br />
Key Energy Services, Inc., 8.375%, 12/1/14 85,000 56<br />
Kinder Morgan Finance Co. ULC,<br />
5.35%, 1/5/11 220,000 196<br />
Kinder Morgan Finance Co. ULC,<br />
5.70%, 1/5/16 50,000 37<br />
Linn Energy LLC, 9.875%, 7/1/18 144A 55,000 32<br />
Mariner Energy, Inc., 8.00%, 5/15/17 74,000 39<br />
Newfield Exploration Co., 6.625%, 9/1/14 15,000 12<br />
Newfield Exploration Co., 6.625%, 4/15/16 65,000 52<br />
Newfield Exploration Co., 7.125%, 5/15/18 40,000 32<br />
OPTI Canada, Inc., 8.25%, 12/15/14 135,000 73<br />
Petrohawk Energy Corp., 7.875%, 6/1/15 144A 70,000 52<br />
Petrohawk Energy Corp., 9.125%, 7/15/13 113,000 92<br />
Petroplus Finance, Ltd., 6.75%, 5/1/14 144A 51,000 32<br />
Petroplus Finance, Ltd., 7.00%, 5/1/17 144A 42,000 26<br />
Plains Exploration & Production Co.,<br />
7.00%, 3/15/17 55,000 38<br />
Plains Exploration & Production Co.,<br />
7.625%, 6/1/18 35,000 24<br />
Plains Exploration & Production Co.,<br />
7.75%, 6/15/15 75,000 57<br />
Range Resources Corp., 6.375%, 3/15/15 72,000 58<br />
Range Resources Corp., 7.25%, 5/1/18 10,000 8<br />
Range Resources Corp., 7.50%, 5/15/16 15,000 13<br />
SandRidge Energy, Inc., 8.00%, 6/1/18 144A 35,000 19<br />
SESI LLC, 6.875%, 6/1/14 85,000 65<br />
Sonat, Inc., 7.625%, 7/15/11 25,000 23<br />
Southwestern Energy Co., 7.50%, 2/1/18 144A 70,000 61<br />
Targa Resources Partners LP,<br />
8.25%, 7/1/16 144A 40,000 25<br />
Tesoro Corp., 6.25%, 11/1/12 160,000 110<br />
Tesoro Corp., 6.625%, 11/1/15 175,000 102<br />
W&T Offshore, Inc., 8.25%, 6/15/14 144A 85,000 46<br />
Whiting Petroleum Corp., 7.25%, 5/1/13 108,000 77<br />
Total 2,327<br />
Financials (0.3%)<br />
E*TRADE Financial Corp., 7.375%, 9/15/13 5,000 2<br />
E*TRADE Financial Corp., 7.875%, 12/1/15 100,000 36<br />
E*TRADE Financial Corp., 8.00%, 6/15/11 110,000 50<br />
General Motors Acceptance Corp. LLC,<br />
7.25%, 3/2/11 205,000 174<br />
General Motors Acceptance Corp. LLC,<br />
7.75%, 1/19/10 40,000 36<br />
General Motors Acceptance Corp. LLC,<br />
8.00%, 11/1/31 144A 113,000 67<br />
Shares/<br />
$ Par<br />
Value<br />
$ (000's)<br />
Below Investment Grade Segment (7.4%)<br />
Financials continued<br />
International Lease Finance Corp.,<br />
5.875%, 5/1/13 30,000 20<br />
LaBranche & Co., Inc., 11.00%, 5/15/12 38,000 33<br />
Nuveen Investments, Inc.,<br />
10.50%, 11/15/15 144A 65,000 15<br />
Wells Fargo Capital XV, 9.75%, 12/29/49 115,000 116<br />
Total 549<br />
Foods (0.3%)<br />
Constellation Brands, Inc., 7.25%, 9/1/16 170,000 161<br />
Constellation Brands, Inc., 7.25%, 5/15/17 70,000 66<br />
Constellation Brands, Inc., 8.375%, 12/15/14 40,000 38<br />
(d)Pilgrim's Pride Corp., 7.625%, 5/1/15 69,000 19<br />
Pinnacle Foods Finance LLC/Pinnacle Foods<br />
Finance Corp., 9.25%, 4/1/15 55,000 35<br />
Pinnacle Foods Finance LLC/Pinnacle Foods<br />
Finance Corp., 10.625%, 4/1/17 110,000 59<br />
Smithfield Foods, Inc., 7.75%, 5/15/13 138,000 89<br />
Smithfield Foods, Inc., 7.75%, 7/1/17 60,000 34<br />
Total 501<br />
Gaming/Leisure/Lodging (0.7%)<br />
AMC Entertainment, Inc., 11.00%, 2/1/16 54,000 38<br />
Caesars Entertainment, Inc., 7.875%, 3/15/10 60,000 40<br />
Caesars Entertainment, Inc., 8.125%, 5/15/11 135,000 66<br />
Felcor Lodging LP, 8.50%, 6/1/11 83,000 61<br />
Harrah's Operating Co., Inc., 5.50%, 7/1/10 55,000 35<br />
Harrah's Operating Co., Inc.,<br />
10.75%, 2/1/16 144A 205,000 58<br />
The Hertz Corp., 8.875%, 1/1/14 60,000 37<br />
Host Hotels & Resorts LP, 7.125%, 11/1/13 210,000 169<br />
Las Vegas Sands Corp., 6.375%, 2/15/15 150,000 87<br />
Mandalay Resort Group, 9.375%, 2/15/10 50,000 36<br />
Mashantucket Western Pequot Tribe,<br />
8.50%, 11/15/15 144A 110,000 43<br />
MGM MIRAGE, 7.50%, 6/1/16 145,000 92<br />
MGM MIRAGE, Inc., 6.75%, 9/1/12 105,000 73<br />
MGM MIRAGE, Inc., 8.375%, 2/1/11 85,000 51<br />
Mohegan Tribal Gaming Authority,<br />
6.875%, 2/15/15 95,000 48<br />
Mohegan Tribal Gaming Authority,<br />
8.00%, 4/1/12 30,000 18<br />
Royal Caribbean Cruises, Ltd., 7.00%, 6/15/13 160,000 91<br />
Seminole Hard Rock Entertainment, Inc.,<br />
4.496%, 3/15/14 144A 45,000 23<br />
Station Casinos, Inc., 6.00%, 4/1/12 120,000 24<br />
Station Casinos, Inc., 6.625%, 3/15/18 45,000 3<br />
Station Casinos, Inc., 6.875%, 3/1/16 45,000 3<br />
Universal City Development Partners,<br />
11.75%, 4/1/10 44,000 28<br />
Universal City Florida Holding Co. I & II,<br />
8.375%, 5/1/10 33,000 15<br />
Wynn Las Vegas LLC/Wynn Las Vegas<br />
Capital Corp., 6.625%, 12/1/14 325,000 246<br />
Total 1,385<br />
Health Care/Pharmaceuticals (0.7%)<br />
(c)Biomet, Inc., 10.375%, 10/15/17 165,000 130<br />
Catalent Pharma Solutions, Inc.,<br />
9.50%, 4/15/15 79,000 30<br />
CHS/Community Health Systems, Inc.,<br />
8.875%, 7/15/15 210,000 193<br />
DaVita, Inc., 7.25%, 3/15/15 85,000 81<br />
FMC Finance III SA, 6.875%, 7/15/17 105,000 98<br />
The Accompanying Notes are an Integral Part of the Financial Statements.<br />
Asset Allocation Portfolio 183
Asset Allocation Portfolio<br />
Shares/<br />
$ Par<br />
Value<br />
$ (000's)<br />
Below Investment Grade Segment (7.4%)<br />
Health Care/Pharmaceuticals continued<br />
Fresenius Medical Care Capital Trust IV,<br />
7.875%, 6/15/11 30,000 28<br />
HCA, Inc., 6.75%, 7/15/13 75,000 47<br />
HCA, Inc., 9.125%, 11/15/14 58,000 54<br />
HCA, Inc., 9.25%, 11/15/16 233,000 214<br />
(c) HCA, Inc., 9.625%, 11/15/16 87,000 68<br />
Health Management Associates, Inc.,<br />
6.125%, 4/15/16 85,000 53<br />
Senior Housing Properties Trust,<br />
8.625%, 1/15/12 45,000 39<br />
Service Corp. International, 6.75%, 4/1/15 70,000 55<br />
Service Corp. International, 6.75%, 4/1/16 60,000 46<br />
Service Corp. International, 7.375%, 10/1/14 15,000 13<br />
Tenet Healthcare Corp., 7.375%, 2/1/13 85,000 61<br />
Tenet Healthcare Corp., 9.875%, 7/1/14 85,000 68<br />
Ventas Realty LP/Ventas Capital Corp.,<br />
6.50%, 6/1/16 80,000 59<br />
Ventas Realty LP/Ventas Capital Corp.,<br />
9.00%, 5/1/12 50,000 44<br />
Total 1,381<br />
Media (0.6%)<br />
CCH I Holdings LLC/CCH I Holdings Capital<br />
Corp., 11.00%, 10/1/15 205,000 32<br />
CCH I Holdings LLC/CCH I Holdings Capital<br />
Corp., 11.75%, 5/15/14 75,000 4<br />
CCH II LLC/CCH II Capital Corp.,<br />
10.25%, 9/15/10 70,000 31<br />
CSC Holdings, Inc., 7.625%, 4/1/11 150,000 141<br />
CSC Holdings, Inc., 7.875%, 2/15/18 132,000 104<br />
Dex Media, Inc., 8.00%, 11/15/13 100,000 18<br />
DirecTV Holdings LLC/DirecTV Financing<br />
Co., 7.625%, 5/15/16 150,000 145<br />
EchoStar DBS Corp., 7.00%, 10/1/13 145,000 126<br />
EchoStar DBS Corp., 7.125%, 2/1/16 85,000 71<br />
EchoStar DBS Corp., 7.75%, 5/31/15 105,000 89<br />
Kabel Deutschland GmbH, 10.625%, 7/1/14 90,000 80<br />
Lamar Media Corp., 6.625%, 8/15/15 125,000 90<br />
LIN Television Corp., 6.50%, 5/15/13 60,000 29<br />
Mediacom Broadband LLC/Mediacom<br />
Broadband Corp., 8.50%, 10/15/15 85,000 55<br />
Mediacom LLC/Mediacom Capital Corp.,<br />
7.875%, 2/15/11 30,000 23<br />
Quebecor Media, Inc., 7.75%, 3/15/16 90,000 61<br />
R.H. Donnelley Corp., 6.875%, 1/15/13 65,000 9<br />
R.H. Donnelley Corp., 8.875%, 10/15/17 30,000 5<br />
(c) Univision Communications, Inc.,<br />
9.75%, 3/15/15 144A 95,000 12<br />
Videotron Ltee, 6.375%, 12/15/15 25,000 20<br />
Videotron Ltee, 6.875%, 1/15/14 70,000 62<br />
Videotron Ltee, 9.125%, 4/15/18 144A 15,000 14<br />
Total 1,221<br />
Real Estate (0.1%)<br />
Icahn Enterprises LP/Icahn Enterprises Finance<br />
Corp., 7.125%, 2/15/13 110,000 76<br />
The Rouse Co. LP, 7.20%, 9/15/12 85,000 29<br />
Total 105<br />
Services (0.1%)<br />
Allied Waste North America, Inc.,<br />
6.125%, 2/15/14 40,000 37<br />
Allied Waste North America, Inc.,<br />
7.25%, 3/15/15 70,000 65<br />
Shares/<br />
$ Par<br />
Value<br />
$ (000's)<br />
Below Investment Grade Segment (7.4%)<br />
Services continued<br />
Crum & Forster Holdings Corp., 7.75%, 5/1/17 64,000 45<br />
UnumProvident Finance Co. PLC,<br />
6.85%, 11/15/15 144A 60,000 49<br />
WCA Waste Corp., 9.25%, 6/15/14 65,000 48<br />
Total 244<br />
Technology (0.3%)<br />
Expedia, Inc., 8.50%, 7/1/16 144A 10,000 7<br />
First Data Corp., 9.875%, 9/24/15 100,000 60<br />
Flextronics International, Ltd., 6.50%, 5/15/13 75,000 59<br />
Freescale Semiconductor, Inc.,<br />
8.875%, 12/15/14 80,000 35<br />
(c)Freescale Semiconductor, Inc.,<br />
9.125%, 12/15/14 99,000 23<br />
Iron Mountain, Inc., 7.75%, 1/15/15 70,000 63<br />
Iron Mountain, Inc., 8.00%, 6/15/20 115,000 92<br />
Nortel Networks, Ltd., 10.75%, 7/15/16 144A 85,000 22<br />
Sabre Holdings Corp., 8.35%, 3/15/16 75,000 17<br />
STATS ChipPAC, Ltd., 6.75%, 11/15/11 43,000 32<br />
STATS ChipPAC, Ltd., 7.50%, 7/19/10 50,000 41<br />
Sungard Data Systems, Inc.,<br />
10.625%, 5/15/15 144A 65,000 56<br />
SunGard Data Systems, Inc., 9.125%, 8/15/13 45,000 39<br />
Travelport LLC, 11.875%, 9/1/16 20,000 6<br />
Unisys Corp., 8.00%, 10/15/12 60,000 17<br />
Total 569<br />
Telecommunications (0.5%)<br />
(c)ALLTEL Communications LLC,<br />
10.375%, 12/1/17 144A 85,000 95<br />
American Tower Corp., 7.00%, 10/15/17 144A 65,000 58<br />
Cricket Communications, Inc.,<br />
10.00%, 7/15/15 144A 35,000 32<br />
Frontier Communications Corp.,<br />
9.00%, 8/15/31 165,000 104<br />
Frontier Communications Corp.,<br />
9.25%, 5/15/11 145,000 138<br />
Intelsat Corp., 9.25%, 8/15/14 144A 55,000 51<br />
Intelsat Jackson Holdings, Ltd.,<br />
11.25%, 6/15/16 55,000 50<br />
Intelsat, Ltd., 7.625%, 4/15/12 55,000 37<br />
Qwest Corp., 6.50%, 6/1/17 85,000 63<br />
Qwest Corp., 7.50%, 10/1/14 16,000 13<br />
Qwest Corp., 7.625%, 6/15/15 55,000 45<br />
Qwest Corp., 7.875%, 9/1/11 67,000 62<br />
Rogers Wireless, Inc., 8.00%, 12/15/12 74,000 71<br />
Sprint Nextel Corp., 6.00%, 12/1/16 100,000 71<br />
Windstream Corp., 7.00%, 3/15/19 55,000 42<br />
Windstream Corp., 8.125%, 8/1/13 85,000 78<br />
Windstream Corp., 8.625%, 8/1/16 95,000 84<br />
Total 1,094<br />
Transportation (0.2%)<br />
American Railcar Industries, Inc.,<br />
7.50%, 3/1/14 25,000 16<br />
Kansas City Southern de Mexico SAB de CV,<br />
7.375%, 6/1/14 95,000 78<br />
Kansas City Southern de Mexico SAB de CV,<br />
7.625%, 12/1/13 35,000 29<br />
Kansas City Southern de Mexico SAB de CV,<br />
9.375%, 5/1/12 67,000 61<br />
Stena AB, 7.50%, 11/1/13 215,000 142<br />
Total 326<br />
The Accompanying Notes are an Integral Part of the Financial Statements.<br />
184 Asset Allocation Portfolio
Asset Allocation Portfolio<br />
Shares/<br />
$ Par<br />
Value<br />
$ (000's)<br />
Below Investment Grade Segment (7.4%)<br />
Utilities (0.8%)<br />
The AES Corp., 7.75%, 10/15/15 110,000 92<br />
The AES Corp., 8.00%, 10/15/17 65,000 53<br />
The AES Corp., 8.00%, 6/1/20 144A 55,000 43<br />
Aquila, Inc., 7.95%, 2/1/11 6,000 6<br />
Aquila, Inc., 11.875%, 7/1/12 55,000 56<br />
Dynegy Holdings, Inc., 7.50%, 6/1/15 100,000 70<br />
Dynegy Holdings, Inc., 7.75%, 6/1/19 65,000 45<br />
Dynegy Holdings, Inc., 8.375%, 5/1/16 110,000 78<br />
Edison Mission Energy, 7.00%, 5/15/17 125,000 109<br />
Edison Mission Energy, 7.20%, 5/15/19 149,000 122<br />
Elwood Energy LLC, 8.159%, 7/5/26 90,601 62<br />
Energy Future Holdings Corp.,<br />
10.875%, 11/1/17 144A 85,000 60<br />
Indiantown Cogeneration LP, 9.77%, 12/15/20 130,000 103<br />
Mirant Americas Generation LLC,<br />
8.50%, 10/1/21 165,000 125<br />
NRG Energy, Inc., 7.25%, 2/1/14 65,000 61<br />
NRG Energy, Inc., 7.375%, 2/1/16 45,000 42<br />
NRG Energy, Inc., 7.375%, 1/15/17 66,000 61<br />
NSG Holdings LLC/NSG Holdings, Inc.,<br />
7.75%, 12/15/25 144A 81,000 63<br />
NV Energy, Inc., 8.625%, 3/15/14 27,000 24<br />
Reliant Energy, Inc., 7.625%, 6/15/14 145,000 120<br />
Texas Competitive Electric Holdings Co. LLC,<br />
10.50%, 11/1/15 144A 350,000 248<br />
Total 1,643<br />
Total Below Investment Grade Segment<br />
(Cost: $20,435) 14,712<br />
Preferred Stocks (0.0%)<br />
Financials (0.0%)<br />
(n)* Preferred Blocker, Inc.,<br />
9.00%, 12/31/49 144A 44 11<br />
Total 11<br />
Total Preferred Stocks<br />
(Cost: $11) 11<br />
Short-Term Investments (20.7%)<br />
Electric Utilities (1.5%)<br />
Duke Energy Corp.,<br />
4.00%, 1/5/09 3,000,000 2,999<br />
Total 2,999<br />
Short-Term Investments<br />
(20.7%)<br />
Finance Services (7.5%)<br />
Shares/<br />
$ Par<br />
Value<br />
$ (000's)<br />
Alpine Securitization,<br />
1.25%, 1/8/09 3,000,000 2,999<br />
Bryant Park Funding LLC,<br />
1.00%, 1/9/09 3,000,000 2,999<br />
(b)Ciesco LP, 0.20%, 1/12/09 3,000,000 3,000<br />
Falcon Asset Securitization<br />
Co. LLC, 0.20%, 1/27/09 3,000,000 3,000<br />
Gemini Securitization Corp.<br />
LLC, 1.45%, 1/8/09 3,000,000 2,999<br />
Total 14,997<br />
Oil and Gas (1.7%)<br />
Devon Energy Corp.,<br />
0.95%, 1/2/09 400,000 400<br />
Sempra Global, 4.50%, 1/5/09<br />
3,000,000 2,998<br />
Total 3,398<br />
Personal Credit Institutions (1.5%)<br />
HSBC Finance Corp.,<br />
1.50%, 1/7/09 3,000,000 2,999<br />
Total 2,999<br />
Retail Stores (1.0%)<br />
Home Depot, Inc.,<br />
2.50%, 1/2/09 2,000,000 2,000<br />
Total 2,000<br />
Short Term Business Credit (1.5%)<br />
Liberty Street Funding LLC,<br />
0.55%, 1/12/09 3,000,000 2,999<br />
Total 2,999<br />
Total Short-Term Investments<br />
(Cost: $41,285) 41,291<br />
Total Investments (99.0%)<br />
(Cost: $237,762)(a) 197,642<br />
Other Assets, Less<br />
Liabilities (1.0%) 1,998<br />
Net Assets (100.0%) 199,640<br />
Federal Government & Agencies (6.0%)<br />
(b) Federal Home Loan Bank,<br />
0.38%, 1/15/09 5,900,000 5,899<br />
(b) Federal Home Loan Bank,<br />
0.47%, 3/13/09 3,000,000 3,000<br />
(b) Federal Home Loan Bank,<br />
0.65%, 3/13/09 3,000,000 3,000<br />
Total 11,899<br />
The Accompanying Notes are an Integral Part of the Financial Statements.<br />
Asset Allocation Portfolio 185
Asset Allocation Portfolio<br />
* Non-Income Producing<br />
ADR after the name of a security represents—American Depositary Receipt.<br />
144A after the name of a security represents a security exempt from registration under Rule 144A of the Securities Act of 1933. These securities may be<br />
resold as transactions exempt from registration, normally to qualified institutional buyers. At December 31, 2008 the value of these securities (in thousands)<br />
was $3,286, representing 1.65% of the net assets.<br />
IO — Interest Only Security<br />
RB — Revenue Bond<br />
AMBAC — American Municipal Bond Assurance Corp.<br />
(a)<br />
(b)<br />
At December 31, 2008 the aggregate cost of securities for federal tax purposes (in thousands) was $238,597 and the net unrealized depreciation of<br />
investments based on that cost was $40,955 which is comprised of $4,843 aggregate gross unrealized appreciation and $45,798 aggregate gross unrealized<br />
depreciation.<br />
All or a portion of the securities have been committed as collateral for open futures positions or when-issued securities. Information regarding open futures<br />
contracts as of period end is summarized below.<br />
Unrealized<br />
Appreciation/<br />
Number of<br />
(Depreciation)<br />
Issuer (000's)<br />
Contracts Expiration Date (000's)<br />
Midcap 400 Index Futures (Long) (Total Notional Value at December 31, 2008, $1,310) 5 3/09 $ 33<br />
Russell 2000 Mini Index Future (Long) (Total Notional Value at December 31, 2008, $4,555) 95 3/09 174<br />
S&P 500 Index Futures (Long) (Total Notional Value at December 31, 2008, $30,802) 135 3/09 (424)<br />
US Five Year Note Commodity (Long) (Total Notional Value at December 31, 2008, $230) 2 3/09 8<br />
US Long Bond (CBT) Commodity (Short) (Total Notional Value at December 31, 2008, $2,631) 20 3/09 (130)<br />
US Ten Year Treasury Note (Short) (Total Notional Value at December 31, 2008, $4,519) 38 3/09 (259)<br />
US Two Year Treasury Note (Long) (Total Notional Value at December 31, 2008, $5,163) 24 3/09 71<br />
(c)<br />
(d)<br />
(e)<br />
PIK - Payment In Kind<br />
Defaulted Security<br />
Step bond security that presently receives no coupon payments. At the predetermined date the stated coupon rate becomes effective.<br />
(j) Swap agreements outstanding on December 31, 2008<br />
Total Return Swaps<br />
CounterParty<br />
JPMorgan Chase<br />
JPMorgan Chase<br />
Reference<br />
Russell 2000 Growth<br />
Biotechnology Industry Index<br />
Morgan Stanley Capital<br />
International (MSCI) Daily Net<br />
Japan<br />
Payment Made by<br />
the Fund<br />
3 Month USD-<br />
LIBOR -120 Bps<br />
3 Month USD-<br />
LIBOR +15 Bps<br />
Payment Received<br />
by the Fund<br />
Russell 2000<br />
Growth<br />
Biotechnology<br />
Industry Index<br />
Total Return<br />
MSCI Daily Net<br />
Japan Total<br />
Return<br />
Expiration<br />
Date<br />
Notional<br />
Amount (000's)<br />
Unrealized<br />
Appreciation/<br />
(Depreciation)<br />
(000's)<br />
12/09 100 $ 12<br />
3/09 1,525 47<br />
$ 59<br />
(l)<br />
As of December 31, 2008, portfolio securities with an aggregate value of $18,881 (in thousands) were fair valued under procedures adopted by the Board of<br />
Directors.<br />
(m) Amount is less than one thousand.<br />
(n)<br />
At December 31, 2008 portfolio securities with a aggregate value of $660 (in thousands) were valued with reference to securities whose values are more<br />
readily available.<br />
The Accompanying Notes are an Integral Part of the Financial Statements.<br />
186 Asset Allocation Portfolio
Benchmark Definitions<br />
The following indices are used to illustrate investment market, sector or style performance or to serve as Portfolio performance<br />
comparisons. Unlike the Portfolios, the indices are not professionally managed and do not incur fees or expenses. It is not<br />
possible to invest directly in an index.<br />
33%: Barclays Capital Global Aggregate — Credit<br />
Component, Hedged USD, Merrill Lynch Global High-<br />
Yield BB-B Rated Constrained Index and JPMorgan<br />
EMBI Global — The benchmark is an equally weighted<br />
blend of the following three indexes: Barclays Capital Global<br />
Aggregate —Credit Component, Hedged USD, Merrill<br />
Lynch Global High Yield BB-B Rated Constrained Index and<br />
JPMorgan EMBI Global. The Barclays Capital Global<br />
Aggregate — Credit Component, Hedged USD Index<br />
provides a broad-based measure of the global investment<br />
grade fixed income markets. The Global High Yield BB-B<br />
Rated Constrained Index tracks the performance of below<br />
investment grade bonds of corporate issuers domiciled in<br />
countries having an investment grade foreign currency long<br />
term debt rating (based on a composite of Moody’s, S&P,<br />
and Fitch). The Index includes bonds denominated in U.S.<br />
dollars, Canadian dollars, sterling, and euro (or euro legacy<br />
currency), but excludes all multi-currency denominated<br />
bonds. Bonds must be rated below investment grade but at<br />
least B3 based on a composite of Moody’s, S&P, and Fitch.<br />
Qualifying bonds are capitalization-weighted provided the<br />
total allocation to an individual issuer (defined by Bloomberg<br />
tickers) does not exceed 2%. Issuers that exceed the limit are<br />
reduced to 2% and the face value of each of their bonds is<br />
adjusted on a pro-rata basis. Similarly, the face value of<br />
bonds of all other issuers that fall below the 2% cap are<br />
increased on a pro-basis. The index is re-balanced on the last<br />
calendar day of the month. JPMorgan EMBI Global tracks<br />
total returns for United States Dollar denominated debt<br />
instruments issued by emerging market sovereign and quasisovereign<br />
entities, Brady bonds, loans, Eurobonds and local<br />
market instruments. This index only tracks the particular<br />
region or country.<br />
Asset Allocation Portfolio Blended Composite — The<br />
Asset Allocation Portfolio Blended Composite Benchmark is<br />
an unmanaged, hypothetical combination of unmanaged<br />
indexes that correspond to the Asset Allocation Portfolio’s<br />
model allocation and consists of the Russell 1000 Index<br />
(50%), the S&P Global ex-US LargeMidCap Index (15%),<br />
the Citigroup U.S. Broad Investment Grade Bond Index<br />
(25%), and the Citigroup High Yield Cash Pay Index (10%).<br />
Balanced Portfolio Blended Composite — The Balanced<br />
Portfolio Blended Composite Benchmark is an unmanaged,<br />
hypothetical combination of unmanaged indexes that<br />
correspond to the Balanced Portfolio’s model allocation and<br />
consists of the Russell 1000 Index (40%), the S&P Global<br />
ex-US LargeMidCap Index (10%), the Citigroup U.S. Broad<br />
Investment Grade Bond Index (45%) and the Citigroup High<br />
Yield Cash Pay Index (5%).<br />
Barclays Capital U.S. Aggregate 1-3 Years Index — The<br />
Barclays Capital U.S. Aggregate 1-3 Years Index is an<br />
unmanaged index of publicly issued investment-grade fixed<br />
rate debt securities including corporate, U.S. Treasury and<br />
government agency securities, mortgage pass-through and<br />
asset-backed securities with remaining maturities of one to<br />
three years.<br />
Barclays Capital U.S. Aggregate Index — The Barclays<br />
Capital U.S. Aggregate Index is an unmanaged index of<br />
publicly issued investment-grade fixed-rate debt securities<br />
including corporate, U.S. Treasury and government agency<br />
securities, mortgage pass-through and asset-backed securities<br />
with remaining maturities of at least one year regardless of<br />
call features.<br />
Barclays Capital U.S. Corporate High Yield 2% Issuer<br />
Capped Index — The Barclays Capital U. S. Corporate<br />
High Yield 2% Issuer Capped Index is an unmanaged index<br />
of U.S. dollar denominated, non-convertible, fixed rate,<br />
noninvestment grade debt. Issuers are capped at 2% of the<br />
Index. Index holdings must have at least one year to final<br />
maturity, at least $150 million par amount outstanding, and<br />
be publicly issued with a rating of Ba1 or lower.<br />
Barclays Capital Global Credit Hedged USD Index —<br />
The Barclays Capital Global Credit Hedged USD Index is an<br />
unmanaged index composed of investment grade and high<br />
yield credit securities from the Multiverse represented in U.S.<br />
Dollars on a hedged bases (Multiverse is the merger of two<br />
groups: the Global Aggregate and the Global High Yield).<br />
Barclays Capital Long-Term U.S. Treasury Index — The<br />
Barclays Capital Long-Term U.S. Treasury Index is an<br />
unmanaged index comprised of fixed-income securities with<br />
various maturities greater than 10 years.<br />
Citigroup High Yield Cash Pay Index — The Citigroup<br />
High Yield Cash Pay Index is an unmanaged index that<br />
captures the performance of below-investment-grade debt<br />
issued by corporations domiciled in the United States or<br />
Canada. The index includes only cash-pay bonds (bond<br />
registered and Rule 144A) with maturities of at least one<br />
year, a minimum amount outstanding of US $100 million<br />
(subject to an entry criteria of $200 million per issue or $400<br />
million per issuer), and a speculative-grade rating by both<br />
Moody’s Investor Service and Standard & Poor’s.<br />
Benchmark Definitions 187
Benchmark Definitions<br />
Citigroup U.S. Broad Investment Grade Bond Index —<br />
The Citigroup U.S. Broad Investment Grade Bond Index is<br />
an unmanaged index designed to track the performance of<br />
bonds issued in the U.S. investment-grade bond market. The<br />
index is market-capitalization-weighted and includes<br />
institutionally traded U.S. Treasury, government sponsored<br />
(U.S. agency and supranational), mortgages, asset-backed,<br />
and investment grade (BBB-/Baa3) issues with a maturity of<br />
one year or longer.<br />
Citigroup U.S. Inflation-Linked Securities Index — The<br />
Citigroup U.S. Inflation-Linked Securities Index is an<br />
unmanaged index designed to track the performance of U.S.<br />
Treasury and Inflation-Protected Securities (TIPS) with fixed<br />
rate coupon payments that are adjusted for inflation as<br />
measured by the Consumer Price Index (CPI). The index is<br />
market capitalization weighted and includes U.S. Treasury<br />
Inflation-Protected issues with a maturity of one year or<br />
longer.<br />
Lipper Variable Insurance Products (VIP) Average —<br />
Each Lipper Variable Insurance Products (VIP) Average is<br />
calculated by Lipper Analytical Services, Inc. and reflects the<br />
investment return of certain portfolios underlying variable<br />
life and annuity products. The returns are net of investment<br />
fees and fund expenses but not product charges, and returns<br />
would have been lower if they included the effect of these<br />
charges. Source: Lipper, Inc.<br />
MSCI EAFE (Europe-Australia-Far-East) Index — The<br />
MSCI EAFE (“Europe-Australasia-Far East”) Index is an<br />
unmanaged, free float-adjusted, market capitalizationweighted<br />
index that is designed to measure developed market<br />
equity performance, excluding the U.S. & Canada.<br />
MSCI All Country World (ex-US) Index — The MSCI All<br />
Country World (ex-US) Index is an unmanaged, free floatadjusted<br />
market capitalization-weighted index that is<br />
designed to measure equity performance in the developed<br />
and emerging markets, excluding the U.S.<br />
MSCI Emerging Markets Index — The MSCI Emerging<br />
Markets Index is an unmanaged, free float-adjusted, market<br />
capitalization-weighted index that is designed to measure<br />
equity market performance in the global emerging markets.<br />
Russell 1000 Growth Index — The Russell 1000 Growth<br />
Index is an unmanaged index that measures the performance<br />
of those companies in the Russell 1000 Index with higher<br />
price-to-book ratios and higher forecasted growth values. The<br />
Russell 1000 Index is an unmanaged, market capitalizationweighted,<br />
large cap index that measures the performance of<br />
the 1000 largest companies in the Russell 3000 Index (the<br />
3000 largest publicly traded U.S. companies based on total<br />
market capitalization and representing approximately 98% of<br />
the investible U.S. equity market).<br />
Russell 1000 Value Index — The Russell 1000 Value Index<br />
is an unmanaged index that measures the performance of<br />
those companies in the Russell 1000 Index with lower priceto-book<br />
ratios and lower forecasted growth values. The<br />
Russell 1000 Index is an unmanaged, market capitalizationweighted,<br />
large cap index that measures the performance of<br />
the 1000 largest companies in the Russell 3000 Index (the<br />
3000 largest publicly traded U.S. companies based on total<br />
market capitalization and representing approximately 98% of<br />
the investible U.S. equity market).<br />
Russell 2000 Growth Index — The Russell 2000 Growth<br />
Index is an unmanaged index that measures the performance<br />
of those companies in the Russell 2000 Index with higher<br />
price-to-book ratios and higher forecasted growth values. The<br />
Russell 2000 Index is an unmanaged, market capitalizationweighted<br />
index that measures the performance of the 2000<br />
smallest of the 3000 largest publicly traded U.S. companies,<br />
based on total market capitalization.<br />
Russell 2000 Value Index — The Russell 2000 Value Index<br />
is an unmanaged index measures the performance of those<br />
Russell 2000 companies with lower price-to-book ratios and<br />
lower forecasted growth values. The Russell 2000 Index is an<br />
unmanaged, market-capitalization weighted index that<br />
measures the performance of the 2000 smallest of the 3000<br />
largest publicly traded U.S. companies, based on total market<br />
capitalization.<br />
Russell 2500 Value Index — The Russell 2500 Value Index<br />
is an unmanaged index that measures the performance of<br />
those companies in the Russell 2500 Index with lower priceto-book<br />
ratios and lower forecasted growth values.<br />
Russell 2500 Index — The Russell 2500 Index is an<br />
unmanaged index that measures the performance of the 2500<br />
smallest companies in the Russell 3000 Index, which<br />
represents approximately 16% of the total market<br />
capitalization of the Russell 3000 Index.<br />
Russell MidCap Growth Index — The Russell MidCap<br />
Growth Index is an unmanaged index that measures the<br />
performance of the Russell MidCap companies with higher<br />
price-to-book ratios and higher forecasted growth values. The<br />
Russell MidCap Index is an unmanaged index that measures<br />
the performance of the 800 smallest companies in the Russell<br />
1000 Index, which represents approximately 25% of the total<br />
market capitalization of the Russell 1000 Index.<br />
Russell MidCap Value Index — The Russell MidCap Value<br />
Index is an unmanaged index that measures the performance<br />
of the Russell MidCap companies with lower price-to-book<br />
and lower forecasted growth values. The Russell MidCap<br />
Index is an unmanaged index that measures the performance<br />
of the 800 smallest companies in the Russell 1000 Index,<br />
which represents approximately 25% of the total market<br />
capitalization of the Russell 1000 Index.<br />
188 Benchmark Definitions
Benchmark Definitions<br />
S&P 500 Index — The S&P 500 ® Composite Stock Price<br />
Index is an unmanaged, capitalization-weighted index of 500<br />
selected common stocks designed to measure the<br />
performance of the broad domestic economy.<br />
S&P Global ex-US LargeMidCap Index — The S&P<br />
Global ex-US LargeMidCap Index is an unmanaged,<br />
capitalization-weighted index which includes companies in<br />
the top 85% of the S&P Global Broad Market Index (BMI) ,<br />
by capitalization. The S&P Global BMI includes companies<br />
in developed and emerging markets (excluding the U.S.) with<br />
more than $100 million (USD) of free float capitalization.<br />
S&P MidCap 400 Index — The Standard & Poor’s MidCap<br />
400 Index is an unmanaged, capitalization-weighted index<br />
that measures the performance of the mid-range sector of the<br />
U.S. stock market.<br />
S&P SmallCap 600 Index — The Standard & Poor’s<br />
SmallCap 600 Index is an unmanaged index of 600 selected<br />
common stocks of U.S.-based companies with small market<br />
capitalizations.<br />
Benchmark Definitions 189
Statements of Assets and Liabilities<br />
<strong>Northwestern</strong> <strong>Mutual</strong> Series Fund, Inc.<br />
December 31, 2008<br />
(in thousands)I<br />
Growth Stock<br />
Portfolio<br />
Focused<br />
Appreciation<br />
Portfolio<br />
Large Cap Core<br />
Stock Portfolio<br />
Large Cap Index 500 Stock<br />
Blend Portfolio Portfolio<br />
Assets<br />
$ 406,324 $ 171,176 $ 310,375<br />
Cash & Cash 7,596 344 70 230 42<br />
Foreign Currency, at Value (2)................................... — — — — —<br />
Investment, at Value (1) ..........................................<br />
Equivalents.........................................<br />
$ 29,384 $ 1,229,006<br />
Collateral for Derivative Positions — — — — —<br />
Receivables:<br />
Portfolio Shares Sold .......................................... 142 132 250 5 564<br />
Investment Securities Sold .................................... — 477 — — —<br />
Futures Variation Margin...................................... 494 — 140 — 354<br />
Outstanding Swap Contracts, at Value ........................ — — — — —<br />
Foreign Currency Sold ........................................ — — — — —<br />
Due from Investment Advisor................................. — — — — —<br />
Prepaid Expenses and Other Assets ........................... — — — — —<br />
Dividends and Interest......................................... 551 — 465 82 2,727<br />
Total Assets ................................................ 415,107 172,129 311,300 29,701 1,232,693<br />
Liabilities<br />
Payables:<br />
Portfolio Shares Redeemed.................................... 271 51 184 1 846<br />
Investment Securities Purchased .............................. 859 394 310 284 —<br />
Futures Variation Margin...................................... — — — — —<br />
Securities Sold Short, at Value ................................ — — — — —<br />
Outstanding Swap Contracts, at Value ........................ — — — — —<br />
Foreign Currency Purchased .................................. — — — — —<br />
Collateral for Securities on Loan (3) .......................... — — — — —<br />
Investment Advisory Fees..................................... 159 117 123 18 216<br />
Accrued Expenses ............................................. 17 16 18 16 21<br />
Total Liabilities............................................ 1,306 578 635 319 1,083<br />
Net Assets .................................................. $ 413,801 $ 171,551 $ 310,665 $ 29,382 $ 1,231,610<br />
Represented By:<br />
Aggregate Paid in Capital (8), (9) ................................ $ 544,534 $ 224,671 $ 490,627 $ 50,091 $ 1,303,199<br />
Undistributed Net Investment Income (Loss) .................... 5,283 — 6,039 3 35,664<br />
Undistributed Accumulated Net Realized Gain (Loss) on<br />
Investments .................................................... (26,087) (9,878) (105,625) (10,150) 23,973<br />
Net Unrealized Appreciation (Depreciation) of:<br />
Investment Securities.......................................... (109,407) (43,242) (80,228) (10,562 ) (130,896)<br />
Futures Contracts .............................................. (522) — (148) — (330)<br />
Options Written................................................ — — — — —<br />
Short Sales..................................................... — — — — —<br />
Swap Contracts ................................................ — — — — —<br />
Foreign Currency Transactions................................ — — — — —<br />
Net Assets for Shares Outstanding (9) ........................... $ 413,801 $ 171,551 $ 310,665 $ 29,382 $ 1,231,610<br />
Net Asset Value, Offering and Redemption Price per Share..... $ 1.41 $ 1.20 $ 0.88 $ 0 .55 $ 1.95<br />
(1) Investments, at Cost ............................................. $ 515,731 $ 214,418 $ 390,603 $ 39,946 $ 1,359,902<br />
(2) Foreign Currency, at Cost ....................................... — — — — —<br />
(3) Securities on Loan ............................................... — — — — —<br />
(4) Premiums Received on Options Written ........................ — — — — —<br />
(5) Proceeds Received from Short Sales ............................ — — — — —<br />
(6) Premiums Paid on Swap Contracts .............................. — — — — —<br />
(7) Premiums Received from Swap Contracts ...................... — — — — —<br />
(8) Shares Outstanding .............................................. 293,045 143,414 354,351 53,893 632,811<br />
(9) Shares Authorized, $.01 Par Value .............................. 2,000,000 2,000,000 2,000,000 2,000,000 2,000,000<br />
The Accompanying Notes are an Integral Part of the Financial Statements.<br />
190 Statements of Assets and Liabilities
Large Company<br />
Value Portfolio<br />
Domestic<br />
Equity Portfolio<br />
Equity Income<br />
Portfolio<br />
Mid Cap<br />
Growth Stock<br />
Portfolio<br />
Index 400 Stock<br />
Portfolio<br />
Mid Cap Value<br />
Portfolio<br />
Small Cap<br />
Growth Stock<br />
Portfolio<br />
Index 600 Stock<br />
Portfolio<br />
Small Cap<br />
Value Portfolio<br />
$ 28,488 $ 281,129 $ 151,252 $ 705,876 $ 316,429 $ 74,129 $ 281,897 $ 18,585 $ 240,508<br />
— 139 128 1 42 281 5,465 1,055 93<br />
— — — — — — — — —<br />
— — — — — — — 1,620 —<br />
17 185 108 272 200 77 137 21 108<br />
91 — — — 3,636 259 2,661 4 173<br />
14 — — 295 696 — 179 — —<br />
— — — — — — 781 198 —<br />
— — — — — — — — —<br />
— — — — — — — 1 —<br />
— — — — — — — — —<br />
65 886 380 356 435 118 196 24 437<br />
28,675 282,339 151,868 706,800 321,438 74,864 291,316 21,508 241,319<br />
— 178 124 551 232 50 190 1 241<br />
71 446 — 10,282 1,604 63 6,340 307 67<br />
— — — — — — — — —<br />
— — — — — — — — —<br />
— — — — — — 5 4 —<br />
— — — — — — — — —<br />
— — — — — — — — —<br />
17 142 86 323 68 53 141 — 174<br />
17 17 17 18 19 17 19 22 20<br />
105 783 227 11,174 1,923 183 6,695 334 502<br />
$ 28,570 $ 281,556 $ 151,641 $ 695,626 $ 319,515 $ 74,681 $ 284,621 $ 21,174 $ 240,817<br />
$ 46,747 $ 470,810 $ 220,590 $ 967,189 $ 417,579 $ 113,706 $ 487,343 $ 30,720 $ 289,427<br />
92 10,653 4,885 2,018 6,402 945 50 (101 ) 2,183<br />
(5,652 ) (132,742 ) (8,231 ) (21,233) 6,520 (6,445) (131,057) (843 ) 6,382<br />
(12,612) (67,165) (65,603) (252,680) (111,828) (33,525) (72,726) (8,703 ) (57,175)<br />
(5 ) — — 332 842 — 229 — —<br />
— — — — — — — — —<br />
— — — — — — — — —<br />
— — — — — — 782 101 —<br />
— — — — — — — — —<br />
$ 28,570 $ 281,556 $ 151,641 $ 695,626 $ 319,515 $ 74,681 $ 284,621 $ 21,174 $ 240,817<br />
$ 0 .57 $ 0 .63 $ 0 .87 $ 1 .92 $ 0.90 $ 0.81 $ 1.09 $ 0 .64 $ 1.14<br />
$ 41,100 $ 348,294 $ 216,856 $ 958,556 $ 428,257 $ 107,654 $ 354,623 $ 27,288 $ 297,683<br />
— — — — — — — — —<br />
— — — — — — — — —<br />
— — — — — — — — —<br />
— — — — — — — — —<br />
— — — — — — — — —<br />
— — — — — — — — —<br />
50,357 446,202 174,785 362,680 353,569 91,672 261,780 33,330 212,040<br />
2,000,000 2,000,000 2,000,000 2,000,000 2,000,000 2,000,000 2,000,000 2,000,000 2,000,000<br />
The Accompanying Notes are an Integral Part of the Financial Statements.<br />
Statements of Assets and Liabilities 191
Statements of Assets and Liabilities<br />
<strong>Northwestern</strong> <strong>Mutual</strong> Series Fund, Inc.<br />
December 31, 2008<br />
(in thousands)I<br />
International<br />
Growth<br />
Portfolio<br />
Research<br />
International<br />
Core Portfolio<br />
International<br />
Equity Portfolio<br />
Emerging<br />
Markets Equity<br />
Portfolio<br />
Money Market<br />
Portfolio<br />
Assets<br />
$ 191,812 $ 32,929 $ 1,007,061 621,299<br />
Cash & Cash 935 369 87 880 98<br />
Foreign Currency, at Value (2)................................... 1,235 11 1,495 1 —<br />
Investment, at Value (1) ..........................................<br />
Equivalents.........................................<br />
$ 51,422 $<br />
Collateral for Derivative Positions 3,220 — — — —<br />
Receivables:<br />
Portfolio Shares Sold .......................................... 110 25 472 37 724<br />
Investment Securities Sold .................................... 394 164 160 53 —<br />
Futures Variation Margin...................................... — — — — —<br />
Outstanding Swap Contracts, at Value ........................ 316 — — — —<br />
Foreign Currency Sold ........................................ — 1 — — —<br />
Due from Investment Advisor................................. — 10 — — —<br />
Prepaid Expenses and Other Assets ........................... — — — — 109<br />
Dividends and Interest......................................... 452 34 1,533 148 2,073<br />
Total Assets ................................................ 198,474 33,543 1,010,808 52,541 624,303<br />
Liabilities<br />
Payables:<br />
Portfolio Shares Redeemed.................................... 88 1 792 35 1,518<br />
Investment Securities Purchased .............................. 824 61 — 14 —<br />
Futures Variation Margin...................................... — — — — —<br />
Securities Sold Short, at Value ................................ — — — — —<br />
Outstanding Swap Contracts, at Value ........................ 5 — — — —<br />
Foreign Currency Purchased .................................. 9 — — 5 —<br />
Collateral for Securities on Loan (3) .......................... — — — — —<br />
Investment Advisory Fees..................................... 119 — 524 34 165<br />
Accrued Expenses ............................................. 46 46 125 67 —<br />
Total Liabilities............................................ 1,091 108 1,441 155 1,683<br />
Net Assets .................................................. $ 197,383 $ 33,435 $ 1,009,367 $ 52,386 $ 622,620<br />
Represented By:<br />
Aggregate Paid in Capital (8), (9) ................................ $ 310,852 $ 55,822 $ 1,156,349 $ 99,445 $ 623,107<br />
Undistributed Net Investment Income (Loss) .................... 690 304 47,108 377 —<br />
Undistributed Accumulated Net Realized Gain (Loss) on<br />
Investments .................................................... (43,708) (10,305) 20,801 (19,028) —<br />
Net Unrealized Appreciation (Depreciation) of:<br />
Investment Securities.......................................... (70,753) (12,386) (214,812) (28,405 ) (487)<br />
Futures Contracts .............................................. — — — — —<br />
Options Written................................................ — — — — —<br />
Short Sales..................................................... — — — — —<br />
Swap Contracts ................................................ 316 — — — —<br />
Foreign Currency Transactions................................ (14) — (79) (3 ) —<br />
Net Assets for Shares Outstanding (9) ........................... $ 197,383 $ 33,435 $ 1,009,367 $ 52,386 $ 622,620<br />
Net Asset Value, Offering and Redemption Price per Share..... $ 0.86 $ 0.58 $ 1.32 $ 0 .53 $ 1.00<br />
(1) Investments, at Cost ............................................. $ 262,566 $ 45,315 $ 1,221,873 $ 79,828 $ 621,786<br />
(2) Foreign Currency, at Cost ....................................... 1,234 11 1,548 1 —<br />
(3) Securities on Loan ............................................... — — — — —<br />
(4) Premiums Received on Options Written ........................ — — — — —<br />
(5) Proceeds Received from Short Sales ............................ — — — — —<br />
(6) Premiums Paid on Swap Contracts .............................. — — — — —<br />
(7) Premiums Received from Swap Contracts ...................... — — — — —<br />
(8) Shares Outstanding .............................................. 230,205 57,611 763,228 97,919 623,107<br />
(9) Shares Authorized, $.01 Par Value .............................. 2,000,000 2,000,000 2,000,000 2,000,000 2,000,000<br />
The Accompanying Notes are an Integral Part of the Financial Statements.<br />
192 Statements of Assets and Liabilities
Short-Term<br />
Bond Portfolio<br />
Select Bond<br />
Portfolio<br />
Long-Term<br />
U.S.<br />
Government<br />
Bond Portfolio<br />
Inflation<br />
Protection<br />
Portfolio<br />
High Yield<br />
Bond Portfolio<br />
Multi-Sector<br />
Bond Portfolio<br />
Balanced<br />
Portfolio<br />
Asset<br />
Allocation<br />
Portfolio<br />
$ 68,164 $ 1,145,734 $ 109,530 $ 70,690 $ 206,931 $ 119,209 $ 1,974,574 $ 197,642<br />
1,210 491 — — 417 11,594 1,134 188<br />
— — — — — 1,171 708 113<br />
— — 824 — — 960 9,390 320<br />
5 273 150 109 66 113 396 109<br />
— — 10,125 — — 719 571 86<br />
— 2,181 — — — — 5,133 691<br />
— — — — — 233 9,881 59<br />
— — — — — — — —<br />
— — — — — — — —<br />
— — — — — — 106 16<br />
496 9,139 623 596 5,384 1,064 11,668 992<br />
69,875 1,157,818 121,252 71,395 212,798 135,063 2,013,561 200,216<br />
37 1,018 23 1 84 17 1,082 124<br />
— 1 30,460 — 604 33,812 2,251 322<br />
— — 499 — — 82 — —<br />
— — — — — 727 — —<br />
— — — 2,204 — 5,267 8,305 1<br />
— — — — — 958 1 —<br />
— 67,859 — — — — 6,694 —<br />
22 293 43 35 85 65 527 88<br />
19 — 21 15 22 14 — 41<br />
78 69,171 31,046 2,255 795 40,942 18,860 576<br />
$ 69,797 $ 1,088,647 $ 90,206 $ 69,140 $ 212,003 $ 94,121 $ 1,994,701 $ 199,640<br />
$ 70,854 $ 1,069,699 $ 77,767 $ 72,199 $ 314,949 $ 108,748 $ 2,369,845 $ 261,791<br />
24 55,080 18 73 22,518 (264) 88,315 6,075<br />
(120 ) (12,499 ) 7,760 (439) (51,896) (1,245) (146,363) (27,637 )<br />
(979 ) (18,040 ) 2,520 (490) (73,568) (12,022) (312,913) (40,120 )<br />
18 (5,593 ) 2,141 — — 4,098 (5,890) (527 )<br />
— — — — — — — —<br />
— — — — — (7) — —<br />
— — — (2,203) — (4,216) 1,713 59<br />
— — — — — (971) (6) (1 )<br />
$ 69,797 $ 1,088,647 $ 90,206 $ 69,140 $ 212,003 $ 94,121 $ 1,994,701 $ 199,640<br />
$ 0 .99 $ 1 .21 $ 1 .22 $ 0 .99 $ 0.51 $ 0.85 $ 1.10 $ 0 .77<br />
$ 69,143 $ 1,163,774 $ 107,010 $ 71,180 $ 280,499 $ 131,231 $ 2,287,487 $ 237,762<br />
— — — — — 1,174 708 113<br />
— 65,591 — — — — 6,383 —<br />
— — — — — — — —<br />
— — — — — 720 — —<br />
— — — — — 207 — —<br />
— — — — — 1,071 — —<br />
70,618 901,270 73,870 69,923 414,894 110,586 1,812,296<br />
2,000,000 2,000,000 2,000,000 2,000,000 2,000,000 2,000,000 3,000,000<br />
257,740<br />
2,000,000<br />
The Accompanying Notes are an Integral Part of the Financial Statements.<br />
Statements of Assets and Liabilities 193
Statements of Operations<br />
<strong>Northwestern</strong> <strong>Mutual</strong> Series Fund, Inc.<br />
For the Year Ended December 31, 2008<br />
(in thousands)<br />
Growth Stock<br />
Portfolio<br />
Focused<br />
Appreciation<br />
Portfolio<br />
Large Cap<br />
Core Stock<br />
Portfolio<br />
Large Cap<br />
Blend<br />
Portfolio<br />
Index 500<br />
Stock Portfolio<br />
Large<br />
Company<br />
Value<br />
Portfolio<br />
Investment Income<br />
Income<br />
Interest............................................................. $ 1,120 $ 725 $ 386 $ 26 $ 867 $ 31<br />
Dividends (1)..................................................... 6,752 904 7,628 661 38,768 1,011<br />
Total Income ............................................. 7,872 1,629 8,014 687 39,635 1,042<br />
Expenses<br />
Investment Advisory Fees ..................................... 2,553 1,808 1,940 265 3,399 234<br />
Custodian Fees................................................... 15 7 14 15 31 9<br />
Audit Fees......................................................... 18 17 18 18 16 17<br />
Other Expenses .................................................. 4 3 4 3 5 3<br />
Total Expenses........................................... 2,590 1,835 1,976 301 3,451 263<br />
Less Waived Fees:<br />
Paid by Affiliate .......................................... — — — (8) — (3)<br />
Paid Indirectly ............................................ (1) (1) (1) (1 ) (1) —<br />
Total Net Expenses ..................................... 2,589 1,834 1,975 292 3,450 260<br />
Net Investment Income (Loss) 5,283 (205) 6,039 395 36,185 782<br />
Realized and Unrealized Gain (Loss) on Investments<br />
Net Realized Gain (Loss) on:<br />
Investment Securities........................................... (15,660 ) (9,230 ) (19,745 ) (9,683 ) 43,254 (4,885 )<br />
Futures Contracts................................................ (10,391) — (583) — (12,205) (709)<br />
Options Written.................................................. — — — — — —<br />
Swap Contracts .................................................. — — — — — —<br />
Foreign Currency Transactions............................... — — — — — —<br />
Net Realized Gain (Loss) on Investments ........ (26,051) (9,230) (20,328) (9,683 ) 31,049 (5,594)<br />
Net Unrealized Appreciation (Depreciation) of:<br />
Investment Securities........................................... (253,472) (103,914) (190,481) (8,222) (804,194) (10,220)<br />
Futures Contracts................................................ (535) — (207) — (360) 11<br />
Options Written.................................................. — — — — — —<br />
Short Sales ........................................................ — — — — — —<br />
Swap Contracts .................................................. — — — — — —<br />
Foreign Currency Transactions............................... — — — — — —<br />
Net Change in Unrealized Appreciation<br />
(Depreciation) of Investments ....................... (254,007) (103,914) (190,688) (8,222 ) (804,554) (10,209)<br />
Net Gain (Loss) on Investments ................................. (280,058) (113,144) (211,016) (17,905) (773,505) (15,803)<br />
Net Increase (Decrease) in Net Assets Resulting from<br />
Operations................................................................ $ (274,775) $ (113,349) $ (204,977) $ (17,510) $ (737,320) $ (15,021)<br />
(1) Less Foreign Dividend Tax................................... $ 45 $ 40 $ 6 $ 7 $ 1 $ 7<br />
The Accompanying Notes are an Integral Part of the Financial Statements.<br />
194 Statements of Operations
<strong>Northwestern</strong> <strong>Mutual</strong> Series Fund, Inc.<br />
For the Six Month Ended December 31, 2008<br />
(Unaudited)<br />
(in thousands)<br />
Domestic<br />
Equity<br />
Portfolio<br />
Equity Income<br />
Portfolio<br />
Mid Cap<br />
Growth Stock<br />
Portfolio<br />
Index 400 Mid Cap Value<br />
Stock Portfolio Portfolio<br />
Small Cap<br />
Growth Stock<br />
Portfolio<br />
Index 600<br />
Stock Portfolio<br />
Small Cap<br />
Value<br />
Portfolio<br />
$ 686 $ 266 $ 1,690 $ 907 $ 64 $ 1,062 $ 136 $ 399<br />
12,097 5,866 5,716 7,207 1,820 1,320 273 4,954<br />
12,783 6,132 7,406 8,114 1,884 2,382 409 5,353<br />
2,072 1,216 5,355 1,153 846 2,283 59 2,622<br />
11 13 13 22 14 27 51 28<br />
17 18 19 17 17 18 17 17<br />
4 4 4 5 4 4 4 4<br />
2,104 1,251 5,391 1,197 881 2,332 131 2,671<br />
— — — — — — (48) —<br />
(1 ) (1 ) (1 ) (2 ) (1) (2) (1) (2)<br />
2,103 1,250 5,390 1,195 880 2,330 82 2,669<br />
10,680 4,882 2,016 6,919 1,004 52 327 2,684<br />
(131,784 ) (7,481 ) (14,370 ) 26,654 (6,480 ) (121,597 ) (367 ) 6,023<br />
— — (6,534 ) (18,432) — (7,958) — —<br />
— — — — — 108 — —<br />
— — — — — (6) (1,811) —<br />
— 3 — — — — — —<br />
(131,784 ) (7,478 ) (20,904 ) 8,222 (6,480) (129,453) (2,178) 6,023<br />
(53,357) (77,745) (466,658) (203,275) (33,639) (99,034) (7,053) (103,713)<br />
— — 129 562 — (374) — —<br />
— — — — — — — —<br />
— — — — — — — —<br />
— — — — — 781 144 —<br />
— — — — — — — —<br />
(53,357) (77,745) (466,529) (202,713) (33,639) (98,627) (6,909 ) (103,713)<br />
(185,141) (85,223) (487,433) (194,491) (40,119) (228,080) (9,087 ) (97,690)<br />
$ (174,461 ) $ (80,341 ) $ (485,417 ) $ (187,572 ) $ (39,115) $ (228,028) $ (8,760 ) $ (95,006 )<br />
$ 160 $ 24 $ 24 $ — $ 3 $ 5 $ — $ 2<br />
The Accompanying Notes are an Integral Part of the Financial Statements.<br />
Statements of Opeations 195
Statements of Operations<br />
<strong>Northwestern</strong> <strong>Mutual</strong> Series Fund, Inc.<br />
For the Year Ended December 31, 2008<br />
(in thousands)<br />
International<br />
Growth<br />
Portfolio<br />
Research<br />
International<br />
Core Portfolio<br />
International<br />
Equity<br />
Portfolio<br />
Emerging<br />
Markets<br />
Equity<br />
Portfolio<br />
Money Market<br />
Portfolio<br />
Short-Term<br />
Bond Portfolio<br />
Investment Income<br />
Income<br />
Interest............................................................. $ 647 $ 26 $ 2,810 $ 24 $ 16,141 $ 3,054<br />
Dividends (1)..................................................... 6,382 1,432 54,856 2,876 — —<br />
Total Income ............................................. 7,029 1,458 57,666 2,900 16,141 3,054<br />
Expenses<br />
Investment Advisory Fees ..................................... 1,894 375 9,701 919 1,625 227<br />
Custodian Fees................................................... 322 312 719 465 — 10<br />
Audit Fees......................................................... 19 19 19 19 — 20<br />
Other Expenses .................................................. 43 14 5 41 93 3<br />
Total Expenses........................................... 2,278 720 10,444 1,444 1,718 260<br />
Less Waived Fees:<br />
Paid by Affiliate .......................................... (39) (230) (920) (235) (5) —<br />
Paid Indirectly ............................................ — — — — — (1)<br />
Total Net Expenses ..................................... 2,239 490 9,524 1,209 1,713 259<br />
Net Investment Income (Loss) 4,790 968 48,142 1,691 14,428 2,795<br />
Realized and Unrealized Gain (Loss) on Investments<br />
Net Realized Gain (Loss) on:<br />
Investment Securities........................................... (43,416 ) (10,187 ) 21,995 (18,560 ) 115 (196 )<br />
Futures Contracts................................................ — — — — — 170<br />
Options Written.................................................. — — — — — —<br />
Swap Contracts .................................................. (4,165) — — — — —<br />
Foreign Currency Transactions............................... (104) (15) (688) (85) — (1)<br />
Net Realized Gain (Loss) on Investments ........ (47,685) (10,202) 21,307 (18,645) 115 (27 )<br />
Net Unrealized Appreciation (Depreciation) of:<br />
Investment Securities........................................... (123,333) (13,515) (874,701) (42,134) (487) (1,136)<br />
Futures Contracts................................................ — — — — — 18<br />
Options Written.................................................. — — — — — —<br />
Short Sales ........................................................ — — — — — —<br />
Swap Contracts .................................................. 316 — — — — —<br />
Foreign Currency Transactions............................... (22 ) (2) (83 ) 2 — —<br />
Net Change in Unrealized Appreciation<br />
(Depreciation) of Investments ....................... (123,039) (13,517) (874,784) (42,132) (487) (1,118 )<br />
Net Gain (Loss) on Investments ................................. (170,724) (23,719) (853,477) (60,777) (372) (1,145 )<br />
Net Increase (Decrease) in Net Assets Resulting from<br />
Operations................................................................ $ (165,934) $ (22,751) $ (805,335) $ (59,086) $ 14,056 $ 1,650<br />
(1) Less Foreign Dividend Tax................................... $ 235 $ 69 $ 2,132 $ 116 $ — $ —<br />
The Accompanying Notes are an Integral Part of the Financial Statements.<br />
196 Statements of Operations
<strong>Northwestern</strong> <strong>Mutual</strong> Series Fund, Inc.<br />
For the Six Month Ended December 31, 2008<br />
(Unaudited)<br />
(in thousands)<br />
Select Bond<br />
Portfolio<br />
Long-Term<br />
U.S.<br />
Government<br />
Bond Portfolio<br />
Inflation<br />
Protection<br />
Portfolio<br />
High Yield Multi-Sector<br />
Bond Portfolio Bond Portfolio<br />
Balanced<br />
Portfolio<br />
Asset<br />
Allocation<br />
Portfolio<br />
$ 60,723 $ 1,794 $ 2,791 $ 23,745 $ 4,727 $ 75,289 $ 6,328<br />
— — — — — 13,779 1,818<br />
60,723 1,794 2,791 23,745 4,727 89,068 8,146<br />
3,402 319 326 1,203 708 7,505 1,378<br />
— 8 4 16 49 — 126<br />
— 25 18 21 24 — 19<br />
— 2 2 5 4 — 24<br />
3,402 354 350 1,245 785 7,505 1,547<br />
— — — — — — (142)<br />
— — — (1 ) — — (1)<br />
3,402 354 350 1,244 785 7,505 1,404<br />
57,321 1,440 2,441 22,501 3,942 81,563 6,742<br />
1,337 2,638 (344 ) (18,668 ) (1,364 ) (70,481 ) (11,533 )<br />
1,778 5,375 (60 ) — 416 (76,175) (15,891)<br />
— 10 — — 266 13 2<br />
— — — — 128 4,679 (576)<br />
(15 ) — — — 1,986 33 6<br />
3,100 8,023 (404 ) (18,668 ) 1,432 (141,931) (27,992)<br />
(20,860) 1,876 (1,658 ) (63,360) (11,183) (561,942) (68,292)<br />
(5,593 ) 2,165 — — 3,634 (5,927) (564)<br />
— (4 ) — — 188 — —<br />
— — — — (14) — —<br />
— — (2,195 ) — (4,192) 6,584 59<br />
— — — — (844) (10 ) (2)<br />
(26,453) 4,037 (3,853 ) (63,360) (12,411) (561,295) (68,799)<br />
(23,353) 12,060 (4,257 ) (82,028) (10,979) (703,226) (96,791)<br />
$ 33,968 $ 13,500 $ (1,816 ) $ (59,527 ) $ (7,037 ) $ (621,663) $ (90,049)<br />
$ — $ — $ — $ — $ — $ 719 $ 115<br />
The Accompanying Notes are an Integral Part of the Financial Statements.<br />
Statements of Opeations 197
Statements of Changes in Net Assets<br />
<strong>Northwestern</strong> <strong>Mutual</strong> Series Fund, Inc.<br />
(Amounts in thousands)<br />
Growth Stock Portfolio<br />
Focused Appreciation<br />
Portfolio<br />
Large Cap Core Stock<br />
Portfolio<br />
For the Year<br />
Ended<br />
December<br />
31, 2008<br />
For the Year<br />
Ended<br />
December<br />
31, 2007<br />
For the Year<br />
Ended<br />
December<br />
31, 2008<br />
For the Year<br />
Ended<br />
December<br />
31, 2007<br />
For the Year<br />
Ended<br />
December<br />
31, 2008<br />
For the Year<br />
Ended<br />
December<br />
31, 2007<br />
Change in Net Assets<br />
Operations<br />
Net Investment Income (Loss) .................. $ 5,283 $ 6,332 $ (205) $ 764 $ 6,039 $ 7,217<br />
Net Realized Gain (Loss) on Investments..... (26,051 ) 48,892 (9,230 ) 5,886 (20,328 ) 42,659<br />
Net Change in Unrealized Appreciation<br />
(Depreciation) of Investments................ (254,007 ) 10,608 (103,914 ) 36,115 (190,688 ) (1,994 )<br />
Net Increase (Decrease) in Net Assets<br />
Resulting from Operations.................... (274,775 ) 65,832 (113,349 ) 42,765 (204,977 ) 47,882<br />
Distributions to Shareholders from:<br />
Net Investment Income........................... (6,333 ) (6,654 ) (815 ) (79 ) (7,218 ) (6,345 )<br />
Net Realized Gain on Investments ............. (39,360 ) — (6,315 ) (272 ) — —<br />
Tax Return of Capital ............................ — — — — — —<br />
Net Decrease in Net Assets Resulting from<br />
Distributions to Shareholders .............. (45,693 ) (6,654 ) (7,130 ) (351 ) (7,218 ) (6,345 )<br />
Capital Transactions:<br />
Shares Sold......................................... 35,635 42,356 88,311 75,333 33,098 39,350<br />
Reinvestment of Distributions Paid 45,693 6,654 7,130 351 7,218 6,345<br />
Shares Redeemed ................................. (95,388 ) (94,914 ) (33,848 ) (26,242 ) (74,351 ) (65,790 )<br />
Net Increase (Decrease) in Net Assets<br />
Resulting from Capital Transactions ..... (14,060 ) (45,904 ) 61,593 49,442 (34,035 ) (20,095 )<br />
Total Increase (Decrease) in Net Assets.......... (334,528 ) 13,274 (58,886 ) 91,856 (246,230 ) 21,442<br />
Net Assets<br />
Beginning of Period ................................. 748,329 735,055 230,437 138,581 556,895 535,453<br />
End of Period......................................... $ 413,801 $ 748,329 $ 171,551 $ 230,437 $ 310,665 $ 556,895<br />
Undistributed Net Investment Income (Loss) ... $ 5,283 $ 6,332 $ — $ 764 $ 6,039 $ 7,217<br />
Portfolio Share Transactions: ......................<br />
Shares Sold......................................... 18,488 17,436 47,993 41,606 27,824 27,616<br />
Reinvestment of Distributions Paid ............ 22,366 2,751 3,786 199 5,783 4,487<br />
Shares Redeemed (48,615 ) (39,135 ) (20,932 ) (14,867 ) (62,192 ) (46,263 )<br />
Net Increase (Decrease) in Shares<br />
Resulting from Portfolio Share<br />
Transactions .................................. (7,761 ) (18,948 ) 30,847 26,938 (28,585 ) (14,160 )<br />
The Accompanying Notes are an Integral Part of the Financial Statements.<br />
198 Statements of Changes in Net Assets
Large Cap Blend Portfolio Index 500 Stock Portfolio<br />
For the Year<br />
Ended<br />
December<br />
31, 2008<br />
For the<br />
Period<br />
Ended<br />
December<br />
31, 2007<br />
For the Year<br />
Ended<br />
December<br />
31, 2008<br />
For the Year<br />
Ended<br />
December<br />
31, 2007<br />
Large Company Value<br />
Portfolio<br />
For the Year<br />
Ended<br />
December<br />
31, 2008<br />
For the<br />
Period<br />
Ended<br />
December<br />
31, 2007<br />
Domestic Equity Portfolio<br />
For the Year<br />
Ended<br />
December<br />
31, 2008<br />
For the Year<br />
Ended<br />
December<br />
31, 2007<br />
$ 395 $ 199 $ 36,185 $ 40,347 $ 782 $ 398 $ 10,680 $ 10,859<br />
(9,683 ) (290 ) 31,049 50,827 (5,594 ) 33 (131,784 ) 30,468<br />
(8,222 ) (2,345 ) (804,554 ) 21,806 (10,209 ) (2,409 ) (53,357 ) (72,032 )<br />
(17,510 ) (2,436 ) (737,320 ) 112,980 (15,021 ) (1,978 ) (174,461 ) (30,705 )<br />
(394 ) (193 ) (38,107 ) (34,512 ) (693 ) (393 ) (10,737 ) (6,574 )<br />
— (176 ) (53,885 ) (77,447 ) (86 ) (6 ) (31,436 ) (19,663 )<br />
— — — — — — — —<br />
(394 ) (369 ) (91,992 ) (111,959 ) (779 ) (399 ) (42,173 ) (26,237 )<br />
14,572 38,144 109,588 134,701 13,988 35,398 60,559 107,643<br />
394 370 91,992 111,959 779 399 42,173 26,237<br />
(2,615 ) (774 ) (229,493 ) (240,245 ) (3,092 ) (725 ) (44,438 ) (46,878 )<br />
12,351 37,740 (27,913 ) 6,415 11,675 35,072 58,294 87,002<br />
(5,553 ) 34,935 (857,225 ) 7,436 (4,125 ) 32,695 (158,340 ) 30,060<br />
34,935 — 2,088,835 2,081,399 32,695 — 439,896 409,836<br />
$ 29,382 $ 34,935 $ 1,231,610 $ 2,088,835 $ 28,570 $ 32,695 $ 281,556 $ 439,896<br />
$ 3 $ 1 $ 35,664 $ 38,166 $ 92 $ 4 $ 10,653 $ 10,731<br />
19,125 38,147 42,447 40,287 18,076 35,531 66,504 82,272<br />
749 396 34,147 34,555 1,373 422 49,672 20,839<br />
(3,744 ) (781 ) (85,290 ) (71,813 ) (4,301 ) (745 ) (51,263 ) (35,684 )<br />
16,130 37,762 (8,696 ) 3,029 15,148 35,208 64,913 67,427<br />
The Accompanying Notes are an Integral Part of the Financial Statements.<br />
Statements of Changes in Net Assets 199
Statements of Changes in Net Assets<br />
<strong>Northwestern</strong> <strong>Mutual</strong> Series Fund, Inc.<br />
(Amounts in thousands)<br />
Equity Income Portfolio<br />
Mid Cap Growth Stock<br />
Portfolio<br />
Index 400 Stock Portfolio<br />
For the Year<br />
Ended<br />
December<br />
31, 2008<br />
For the Year<br />
Ended<br />
December<br />
31, 2007<br />
For the Year<br />
Ended<br />
December<br />
31, 2008<br />
For the Year<br />
Ended<br />
December<br />
31, 2007<br />
For the Year<br />
Ended<br />
December<br />
31, 2008<br />
For the Year<br />
Ended<br />
December<br />
31, 2007<br />
Change in Net Assets<br />
Operations<br />
Net Investment Income (Loss) .................. $ 4,882 $ 4,325 $ 2,016 $ 3,214 $ 6,919 $ 8,206<br />
Net Realized Gain (Loss) on Investments..... (7,478 ) 23,724 (20,904 ) 138,437 8,222 46,979<br />
Net Change in Unrealized Appreciation<br />
(Depreciation) of Investments................ (77,745 ) (19,879 ) (466,529 ) 90,846 (202,713 ) (12,722 )<br />
Net Increase (Decrease) in Net Assets<br />
Resulting from Operations ................. (80,341 ) 8,170 (485,417 ) 232,497 (187,572 ) 42,463<br />
Distributions to Shareholders from:<br />
Net Investment Income........................... (48 ) (4,277 ) (3,036 ) (9,438 ) (7,152 ) (7,054 )<br />
Net Realized Gain on Investments ............. (4,448 ) (21,762 ) (137,000 ) (106,812 ) (48,480 ) (31,212 )<br />
Tax Return of Capital ............................ — — — — — —<br />
Net Decrease in Net Assets Resulting from<br />
Distributions to Shareholders .............. (4,496 ) (26,039 ) (140,036 ) (116,250 ) (55,632 ) (38,266 )<br />
Capital Transactions:<br />
Shares Sold......................................... 42,432 75,621 48,167 60,263 34,167 59,015<br />
Reinvestment of Distributions Paid 4,496 26,039 140,036 116,250 55,632 38,266<br />
Shares Redeemed ................................. (22,878 ) (71,870 ) (161,827 ) (181,541 ) (85,216 ) (77,082 )<br />
Net Increase (Decrease) in Net Assets<br />
Resulting from Capital Transactions ..... 24,050 29,790 26,376 (5,028 ) 4,583 20,199<br />
Total Increase (Decrease) in Net Assets.......... (60,787 ) 11,921 (599,077 ) 111,219 (238,621 ) 24,396<br />
Net Assets<br />
Beginning of Period ................................. 212,428 200,507 1,294,703 1,183,484 558,136 533,740<br />
End of Period......................................... $ 151,641 $ 212,428 $ 695,626 $ 1,294,703 $ 319,515 $ 558,136<br />
Undistributed Net Investment Income (Loss) ... $ 4,885 $ 70 $ 2,018 $ 3,036 $ 6,402 $ 7,713<br />
Portfolio Share Transactions: ......................<br />
Shares Sold......................................... 37,085 47,810 17,090 16,769 26,944 35,292<br />
Reinvestment of Distributions Paid ............ 3,820 18,789 49,941 34,404 41,923 23,886<br />
Shares Redeemed (19,618 ) (44,381 ) (56,525 ) (50,577 ) (64,738 ) (46,264 )<br />
Net Increase (Decrease) in Shares<br />
Resulting from Portfolio Share<br />
Transactions .................................. 21,287 22,218 10,506 596 4,129 12,914<br />
The Accompanying Notes are an Integral Part of the Financial Statements.<br />
200 Statements of Changes in Net Assets
Mid Cap Value Portfolio<br />
For the Year<br />
Ended<br />
December<br />
31, 2008<br />
For the Year<br />
Ended<br />
December<br />
31, 2007<br />
Small Cap Growth Stock<br />
Portfolio<br />
For the Year<br />
Ended<br />
December<br />
31, 2008<br />
For the Year<br />
Ended<br />
December<br />
31, 2007<br />
Index 600 Stock Portfolio Small Cap Value Portfolio<br />
For the Year<br />
Ended<br />
December<br />
31, 2008<br />
For the<br />
Period<br />
Ended<br />
December<br />
31, 2007<br />
For the Year<br />
Ended<br />
December<br />
31, 2008<br />
For the Year<br />
Ended<br />
December<br />
31, 2007<br />
$ 1,004 $ 929 $ 52 $ 722 $ 327 $ 317 $ 2,684 $ 2,808<br />
(6,480 ) 18,111 (129,453 ) 79,942 (2,178 ) (174 ) 6,023 24,507<br />
(33,639 ) (17,131 ) (98,627 ) (32,057 ) (6,909 ) (1,704 ) (103,713 ) (31,256 )<br />
(39,115 ) 1,909 (228,028 ) 48,607 (8,760 ) (1,561 ) (95,006 ) (3,941 )<br />
— (936 ) (722 ) (423 ) — — (1,067 ) (1,455 )<br />
(2,153 ) (17,985 ) (81,232 ) (48,710 ) (196 ) (105 ) (26,003 ) (18,704 )<br />
— — — — — (102 ) — —<br />
(2,153 ) (18,921 ) (81,954 ) (49,133 ) (196 ) (207 ) (27,070 ) (20,159 )<br />
17,996 52,486 39,211 50,122 8,257 26,427 40,790 61,401<br />
2,153 18,921 81,954 49,133 196 207 27,070 20,159<br />
(18,655 ) (70,956 ) (70,548 ) (83,355 ) (2,362 ) (827 ) (42,940 ) (44,460 )<br />
1,494 451 50,617 15,900 6,091 25,807 24,920 37,100<br />
(39,774 ) (16,561 ) (259,365 ) 15,374 (2,865 ) 24,039 (97,156 ) 13,000<br />
114,455 131,016 543,986 528,612 24,039 — 337,973 324,973<br />
$ 74,681 $ 114,455 $ 284,621 $ 543,986 $ 21,174 $ 24,039 $ 240,817 $ 337,973<br />
$ 945 $ — $ 50 $ 722 $ (101 ) $ — $ 2,183 $ 2,251<br />
16,651 32,178 23,939 20,309 10,546 26,383 26,705 32,719<br />
1,806 14,457 50,527 21,635 308 220 17,122 11,306<br />
(16,153 ) (43,074 ) (42,075 ) (34,363 ) (3,293 ) (834 ) (28,440 ) (24,158 )<br />
2,304 3,561 32,391 7,581 7,561 25,769 15,387 19,867<br />
The Accompanying Notes are an Integral Part of the Financial Statements.<br />
Statements of Changes in Net Assets 201
Statements of Changes in Net Assets<br />
<strong>Northwestern</strong> <strong>Mutual</strong> Series Fund, Inc.<br />
(Amounts in thousands)<br />
International Growth<br />
Portfolio<br />
For the Year<br />
Ended<br />
December<br />
31, 2008<br />
For the Year<br />
Ended<br />
December<br />
31, 2007<br />
Research International<br />
Core Portfolio<br />
For the Year<br />
Ended<br />
December<br />
31, 2008<br />
For the<br />
Period<br />
Ended<br />
December<br />
31, 2007<br />
International Equity<br />
Portfolio<br />
For the Year<br />
Ended<br />
December<br />
31, 2008<br />
For the Year<br />
Ended<br />
December<br />
31, 2007<br />
Change in Net Assets<br />
Operations<br />
Net Investment Income (Loss) .................. $ 4,790 $ 4,469 $ 968 $ 320 $ 48,142 $ 39,263<br />
Net Realized Gain (Loss) on Investments..... (47,685 ) 34,002 (10,202 ) 691 21,307 145,061<br />
Net Change in Unrealized Appreciation<br />
(Depreciation) of Investments................ (123,039 ) (2,767 ) (13,517 ) 1,130 (874,784 ) 100,652<br />
Net Increase (Decrease) in Net Assets<br />
Resulting from Operations ................. (165,934 ) 35,704 (22,751 ) 2,141 (805,335 ) 284,976<br />
Distributions to Shareholders from:<br />
Net Investment Income........................... (4,245 ) (2,658 ) (616 ) (366 ) (39,219 ) (32,959 )<br />
Net Realized Gain on Investments ............. (33,233 ) (24,249 ) (363 ) (432 ) (144,743 ) (21,809 )<br />
Tax Return of Capital ............................ — — — — — —<br />
Net Decrease in Net Assets Resulting from<br />
Distributions to Shareholders .............. (37,478 ) (26,907 ) (979 ) (798 ) (183,962 ) (54,768 )<br />
Capital Transactions:<br />
Shares Sold......................................... 45,946 85,606 10,966 45,845 135,959 223,184<br />
Reinvestment of Distributions Paid 37,478 26,907 979 798 183,962 54,768<br />
Shares Redeemed ................................. (36,055 ) (40,766 ) (2,127 ) (639 ) (223,869 ) (161,778 )<br />
Net Increase (Decrease) in Net Assets<br />
Resulting from Capital Transactions ..... 47,369 71,747 9,818 46,004 96,052 116,174<br />
Total Increase (Decrease) in Net Assets.......... (156,043 ) 80,544 (13,912 ) 47,347 (893,245 ) 346,382<br />
Net Assets<br />
Beginning of Period ................................. 353,426 272,882 47,347 — 1,902,612 1,556,230<br />
End of Period......................................... $ 197,383 $ 353,426 $ 33,435 $ 47,347 $ 1,009,367 $ 1,902,612<br />
Undistributed Net Investment Income (Loss) ... $ 690 $ 4,292 $ 304 $ (37) $ 47,108 $ 38,873<br />
Portfolio Share Transactions: ......................<br />
Shares Sold......................................... 35,167 46,314 13,012 45,498 69,463 87,178<br />
Reinvestment of Distributions Paid ............ 28,851 15,142 1,506 774 94,728 21,410<br />
Shares Redeemed (27,512 ) (22,286 ) (2,563 ) (617 ) (113,584 ) (63,346 )<br />
Net Increase (Decrease) in Shares<br />
Resulting from Portfolio Share<br />
Transactions .................................. 36,506 39,170 11,955 45,655 50,607 45,242<br />
The Accompanying Notes are an Integral Part of the Financial Statements.<br />
202 Statements of Changes in Net Assets
Emerging Markets Equity<br />
Portfolio<br />
For the Year<br />
Ended<br />
December<br />
31, 2008<br />
For the<br />
Period<br />
Ended<br />
December<br />
31, 2007<br />
Money Market Portfolio<br />
For the Year<br />
Ended<br />
December<br />
31, 2008<br />
For the Year<br />
Ended<br />
December<br />
31, 2007<br />
Short-Term Bond<br />
Portfolio<br />
For the Year<br />
Ended<br />
December<br />
31, 2008<br />
For the<br />
Period<br />
Ended<br />
December<br />
31, 2007<br />
Select Bond Portfolio<br />
For the Year<br />
Ended<br />
December<br />
31, 2008<br />
For the Year<br />
Ended<br />
December<br />
31, 2007<br />
$ 1,691 $ 479 $ 14,428 $ 21,766 $ 2,795 $ 1,726 $ 57,321 $ 53,429<br />
(18,645 ) 327 115 — (27 ) (197 ) 3,100 3,056<br />
(42,132 ) 13,724 (487 ) — (1,118 ) 156 (26,453 ) 7,509<br />
(59,086 ) 14,530 14,056 21,766 1,650 1,685 33,968 63,994<br />
(1,853 ) (234 ) (14,428 ) (21,766 ) (2,714 ) (1,678 ) (52,811 ) (40,788 )<br />
(422 ) — (115 ) — — — — —<br />
— — — — — — — —<br />
(2,275 ) (234 ) (14,543 ) (21,766 ) (2,714 ) (1,678 ) (52,811 ) (40,788 )<br />
29,358 76,101 389,014 308,514 18,093 57,456 146,289 235,919<br />
2,276 234 14,543 21,766 2,714 1,678 52,811 40,788<br />
(7,450 ) (1,068 ) (242,542 ) (258,777 ) (7,944 ) (1,143 ) (206,257 ) (109,722 )<br />
24,184 75,267 161,015 71,503 12,863 57,991 (7,157 ) 166,984<br />
(37,177 ) 89,563 160,528 71,503 11,799 57,998 (26,000 ) 190,190<br />
89,563 — 462,092 390,589 57,998 — 1,114,647 924,457<br />
$ 52,386 $ 89,563 $ 622,620 $ 462,092 $ 69,797 $ 57,998 $ 1,088,647 $ 1,114,647<br />
$ 377 $ 176 $ — $ — $ 24 $ 7 $ 55,080 $ 52,668<br />
30,221 72,758 389,001 308,514 17,763 57,367 119,122 195,357<br />
3,820 188 14,543 21,766 2,755 1,682 44,529 34,802<br />
(8,111 ) (958 ) (242,542 ) (258,777 ) (7,818 ) (1,130 ) (171,786 ) (91,076 )<br />
25,930 71,988 161,002 71,503 12,700 57,919 (8,135 ) 139,083<br />
The Accompanying Notes are an Integral Part of the Financial Statements.<br />
Statements of Changes in Net Assets 203
Statements of Changes in Net Assets<br />
<strong>Northwestern</strong> <strong>Mutual</strong> Series Fund, Inc.<br />
(Amounts in thousands)<br />
Long-Term U.S.<br />
Government Bond<br />
Portfolio<br />
For the Year<br />
Ended<br />
December<br />
31, 2008<br />
For the<br />
Period<br />
Ended<br />
December<br />
31, 2007<br />
Inflation Protection<br />
Portfolio<br />
For the Year<br />
Ended<br />
December<br />
31, 2008<br />
For the<br />
Period<br />
Ended<br />
December<br />
31, 2007<br />
High Yield Bond Portfolio<br />
For the Year<br />
Ended<br />
December<br />
31, 2008<br />
For the Year<br />
Ended<br />
December<br />
31, 2007<br />
Change in Net Assets<br />
Operations<br />
Net Investment Income (Loss) .................. $ 1,440 $ 848 $ 2,441 $ 997 $ 22,501 $ 21,679<br />
Net Realized Gain (Loss) on Investments..... 8,023 928 (404 ) (7 ) (18,668 ) (145 )<br />
Net Change in Unrealized Appreciation<br />
(Depreciation) of Investments................ 4,037 623 (3,853 ) 1,160 (63,360 ) (15,150 )<br />
Net Increase (Decrease) in Net Assets<br />
Resulting from Operations ................. 13,500 2,399 (1,816 ) 2,150 (59,527 ) 6,384<br />
Distributions to Shareholders from:<br />
Net Investment Income........................... (1,430 ) (837 ) (2,377 ) (983 ) (21,340 ) (17,960 )<br />
Net Realized Gain on Investments ............. (1,013 ) (180 ) (96 ) — — —<br />
Tax Return of Capital ............................ — — — — — —<br />
Net Decrease in Net Assets Resulting from<br />
Distributions to Shareholders .............. (2,443 ) (1,017 ) (2,473 ) (983 ) (21,340 ) (17,960 )<br />
Capital Transactions:<br />
Shares Sold......................................... 55,267 34,266 44,745 35,809 27,796 51,602<br />
Reinvestment of Distributions Paid 2,443 1,017 2,473 983 21,340 17,960<br />
Shares Redeemed ................................. (14,376 ) (850 ) (11,251 ) (497 ) (49,194 ) (41,697 )<br />
Net Increase (Decrease) in Net Assets<br />
Resulting from Capital Transactions ..... 43,334 34,433 35,967 36,295 (58 ) 27,865<br />
Total Increase (Decrease) in Net Assets.......... 54,391 35,815 31,678 37,462 (80,925 ) 16,289<br />
Net Assets<br />
Beginning of Period ................................. 35,815 — 37,462 — 292,928 276,639<br />
End of Period......................................... $ 90,206 $ 35,815 $ 69,140 $ 37,462 $ 212,003 $ 292,928<br />
Undistributed Net Investment Income (Loss) ... $ 18 $ 11 $ 73 $ 10 $ 22,518 $ 21,340<br />
Portfolio Share Transactions: ......................<br />
Shares Sold......................................... 50,916 34,146 42,212 35,573 43,277 70,220<br />
Reinvestment of Distributions Paid ............ 2,078 1,002 2,478 949 33,554 26,296<br />
Shares Redeemed (13,437 ) (836 ) (10,805 ) (485 ) (78,163 ) (57,143 )<br />
Net Increase (Decrease) in Shares<br />
Resulting from Portfolio Share<br />
Transactions .................................. 39,557 34,312 33,885 36,037 (1,332 ) 39,373<br />
The Accompanying Notes are an Integral Part of the Financial Statements.<br />
204 Statements of Changes in Net Assets
Multi-Sector Bond<br />
Portfolio Balanced Portfolio Asset Allocation Portfolio<br />
For the Year<br />
Ended<br />
December<br />
31, 2008<br />
For the<br />
Period<br />
Ended<br />
December<br />
31, 2007<br />
For the Year<br />
Ended<br />
December<br />
31, 2008<br />
For the Year<br />
Ended<br />
December<br />
31, 2007<br />
For the Year<br />
Ended<br />
December<br />
31, 2008<br />
For the Year<br />
Ended<br />
December<br />
31, 2007<br />
$ 3,942 $ 2,180 $ 81,563 $ 95,163 $ 6,742 $ 7,718<br />
1,432 (381 ) (141,931 ) 640,384 (27,992 ) 21,061<br />
(12,411 ) (706 ) (561,295 ) (559,751 ) (68,799 ) (2,699 )<br />
(7,037 ) 1,093 (621,663 ) 175,796 (90,049 ) 26,080<br />
(6,192 ) (2,039 ) (32,256 ) (89,386 ) (7,584 ) (6,586 )<br />
(452 ) — (695,941 ) (52,696 ) (21,178 ) (13,969 )<br />
— — — — — —<br />
(6,644 ) (2,039 ) (728,197 ) (142,082 ) (28,762 ) (20,555 )<br />
34,950 74,493 113,319 145,041 33,330 34,341<br />
6,644 2,039 728,197 142,082 28,762 20,555<br />
(8,621 ) (757 ) (393,150 ) (374,274 ) (45,933 ) (39,992 )<br />
32,973 75,775 448,366 (87,151 ) 16,159 14,904<br />
19,292 74,829 (901,494 ) (53,437 ) (102,652 ) 20,429<br />
74,829 — 2,896,195 2,949,632 302,292 281,863<br />
$ 94,121 $ 74,829 $ 1,994,701 $ 2,896,195 $ 199,640 $ 302,292<br />
$ (264 ) $ (196 ) $ 88,315 $ 36,624 $ 6,075 $ 7,610<br />
36,195 74,759 71,372 72,345 31,039 27,471<br />
7,780 2,087 548,339 73,542 28,533 17,230<br />
(9,476 ) (759 ) (261,404 ) (186,840 ) (45,438 ) (31,988 )<br />
34,499 76,087 358,307 (40,953 ) 14,134 12,713<br />
The Accompanying Notes are an Integral Part of the Financial Statements.<br />
Statements of Changes in Net Assets 205
Financial Highlights<br />
(For a share outstanding throughout the period)<br />
Net Asset Value,<br />
Beginning<br />
of Period<br />
Net Investment<br />
Income (Loss)<br />
Net Realized and<br />
Unrealized Gain<br />
(Loss) on<br />
Investments<br />
Total from<br />
Investment<br />
Operations<br />
Distributions<br />
from Net<br />
Investment<br />
Income<br />
Distributions<br />
from Realized<br />
Gains on<br />
Investments<br />
Total<br />
Distributions<br />
Net Asset Value,<br />
End of Period<br />
Growth Stock Portfolio<br />
2008 . . . . $ 2 .49 $ 0 .02 $ (0 .94) $ (0 .92) $ (0 .02) $ (0 .14) $ (0 .16) $ 1.41<br />
2007 . . . . 2 .30 0 .02 0 .19 0.21 (0 .02) — (0 .02) 2.49<br />
2006 . . . . 2 .11 0 .02 0 .19 0.21 (0 .02) — (0 .02) 2.30<br />
2005 . . . . 1 .98 0 .02 0 .13 0.15 (0 .02) — (0 .02) 2.11<br />
2004 . . . . 1 .87 0 .01 0 .11 0.12 (0 .01) — (0 .01) 1.98<br />
Focused Appreciation Portfolio<br />
2008 . . . . $ 2 .05 $ 0 .00 (e) $ (0 .80) $ (0 .80) $ (0 .01) $ (0 .04) $ (0 .05) $ 1.20<br />
2007 . . . . 1 .62 0 .01 0 .42 0.43 0.00 (e) 0.00 (e) 0 .00 (e) 2.05<br />
2006 . . . . 1 .63 0 .01 0 .07 0.08 (0 .01) (0 .08) (0 .09) 1.62<br />
2005 . . . . 1 .43 — 0 .25 0.25 — (0 .05) (0 .05) 1.63<br />
2004 . . . . 1 .20 0 .00 (e) 0 .23 0.23 — — — 1.43<br />
Large Cap Core Stock Portfolio<br />
2008 . . . . $ 1 .45 $ 0 .02 $ (0 .57) $ (0 .55) $ (0 .02) $ — $ (0 .02) $ 0.88<br />
2007 . . . . 1 .35 0 .02 0 .10 0.12 (0 .02) — (0 .02) 1.45<br />
2006 . . . . 1 .22 0 .02 0 .12 0.14 (0 .01) — (0 .01) 1.35<br />
2005 . . . . 1 .14 0 .01 0 .09 0.10 (0 .02) — (0 .02) 1.22<br />
2004 . . . . 1 .07 0 .02 0 .06 0.08 (0 .01) — (0 .01) 1.14<br />
Large Cap Blend Portfolio<br />
2008 . . . . $ 0 .93 $ 0 .01 $ (0 .38) $ (0 .37) $ (0 .01) $ — $ (0 .01) $ 0.55<br />
2007 (h) . . . 1 .00 0 .01 (0 .07) (0 .06) (0 .01) 0.00 (e) (0 .01) 0.93<br />
Index 500 Stock Portfolio<br />
2008 . . . . $ 3 .26 $ 0 .06 $ (1 .22) $ (1 .16) $ (0 .06) $ (0 .09) $ (0 .15) $ 1.95<br />
2007 . . . . 3 .26 0 .06 0 .12 0.18 (0 .06) (0 .12) (0 .18) 3.26<br />
2006 . . . . 2 .97 0 .06 0 .39 0.45 (0 .05) (0 .11) (0 .16) 3.26<br />
2005 . . . . 2 .94 0 .05 0 .08 0.13 (0 .05) (0 .05) (0 .10) 2.97<br />
2004 . . . . 2 .72 0 .05 0 .24 0.29 (0 .04) (0 .03) (0 .07) 2.94<br />
Large Company Value Portfolio<br />
2008 . . . . $ 0 .93 $ 0 .02 $ (0 .36) $ (0 .34) $ (0 .02) $ 0.00 (e) $ (0 .02) $ 0.57<br />
2007 (h) . . . 1 .00 0 .01 (0 .07) (0 .06) (0 .01) — (0 .01) 0.93<br />
Domestic Equity Portfolio<br />
2008 . . . . $ 1 .15 $ 0 .03 $ (0 .44) $ (0 .41) $ (0 .03) $ (0 .08) $ (0 .11) $ 0.63<br />
2007 . . . . 1 .31 0 .03 (0 .11) (0 .08) (0 .02) (0 .06) (0 .08) 1.15<br />
2006 . . . . 1 .13 0 .02 0 .17 0.19 — (0 .01) (0 .01) 1.31<br />
2005 . . . . 1 .14 0 .02 0 .07 0.09 (0 .02) (0 .08) (0 .10) 1.13<br />
2004 . . . . 1 .00 0 .02 0 .15 0.17 (0 .01) (0 .02) (0 .03) 1.14<br />
Equity Income Portfolio<br />
2008 . . . . $ 1 .38 $ 0 .03 $ (0 .51) $ (0 .48) $ 0.00 (e) $ (0 .03) $ (0 .03) $ 0.87<br />
2007 . . . . 1 .53 0 .03 0 .01 0.04 (0 .03) (0 .16) (0 .19) 1.38<br />
2006 . . . . 1 .33 0 .02 0 .24 0.26 (0 .02) (0 .04) (0 .06) 1.53<br />
2005 . . . . 1 .35 0 .02 0 .04 0.06 (0 .02) (0 .06) (0 .08) 1.33<br />
2004 . . . . 1 .22 0 .02 0 .17 0.19 (0 .02) (0 .04) (0 .06) 1.35<br />
(e) Amount is less than $0.005.<br />
(h) For the period April 30, 2007 (commencement of operations) through December 31, 2007<br />
The Accompanying Notes are an Integral Part of the Financial Statements.<br />
206 Financial Highlights
Total Return (d)<br />
Net Assets, End<br />
of Period<br />
(thousands)<br />
Ratio of Gross<br />
Expenses to<br />
Average Net<br />
Assets<br />
Ratio of Net<br />
Expenses to<br />
Average Net<br />
Assets<br />
Ratio of Net<br />
Investment<br />
Income (Loss) to<br />
Average Net<br />
Assets<br />
Portfolio<br />
Turnover Rate<br />
(38 .86)% $ 413,801 — % 0 .43% 0 .88% 38 .18%<br />
9 .20 748,329 — 0 .42 0.84 36 .62<br />
9 .57 735,055 — 0 .43 0.94 36 .05<br />
7 .71 702,526 — 0 .43 0.78 31 .74<br />
6 .67 686,849 — 0 .43 1.07 34 .53<br />
(40 .01)% $ 171,551 — % 0 .78% (0 .09)% 67 .79%<br />
26 .84 230,437 — 0 .80 0.44 57 .89<br />
4 .88 138,581 — 0 .81 0.38 61 .84<br />
17 .00 132,679 — 0 .82 0.18 45 .20<br />
19 .67 56,690 — 0 .84 (0 .03) 25 .42<br />
(38 .74)% $ 310,665 — % 0 .44% 1 .35% 50 .12%<br />
9 .12 556,895 — 0 .43 1.30 43 .86<br />
11 .49 535,453 — 0 .44 1.25 39 .39<br />
8 .46 494,020 — 0 .44 1.15 32 .23<br />
8 .16 469,935 — 0 .44 1.41 33 .64<br />
(40 .25)% $ 29,382 0 .87% 0 .85% 1 .15% 59 .53%<br />
(6 .52)% 34,935 0 .89 (c) 0 .85 (c) 0.95 (c) 22 .41%<br />
(36 .94)% $ 1,231,610 — % 0 .20% 2 .13% 4 .10%<br />
5 .43 2,088,835 — 0 .20 1.89 4.44<br />
15 .62 2,081,399 — 0 .20 1.78 4.47<br />
4 .72 1,903,641 — 0 .20 1.68 5.36<br />
10 .70 1,904,122 — 0 .20 1.83 3.45<br />
(37 .23)% $ 28,570 0 .81% 0 .80% 2 .41% 26 .04%<br />
(5 .97) 32,695 0 .85 (c) 0 .80 (c) 2.03 (c) 16 .92<br />
(38 .49)% $ 281,556 — % 0 .57% 2 .89% 60 .11%<br />
(6 .33) 439,896 — 0 .56 2.37 38 .86<br />
16 .56 409,836 — 0 .58 1.99 31 .59<br />
8 .04 273,934 — 0 .60 1.77 35 .19<br />
16 .85 211,977 — 0 .62 1.63 32 .97<br />
(35 .81)% $ 151,641 — % 0 .67% 2 .61% 28 .82%<br />
3 .26 212,428 — 0 .67 1.93 41 .94<br />
19 .15 200,507 — 0 .67 1.88 15 .50<br />
4 .19 132,923 — 0 .68 1.76 16 .01<br />
15 .16 89,747 — 0 .69 1.74 15 .21<br />
(c) Computed on an annualized basis.<br />
(d) Total Return includes deductions for management and other fund expenses; excludes deductions for sales loads and account fees, not annualized for periods<br />
less than one year.<br />
The Accompanying Notes are an Integral Part of the Financial Statements.<br />
Financial Highlights 207
Financial Highlights<br />
(For a share outstanding throughout the period)<br />
Net Asset Value,<br />
Beginning<br />
of Period<br />
Net Investment<br />
Income (Loss)<br />
Net Realized and<br />
Unrealized Gain<br />
(Loss) on<br />
Investments<br />
Total from<br />
Investment<br />
Operations<br />
Distributions<br />
from Net<br />
Investment<br />
Income<br />
Distributions<br />
from Realized<br />
Gains on<br />
Investments<br />
Total<br />
Distributions<br />
Net Asset Value,<br />
End of Period<br />
Mid Cap Growth Stock Portfolio<br />
2008 . . . . $ 3 .68 $ 0 .01 $ (1 .35) $ (1 .34) $ (0 .01) $ (0 .41) $ (0 .42) $ 1.92<br />
2007 . . . . 3 .37 0 .01 0 .66 0.67 (0 .03) (0 .33) (0 .36) 3.68<br />
2006 . . . . 3 .30 0 .03 0 .12 0.15 — (0 .08) (0 .08) 3.37<br />
2005 . . . . 3 .11 — 0 .19 0.19 — — — 3.30<br />
2004 . . . . 2 .72 0 .00 (e) 0 .39 0.39 — — — 3.11<br />
Index 400 Stock Portfolio<br />
2008 . . . . $ 1 .60 $ 0 .02 $ (0 .55) $ (0 .53) $ (0 .02) $ (0 .15) $ (0 .17) $ 0.90<br />
2007 . . . . 1 .59 0 .02 0 .10 0.12 (0 .02) (0 .09) (0 .11) 1.60<br />
2006 . . . . 1 .55 0 .02 0 .14 0.16 (0 .02) (0 .10) (0 .12) 1.59<br />
2005 . . . . 1 .46 0 .02 0 .15 0.17 (0 .01) (0 .07) (0 .08) 1.55<br />
2004 . . . . 1 .28 0 .01 0 .19 0.20 (0 .01) (0 .01) (0 .02) 1.46<br />
Mid Cap Value Portfolio<br />
2008 . . . . $ 1 .28 $ 0 .01 $ (0 .46) $ (0 .45) $ — $ (0 .02) $ (0 .02) $ 0.81<br />
2007 . . . . 1 .53 0 .01 (0 .02) (0 .01) (0 .01) (0 .23) (0 .24) 1.28<br />
2006 . . . . 1 .45 0 .02 0 .20 0.22 (0 .02) (0 .12) (0 .14) 1.53<br />
2005 . . . . 1 .45 0 .01 0 .08 0.09 (0 .01) (0 .08) (0 .09) 1.45<br />
2004 . . . . 1 .32 0 .01 0 .22 0.23 (0 .01) (0 .09) (0 .10) 1.45<br />
Small Cap Growth Stock Portfolio<br />
2008 . . . . $ 2 .37 $ 0 .00 (e) $ (0 .92) $ (0 .92) $ 0.00 (e) $ (0 .36) $ (0 .36) $ 1.09<br />
2007 . . . . 2 .38 0 .00 (e) 0 .22 0.22 0.00 (e) (0 .23) (0 .23) 2.37<br />
2006 . . . . 2 .53 — 0 .18 0.18 — (0 .33) (0 .33) 2.38<br />
2005 . . . . 2 .30 — 0 .25 0.25 — (0 .02) (0 .02) 2.53<br />
2004 . . . . 1 .94 (0 .01) 0 .37 0.36 — — — 2.30<br />
Index 600 Stock Portfolio<br />
2008 . . . . $ 0 .93 $ 0 .01 $ (0 .29) $ (0 .28) $ — $ (0 .01) $ (0 .01) $ 0.64<br />
2007 (h) . . . 1 .00 — (0 .06) (0 .06) — (0 .01) (0 .01) 0.93<br />
Small Cap Value Portfolio<br />
2008 . . . . $ 1 .72 $ 0 .01 $ (0 .45) $ (0 .44) $ (0 .01) $ (0 .13) $ (0 .14) $ 1.14<br />
2007 . . . . 1 .84 0 .01 (0 .02) (0 .01) (0 .01) (0 .10) (0 .11) 1.72<br />
2006 . . . . 1 .64 0 .01 0 .26 0.27 — (0 .07) (0 .07) 1.84<br />
2005 . . . . 1 .58 0 .01 0 .10 0.11 (0 .01) (0 .04) (0 .05) 1.64<br />
2004 . . . . 1 .29 0 .01 0 .30 0.31 — (0 .02) (0 .02) 1.58<br />
International Growth Portfolio<br />
2008 . . . . $ 1 .82 $ 0 .02 $ (0 .79) $ (0 .77) $ (0 .02) $ (0 .17) $ (0 .19) $ 0.86<br />
2007 . . . . 1 .77 0 .02 0 .19 0.21 (0 .02) (0 .14) (0 .16) 1.82<br />
2006 . . . . 1 .48 0 .02 0 .29 0.31 — (0 .02) (0 .02) 1.77<br />
2005 . . . . 1 .32 0 .01 0 .23 0.24 (0 .01) (0 .07) (0 .08) 1.48<br />
2004 . . . . 1 .09 0 .01 0 .23 0.24 (0 .01) — (0 .01) 1.32<br />
Research International Core Portfolio<br />
2008 . . . . $ 1 .04 $ 0 .02 $ (0 .46) $ (0 .44) $ (0 .01) $ (0 .01) $ (0 .02) $ 0.58<br />
2007 (h) . . . 1 .00 0 .01 0 .05 0.06 (0 .01) (0 .01) (0 .02) 1.04<br />
(e) Amount is less than $0.005.<br />
(h) For the period April 30, 2007 (commencement of operations) through December 31, 2007<br />
The Accompanying Notes are an Integral Part of the Financial Statements.<br />
208 Financial Hightlights
Total Return (d)<br />
Net Assets, End<br />
of Period<br />
(thousands)<br />
Ratio of Gross<br />
Expenses to<br />
Average Net<br />
Assets<br />
Ratio of Net<br />
Expenses to<br />
Average Net<br />
Assets<br />
Ratio of Net<br />
Investment<br />
Income (Loss) to<br />
Average Net<br />
Assets<br />
Portfolio<br />
Turnover Rate<br />
(40 .08)% $ 695,626 — % 0 .53% 0 .20% 43 .67%<br />
20 .70 1,294,703 — 0 .52 0.26 66 .20<br />
4 .40 1,183,484 — 0 .52 0.77 72 .15<br />
6 .14 1,252,702 — 0 .52 0.13 83 .42<br />
14 .22 1,278,495 — 0 .52 0.05 71 .24<br />
(36 .28)% $ 319,515 — % 0 .26% 1 .50% 15 .94%<br />
7 .93 558,136 — 0 .26 1.44 24 .49<br />
10 .04 533,740 — 0 .26 1.42 12 .43<br />
12 .37 490,626 — 0 .26 1.26 18 .63<br />
16 .26 426,827 — 0 .26 0.96 16 .46<br />
(35 .07)% $ 74,681 — % 0 .89% 1 .01% 50 .78%<br />
(0 .16) 114,455 — 0 .87 0.66 41 .37<br />
14 .49 131,016 — 0 .87 1.26 43 .75<br />
5 .46 97,557 — 0 .87 0.61 31 .15<br />
18 .67 72,131 — 0 .89 1.00 33 .05<br />
(43 .87)% $ 284,621 — % 0 .57% 0 .01% 146 .28%<br />
9 .54 543,986 — 0 .55 0.13 143 .29<br />
6 .68 528,612 — 0 .55 0.08 82 .48<br />
11 .18 503,008 — 0 .56 (0 .09) 69 .50<br />
18 .80 442,420 — 0 .57 (0 .30) 87 .74<br />
(31 .30)% $ 21,174 0 .55% 0 .35% 1 .38% 71 .09%<br />
(5 .89) 24,039 0 .51 (c) 0 .35 (c) 2.02 (c) 51 .76<br />
(28 .13)% $ 240,817 — % 0 .87% 0 .87% 22 .94%<br />
(0 .83) 337,973 — 0 .86 0.80 33 .39<br />
16 .55 324,973 — 0 .86 0.66 21 .70<br />
7 .21 245,041 — 0 .87 0.63 17 .74<br />
24 .57 200,143 — 0 .88 0.81 19 .22<br />
(46 .19)% $ 197,383 0 .80% 0 .79% 1 .69% 134 .71%<br />
12 .62 353,426 — 0 .78 1.39 105 .82<br />
21 .48 272,882 — 0 .86 1.14 82 .62<br />
18 .00 167,550 — 0 .95 1.01 70 .60<br />
21 .59 110,498 — 0 .98 0.81 70 .84<br />
(42 .54)% $ 33,435 1 .69% 1 .15% 2 .27% 77 .80%<br />
5 .49 47,347 1 .71 (c) 1 .15 (c) 1.16 (c) 45 .53<br />
(d) Total Return includes deductions for management and other fund expenses; excludes deductions for sales loads and account fees, not annualized for periods<br />
less than one year.<br />
(c) Computed on an annualized basis.<br />
The Accompanying Notes are an Integral Part of the Financial Statements.<br />
Financial Highlights 209
Financial Highlights<br />
(For a share outstanding throughout the period)<br />
Net Asset Value,<br />
Beginning<br />
of Period<br />
Net Investment<br />
Income (Loss)<br />
Net Realized and<br />
Unrealized Gain<br />
(Loss) on<br />
Investments<br />
Total from<br />
Investment<br />
Operations<br />
Distributions<br />
from Net<br />
Investment<br />
Income<br />
Distributions<br />
from Realized<br />
Gains on<br />
Investments<br />
Total<br />
Distributions<br />
Net Asset Value,<br />
End of Period<br />
International Equity Portfolio<br />
2008 . . . . $ 2 .67 $ 0 .07 $ (1 .16) $ (1 .09) $ (0 .05) $ (0 .21) $ (0 .26) $ 1.32<br />
2007 . . . . 2 .33 0 .05 0 .37 0.42 (0 .05) (0 .03) (0 .08) 2.67<br />
2006 . . . . 1 .81 0 .05 0 .51 0.56 (0 .04) — (0 .04) 2.33<br />
2005 . . . . 1 .65 0 .04 0 .15 0.19 (0 .03) — (0 .03) 1.81<br />
2004 . . . . 1 .41 0 .03 0 .24 0.27 (0 .03) — (0 .03) 1.65<br />
Emerging Markets Equity Portfolio<br />
2008 . . . . $ 1 .24 $ 0 .02 $ (0 .71) $ (0 .69) $ (0 .02) $ 0.00 (e)<br />
2007 (h) . . . 1 .00 0 .01 0 .23 0.24 0.00 (e) —<br />
$ (0 .02)<br />
0 .00 (e) $ 0.53<br />
1.24<br />
Money Market Portfolio<br />
2008 . . . . $ 1 .00 $ 0 .03 $ — $ 0.03 $ (0 .03) $ 0.00 (e) $ (0 .03) $ 1.00<br />
2007 . . . . 1 .00 0 .05 — 0.05 (0 .05) — (0 .05) 1.00<br />
2006 . . . . 1 .00 0 .05 — 0.05 (0 .05) — (0 .05) 1.00<br />
2005 . . . . 1 .00 0 .03 — 0.03 (0 .03) — (0 .03) 1.00<br />
2004 . . . . 1 .00 0 .01 — 0.01 (0 .01) — (0 .01) 1.00<br />
Short-Term Bond Portfolio<br />
2008 . . . . $ 1 .00 $ 0 .04 $ (0 .01) $ 0.03 $ (0 .04) $ —<br />
2007 (h) . . . 1 .00 0 .03 0 .00 (e) 0.03 (0 .03) —<br />
$ (0 .04)<br />
(0 .03)<br />
$ 0.99<br />
1.00<br />
Select Bond Portfolio<br />
2008 . . . . $ 1 .23 $ 0 .06 $ (0 .02) $ 0.04 $ (0 .06) $ — $ (0 .06) $ 1.21<br />
2007 . . . . 1 .20 0 .05 0 .03 0.08 (0 .05) — (0 .05) 1.23<br />
2006 . . . . 1 .20 0 .05 — 0.05 (0 .05) — (0 .05) 1.20<br />
2005 . . . . 1 .23 0 .05 (0 .03) 0.02 (0 .04) (0 .01) (0 .05) 1.20<br />
2004 . . . . 1 .26 0 .05 0 .01 0.06 (0 .05) (0 .04) (0 .09) 1.23<br />
Long-Term U.S. Government Bond Portfolio<br />
2008 . . . .<br />
2007 (h) . . .<br />
$ 1 .04<br />
1 .00<br />
$ 0 .03<br />
0 .03<br />
$ 0 .19<br />
0 .05<br />
$ 0.22<br />
0.08<br />
$ (0 .02)<br />
(0 .03)<br />
$ (0 .02)<br />
(0 .01)<br />
$ (0 .04)<br />
(0 .04)<br />
$ 1.22<br />
1.04<br />
Inflation Protection Portfolio<br />
2008 . . . . $ 1 .04 $ 0 .05 $ (0 .06) $ (0 .01) $ (0 .04) $ 0.00 (e)<br />
2007 (h) . . . 1 .00 0 .03 0 .04 0.07 (0 .03) —<br />
$ (0 .04)<br />
(0 .03)<br />
$ 0.99<br />
1.04<br />
High Yield Bond Portfolio<br />
2008 . . . . $ 0 .70 $ 0 .05 $ (0 .19) $ (0 .14) $ (0 .05) $ — $ (0 .05) $ 0.51<br />
2007 . . . . 0 .73 0 .05 (0 .03) 0.02 (0 .05) — (0 .05) 0.70<br />
2006 . . . . 0 .72 0 .05 0 .01 0.06 (0 .05) — (0 .05) 0.73<br />
2005 . . . . 0 .76 0 .05 (0 .04) 0.01 (0 .05) — (0 .05) 0.72<br />
2004 . . . . 0 .73 0 .05 0 .03 0.08 (0 .05) — (0 .05) 0.76<br />
(e) Amount is less than $0.005.<br />
(h) For the period April 30, 2007 (commencement of operations) through December 31, 2007<br />
The Accompanying Notes are an Integral Part of the Financial Statements.<br />
210 Financial Highlights
Total Return (d)<br />
Net Assets, End<br />
of Period<br />
(thousands)<br />
Ratio of Gross<br />
Expenses to<br />
Average Net<br />
Assets<br />
Ratio of Net<br />
Expenses to<br />
Average Net<br />
Assets<br />
Ratio of Net<br />
Investment<br />
Income (Loss) to<br />
Average Net<br />
Assets<br />
Portfolio<br />
Turnover Rate<br />
(43 .78)% $ 1,009,367 0 .71% (f) 0 .65% (f) 3 .26% 2 .98%<br />
18 .06 1,902,612 0 .70 (f) 0 .63 (f) 2.21 15 .70<br />
30 .90 1,556,230 0 .71 (f) 0 .70 (f) 2.53 12 .15<br />
11 .52 1,139,260 — 0 .71 2.24 3.71<br />
19 .33 980,977 — 0 .72 2.23 18 .65<br />
(55 .22)% $ 52,386 1 .79% 1 .50% 2 .10% 109 .36%<br />
24 .73 89,563 1 .85 (c) 1 .50 (c) 1.05 (c) 73 .03<br />
2 .76% $ 622,620 0 .32% (l)(m) 0 .32% (l)(m) 2 .66% — %<br />
5 .28 462,092 — 0 .30 5.16 —<br />
4 .86 390,589 — 0 .30 4.77 —<br />
2 .98 339,858 — 0 .30 2.94 —<br />
1 .43 344,468 0 .30 (f) 0 .00 (f) 1.41 —<br />
2 .71% $ 69,797 — % 0 .40% 4 .29% 74 .86% (g)<br />
3 .10 57,998 0 .00 (c) 0 .44 (c) 4.80 (c) 72 .69 (g)<br />
3 .26% $ 1,088,647 — % 0 .30% 5 .06% 85 .39% (g)<br />
6 .39 1,114,647 — 0 .30 5.26 104 .07 (g)<br />
3 .74 924,457 — 0 .30 4.85 169 .55 (g)<br />
2 .22 786,544 — 0 .30 4.34 179 .05 (g)<br />
4 .75 661,027 — 0 .30 3.99 213 .87<br />
20 .76% $ 90,206 — % 0 .62% 2 .51% 272 .80% (g)<br />
7 .55 35,815 0 .72 (c) 0 .65 (c) 4.31 (c) 175 .03 (g)<br />
(1 .38)% $ 69,140 — % 0 .62% 4 .34% 48 .63% (g)<br />
6 .83 37,462 0 .70 (c) 0 .65 (c) 4.95 (c) 94 .74 (g)<br />
(21 .35)% $ 212,003 — % 0 .47% 8 .55% 43 .30%<br />
2 .38 292,928 — 0 .47 7.43 61 .65<br />
9 .77 276,639 — 0 .47 7.00 80 .94<br />
1 .39 244,554 — 0 .48 7.16 118 .63<br />
12 .76 229,312 — 0 .50 7.42 162 .00<br />
(c) Computed on an annualized basis.<br />
(d) Total Return includes deductions for management and other fund expenses; excludes deductions for sales loads and account fees, not annualized for periods<br />
less than one year.<br />
(f) For the International Equity Portfolio, expense ratios reflect total expenses before a management fee waiver in effect from November 15, 2006, (“Gross<br />
Expense Ratio”) and after such waiver (“Net Expense Ratio”). For the Money Market Portfolio, expense ratios reflect total expenses before a management fee<br />
in effect for the perios December 2, 2002 through December 31, 2004 (“Gross Expense Ratio”) and after such waiver (“Net Expense Ration”). The fee waiver<br />
ended on December 31, 2004.<br />
(g) Portfolio Turnover rate excludes the impact of mortgage dollar roll transactions.<br />
(l) For the Money Market Portfolio, expense ratios reflect total expenses before a management fee waiver effective December 31, 2008, (“Gross Expense<br />
Ratio”) and after such waiver (“Net Expense Ratio”).<br />
(m)<br />
Reflects fee paid by the Portfolio to participate in the U.S. Department of the Treasury’s Temporary Guarantee Program for Money Market Funds from the<br />
Program’s inception on September 19, 2008 through April 30, 2009. Due to the temporary nature of the Program, this fee has not been annualized. It is not<br />
known whether the Program will extend beyond April 30, 2009, and if so, on what terms. If the Portfolio participates in any extension, it would be required to<br />
pay an additional fee, which would cause expenses to be higher than those reflected.<br />
The Accompanying Notes are an Integral Part of the Financial Statements.<br />
Financial Highlights 211
Financial Highlights<br />
(For a share outstanding throughout the period)<br />
Net Asset Value,<br />
Beginning<br />
of Period<br />
Net Investment<br />
Income (Loss)<br />
Net Realized and<br />
Unrealized Gain<br />
(Loss) on<br />
Investments<br />
Total from<br />
Investment<br />
Operations<br />
Distributions<br />
from Net<br />
Investment<br />
Income<br />
Distributions<br />
from Realized<br />
Gains on<br />
Investments<br />
Total<br />
Distributions<br />
Net Asset Value,<br />
End of Period<br />
Multi-Sector Bond Portfolio<br />
2008 . . . . $ 0 .98 $ 0 .04 $ (0 .11) $ (0 .07) $ (0 .06) $ 0.00 (e)<br />
2007 (h) . . . 1 .00 0 .03 (0 .02) 0.01 (0 .03) —<br />
$ (0 .06)<br />
(0 .03)<br />
$ 0.85<br />
0.98<br />
Balanced Portfolio<br />
$ $ $ $ (0 .53) $ 1.10<br />
2007 . . . . 1 .97 0 .03 0 .09 0.12 (0 .06) (0 .04) (0 .10) 1.99<br />
2006 . . . . 1 .86 0 .06 0 .12 0.18 (0 .05) (0 .02) (0 .07) 1.97<br />
2005 . . . . 1 .87 0 .05 0 .02 0.07 (0 .05) (0 .03) (0 .08) 1.86<br />
2004 . . . . 1 .85 0 .05 0 .09 0.14 (0 .05) (0 .07) (0 .12) 1.87<br />
2008 . . . . $ 1 .99 $ 0 .05 $ (0 .41) (0 .36) (0 .02) (0 .51)<br />
Asset Allocation Portfolio<br />
2008 . . . . $ 1 .24 $ 0 .03 $ (0 .38) $ (0 .35) $ (0 .03) $ (0 .09) $ (0 .12) $ 0.77<br />
2007 . . . . 1 .22 0 .03 0 .08 0.11 (0 .03) (0 .06) (0 .09) 1.24<br />
2006 . . . . 1 .16 0 .03 0 .08 0.11 (0 .02) (0 .03) (0 .05) 1.22<br />
2005 . . . . 1 .12 0 .02 0 .06 0.08 (0 .02) (0 .02) (0 .04) 1.16<br />
2004 . . . . 1 .02 0 .02 0 .08 0.10 — — — 1.12<br />
(e) Amount is less than $0.005.<br />
(h) For the period April 30, 2007 (commencement of operations) through December 31, 2007<br />
The Accompanying Notes are an Integral Part of the Financial Statements.<br />
212 Financial Highlights
Total Return (d)<br />
Net Assets, End<br />
of Period<br />
(thousands)<br />
Ratio of Gross<br />
Expenses to<br />
Average Net<br />
Assets<br />
Ratio of Net<br />
Expenses to<br />
Average Net<br />
Assets<br />
Ratio of Net<br />
Investment<br />
Income (Loss) to<br />
Average Net<br />
Assets<br />
Portfolio<br />
Turnover Rate<br />
(6 .86)% $ 94,121 — % 0 .88% 4 .40% 23 .40% (g)<br />
1 .09 74,829 — 0 .93 (c) 5.39 (c) 72 .85 (g)<br />
(22 .72)% $ 1,994,701 — % 0 .30% 3 .26% 68 .34% (g)<br />
6 .15 2,896,195 — 0 .30 3.23 106 .64 (g)<br />
10 .42 2,949,632 — 0 .30 3.11 70 .12 (g)<br />
3 .59 2,905,741 — 0 .30 2.85 80 .21 (g)<br />
7 .89 2,983,179 — 0 .30 2.71 100 .02<br />
(30 .13)% $ 199,640 0 .60% 0 .54% 2 .59% 74 .22% (g)<br />
9 .40 302,292 0 .58 0 .54 2.64 85 .44 (g)<br />
9 .91 281,863 — 0 .59 2.53 86 .85 (g)<br />
6 .99 244,807 — 0 .61 2.18 90 .04 (g)<br />
10 .02 196,568 — 0 .64 1.90 116 .65<br />
(c) Computed on an annualized basis.<br />
(d) Total Return includes deductions for management and other fund expenses; excludes deductions for sales loads and account fees, not annualized for periods<br />
less than one year.<br />
The Accompanying Notes are an Integral Part of the Financial Statements.<br />
Financial Highlights 213
Notes to Financial Statements<br />
<strong>Northwestern</strong> <strong>Mutual</strong> Series Fund, Inc.<br />
December 31, 2008<br />
Note 1. Organization<br />
<strong>Northwestern</strong> <strong>Mutual</strong> Series Fund, Inc. (the "Series Fund") is registered as a diversified, open-end management investment<br />
company under the Investment Company Act of 1940. The Series Fund consists of the Growth Stock Portfolio, Focused<br />
Appreciation Portfolio, Large Cap Core Stock Portfolio, Large Cap Blend Portfolio, Index 500 Stock Portfolio, Large<br />
Company Value Portfolio, Domestic Equity Portfolio, Equity Income Portfolio, Mid Cap Growth Stock Portfolio, Index 400<br />
Stock Portfolio, Mid Cap Value Portfolio, Small Cap Growth Stock Portfolio, Index 600 Stock Portfolio, Small Cap Value<br />
Portfolio, International Growth Portfolio, Research International Core Portfolio, International Equity Portfolio, Emerging<br />
Markets Equity Portfolio, Money Market Portfolio, Short-Term Bond Portfolio, Select Bond Portfolio, Long-Term U.S.<br />
Government Bond Portfolio, Inflation Protection Portfolio, High Yield Bond Portfolio, Multi-Sector Bond Portfolio, Balanced<br />
Portfolio, and the Asset Allocation Portfolio (each, a “Portfolio” or collectively, the “Portfolios”). Shares are presently offered<br />
only to The <strong>Northwestern</strong> <strong>Mutual</strong> Life Insurance Company ("<strong>Northwestern</strong> <strong>Mutual</strong>") and its segregated asset accounts.<br />
On April 30, 2008, the following Portfolio names changed:<br />
Prior Name<br />
Current Name<br />
Janus Capital Appreciation Portfolio<br />
Focused Appreciation Portfolio<br />
Capital Guardian Large Cap Blend Portfolio<br />
Large Cap Blend Portfolio<br />
American Century Large Company Value Portfolio<br />
Large Company Value Portfolio<br />
Capital Guardian Domestic Equity Portfolio<br />
Domestic Equity Portfolio<br />
T. Rowe Price Equity Income Portfolio Equity Income Portfolio<br />
AllianceBernstein Mid Cap Value Portfolio<br />
Mid Cap Value Portfolio<br />
T. Rowe Price Small Cap Value Portfolio Small Cap Value Portfolio<br />
MFS ® Research International Core Portfolio<br />
Research International Core Portfolio<br />
Franklin Templeton International Equity Portfolio<br />
International Equity Portfolio<br />
MFS ® Emerging Markets Equity Portfolio<br />
Emerging Markets Equity Portfolio<br />
PIMCO Long-Term U.S. Government Bond Portfolio<br />
Long-Term U.S. Government Bond Portfolio<br />
American Century Inflation Protection Portfolio<br />
Inflation Protection Portfolio<br />
PIMCO Multi-Sector Bond Portfolio<br />
Multi-Sector Bond Portfolio<br />
Note 2. Significant Accounting Policies<br />
The following is a summary of significant accounting policies consistently followed by the Series Fund in the preparation of its<br />
financial statements.<br />
A. Use of Estimates — The preparation of the financial statements in conformity with accounting principles generally accepted<br />
in the United States of America requires management to make estimates and assumptions that affect the reported amounts of<br />
assets and liabilities at the date of the financial statements and the reported amounts of revenues and expenses during the<br />
reporting period. Actual results could differ from those estimates.<br />
B. Security Valuation — Equity securities for which market quotations are readily available are valued at the last sale or<br />
official closing price as reported by an independent pricing service on the primary market or exchange on which they are<br />
traded. In the event there were no sales during the day or closing prices are not available, securities are valued at the last<br />
quoted bid price. Equity securities traded only in the over-the-counter market and not on a securities exchange are valued at<br />
the last sale price or closing bid price, if no sales have occurred. Bonds are generally valued on the basis of vendor prices.<br />
Futures are valued at settlement prices. Non-exchange traded derivatives are normally valued on the basis of quotes obtained<br />
from brokers and dealers or pricing services. Securities for which current market quotations are not readily available are valued<br />
at fair value determined by procedures approved by the Board of Directors. The fair value procedures are used if a significant<br />
event that is likely to have affected the value of the securities takes place after the time of the most recent market quotations or<br />
the market quotations for other reasons do not reflect information material to the value of those securities. Generally, money<br />
market investments, other than in the Money Market Portfolio, with maturities exceeding sixty days are valued by a pricing<br />
service. Generally, money market investments with maturities of sixty days or less and all securities in the Money Market<br />
214 Notes to Financial Statements
Notes to Financial Statements<br />
Portfolio are valued on an amortized cost basis or, if the current market value differs substantially from the amortized cost, by<br />
marking to market.<br />
C. Delayed Delivery Transactions and When-Issued Securities — Certain Portfolios may engage in securities transactions on a<br />
when-issued or delayed-delivery basis. In these transactions, the securities’ prices and yields are fixed on the date of the<br />
commitment, with payment and delivery scheduled for a future date. During this period, the securities are subject to market<br />
fluctuations. When delayed-delivery purchases are outstanding, a Portfolio will segregate liquid assets on their records in<br />
amounts sufficient to meet the purchase price. A Portfolio may dispose of or renegotiate a delayed-delivery transaction, which<br />
may result in a capital gain or loss.<br />
D. Repurchase Agreements — Certain Portfolios may engage in repurchase transactions. Under the terms of a typical<br />
repurchase agreement, a Portfolio takes possession of an underlying debt obligation subject to an obligation of the seller to<br />
repurchase, and a Portfolio to resell, the obligation at an agreed-upon price and time. The underlying securities for all<br />
repurchase agreements are held in safekeeping at the Portfolio’s custodian or designated sub-custodians under tri-party<br />
repurchase agreements. The market value of the collateral must be equal to or exceed at all times the total amount of the<br />
repurchase obligations, including interest. Securities purchased under repurchase agreements are reflected as an asset on the<br />
Statements of Assets and Liabilities. Generally, in the event of counterparty default, a Portfolio has the right to use the<br />
collateral to offset losses incurred. If the counterparty should default, a Portfolio will seek to sell the securities which it holds<br />
as collateral. This could involve procedural costs or delays in addition to a loss on the securities if their value should fall below<br />
their repurchase price.<br />
E. Restricted Securities — Certain Portfolios may invest in securities that are subject to legal or contractual restrictions on<br />
resale. These securities may be sold privately, but are required to be registered or exempted from registration before being sold<br />
to the public. Disposal of these securities may involve time-consuming negotiations and expense, and prompt sale at an<br />
acceptable price may be difficult.<br />
F. Futures Contracts — Certain Portfolios invest in futures contracts as an alternative to investing in individual securities and<br />
could be exposed to market risk due to changes in the value of the underlying securities or due to an illiquid secondary market.<br />
Futures contracts are marked to market daily based upon quoted settlement prices. The Portfolios receive from or pay to<br />
brokers an amount of cash equal to the daily fluctuation in the value of the contracts. Such receipts or payments, known as the<br />
“variation margin,” are recorded by the Portfolios as unrealized gains or losses. When a contract is closed, the Portfolios record<br />
a realized gain or loss equal to the difference between the value of the contract at the time it was opened and the value at the<br />
time it was closed. For federal income tax purposes, net unrealized appreciation (depreciation) on open futures contracts is<br />
generally required to be treated as realized gains (losses).<br />
G. Foreign Currency Transactions — Certain Portfolios may have securities and other assets and liabilities denominated in<br />
foreign currencies which are translated into U.S. dollar amounts on the date of valuation. Purchases and sales of securities and<br />
income items denominated in foreign currencies are translated into U.S. dollar amounts on the respective dates of such<br />
transactions. When the Portfolios purchase or sell a foreign security they may enter into a foreign currency exchange contract<br />
to minimize exchange rate risk from the trade date to the settlement date of such transaction. Such foreign currency exchange<br />
contracts are marked to market daily.<br />
The Portfolios may enter into forward foreign currency contracts to hedge against exchange rate risk arising from investments<br />
in securities denominated in foreign currencies or as part of an investment strategy. Contracts are valued at the contractual<br />
forward rate and are marked to market daily, with the change in market value recorded as an unrealized gain or loss. When the<br />
contracts are closed, a realized gain or loss is recorded. Risks may arise from changes in market value of the underlying<br />
instruments and from the possible inability of counterparties to meet the terms of their contracts.<br />
The Portfolios do not separately report the results of operations due to fluctuations in foreign exchange rates on investments<br />
from the changes arising from changes in market prices of securities held. Such fluctuations are included with the net realized<br />
or unrealized gain or loss from investments.<br />
Net realized foreign exchange gains or losses arise from sales of foreign currencies, currency gains or losses realized between<br />
the trade date and the settlement date on security transactions, and the differences between the amounts of dividends and<br />
foreign withholding taxes recorded on the Portfolios’ books and the U.S. dollar equivalent of the amounts actually received or<br />
paid.<br />
Notes to Financial Statements 215
Notes to Financial Statements<br />
H. Mortgage-Backed and Asset-Backed Securities – Certain Portfolios may invest in mortgage-backed securities, including<br />
collateralized mortgage obligations, and asset-backed securities. Mortgage-backed securities are interests in pools of residential<br />
or commercial mortgage loans and asset-backed securities are interests in pools of other assets, including various types of loans<br />
and credit card receivables. These securities provide a monthly payment, consisting of both a principal and interest component.<br />
Interest payments may be based on either fixed rates or adjustable rates. Receipt of principal payment reduces the outstanding<br />
par amount of the security and may generate realized gains or losses. Yields on mortgage-backed securities are affected by<br />
interest and prepayment rates, which, in turn, are influenced by a variety of economic, geographical, social and other factors.<br />
Maturities on mortgage-backed securities represent stated maturity dates. Actual maturity dates may differ based on<br />
prepayment rates. Unlike mortgage-backed securities issued or guaranteed by the U.S. government or one of its sponsored<br />
entities, mortgage-backed securities and asset-backed securities issued by private issuers do not have a government or<br />
government-sponsored entity guarantee. These issuers may provide credit enhancements through external entities such as<br />
financial institutions or through the structuring of the transaction itself. There is no guarantee that credit enhancements, if any,<br />
will be sufficient to prevent losses.<br />
During the year, the broader credit markets including the non-agency mortgage markets experienced significant deterioration<br />
characterized by wider spreads and reduced levels of liquidity. This negatively impacted the prices of certain of these<br />
securities, and, to the extent that the Portfolio sought to do so, may have impacted its ability to sell securities. The decline in<br />
liquidity and prices of these types of securities may have made it more difficult to determine fair market value.<br />
Since late 2007, the asset-backed commercial paper (“ABCP”) market has been under unprecedented pressure and scrutiny as<br />
concerns over the subprime mortgage sector are impacting the short term fixed income markets. ABCP is a type of commercial<br />
paper that is backed by a pool of assets. That pool of assets is generally a mix of debt obligations, including credit card debt,<br />
automobile loans and leases, prime and sub-prime mortgage-backed securities, student loans and other asset-backed securities.<br />
The value of asset-backed securities may be affected by changes in interest rates, the quality of the underlying assets or the<br />
market’s assessment thereof, factors concerning the interests in and structure of the issuer or the originator of the receivables,<br />
or the creditworthiness of the entities that provide any credit enhancements, among other factors. The ABCP market continues<br />
to function, although at wider spreads and under liquidity pressure.<br />
I. Short Sales – Certain Portfolios may enter into short sale transactions. A short sale is a transaction in which a Portfolio sells a<br />
security it does not own in anticipation of a decline in the market price of the security. Securities sold in short sale transactions<br />
and the interest payable on such securities, if any, are reflected as a liability on the Statements of Assets and Liabilities. A<br />
Portfolio is obligated to deliver the security at the market price at the time the short position is closed. The risk of loss on a<br />
short sale transaction is theoretically unlimited, because there is no limit to the cost of replacing the security sold short,<br />
whereas losses from purchase transactions cannot exceed the total amount invested.<br />
J. Inflation-Indexed Bonds — Certain Portfolios may invest in inflation-indexed bonds. Inflation-indexed bonds are fixedincome<br />
securities whose principal value is periodically adjusted to the rate of inflation. The interest rate on these bonds is<br />
generally fixed at issuance at a rate lower than typical bonds. Over the life of an inflation-indexed bond, interest will be paid<br />
based on a principal value, which is adjusted for inflation. Any increase in the principal amount of an inflation-indexed bond<br />
will be included as interest income in the Statements of Operations even though investors do not receive their principal until<br />
maturity.<br />
K. Options —Certain Portfolios may write call and put options on futures, swaps, securities or currencies it owns or in which it<br />
may invest. Writing put options tends to increase a Portfolio’s exposure to the underlying instrument. Writing call options<br />
tends to decrease a Portfolio’s exposure to the underlying instrument. The Portfolio receives a premium on the sale of a call<br />
option but gives up the opportunity to profit from any increase in the value of the security above the exercise price of the<br />
option. When a Portfolio writes a put option, it is exposed to a decline in the price of the underlying security. When a Portfolio<br />
writes a call or put option, an amount equal to the premium received is recorded as a liability and subsequently marked to<br />
market to reflect the current value of the option written. These liabilities are reflected as written options outstanding in the<br />
Statements of Assets and Liabilities. Payments received or made, if any, from writing options with premiums to be determined<br />
on a future date are reflected as such on the Statements of Assets and Liabilities. Premiums received from writing options<br />
which expire are treated as realized gains. Premiums received from writing options which are exercised or closed are added to<br />
the proceeds or offset against amounts paid on the underlying future, swap, security or currency transaction to determine the<br />
realized gain or loss. A Portfolio as a writer of an option has no control over whether the underlying future, swap, security or<br />
currency may be sold (call) or purchased (put) and as a result bears the market risk of an unfavorable change in the price of the<br />
216 Notes to Financial Statements
Notes to Financial Statements<br />
future, swap, security or currency underlying the written option. There is a risk a Portfolio may not be able to enter into a<br />
closing transaction because of an illiquid market.<br />
Transactions in written call and put options were as follows (amounts in thousands, except number of contracts):<br />
Balance at<br />
12/31/2007 Sales<br />
Closing<br />
Buys Expirations Exercised<br />
Balance at<br />
12/31/2008<br />
Small Cap Growth Stock Portfolio<br />
# of Contracts................ — 3,000 (1,175 ) (1,087 ) (738 ) —<br />
Notional Amount in $........... $ — 300 (117 ) (109 ) (74 ) $ —<br />
Premium ................... $ — 343 (53 ) (61 ) (229 ) $ —<br />
Long-Term U.S. Government Bond<br />
Portfolio<br />
# of Contracts................ 11 8 (19 ) — — —<br />
Notional Amount in $........... $ 28 8 (36 ) — — $ —<br />
Premium ................... $ 6 4 (10 ) — — $ —<br />
Multi-Sector Bond Portfolio<br />
# of Contracts................ 196 390 (122 ) (464 ) — —<br />
Notional Amount in $........... $ 196 390 (122 ) (464 ) — $ —<br />
Premium ................... $ 94 172 (79 ) (187 ) — $ —<br />
Balanced Portfolio<br />
# of Contracts................ — 322 (114 ) (137 ) (71 ) —<br />
Notional Amount in $........... $ — 32 (11 ) (14 ) (7 ) $ —<br />
Premium ................... $ — 35 (5 ) (8 ) (22 ) $ —<br />
Asset Allocation Portfolio<br />
# of Contracts................ — 45 (17 ) (17 ) (11 ) —<br />
Notional Amount in $........... $ — 5 (2 ) (2 ) (1 ) $ —<br />
Premium ................... $ — 5 (1 ) (1 ) (3 ) $ —<br />
Certain Portfolios may also purchase call and put options on futures, swap, securities or currencies it owns or in which it may<br />
invest. Purchasing call options tends to increase a Portfolio’s exposure to the underlying instrument. Purchasing put options<br />
tends to decrease a Portfolio’s exposure to the underlying instrument. The Portfolio pays a premium on the purchase of a put<br />
option but receives the opportunity to profit from any increase in the value of the security above the exercise price of the<br />
option. When a Portfolio purchases a call option, it is exposed to a decline in the price of the underlying security. Premiums<br />
paid are reflected in the Statements of Assets and Liabilities as an investment and are subsequently marked to market to reflect<br />
the current value of the option. Premiums paid from purchasing options which expire are treated as realized losses. Premiums<br />
paid for purchasing options which are exercised or closed are added to the amount paid or offset against the proceeds on the<br />
underlying future, swap, security or currency transaction to determine realized gain or loss. The risk associated with a Portfolio<br />
purchasing call or put options is limited to the premium paid.<br />
L. Swap Agreements — The Portfolios may enter into swap agreements on interest rate, total return and credit default to<br />
manage their exposure to interest rates, investment style risk and credit risk. In connection with these agreements, securities<br />
may be identified as collateral in accordance with the terms of the respective swap agreements.<br />
Swaps are marked to market daily based upon quotations from market makers and the change in value, if any, is recorded as<br />
unrealized gain or loss in the Statements of Operations. Payments received or made at the beginning of the measurement period<br />
of the swap are reflected on the Statements of Assets and Liabilities. Upfront payments are recorded as realized gain or loss in<br />
the Statements of Operations upon termination or maturity of the swap. A liquidation payment received or made at the<br />
termination of the swap is recorded as realized gain or loss in the Statements of Operations. Net periodic payments received by<br />
the Portfolios are included as part of realized gain (loss) on the Statements of Operations. Entering into these agreements<br />
involves, to varying degrees, elements of credit and market risk in excess of the amounts recognized on the Statements of<br />
Assets and Liabilities. Such risks involve the possibility that there will be no liquid market for these agreements, that the<br />
counterparty to the agreements may default on its obligation to perform and that there may be unfavorable changes in interest<br />
rates.<br />
Certain Portfolios maintain restricted cash deposits with brokers to cover margin requirements for derivative positions. These<br />
amounts are denoted as “Collateral for Derivative Positions” on the Statements of Assets and Liabilities.<br />
Notes to Financial Statements 217
Notes to Financial Statements<br />
Interest Rate Swaps Interest rate swap agreements involve the exchange by a Portfolio with another party to pay or receive<br />
interest, e.g., an exchange of floating rate payments for fixed rate payments based on a notional amount of principal.<br />
Total Return Swaps Total return swap agreements involve commitments to pay interest or a return in exchange for a marketlinked<br />
return, both based on notional amounts. To the extent the total return of the security or index underlying the transaction<br />
exceeds or falls short of the offsetting interest rate obligation, a Portfolio will receive a payment from or make a payment to the<br />
counterparty.<br />
Credit Default Swaps Credit default swap agreements involve one party making a series of payments to another party in<br />
exchange for the right to receive a certain return in the event of a default by a third party, typically corporate issues or<br />
sovereign issues of an emerging market country, on its obligation. The Portfolio may use credit default swaps to provide a<br />
measure of protection against defaults of the issuers where the Portfolio owns or has exposure to the sovereign issue or to take<br />
an active long or short position on the likelihood of a particular issuer’s default.<br />
As a seller of protection, the Portfolio generally receives an upfront payment or a fixed rate of income throughout the term of<br />
the swap provided that there is no credit event. As the seller, the Portfolio adds leverage to its investments because the<br />
Portfolio has investment exposure on the notional amount of the swap. As a buyer of protection, the Portfolio generally makes<br />
an upfront payment or pays a fixed rate of interest throughout the term of the swap provided that there is no credit event. The<br />
Portfolio generally receives an amount up to the notional value of the swap if a credit event occurs.<br />
Implied credit spreads, represented in absolute terms, utilized in determining the market value of credit default swap<br />
agreements on corporate issues or sovereign issues of an emerging market country serve as an indicator of the current status of<br />
the payment/performance risk and represent the likelihood or risk of default for the credit derivative. The implied credit spread<br />
of a particular referenced entity reflects the cost of selling protection and may include upfront payments required to be made to<br />
enter into the agreement. For credit default swap agreements on credit indices, the quoted market prices and resulting values<br />
serve as the indicator of the current status of the payment/performance risk. Wider credit spreads and increasing market values,<br />
in absolute terms when compared to the notional amount of the swap, represent a deterioration of the referenced entity’s credit<br />
soundness and a greater likelihood or risk of default or other credit event occurring as defined under the terms of the<br />
agreement. As of December 31, 2008, open credit default swap agreements were as follows:<br />
Multi-Sector Bond Portfolio<br />
Credit Default Swap on Corporate or Sovereign Issues<br />
CounterParty<br />
Morgan Stanley<br />
Capital Services, Inc.<br />
Buy/Sell (Pay)/Receive<br />
Protection Fixed Rate<br />
Expiration<br />
Date<br />
Implied<br />
Credit<br />
Spread<br />
Upfront<br />
Premiums Paid/<br />
(Received)<br />
(000’s)<br />
Notional<br />
Amount<br />
(000's)<br />
Unrealized<br />
Appreciation/<br />
(Depreciation)<br />
(000's)<br />
Reference Entity<br />
Philippine Government<br />
International Bond, 10.625%,<br />
3/16/25 Sell 2.44% 9/17 3.66% $ - USD 100 $ (8)<br />
Credit Default Swaps on Credit Indices<br />
CounterParty<br />
JPMorgan Chase<br />
JPMorgan Chase<br />
Morgan Stanley<br />
Capital Services, Inc.<br />
Morgan Stanley<br />
Capital Services, Inc.<br />
Reference Entity<br />
Buy/Sell (Pay)/Receive<br />
Protection Fixed Rate<br />
Expiration<br />
Date<br />
Market<br />
Value<br />
Upfront<br />
Premiums Paid/<br />
(Received)<br />
(000’s)<br />
Notional<br />
Amount<br />
(000's)<br />
Unrealized<br />
Appreciation/<br />
(Depreciation)<br />
(000's)<br />
Dow Jones CDX NA Emerging<br />
Markets Index, Series 10 Sell 3.35% 12/13 $ (300) $ (305 ) USD 2,000 $ 5<br />
Dow Jones CDX NA Emerging<br />
Markets Index, Series 9 Sell 2.65% 6/13 (1,725 ) 99 USD 11,000 (1,824 )<br />
Dow Jones CDX NA High<br />
Yield Index, Series 9 Sell 3.75% 12/12 (864 ) (221 ) USD 4,900 (643 )<br />
Dow Jones CDX NA Emerging<br />
Markets Index, Series 9 Sell 2.65% 6/13 (1,567 ) 55 USD 10,000 (1,622 )<br />
If the Portfolio is a seller of protection and a credit event occurs, the Portfolio will either pay to the buyer of the protection an<br />
amount equal to the notional value of the swap and may take delivery of the obligation or pay a net settlement amount in the<br />
form of cash or securities equal to the notional amount of the swap less the recovery value of the referenced obligation. The<br />
218 Notes to Financial Statements
Notes to Financial Statements<br />
maximum potential amount of future payments (undiscounted) that a Portfolio as a seller of protection could be required to<br />
make under a credit default swap agreement would be equal to the notional amount of the agreement. Notional amounts and<br />
fair market value of all credit swap agreements outstanding as of December 31, 2008 for which each Portfolio was the seller of<br />
protection are disclosed in the footnotes to the Schedules of Investments. These potential amounts would be partially offset by<br />
any recovery values of the referenced obligations, upfront payments received upon entering into the agreement, or net amounts<br />
received by the Portfolio from the settlement of credit default swap agreements purchasing protection for the same referenced<br />
obligation.<br />
The treatment of credit default swaps and other swap agreements that provide for contingent, non-periodic, bullet-type<br />
payments as “notional principal contracts” for U.S. federal income tax purposes is uncertain. Were the U.S. Internal Revenue<br />
Service (“IRS”) to take the position that a credit default swap is not a “notional principal contract” for U.S. federal income tax<br />
purposes, payments received by the Portfolios from such investments might be subject to U.S. excise or income taxes.<br />
M. Securities Lending — Each Portfolio is authorized to participate in securities lending, however, only the Select<br />
Bond and Balanced Portfolios currently have an established securities lending program that enables each to loan securities to<br />
approved broker-dealers. The Portfolios receive cash (U.S. currency), U.S. Government or U.S. Government agency<br />
obligations as collateral against the loaned securities. To the extent that a loan is collateralized by cash, such collateral is<br />
invested by the Portfolios to earn interest in accordance with the Portfolios’ investment policies. For the year ended December<br />
31, 2008, the Select Bond and Balanced Portfolios earned $1,682,645 and $853,789, respectively, in interest from securities<br />
lending activity. The collateral received under the securities lending program is recorded on each Portfolio’s Statement of<br />
Assets and Liabilities along with the related obligation to return the collateral.<br />
Income generated from the investment of cash collateral, less negotiated rebate fees paid to participating brokers and<br />
transaction costs, is recorded as income for the Portfolios. All collateral received will be in an amount at least equal to 102%<br />
(for loans of U.S. securities) or 105% (for non-U.S. securities) of the market value of the loaned securities at the inception of<br />
each loan. Thereafter, each loan must be continuously secured by collateral at least equal at all times to the value of the<br />
securities lent. In addition, the Portfolios are entitled to terminate a securities loan at any time. As of December 31, 2008, the<br />
value of outstanding securities on loan and the value of collateral amounted to the following:<br />
Portfolio<br />
Values of<br />
Securities<br />
on Loan<br />
Value of<br />
Collateral<br />
Select Bond Portfolio ............................ $ 65,591,466 $ 67,859,500<br />
Balanced Portfolio .............................. 6,383,438 6,693,750<br />
As of December 31, 2008, collateral received for securities on loan is invested in money market instruments and included in<br />
Investments on each Portfolio’s Statement of Assets and Liabilities.<br />
N. Foreign Income and Capital Gains Taxes — The Portfolios may be subject to dividend income taxes imposed by certain<br />
countries in which they invest. Foreign withholding taxes on dividends are netted against dividend income and separately<br />
disclosed in the Statements of Operations.<br />
The International Growth, Research International Core, International Equity, Emerging Markets Equity, Balanced and Asset<br />
Allocation Portfolios may be subject to capital gains taxes and repatriation taxes imposed by certain countries in which they<br />
invest. The Portfolios may record a deferred tax liability in respect of unrealized appreciation on foreign securities for capital<br />
gains and repatriation taxes. The provision for income taxes is included in net unrealized appreciation (depreciation) on<br />
investments and net realized gain (loss) on investments in the Statement of Operations for the Portfolios.<br />
O. Investment Income and Securities Transactions — Interest income is recorded daily on the accrual basis and dividend<br />
income is recorded on the ex-dividend date or as soon as information from foreign issuers is available. Where applicable,<br />
dividends are recorded net of foreign dividend tax. Discounts and premiums on securities purchased are amortized over the life<br />
of the respective securities using the effective interest method. Securities transactions are accounted for on trade date. The basis<br />
for determining cost on sale of securities is identified cost. For the year ended December 31, 2008, transactions in securities<br />
other than money market investments were:<br />
Notes to Financial Statements 219
Notes to Financial Statements<br />
Portfolios<br />
Total<br />
Security<br />
Purchases<br />
U.S. Govt.<br />
Security<br />
Purchases<br />
Total Security<br />
Sales/Maturities<br />
U.S. Govt.<br />
Security<br />
Sales/Maturities<br />
(Amounts in Thousands)<br />
Growth Stock Portfolio ........................................ $ 216,983 $ — $ 297,269 $ —<br />
Focused Appreciation Portfolio ................................... 184,245 — 137,272 —<br />
Large Cap Core Stock Portfolio ................................... 219,140 — 248,326 —<br />
Large Cap Blend Portfolio ...................................... 31,975 — 20,162 —<br />
Index 500 Stock Portfolio....................................... 69,061 — 169,032 —<br />
Large Company Value Portfolio................................... 18,973 — 8,078 —<br />
Domestic Equity Portfolio ...................................... 233,667 — 214,596 —<br />
Equity Income Portfolio ........................................ 81,017 — 52,189 —<br />
Mid Cap Growth Stock Portfolio .................................. 430,267 — 542,809 —<br />
Index 400 Stock Portfolio (a)..................................... 69,394 — 133,417 —<br />
Mid Cap Value Portfolio ....................................... 49,821 — 51,500 —<br />
Small Cap Growth Stock Portfolio ................................. 565,983 — 589,774 —<br />
Index 600 Stock Portfolio (b) .................................... 19,829 — 13,896 —<br />
Small Cap Value Portfolio ...................................... 77,466 — 68,962 —<br />
International Growth Portfolio.................................... 354,671 — 357,756 —<br />
Research International Core Portfolio ............................... 43,014 — 33,125 —<br />
International Equity Portfolio .................................... 111,495 — 41,633 —<br />
Emerging Markets Equity Portfolio................................. 117,467 — 87,777 —<br />
Short-Term Bond Portfolio ...................................... 51,647 22,937 18,542 30,772<br />
Select Bond Portfolio ......................................... 762,957 434,025 552,676 584,565<br />
Long-Term U.S. Government Bond Portfolio .......................... 111,082 117,068 95,443 86,824<br />
Inflation Protection Portfolio..................................... 32,667 30,420 13,509 13,348<br />
High Yield Bond Portfolio ...................................... 106,049 — 102,681 —<br />
Multi-Sector Bond Portfolio ..................................... 355,089 — 309,285 —<br />
Balanced Portfolio ........................................... 1,267,176 389,148 1,426,844 573,172<br />
Asset Allocation Portfolio....................................... 142,486 28,914 155,023 37,821<br />
(a) Includes (in thousands) $1,327 of purchases and $122 of sales with affiliates<br />
(b) Includes (in thousands) $122 of purchases and $1,327 of sales with affiliates<br />
P. Distributions — Dividends from net investment income and net realized capital gains are declared each business day for the<br />
Money Market Portfolio and at least annually for the remaining portfolios of the Series Fund, when applicable.<br />
Q. Fair Value Measurements — In September 2006, the Financial Accounting Standards Board issued Standard No. 157, Fair<br />
Value Measurements (“FAS 157”) effective for fiscal years beginning after November 15, 2007. FAS 157 clarifies the<br />
definition of fair value for financial reporting, establishes a framework for measuring fair value and requires additional<br />
disclosure about the use of fair value measurements in an effort to make the measurement of fair value more consistent and<br />
comparable. The Portfolios have adopted FAS 157 effective January 1, 2008. A summary of the fair value hierarchy under FAS<br />
157 is described below:<br />
• Level 1 — fair value is determined by unadjusted quoted prices in active markets for identical securities or<br />
derivatives<br />
• Level 2 — fair value is determined by other significant observable inputs (including quoted prices for similar<br />
securities, interest rates, prepayment speeds, credit risk, and other data used in fair valuation)<br />
• Level 3 — fair value is determined by significant unobservable inputs (including the Portfolios’ own assumptions in<br />
determining fair value)<br />
The categorization of a value determined for a financial instrument within the hierarchy is based upon the pricing transparency<br />
of the instrument and does not necessarily correspond to the Fund’s perceived risk of that instrument. For example, money<br />
market securities are generally valued using amortized cost, unless the current market value differs substantially from<br />
amortized cost. Generally, amortized cost approximates the current fair value of a security, but since the value is not obtained<br />
from a quoted price in an active market, such securities are reflected as Level 2.<br />
The following is a summary of the inputs used in valuing the Portfolios’ assets at December 31, 2008:<br />
220 Notes to Financial Statements
Notes to Financial Statements<br />
Level 1 - Quoted Prices<br />
Investments in<br />
Securities<br />
Other<br />
Financial<br />
Instruments^<br />
Level 2 - Other Significant<br />
Observable Inputs<br />
Other<br />
Investments in Financial<br />
Securities Instruments^<br />
Level 3 - Significant<br />
Unobservable Inputs<br />
Investments in<br />
Securities<br />
Other<br />
Financial<br />
Instruments^<br />
Investments in<br />
Securities<br />
Total<br />
Other<br />
Financial<br />
Instruments^<br />
(Amounts in thousands)<br />
Growth Stock Portfolio ... $ 364,830 $ (522) $ 41,494 $ — $ — $ — $ 406,324 $ (522)<br />
Focused Appreciation<br />
Portfolio * .............. 141,082 — 30,094 — — — 171,176 —<br />
Large Cap Core Stock<br />
21,697 — — — 310,375 (148)<br />
Large Cap Blend<br />
Portfolio * .............. 28,384 — 1,000 — — — 29,384 —<br />
Index 500 Stock Portfolio 1,202,611 (330 ) 26,395 — — — 1,229,006 (330 )<br />
Large Company Value<br />
Portfolio ................ 26,893 (5 ) 1,595 — — — 28,488 (5 )<br />
Domestic Equity<br />
Portfolio * .............. 264,902 — 16,227 — — — 281,129 —<br />
Equity Income Portfolio *. 144,547 — 6,705 — — — 151,252 —<br />
Portfolio ................ 288,678 (148 )<br />
Mid Cap Growth Stock<br />
54,880 — — — 705,876 332<br />
Index 400 Stock Portfolio 285,234 842 31,195 — — — 316,429 842<br />
Mid Cap Value Portfolio * 71,411 — 2,718 — — — 74,129 —<br />
Portfolio ................ 650,996 332<br />
Small Cap Growth Stock<br />
21,179 782 — — 281,897 1,011<br />
Index 600 Stock Portfolio 17,885 — 700 101 — — 18,585 101<br />
Portfolio ................ 260,718 229<br />
Small Cap Value<br />
Portfolio * .............. 231,604 — 8,904 — — — 240,508 —<br />
International Growth<br />
Portfolio ................ 29,022 — 162,790 316 — — 191,812 316<br />
Research International<br />
Core Portfolio * ........ 2,470 — 30,459 — — — 32,929 —<br />
International Equity<br />
Portfolio * .............. 120,664 — 886,397 — — — 1,007,061 —<br />
Emerging Markets Equity<br />
Portfolio ................ 21,314 — 30,108 (5 ) — — 51,422 (5 )<br />
Money Market Portfolio *. — — 621,299 — — — 621,299 —<br />
Short-Term Bond<br />
Portfolio ................ — 18 68,151 — 13 — 68,164 18<br />
Select Bond Portfolio ..... — (5,593 ) 1,141,901 — 3,833 — 1,145,734 (5,593 )<br />
Long-Term U.S.<br />
Government Bond<br />
Portfolio ................ — 2,141 109,530 — — — 109,530 2,141<br />
Inflation Protection<br />
Portfolio ................ — — 70,690 (2,203 ) — — 70,690 (2,203 )<br />
High Yield Bond<br />
Portfolio * .............. — — 206,836 — 95 — 206,931 —<br />
Multi-Sector Bond<br />
Portfolio ................ — 4,098 119,209 (5,901 ) — — 119,209 (1,803 )<br />
Balanced Portfolio ........ 579,407 (5,877 ) 1,390,851 1,714 4,316 — 1,974,574 (4,163 )<br />
Asset Allocation Portfolio 70,219 (527 ) 127,200 59 223 — 197,642 (468 )<br />
^ Other financial instruments are derivative instruments such as futures, forwards, written options and swaps contracts, which are valued at the unrealized<br />
appreciation (depreciation) on the instrument and short sales, which are valued at market value.<br />
* On December 31, 2008, this Portfolio did not hold any derivative instruments.<br />
R. Recent Accounting Pronouncements — In September 2008, the Financial Accounting Standards Board issued Staff Position<br />
FSP FAS 133-1, Disclosures about Credit Derivatives and Certain Guarantees: An Amendment of FASB Statement No. 133<br />
(“FAS 133-1”) effective for fiscal years and interim periods ending after November 15, 2008. FAS 133-1 requires enhanced<br />
disclosures about the Portfolios’ credit derivative positions, including the nature and term of credit derivatives, the reasons for<br />
entering into credit derivatives, the fair value of credit derivatives as of the date of the financial report, the circumstances under<br />
which the seller of the credit derivative would be required to perform and the maximum potential amount of future payments<br />
along with recourse provisions enabling recovery of such payment from a third party. Management has adopted FAS 133-1 and<br />
included necessary disclosures in these Notes to Financial Statements.<br />
Notes to Financial Statements 221
Notes to Financial Statements<br />
In March 2008, the Financial Accounting Standards Board issued Standard No. 161, Disclosures about Derivative Instruments<br />
and Hedging Activities (“FAS 161”) effective for fiscal years and interim periods beginning after November 15, 2008. FAS<br />
161 requires enhanced disclosures about the Portfolios’ derivative and hedging activities. Management does not believe the<br />
adoption of FAS 161 will materially impact the financial statement amounts, but will require additional disclosures. This will<br />
include quantitative and qualitative disclosures on derivative positions existing at the period end and the effect of using<br />
derivatives during the reporting period.<br />
Note 3. Market Conditions and Portfolio Risk<br />
Recent events in the financial sector have resulted in an unusually high degree of volatility in the financial markets and the net<br />
asset value of many mutual funds, including the Portfolios. Such events include, but are not limited to, the seizure of the<br />
Federal National Mortgage Association and the Federal Home Loan Mortgage Corporation by U.S. banking regulators, the<br />
bankruptcy filing of Lehman Brothers, the sale of Merrill Lynch to Bank of America and sale of Bear Stearns to JP Morgan,<br />
and the government bailout of AIG. These companies represent financial institutions with which certain of the Portfolios<br />
conduct business and/or whose securities are or may be held by the Portfolios. The potential investment of each Portfolio in<br />
these issuers, and the financial sector in general, as reflected in each Portfolio’s Schedule of Investments, exposes investors to<br />
the negative (or positive) performance resulting from these and other events. U.S. Government Agency securities and<br />
collateral received by the Portfolios under various arrangements may include securities issued by the Federal National<br />
Mortgage Association and the Federal Home Loan Mortgage Corporation.<br />
In the normal course of business the Portfolios trade financial instruments and enter into financial transactions where risk of<br />
potential loss exists. Security values fluctuate (market risk) and may decline due to factors affecting securities markets in<br />
general, particular industries represented in the securities markets or conditions specifically related to a particular company.<br />
Failure of the other party to a transaction to perform (credit risk), for example by not making principal and interest payments<br />
when due, reduces the value of the issuer’s debt and could reduce the Portfolio’s income.<br />
Similar to credit risk, the Portfolios may be exposed to counterparty risk, or the risk that an institution or other entity with<br />
which the Portfolios have unsettled or open transactions will default. The potential loss could exceed the value of the financial<br />
assets recorded in the financial statements. Financial assets, which potentially expose the Portfolios to credit risk, consist<br />
principally of cash due from counterparties and investments. The extent of the Portfolios’ exposure to credit and counterparty<br />
risks in respect to these financial assets approximates their carrying value as recorded in the Statements of Assets and<br />
Liabilities.<br />
Some of the Portfolios’ investments may be illiquid and the Portfolios may not be able to vary the portfolio investments in<br />
response to changes in economic and other conditions. If the Portfolio is required to liquidate all or a portion of its investments<br />
quickly, the Portfolio may realize significantly less than the value at which it previously recorded those investments.<br />
Note 4. Investment Advisory and Sub-Advisory Fees<br />
The Series Fund and its Portfolios are parties to annually renewable contracts pursuant to which each Portfolio pays a charge<br />
for investment management and administrative services. Certain Portfolios, listed below, pay at a fixed annual rate based on<br />
the average daily net asset values of the Portfolio.<br />
Portfolio<br />
Fee<br />
Index 500 Stock . . . . . . . . . . . . . . 0.20%<br />
Index 400 Stock . . . . . . . . . . . . . . 0.25%<br />
Mid Cap Value . . . . . . . . . . . . . . . 0.85%<br />
Small Cap Value . . . . . . . . . . . . . . 0.85%<br />
Money Market . . . . . . . . . . . . . . . 0.30%<br />
Select Bond . . . . . . . . . . . . . . . . . . 0.30%<br />
Balanced . . . . . . . . . . . . . . . . . . . . 0.30%<br />
For the other Portfolios, the rate for the investment advisory fee is graded by the asset size of the Portfolio according to the<br />
following schedules:<br />
222 Notes to Financial Statements
Notes to Financial Statements<br />
First<br />
$50<br />
Million<br />
Next<br />
$50<br />
Million<br />
Excess Over<br />
$100<br />
Million<br />
Portfolio<br />
Growth Stock . . . . . . . . . . . . . . . . . . . . . 0.60% 0.50% 0.40%<br />
Large Cap Core Stock . . . . . . . . . . . . . . 0.60% 0.50% 0.40%<br />
Mid Cap Growth Stock . . . . . . . . . . . . . 0.80% 0.65% 0.50%<br />
Small Cap Growth Stock . . . . . . . . . . . . 0.80% 0.65% 0.50%<br />
International Equity . . . . . . . . . . . . . . . . 0.85% 0.65% 0.65%<br />
High Yield Bond . . . . . . . . . . . . . . . . . . 0.60% 0.50% 0.40%<br />
Portfolio<br />
First<br />
$100<br />
Million<br />
Next<br />
$400<br />
Million<br />
Excess Over<br />
$500<br />
Million<br />
Focused Appreciation . . . . . . . . . . . . . . 0.80% 0.75% 0.70%<br />
First<br />
$100<br />
Million<br />
Next<br />
$150<br />
Million<br />
Excess Over<br />
$250<br />
Million<br />
Portfolio<br />
Domestic Equity . . . . . . . . . . . . . . . . . . 0.65% 0.55% 0.50%<br />
Large Company Value . . . . . . . . . . . . . 0.72% 0.67% 0.62%<br />
International Growth . . . . . . . . . . . . . . . 0.75% 0.65% 0.55%<br />
Short-Term Bond . . . . . . . . . . . . . . . . . 0.35% 0.33% 0.30%<br />
Long-Term U.S. Government Bond . . . 0.555% 0.515% 0.495%<br />
Inflation Protection . . . . . . . . . . . . . . . . 0.58% 0.55% 0.49%<br />
Multi-Sector Bond . . . . . . . . . . . . . . . . . 0.79% 0.78% 0.77%<br />
Asset Allocation . . . . . . . . . . . . . . . . . . . 0.60% 0.50% 0.40%<br />
Portfolio<br />
First<br />
$150<br />
Million<br />
Next<br />
$150<br />
Million<br />
Next<br />
$200<br />
Million<br />
Excess<br />
Over $500<br />
Million<br />
Large Cap Blend . . . . . . . . . . . . . . . . . . 0.77% 0.70% 0.62% 0.56%<br />
Research International Core . . . . . . . . . 0.88% 0.82% 0.75% 0.68%<br />
Portfolio<br />
First<br />
$500<br />
Million<br />
Excess<br />
Over $500<br />
Million<br />
Equity Income . . . . . . . . . . . . . . . . . . . . 0.65% 0.60%<br />
Portfolio<br />
First<br />
$200<br />
Million<br />
Excess<br />
Over $200<br />
Million<br />
Index 600 Stock . . . . . . . . . . . . . . . . . . . 0.25% 0.20%<br />
Portfolio<br />
First<br />
$250<br />
Million<br />
Next<br />
$250<br />
Million<br />
Next<br />
$500<br />
Million<br />
Excess<br />
Over $1.0<br />
Billion<br />
Emerging Markets Equity . . . . . . . . . . . 1.14% 1.08% 0.96% 0.78%<br />
Mason Street Advisors, LLC (“MSA”), a wholly owned subsidiary of <strong>Northwestern</strong> <strong>Mutual</strong>, which is the manager and<br />
investment adviser of the Series Fund, contractually agreed to waive the management fee and absorb certain other operating<br />
expenses to the extent necessary so that Total Operating Expenses will not exceed the following amounts:<br />
Portfolio<br />
Expiration<br />
Focused Appreciation . . . . . . . . . . . . . . 0.90% April 30, 2009<br />
Large Cap Blend . . . . . . . . . . . . . . . . . . 0.85% April 30, 2009<br />
Large Company Value . . . . . . . . . . . . . . 0.80% April 30, 2009<br />
Domestic Equity . . . . . . . . . . . . . . . . . . 0.75% April 30, 2009<br />
Equity Income . . . . . . . . . . . . . . . . . . . . 0.75% April 30, 2009<br />
Mid Cap Value . . . . . . . . . . . . . . . . . . . 1.00% April 30, 2009<br />
Index 600 Stock . . . . . . . . . . . . . . . . . . . 0.35% April 30, 2009<br />
Small Cap Value . . . . . . . . . . . . . . . . . . 1.00% April 30, 2009<br />
International Growth . . . . . . . . . . . . . . . 1.10% April 30, 2009<br />
Research International Core . . . . . . . . . 1.15% April 30, 2009<br />
Emerging Markets Equity . . . . . . . . . . . 1.50% April 30, 2009<br />
Short-Term Bond . . . . . . . . . . . . . . . . . . 0.45% April 30, 2009<br />
Long-Term U.S. Government Bond . . . 0.65% April 30, 2009<br />
Inflation Protection . . . . . . . . . . . . . . . . 0.65% April 30, 2009<br />
Multi-Sector Bond . . . . . . . . . . . . . . . . . 0.95% April 30, 2009<br />
Asset Allocation . . . . . . . . . . . . . . . . . . . 0.75% April 30, 2009<br />
Notes to Financial Statements 223
Notes to Financial Statements<br />
With respect to the International Equity Portfolio, MSA has agreed to waive its management fee effective November 15, 2006,<br />
such that its management fee is 0.80% on the Portfolio's first $50 million of assets, 0.60% on Portfolio assets from $50 million<br />
to $1 billion, 0.58% on assets from $1 billion to $1.5 billion, and 0.51% on Portfolio assets in excess of $1.5 billion (the latter<br />
waiver was added effective December 12, 2006). MSA's fee waiver agreement extends at least until April 30, 2009.<br />
With respect to the Money Market Portfolio, MSA has voluntarily agreed to waive its 0.30% management fee effective<br />
December 31, 2008, on a temporary basis. The waiver is limited to MSA’s management fee, and as a result, the Money Market<br />
Portfolio will continue to bear the expenses associated with its participation in the U.S. Department of the Treasury’s<br />
Temporary Guarantee Program for Money Market Funds, as well as any other expenses that MSA has not contractually agreed<br />
to assume. This voluntary waiver will be reviewed periodically by MSA and may be revised or discontinued at any time.<br />
With respect to the Asset Allocation Portfolio, MSA has agreed to waive its management fee such that its management fee is<br />
0.55% on the Portfolio’s first $100 million of assets, 0.45% on the Portfolio’s assets from $100 million to $250 million, and<br />
0.35% on assets in excess of $250 million. MSA’s fee waiver agreement extends at least until April 30, 2009.<br />
The investment advisory fee is paid to MSA. Other costs for each Portfolio are paid either by the Portfolios or MSA depending<br />
upon the applicable agreement in place.<br />
All of the Portfolios, except for the Balanced, Select Bond and Money Market Portfolios, pay their own custodian fees. Certain<br />
Portfolios, listed below, pay a portion of their custodian fees indirectly through expense offset arrangements. Custodian fees<br />
are reduced for Portfolios that maintain compensating balances in non-interest bearing accounts. These Portfolios could have<br />
invested the assets used to pay for the custodian fees, had the assets not been used in the expense offset arrangements. For the<br />
year ended December 31, 2008, the amounts paid through expense offset arrangements were as follows:<br />
Portfolio<br />
Amount<br />
Growth Stock Portfolio........................................ $ 878<br />
Focused Appreciation Portfolio ............................... 969<br />
Large Cap Core Stock Portfolio............................... 858<br />
Large Cap Blend Portfolio .................................... 656<br />
Index 500 Stock Portfolio ..................................... 1,482<br />
Domestic Equity Portfolio..................................... 1,184<br />
Equity Income Portfolio....................................... 823<br />
Mid Cap Growth Stock Portfolio.............................. 1,054<br />
Index 400 Stock Portfolio ..................................... 1,505<br />
Mid Cap Value Portfolio ...................................... 1,170<br />
Small Cap Growth Stock Portfolio............................ 1,731<br />
Index 600 Stock Portfolio ..................................... 681<br />
Small Cap Value Portfolio .................................... 1,984<br />
Short-Term Bond Portfolio.................................... 1,310<br />
High Yield Bond Portfolio .................................... 1,271<br />
Asset Allocation Portfolio..................................... 1,012<br />
Janus Capital Management LLC (“Janus”), Capital Guardian Trust Company (“Capital Guardian”), American Century<br />
Investment Management, Inc. (“American Century”), T. Rowe Price Associates, Inc. (“T. Rowe Price”), AllianceBernstein<br />
L.P. (“AllianceBernstein”), Massachusetts Financial Services Company (“MFS ® ”), Templeton Investment Counsel LLC<br />
(“Templeton”), and Pacific Investment Management Company LLC (“PIMCO”) have been retained under investment subadvisory<br />
agreements to provide investment advice and, in general, to conduct the management investment programs of the<br />
Focused Appreciation Portfolio, Large Cap Blend and Domestic Equity Portfolios, Large Company Value and Inflation<br />
Protection Portfolios, Equity Income and Small Cap Value Portfolios, Mid Cap Value Portfolio, Research International Core<br />
and Emerging Markets Equity Portfolios, International Equity Portfolio, and the Long-Term U.S. Government Bond and Multi-<br />
Sector Bond Portfolios, respectively. Pursuant to an Investment Sub-Advisory Agreement dated May 6, 2008, Templeton has<br />
appointed Franklin Templeton Investments (Asia) Limited as an additional sub-adviser for the International Equity Portfolio.<br />
MSA pays Janus 0.55% on the first $100 million of the Focused Appreciation Portfolio’s assets, 0.50% on the next $400<br />
million, and 0.45% on assets in excess of $500 million. For the Large Cap Blend Portfolio, MSA pays Capital Guardian 0.46%<br />
on the first $150 million of the Portfolio’s assets, 0.40% on the next $150 million, 0.35% on the next $200 million, and 0.30%<br />
on assets in excess of $500 million. For the Domestic Equity Portfolio, MSA pays Capital Guardian a flat annual fee of<br />
$375,000 on the Portfolio’s assets of $100 million or less, and 0.275% on net assets in excess of $100 million. A fee discount<br />
224 Notes to Financial Statements
Notes to Financial Statements<br />
may apply based on the aggregated annual fees paid on assets managed by Capital Guardian for <strong>Northwestern</strong> <strong>Mutual</strong> and its<br />
affiliates. MSA pays American Century 0.47% on the first $100 million, 0.42% on the next $150 million, and 0.38% on assets<br />
in excess of $250 million for the Large Company Value Portfolio. MSA pays American Century 0.32% on the first $100<br />
million, 0.30% on the next $150 million, and 0.25% on assets in excess of $250 million for the Inflation Protection Portfolio.<br />
For the Equity Income Portfolio, MSA pays T. Rowe Price 0.40% on the first $250 million of the Portfolio’s assets, 0.375% on<br />
the next $250 million, and 0.35% on assets in excess of $500 million. MSA pays T. Rowe Price an annual rate of 0.60% of the<br />
Small Cap Value Portfolio’s average daily net assets. MSA pays AllianceBernstein 0.72% on the first $25 million of the Mid<br />
Cap Value Portfolio’s assets, 0.54% on the next $225 million, and 0.50% on assets in excess of $250 million, with a minimum<br />
amount of $16,000. MSA pays MFS ® 0.55% on the first $250 million, 0.50% on the next $250 million, 0.45% on the next $500<br />
million and 0.40% on assets in excess of $1 billion for the Research International Core Portfolio. MSA pays MFS ® 0.80% on<br />
the first $250 million, 0.75% on the next $250 million, 0.65% on the next $500 million, and 0.50% on assets in excess of $1<br />
billion for the Emerging Markets Equity Portfolio. MSA pays Templeton 0.50% on the first $100 million of the International<br />
Equity Portfolio’s assets, 0.35% on the next $50 million, 0.30% on the next $350 million, 0.25% on the next $500 million,<br />
0.20% on the next $500 million, and 0.15% in excess of $1.5 billion, and Templeton pays Franklin Templeton Investments<br />
(Asia) Limited seven-tenths of the compensation it receives from MSA. For the Long-Term U.S. Government Bond Portfolio,<br />
MSA pays PIMCO 0.225% of the average daily net assets of the portfolio and for the Multi-Sector Bond Portfolio, MSA pays<br />
PIMCO 0.455% of the average daily net assets of the Portfolio.<br />
At its November 4, 2008 meeting, the Series Fund Board approved an Investment Sub-Advisory Agreement between MSA and<br />
American Century relating to the Mid Cap Value Portfolio for an initial period of two years, to be effective as of February 23,<br />
2009. Under the Agreement, MSA will pay American Century 0.57% on the first $50 million of the Mid Cap Value Portfolio’s<br />
average daily net assets, 0.52% on the next $50 million, 0.50% on the next $200 million, 0.45% on the next $200 million, and<br />
0.40% on net assets in excess of $500 million.<br />
Note 5. Federal Income Tax Matters<br />
Each of the Portfolios of the Series Fund has elected to be taxed as a regulated investment company meeting certain<br />
requirements under the Internal Revenue Code. Since each expects to distribute all net investment income and net realized<br />
capital gains, the Portfolios anticipate incurring no federal income taxes.<br />
In accordance with the provisions of Financial Accounting Standards Board Interpretation No. 48, Accounting for Uncertainty<br />
in Income Taxes ("FIN 48"), management of the Portfolios has reviewed all open tax years for major jurisdictions and<br />
concluded the adoption of FIN 48 resulted in no material impact to the Portfolios' net assets or results of operations. There is no<br />
material tax liability resulting from unrecognized tax benefits relating to uncertain income tax positions taken or expected to be<br />
taken in future tax returns. The Portfolios are also not aware of any tax positions for which it is reasonably possible that the<br />
total amounts of unrecognized tax benefits will significantly change in the next 12 months.<br />
Taxable distributions from net investment income and realized capital gains in the Portfolios may differ from book amounts<br />
earned during the period due to differences in the timing of capital gains recognition and due to the reclassification of certain<br />
gains or losses between capital and income. The differences between cost amounts for book purposes and tax purposes are<br />
primarily due to treatment of deferred losses.<br />
It is the policy of the Portfolios to reclassify the net effect of permanent differences between book and taxable income to<br />
capital accounts on the Statements of Assets and Liabilities.<br />
Certain losses incurred by the Portfolios after October 31 st are deferred and deemed to have occurred in the next fiscal year for<br />
income tax purposes. Net realized capital losses for federal income tax purposes are carried forward to offset future net realized<br />
gains. A summary of the Portfolios’ post- October losses and capital loss carryovers as of December 31, 2008 is provided<br />
below:<br />
Post-October Losses<br />
Capital Loss Carryovers<br />
Foreign<br />
Utilized in<br />
Capital Currency Amount Expiration 2008<br />
Expired in<br />
2008<br />
(Amount in Thousands)<br />
Growth Stock Portfolio............................ $ 6,634 $ – $ 19,884 $ 2016 $ – $ –<br />
Focused Appreciation Portfolio ................... 4,719 – 3,503 2016 – –<br />
Notes to Financial Statements 225
Notes to Financial Statements<br />
Post-October Losses<br />
Capital Loss Carryovers<br />
Foreign<br />
Utilized in<br />
Capital Currency Amount Expiration 2008<br />
Expired in<br />
2008<br />
(Amount in Thousands)<br />
Large Cap Core Stock Portfolio................... 9,567 – 94,178 2011-2016 – –<br />
Large Cap Blend Portfolio ........................ 778 – 9,246 2016 – –<br />
Index 500 Stock Portfolio ......................... 5,434 – – – – –<br />
Large Company Value Portfolio .................. 1,150 – 3,845 2016 – –<br />
Domestic Equity Portfolio......................... 17,705 – 114,488 2016 – –<br />
Equity Income Portfolio........................... 4,783 – 2,147 2016 – –<br />
Mid Cap Growth Stock Portfolio.................. 16,132 – – – – –<br />
Index 400 Stock Portfolio ......................... 2,277 – – – – –<br />
Mid Cap Value Portfolio .......................... 7,259 – – – – –<br />
Small Cap Growth Stock Portfolio................ 29,840 – 89,244 2016 – –<br />
Index 600 Stock Portfolio ......................... 535 – – – – –<br />
Small Cap Value Portfolio ........................ 2,575 – – – – –<br />
International Growth Portfolio .................... 19,640 6 22,220 2016 – –<br />
Research International Core Portfolio............. 3,971 7 5,433 2016 – –<br />
International Equity Portfolio ..................... 337 123 – – – –<br />
Emerging Markets Equity Portfolio............... 3,861 – 13,927 2016 – –<br />
Money Market Portfolio........................... – – – – 13 –<br />
Short-Term Bond Portfolio........................ – – 99 2015-2016 – –<br />
Select Bond Portfolio.............................. – – 7,116 2014 9,580 –<br />
Long-Term U.S. Government Bond Portfolio .... – – – – – –<br />
Inflation Protection Portfolio...................... 84 – 272 2016 – –<br />
High Yield Bond Portfolio ........................ 4,102 – 46,872 2009-2016 – 21,129<br />
Multi-Sector Bond Portfolio ...................... – 358 – – – –<br />
Balanced Portfolio................................. 53,694 – 83,295 2016 – –<br />
Asset Allocation Portfolio......................... 7,763 1 19,182 2016 – –<br />
When applicable, each of the Portfolios made distributions during the year of ordinary income and long-term capital gains.<br />
The tax character of distributions paid for the year ended December 31, 2008 was as follows:<br />
Portfolio<br />
Ordinary Income<br />
2008 Distributions<br />
Paid From:<br />
Long-term<br />
Capital Gain<br />
(Amounts in Thousands)<br />
Growth Stock Portfolio .................................... $ 6,333 $ 39,360<br />
Focused Appreciation Portfolio ............................... 815 6,315<br />
Large Cap Core Stock Portfolio ............................... 7,218 —<br />
Large Cap Blend Portfolio .................................. 394 —<br />
Index 500 Stock Portfolio................................... 38,985 53,007<br />
Large Company Value Portfolio............................... 779 —<br />
Domestic Equity Portfolio .................................. 19,626 22,547<br />
Equity Income Portfolio .................................... 651 3,845<br />
Mid Cap Growth Stock Portfolio .............................. 31,442 108,595<br />
Index 400 Stock Portfolio................................... 9,608 46,024<br />
Mid Cap Value Portfolio ................................... 114 2,039<br />
Small Cap Growth Stock Portfolio ............................. 26,366 55,587<br />
Index 600 Stock Portfolio................................... — 196<br />
Small Cap Value Portfolio .................................. 4,323 22,747<br />
International Growth Portfolio................................ 5,348 32,130<br />
Research International Core Portfolio ........................... 979 —<br />
International Equity Portfolio ................................ 62,359 121,603<br />
Emerging Markets Equity Portfolio............................. 2,276 —<br />
Money Market Portfolio.................................... 14,543 —<br />
Short-Term Bond Portfolio .................................. 2,714 —<br />
Select Bond Portfolio ..................................... 52,811 —<br />
Long-Term U.S. Government Bond Portfolio ...................... 2,100 343<br />
Inflation Protection Portfolio................................. 2,473 —<br />
High Yield Bond Portfolio .................................. 21,340 —<br />
Multi-Sector Bond Portfolio ................................. 6,192 452<br />
Balanced Portfolio ....................................... 32,256 695,941<br />
Asset Allocation Portfolio................................... 9,606 19,156<br />
Each Portfolio intends to distribute the maximum allowable amount permitted by law.<br />
226 Notes to Financial Statements
Notes to Financial Statements<br />
Portfolio<br />
Ordinary Income<br />
2007 Distributions<br />
Paid From:<br />
Long-term<br />
Capital Gain<br />
Return of Capital<br />
(Amounts in Thousands)<br />
Growth Stock Portfolio .................................... $ 6,654 $ — $ —<br />
Focused Appreciation Portfolio ............................... 79 272 —<br />
Large Cap Core Stock Portfolio ............................... 6,345 — —<br />
Large Cap Blend Portfolio .................................. 370 — —<br />
Index 500 Stock Portfolio................................... 35,452 76,507 —<br />
Large Company Value Portfolio............................... 397 2 —<br />
Domestic Equity Portfolio .................................. 10,843 15,394 —<br />
Equity Income Portfolio .................................... 5,943 20,097 —<br />
Mid Cap Growth Stock Portfolio .............................. 9,438 106,812 —<br />
Index 400 Stock Portfolio................................... 8,654 29,612 —<br />
Mid Cap Value Portfolio ................................... 5,009 13,911 —<br />
Small Cap Growth Stock Portfolio ............................. 3,407 45,726 —<br />
Index 600 Stock Portfolio................................... 105 — 102<br />
Small Cap Value Portfolio .................................. 4,900 15,260 —<br />
International Growth Portfolio................................ 2,744 24,163 —<br />
Research International Core Portfolio ........................... 798 — —<br />
International Equity Portfolio ................................ 32,959 21,809 —<br />
Emerging Markets Equity Portfolio............................. 234 — —<br />
Money Market Portfolio.................................... 21,766 — —<br />
Short-Term Bond Portfolio .................................. 1,678 — —<br />
Select Bond Portfolio ..................................... 40,788 — —<br />
Long-Term U.S. Government Bond Portfolio ...................... 837 — —<br />
Inflation Protection Portfolio................................. 983 — —<br />
High Yield Bond Portfolio .................................. 17,960 — —<br />
Multi-Sector Bond Portfolio ................................. 2,006 33 —<br />
Balanced Portfolio ....................................... 91,830 50,253 —<br />
Asset Allocation Portfolio................................... 7,648 12,908 —<br />
As of December 31, 2008, the tax basis amounts were as follows:<br />
Portfolio<br />
Undistributed<br />
Ordinary<br />
Income<br />
Undistributed<br />
Long-Term<br />
Gains<br />
Accumulated<br />
Losses<br />
Unrealized<br />
Appreciation<br />
(Depreciation)<br />
(Amount in Thousands)<br />
Growth Stock Portfolio....................................................................$ 5,283 $ – $ (26,519 ) $ (109,498 )<br />
Focused Appreciation Portfolio ........................................................... – – (8,222 ) (44,898 )<br />
Large Cap Core Stock Portfolio........................................................... 6,039 – (103,745 ) (82,256 )<br />
Large Cap Blend Portfolio ................................................................ 3 – (10,024 ) (10,688 )<br />
Index 500 Stock Portfolio ................................................................. 35,665 35,754 (5,434 ) (137,575 )<br />
Large Company Value Portfolio .......................................................... 92 – (4,996 ) (13,274 )<br />
Domestic Equity Portfolio................................................................. 10,666 – (132,193 ) (67,728 )<br />
Equity Income Portfolio................................................................... 4,885 – (6,930 ) (66,905 )<br />
Mid Cap Growth Stock Portfolio.......................................................... 2,018 924 (16,132 ) (258,373 )<br />
Index 400 Stock Portfolio ................................................................. 6,402 11,120 (2,277 ) (113,308 )<br />
Mid Cap Value Portfolio .................................................................. 944 858 (7,259 ) (33,568 )<br />
Small Cap Growth Stock Portfolio........................................................ 839 – (119,084 ) (84,477 )<br />
Index 600 Stock Portfolio ................................................................. – 3 (535 ) (9,014 )<br />
Small Cap Value Portfolio ................................................................ 2,192 9,196 (2,575 ) (57,423 )<br />
International Growth Portfolio ............................................................ 1,029 – (41,860 ) (72,620 )<br />
Research International Core Portfolio..................................................... 335 – (9,411 ) (13,311 )<br />
International Equity Portfolio ............................................................. 47,284 22,331 (460 ) (216,006 )<br />
Emerging Markets Equity Portfolio....................................................... 377 – (17,789 ) (29,646 )<br />
Money Market Portfolio................................................................... – – – (487 )<br />
Short-Term Bond Portfolio................................................................ 24 – (99 ) (982 )<br />
Select Bond Portfolio...................................................................... 56,503 – (7,116 ) (22,714 )<br />
Long-Term U.S. Government Bond Portfolio ............................................ 5,461 4,469 – 2,509<br />
Inflation Protection Portfolio.............................................................. 121 – (355 ) (621 )<br />
High Yield Bond Portfolio ................................................................ 22,564 – (50,973 ) (74,536 )<br />
Multi-Sector Bond Portfolio .............................................................. 1,213 1,172 (358 ) (12,373 )<br />
Balanced Portfolio......................................................................... 92,107 – (136,989 ) (324,131 )<br />
Asset Allocation Portfolio................................................................. 6,142 – (26,945 ) (40,955 )<br />
Notes to Financial Statements 227
Notes to Financial Statements<br />
Note 6. Voluntary Reimbursements<br />
<strong>Northwestern</strong> <strong>Mutual</strong> voluntarily reimburses foreign equity portfolios for the benefit <strong>Northwestern</strong> <strong>Mutual</strong> receives from<br />
foreign dividend taxes charged against the Portfolios. The amounts reimbursed represent approximately 65% of the foreign<br />
dividend taxes withheld from the Portfolios. Reimbursements are recorded when foreign dividend taxes are accrued. Voluntary<br />
reimbursements for the year ended December 31, 2008 and the year ended December 31, 2007 are summarized below:<br />
Portfolio<br />
2008<br />
Reimbursements<br />
2007<br />
Reimbursements<br />
International Growth Portfolio....................... $ 420,110 $ 379,759<br />
Research International Core Portfolio .................. 127,658 50,124<br />
International Equity Portfolio ....................... 3,855,801 3,435,866<br />
Emerging Markets Equity Portfolio.................... 203,843 74,978<br />
Note 7. Guarantees<br />
In the normal course of business the Portfolios enter into contracts that contain a variety of representations which provide<br />
general indemnifications. The Portfolios’ maximum exposure under these arrangements is unknown as this would involve<br />
future claims that may be made against the Portfolios that have not yet occurred. However, the Portfolios expect the risk of loss<br />
to be remote.<br />
A. Capital Support Agreement - On September 26, 2008, <strong>Northwestern</strong> <strong>Mutual</strong>, the parent of the investment advisor for the<br />
Money Market Portfolio, entered into a capital support agreement with the Series Fund on behalf of the Money Market<br />
Portfolio relating to three securities (“Covered Securities”) to assist the Portfolio in seeking to maintain a stable net asset value.<br />
Under the Agreement, <strong>Northwestern</strong> <strong>Mutual</strong> is obligated to make a capital contribution to the Money Market Portfolio if the<br />
Portfolio realizes losses on the Covered Securities through a sale, bankruptcy or other final payment, or exchange or<br />
restructuring of the Covered Security. The amount of the capital contribution would be the lower of (i) the amount necessary to<br />
maintain the Portfolio’s market-based net asset value per share at no less than $0.995, (ii) the loss incurred by the Portfolio as a<br />
result of the disposition of the Covered Security, or (iii) the aggregate maximum contribution amount set forth in the<br />
Agreement less any previous contribution made under the Agreement. The Agreement terminates upon the earlier to occur of<br />
(i) the repayment in full by the issuers of all Covered Securities, (ii) the payment by <strong>Northwestern</strong> <strong>Mutual</strong>, in the aggregate, of<br />
the maximum contribution amount in the Agreement ($23,570,000 representing the aggregate par value of the Covered<br />
Securities), and (iii) July 17, 2009.<br />
Securities covered under the capital support agreement as of December 31, 2008:<br />
Description Maturity Amortized Cost Market Value<br />
Market Value as<br />
a Percent<br />
of Net Assets<br />
(Amounts in Thousands)<br />
Associates Corp. of North America . . . . . . . . . . . . . . . . . . . . . . . . . . . . . . . . . 7/15/09 $ 7,172 $ 7,001 1.12%<br />
The Goldman Sachs Group, Inc. . . . . . . . . . . . . . . . . . . . . . . . . . . . . . . . . . . . 1/15/09 10,003 9,996 1.61%<br />
International Lease Finance Corp. . . . . . . . . . . . . . . . . . . . . . . . . . . . . . . . . . . 4/01/09 6,539 6,229 1.00%<br />
B. Participation in Treasury’s Temporary Guarantee Program for Money Market Funds - At a meeting held on October 6,<br />
2008, the Board of Directors of the Series Fund determined that the Series Fund’s Money Market Portfolio would participate in<br />
the U.S. Department of the Treasury’s (the “Treasury”) Temporary Guarantee Program for Money Market Funds (the<br />
“Program”), and subsequently determined that the Money Market Portfolio would participate under the Program’s extension,<br />
as discussed below. Under the Program, the Treasury guarantees to investors in participating money market funds that they will<br />
receive $1.00 for each money market fund share held as of the close of business on September 19, 2008, subject to certain<br />
limitations which are described below. The guarantee will be triggered if the Money Market Portfolio “breaks the buck;” that<br />
is, if its net asset value per share falls below $0.995 (a “Guarantee Event”). The Money Market Portfolio is responsible for the<br />
payment of fees required to participate in the Program, including any Program extensions. These fees are included in the<br />
expenses of the Portfolio in the Statements of Operations.<br />
228 Notes to Financial Statements
Notes to Financial Statements<br />
The Program applies only to shares held in the Money Market Portfolio as of the close of business on September 19, 2008. The<br />
Program’s guarantee does not apply to shares purchased after September 19, 2008 or to shares redeemed or exchanged into or<br />
out of the Money Market Portfolio after September 19, 2008. There is no per-account cap on the amount of coverage; however,<br />
the number of shares of each shareholder covered by the Program will be the lesser of (a) the number of shares owned by the<br />
shareholder on September 19, 2008 or (b) the number of shares owned by the shareholder in the same account on the date of<br />
the Guarantee Event.<br />
If a Guarantee Event occurs, the Money Market Portfolio would be required to liquidate and comply with certain other<br />
requirements for any shareholder to be entitled to payments under the Program. The Program covers the difference between the<br />
amount received by a shareholder in connection with such liquidation and $1.00 per share, for any shares covered by the<br />
guarantee, subject to the overall amount available to all funds participating in the Program. In liquidation, those shares not<br />
covered by the Program may receive less than $1.00 per share. Guarantee payments under the Program to all participating<br />
money market funds will not exceed the amount available within the U.S. Treasury Department’s Exchange Stabilization Fund<br />
on the date of payment. Currently, assets available to the Program are approximately $50 billion.<br />
The Program’s initial three month term ran from September 19, 2008 through December 18, 2008. The Secretary of the<br />
Treasury has extended the Program through April 30, 2009, after which the Secretary will review the need to further extend the<br />
Program, and the terms of any extension. If the Program is extended, the Money Market Portfolio would have to renew its<br />
participation and pay any additional fees required to maintain coverage. If the Secretary chooses not to extend the Program<br />
beyond April 30, 2009, the Program will terminate. There is no guarantee that the Secretary of the Treasury will extend the<br />
Program, or that the Money Market Portfolio will elect or be eligible to participate in the Program if it is extended beyond<br />
April 30, 2009. If a Guarantee Event occurs after the Program expires, or, if sooner, after the Money Market Portfolio ceases to<br />
participate in the Program, neither the Money Market Portfolio nor its shareholders will be entitled to any payment under the<br />
Program.<br />
The Money Market Portfolio is not in any manner approved, endorsed, sponsored or authorized by the U.S. Department of the<br />
Treasury.<br />
Notes to Financial Statements 229
Report of Independent Registered Public Accounting Firm<br />
To the Shareholders and Board of Directors of<br />
<strong>Northwestern</strong> <strong>Mutual</strong> Series Fund, Inc.<br />
In our opinion, the accompanying statements of assets and liabilities, including the schedules of investments, and the<br />
related statements of operations and of changes in net assets and the financial highlights present fairly, in all material<br />
respects, the financial position of the Growth Stock Portfolio, Focused Appreciation Portfolio, Large Cap Core Stock<br />
Portfolio, Large Cap Blend Portfolio, Index 500 Stock Portfolio, Large Company Value Portfolio, Domestic Equity<br />
Portfolio, Equity Income Portfolio, Mid Cap Growth Stock Portfolio, Index 400 Stock Portfolio, Mid Cap Value<br />
Portfolio, Small Cap Growth Stock Portfolio, Index 600 Stock Portfolio, Small Cap Value Portfolio, International<br />
Growth Portfolio, Research International Core Portfolio, International Equity Portfolio, Emerging Markets Equity<br />
Portfolio, Money Market Portfolio, Short-Term Bond Portfolio, Select Bond Portfolio, Long-Term U.S. Government<br />
Bond Portfolio, Inflation Protection Portfolio, High Yield Bond Portfolio, Multi-Sector Bond Portfolio, Balanced<br />
Portfolio and Asset Allocation Portfolio (constituting <strong>Northwestern</strong> <strong>Mutual</strong> Series Fund, Inc., hereafter referred to as the<br />
"Fund") at December 31, 2008, the results of each of their operations, the changes in each of their net assets and their<br />
financial highlights for each of the periods presented, in conformity with accounting principles generally accepted in the<br />
United States of America. These financial statements and financial highlights (hereafter referred to as "financial<br />
statements") are the responsibility of the Fund's management. Our responsibility is to express an opinion on these<br />
financial statements based on our audits. We conducted our audits of these financial statements in accordance with the<br />
standards set forth by the Public Company Accounting Oversight Board (United States). Those standards require that we<br />
plan and perform the audit to obtain reasonable assurance about whether the financial statements are free of material<br />
misstatement. An audit includes examining, on a test basis, evidence supporting the amounts and disclosures in the<br />
financial statements, assessing the accounting principles used and significant estimates made by management, and<br />
evaluating the overall financial statement presentation. We believe that our audits, which included confirmation of<br />
securities at December 31, 2008 by correspondence with the custodians and brokers, provide a reasonable basis for our<br />
opinion.<br />
Milwaukee, Wisconsin<br />
February 19, 2009<br />
230 Report of Independent Registered Public Accounting Firm
Proxy Voting and Portfolio Holdings<br />
Proxy Voting Guidelines<br />
A description of the policies and procedures that the Portfolios use to determine how to vote proxies relating to portfolio<br />
securities is available without charge, upon request, by calling toll free 1-888-455-2232. It is also available on the Securities<br />
and Exchange Commission’s website at http://www.sec.gov.<br />
Information regarding how the Portfolios voted proxies relating to portfolio securities during the most recent twelve-month<br />
period ended June 30 is available without charge, upon request, by calling toll free 1-888-455-2232. It is also available on the<br />
Securities and Exchange Commission’s website at http://www.sec.gov.<br />
Quarterly Filing of Portfolio Holdings<br />
Each Portfolio files its complete schedule of portfolio holdings with the Securities and Exchange Commission (SEC) for the<br />
first and third quarters of each fiscal year on Form N-Q. The Portfolio’s Form N-Q filings are available (i) on the SEC website<br />
at http://www.sec.gov, and may be reviewed and copied at the SEC’s Public Reference Room in Washington, DC. Information<br />
on the Public Reference Room may be obtained by calling 1-800-SEC-0330. The Portfolios also make their complete schedule<br />
of portfolio holdings for the most recent quarter of their fiscal year available on the Internet at www.nmfn.com.<br />
Proxy Voting and Portfolio Holdings 231
Director and Officer Information (Unaudited)<br />
<strong>Northwestern</strong> <strong>Mutual</strong> Series Fund, Inc.<br />
The name, address and year of birth of the directors, as well as their affiliations, positions held with the Fund, principal<br />
occupations during the past five years and the number of portfolios overseen in the <strong>Northwestern</strong> <strong>Mutual</strong> fund complex, are<br />
shown below as of December 31, 2008. Each director (whenever elected) shall hold office until the next annual meeting of<br />
shareholders and until his or her successor is elected and qualifies or until his or her earlier death, resignation or removal,<br />
provided no director shall serve a term or successive terms totaling more than twelve (12) years. The twelve-year service<br />
limitation commences for all directors on the later of May 1, 2003, or the date of his or her election or appointment to the<br />
Board. Notwithstanding the foregoing, the Fund’s By-Laws provide that a director who has attained the age of seventy (70) on<br />
or before the first quarterly Board meeting in a calendar year shall retire effective at the end of the meeting. If a director attains<br />
age seventy (70) after the first quarterly Board meeting in a calendar year, he or she shall retire effective at the end of the first<br />
quarterly Board meeting in the following calendar year. The statement of additional information contains additional<br />
information about Fund directors and is available without charge, upon request, by calling 1-888-455-2232.<br />
Independent Directors<br />
Name, Address, and<br />
Year of Birth<br />
William A. McIntosh<br />
720 East Wisconsin Avenue<br />
Milwaukee, WI 53202<br />
1939<br />
Position<br />
Length of<br />
Time Served<br />
Number of Portfolios<br />
in Fund Complex<br />
Overseen by Director<br />
Other Directorships Held<br />
Director Since 1997 27 MGIC Investment<br />
Corporation<br />
Principal Occupation During Past 5 Years: Financial consulting. Adjunct Faculty Member, Howard University (1998-2004).<br />
Michael G. Smith<br />
Director Since 2003 27 Trustee of The Ivy Family<br />
720 East Wisconsin Avenue<br />
of Funds (2 registered<br />
Milwaukee, WI 53202<br />
investment companies —<br />
1944<br />
29 portfolios), Director of<br />
the TDAX Funds, Inc. (5<br />
portfolios) and CTMG,<br />
Inc.<br />
Principal Occupation During Past 5 Years: Private investor; retired since 1999.<br />
Miriam M. Allison<br />
720 East Wisconsin Avenue<br />
Milwaukee, WI 53202<br />
1947<br />
Director Since 2006 27 None<br />
Principal Occupation During Past 5 Years: Rancher since 2004. Real estate developer since 2002. From 2001 to 2005,<br />
Chairman of UMB Fund Services, Inc. (formerly Sunstone Financial Group, Inc.), a mutual fund service provider.<br />
Robert H. Huffman III<br />
720 East Wisconsin Avenue<br />
Milwaukee, WI 53202<br />
1959<br />
Director Since 2007 27 None<br />
Principal Occupation During Past 5 Years: Co-Founder and Managing Partner of Relative Value Partners, LLC, a registered<br />
investment adviser since 2004; prior thereto, Head of Fixed Income Sales, Midwest Region, Citigroup, Inc. (formerly Salomon<br />
Brothers).<br />
Michael M. Knetter<br />
720 East Wisconsin Avenue<br />
Milwaukee, WI 53202<br />
1960<br />
Director Since 2007 27 Trustee of The Neuberger<br />
Berman Family of Funds<br />
(11 registered investment<br />
companies — 61<br />
portfolios), Wausau Paper<br />
Corp. and Great Wolf<br />
Resorts, Inc.<br />
Principal Occupation During Past 5 Years: Dean of University of Wisconsin-Madison School of Business since 2002.<br />
232 Director and Officer Information
Director and Officer Information (Unaudited)<br />
<strong>Northwestern</strong> <strong>Mutual</strong> Series Fund, Inc.<br />
Other Directors<br />
Number of Portfolios<br />
Name, Address, and Length of in Fund Complex Other Directorships<br />
Year of Birth Position Time Served Overseen by Directo Held<br />
Edward J. Zore Chairman Since 2000 27 Manpower, Inc. and<br />
720 East Wisconsin Avenue of the Board Trustee of <strong>Northwestern</strong> <strong>Mutual</strong><br />
Milwaukee, WI 53202<br />
1945<br />
Principal Occupation During Past 5 Years: President and Chief Executive Officer of <strong>Northwestern</strong> <strong>Mutual</strong> since 2001.<br />
Executive Officers<br />
Name, Address, and<br />
Length of<br />
Year of Birth Position Time Served<br />
Patricia L. Van Kampen President Since 2008<br />
720 East Wisconsin Avenue<br />
Milwaukee, WI 53202<br />
1951<br />
Principal Occupation: Managing Director – Head of Equities of Mason Street Advisors, LLC since 2002.<br />
Walter M. Givler Vice President; Since 2003<br />
720 East Wisconsin Avenue Chief Financial Officer & Treasurer<br />
Milwaukee, WI 53202<br />
1957<br />
Principal Occupation During Past 5 Years: Vice President – Accounting Policy of <strong>Northwestern</strong> <strong>Mutual</strong> since 2007; Vice<br />
President of Investment Accounting for <strong>Northwestern</strong> <strong>Mutual</strong>, since 2002 – 2007.<br />
Kate M. Fleming Vice President-Operations Since 2004<br />
720 East Wisconsin Avenue<br />
Milwaukee, WI 53202<br />
1962<br />
Principal Occupation During Past 5 Years: Vice President-Operations of Mason Street Advisors, LLC since 2004. Prior<br />
thereto, Assistant General Counsel of <strong>Northwestern</strong> <strong>Mutual</strong>.<br />
Barbara E. Courtney Controller Since 1996<br />
720 East Wisconsin Avenue<br />
Milwaukee, WI 53202<br />
1957<br />
Principal Occupation During Past 5 Years: Director of <strong>Mutual</strong> Fund Accounting of <strong>Northwestern</strong> <strong>Mutual</strong> since 2002.<br />
Michael W. Zielinski Chief Compliance Officer Since 2006<br />
720 East Wisconsin Avenue<br />
Milwaukee, WI 53202<br />
1974<br />
Principal Occupation During Past 5 Years: Chief Compliance Officer of Mason Street Advisors, LLC since 2006; Counsel,<br />
<strong>Northwestern</strong> <strong>Mutual</strong> from 2004 - 2006; Associate Counsel, Quasar Distributors, LLC (broker-dealer) from 2003 to 2004.<br />
Randy M. Pavlick Secretary Since 2006<br />
720 East Wisconsin Avenue<br />
Milwaukee, WI 53202<br />
1959<br />
Principal Occupation During Past 5 Years: Assistant General Counsel of <strong>Northwestern</strong> <strong>Mutual</strong> and Assistant Secretary of<br />
Mason Street Advisors, LLC, each since 2004; prior thereto, Vice President and General Counsel of UMB Financial Services,<br />
Inc. (formerly Sunstone Financial Group, Inc.) (mutual fund service provider) from 1993 to 2004.<br />
Director and Officer Information 233
Approval and Continuance of Investment<br />
Sub-Advisory Agreements<br />
<strong>Northwestern</strong> <strong>Mutual</strong> Series Fund, Inc.<br />
<strong>Annual</strong> Contract Review Process<br />
Under Section 15(c) of the Investment Company Act of 1940, contracts for investment advisory services are required to be<br />
reviewed, evaluated and approved by a majority of an investment company’s independent directors each year. In addition,<br />
each investment company is required to disclose in its annual or semi-annual report, as appropriate, the material factors and<br />
conclusions that formed the basis for the board’s approval or renewal of any investment advisory agreements within the<br />
investment company’s most recently completed fiscal half-year period.<br />
At least annually, the Board of Directors (the “Board”) of the <strong>Northwestern</strong> <strong>Mutual</strong> Series Fund, Inc. (the “Series Fund”),<br />
including its Independent Directors, considers and votes upon the renewal of the investment sub-advisory agreements between<br />
Mason Street Advisors, LLC (“Mason Street Advisors”) and each of the sub-advisers of those portfolios of the Series Fund<br />
(each, a “Portfolio” and collectively, the “Portfolios”) for which Mason Street Advisors has appointed a sub-adviser. In order<br />
to afford the Board the opportunity to focus on a smaller number of relationships at any one meeting, the Board considers the<br />
annual continuation of the sub-advisory agreements on a staggered basis.<br />
At its August 6, 2008 meeting, the Series Fund Board, including the Independent Directors, unanimously approved the<br />
continuance of the Investment Sub-Advisory Agreement, with certain non-substantive amendments, between Mason Street<br />
Advisors and Janus Capital Management LLC ("Janus") relating to the Focused Appreciation Portfolio, and the continuance of<br />
the Investment Sub-Advisory Agreement between Mason Street Advisors and American Century Investment Management, Inc.<br />
(“ACI”) relating to the Large Company Value Portfolio and the Inflation Protection Portfolio. The Series Fund Board,<br />
including the Independent Directors, also unanimously approved the continuance, subject to the limitations discussed below, of<br />
the Investment Sub-Advisory Agreement with AllianceBernstein L.P. (“AllianceBernstein”) relating to the Mid Cap Value<br />
Portfolio.<br />
At its November 4, 2008 meeting, the Series Fund Board, including the Independent Directors, unanimously approved an<br />
Investment Sub-Advisory Agreement between Mason Street Advisors and ACI relating to the Mid Cap Value Portfolio for an<br />
initial two year period, pursuant to which ACI would replace AllianceBernstein as the sub-adviser for the Mid Cap Value<br />
Portfolio as of February 23, 2009 (the “New Sub-Advisory Agreement”). At its November 4, 2008 meeting, the Series Fund<br />
Board, including the Independent Directors, also unanimously approved the continuance of the Investment Sub-Advisory<br />
Agreement, with certain non-substantive amendments, between Mason Street Advisors and T. Rowe Price Associates, Inc. (“T.<br />
Rowe Price”) relating to the Small Cap Value Portfolio and the Equity Income Portfolio and the continuance of the Investment<br />
Sub-Advisory Agreement between Mason Street Advisors and Pacific Investment Management Company, LLC (“PIMCO”)<br />
relating to the Long-Term U.S. Government Bond Portfolio and the Multi-Sector Bond Portfolio. (AllianceBernstein, Janus,<br />
ACI, T. Rowe Price and PIMCO are sometimes collectively referred to hereinafter as the "Sub-Advisers," their respective subadvised<br />
Portfolios are collectively referred to herein as the "Sub-Advised Portfolios" and the respective Investment Sub-<br />
Advisory Agreements with such Sub-Advisers are collectively referred to herein as the “Existing Sub-Advisory Agreements”).<br />
Factors Considered<br />
In determining whether to approve the New Sub-Advisory Agreement and the continuance of the Existing Sub-Advisory<br />
Agreements on behalf of the Series Fund, the Directors requested and received detailed information from Mason Street<br />
Advisors and the Sub-Advisers to assist them in their evaluation, including information compiled by certain independent<br />
providers of evaluative data. With respect to the continuation of the Existing Sub-Advisory Agreements, while particular focus<br />
is given to an evaluation of the services, performance, fees, costs, and certain other relevant information under such<br />
Agreements at the meeting at which their continuation is formally considered, the evaluation process with respect to the Sub-<br />
Advisers and the nature, extent and quality of the services they provide to the Sub-Advised Portfolios, and the related<br />
performance, costs and expenses, is an ongoing one. As a result, the Directors' consideration of the nature, extent and quality<br />
of services, and the performance, costs and expenses, was informed by information provided and deliberations that occurred at<br />
other meetings throughout the year.<br />
The Independent Directors also received a memorandum from their counsel advising the Directors of their responsibilities in<br />
connection with the approval of the New Investment Sub-Advisory Agreement and the renewal of the Existing Sub-Advisory<br />
Agreements, and summarizing the legal standards governing the review of these Agreements. In addition, during the course of<br />
234 Approval and Continuance of Investment Sub-Advisory Agreements
Approval and Continuance of Investment<br />
Sub-Advisory Agreements<br />
their deliberations, the Independent Directors had the opportunity to meet privately without representatives of Mason Street<br />
Advisors and the Sub-Advisers present, and were represented throughout the process by legal counsel to the Independent<br />
Directors.<br />
Approval of the Investment Sub-Advisory Agreement between Mason Street Advisors and American Century<br />
Investment Management, Inc.<br />
At its November 4, 2008 meeting, the Series Fund Board selected ACI to replace AllianceBernstein as the sub-adviser for the<br />
Mid Cap Value Portfolio. The material factors and conclusions that formed the basis for the Board's determination to approve<br />
the New Sub-Advisory Agreement with respect to the Mid Cap Value Portfolio include those discussed below. In addition to<br />
the information provided to them at the November 4, 2008 meeting, including an in-person presentation from ACI, the<br />
Directors considered their experience with and knowledge of the nature and quality of services provided by ACI to other of the<br />
Series Fund’s Portfolios, and their interactions with representatives of ACI and its affiliates and their discussions with<br />
representatives of Mason Street Advisors. The Directors evaluated a variety of information they deemed relevant. No one<br />
particular factor was identified as controlling, but rather it was a combination of all the factors and conclusions that formed the<br />
basis for the determinations made by the Directors.<br />
Nature, Extent and Quality of Services. The Directors evaluated the nature, scope, extent and quality of services to be provided by<br />
ACI with respect to the Mid Cap Value Portfolio. The Directors considered the process followed to identify potential sub-advisers<br />
for the Mid Cap Value Portfolio, and the rationale for the recommendation of ACI as sub-adviser. The Directors also considered the<br />
breadth and depth of experience of ACI in managing other accounts using a similar investment strategy, including other mutual funds<br />
using a substantially similar strategy. The Directors’ considerations included information about ACI’s organization and the<br />
tenure, experience, performance and relative depth of ACI’s investment management team. The Board also considered the<br />
potential benefit of ACI’s private ownership structure in the current market environment. The Board acknowledged the synergy<br />
between the organizations’ core values. The investment processes to be employed by ACI were also considered, with the Board<br />
noting in particular the value style purity of ACI’s investment process. The Board also considered ACI’s explanation of the<br />
impact of its investment strategy on portfolio turnover and the materials presented regarding the consistency of the turnover<br />
with ACI’s investment process and the impact of turnover on performance. Finally, the Board took into consideration ACI’s<br />
general reputation and the resources available to be committed in managing the Mid Cap Value Portfolio. Based on their review of<br />
these factors and other factors deemed relevant, the Directors concluded that they were satisfied with the nature, extent and<br />
quality of services to be provided by ACI with respect to the Mid Cap Value Portfolio, and the resources to be committed by<br />
ACI in providing such services.<br />
Investment Performance. The Directors considered ACI’s performance record with another mutual fund with an investment<br />
objective, investment policies and investment strategies substantially similar to the Mid Cap Value Portfolio. In addition to<br />
absolute performance for this similar fund for both short and long-term periods, the Directors considered a comparison of the<br />
performance to the returns of a peer group and universe of comparable funds underlying variable insurance products as<br />
compiled by an independent research firm, and to the performance averages of the respective Morningstar and Lipper<br />
categories for the same periods. The Directors evaluated the similar fund’s relative performance, and considered independent<br />
rankings and ratings where applicable, to provide an objective comparative benchmark against which they could assess the<br />
experience and ability of ACI in managing similar accounts. The Directors also considered ACI’s knowledge and experience<br />
as a value manager and their experience with the value investment capabilities of ACI. Based on these and other factors<br />
deemed relevant, the Board concluded that it was satisfied with the experience and capabilities of ACI and the personnel to be<br />
associated with the Mid Cap Value Portfolio.<br />
Management Fees and Other Expenses. In evaluating the management fees paid by the Mid Cap Value Portfolio, the Directors<br />
considered the actual and contractual fees paid by the Portfolio under the Investment Advisory Agreement between Mason<br />
Street Advisors and the Series Fund. The Directors also considered a comparison of the actual and contractual management<br />
fees of the Portfolio and those of an independently selected peer group of mutual funds for the Portfolio. The Directors<br />
considered that the fee schedule for the Mid Cap Value Portfolio contained breakpoints, and that the fee schedule and<br />
breakpoints evidenced an appropriate sharing of economies of scale between the Portfolio and Mason Street Advisors. The<br />
Directors further considered the total operating expenses of the Portfolio and a comparison of those expenses with the<br />
Portfolio's peer group. The fact that the Investment Advisory Agreement requires Mason Street Advisors to be responsible for<br />
many of the administrative and operational expenses, in addition to the investment management expenses, of the Portfolio was<br />
also considered. The Directors did not consider the management fees charged to other Mason Street Advisors clients as<br />
particularly relevant, because substantially all of those accounts were managed for affiliates of Mason Street Advisors and, as<br />
Approval and Continuance of Investment Sub-Advisory Agreements 235
Approval and Continuance of Investment<br />
Sub-Advisory Agreements<br />
such, those accounts were priced based on different factors and considerations and, in some instances, had investment<br />
objectives and policies different than the Portfolio. The Directors considered the comparative data as a guide to help assess the<br />
reasonableness of the Portfolio's advisory fee, although they acknowledged that it was difficult to make precise comparisons<br />
with other funds since the exact nature of services provided by peers is often not apparent. The Directors also separately<br />
considered the allocation between Mason Street Advisors and ACI of the Mid Cap Value Portfolio's investment advisory fee<br />
(i.e. the amount of the advisory fee retained by Mason Street Advisors relative to that paid to ACI as a sub-advisory fee). They<br />
determined that the allocation was reasonable and the product of arm's length negotiation between Mason Street Advisors and<br />
ACI.<br />
The Directors noted that the Mid Cap Value Portfolio was projected to continue to be in one of the two top Lipper quintiles<br />
(meaning lowest expenses) of both its peer group and universe, with respect to total net operating expenses. In considering the<br />
level of management fees, the Directors also considered the structure and size of the Portfolio, the expenses assumed by Mason<br />
Street Advisors, the existing expense cap arrangement agreed to by Mason Street Advisors for the Portfolio and the amounts<br />
waived or reimbursed by Mason Street Advisors under the agreement. Based on their review of the management and other<br />
expenses, the comparative data, the performance of the Portfolio, and other factors deemed relevant by the Directors, the<br />
Directors concluded that the management fees and total operating expenses of the Portfolio were reasonable in relation to the<br />
nature, scope and quality of services provided and the performance of the Portfolio.<br />
Costs and Profitability. The Directors also considered Mason Street Advisors’ pricing methodology for its services as<br />
investment adviser and for the products of which the Portfolio is an investment option. Also considered was the financial<br />
condition of Mason Street Advisors and information concerning Mason Street Advisors’ costs and profitability with respect to<br />
its relationship with the Portfolio in general as well as in light of the sub-advisory fees negotiated with ACI. Mason Street<br />
Advisors provided a profitability analysis for the Portfolio that included the expense allocation methodology used, net income<br />
for the Portfolio individually and the Series Fund Portfolios in the aggregate, net income earned from Mason Street Advisors<br />
for all of its clients in the aggregate, and net profit margins for the Portfolio individually and the Series Fund Portfolios in the<br />
aggregate. In connection with its review of the profitability of Mason Street Advisors’ services to the Portfolio, the Directors<br />
also considered services provided by affiliates of Mason Street Advisors. The Directors also received information on soft<br />
dollar arrangements, including its policies for allocating brokerage and research services, and any other benefits to Mason<br />
Street Advisors or its affiliates arising from the Portfolio.<br />
The Directors recognized that there are limitations inherent in allocating costs and calculating profitability for an organization<br />
such as Mason Street Advisors, and that it is difficult to make comparisons of profitability among investment advisers and<br />
clients because comparative information is not generally publicly available and, when available, such information has been<br />
developed using a variety of assumptions and other factors. Based on their review of the profitability analysis for the Portfolio,<br />
the Directors concluded that they were satisfied that Mason Street Advisors’ level of profitability from its relationship with the<br />
Portfolio was not excessive.<br />
Continuation of the Investment Sub-Advisory Agreements Between Mason Street Advisors and Certain Sub-Advisers<br />
The material factors and conclusions that formed the basis for the Board's approval of the continuance of each of the Existing<br />
Sub-Advisory Agreements with respect to each Sub-Advised Portfolio include those discussed below. In addition to the<br />
information provided to them at the meetings by Mason Street Advisers and the Sub-Advisers, the Directors considered their<br />
experience with and knowledge of the nature and quality of the services provided by the Sub-Advisers and their discussions<br />
with representatives of Mason Street Advisers, its affiliates and the Sub-Advisers. The Directors received a presentation from<br />
representatives of each Sub-Adviser involved in the management of the respective Sub-Advised Portfolios, as well as<br />
information from Mason Street Advisors regarding on-site due diligence visits which had been conducted with each Sub-<br />
Adviser. The Directors evaluated a variety of information they deemed relevant on a Portfolio by Portfolio basis. No one<br />
particular factor was identified as controlling, but rather it was a combination of all the factors and conclusions that formed the<br />
basis for the determinations made by the Directors.<br />
Nature, Extent and Quality of Services. In considering the nature, extent and quality of each Sub-Adviser’s services, factors<br />
considered by the Directors included the Sub-Adviser’s investment personnel, the experience of the portfolio managers of each<br />
of the Sub-Advised Portfolios, and any changes in key personnel. The Directors considered the recent portfolio manager<br />
change for the Focused Appreciation Portfolio and concluded that overall, they did not believe that the change had impacted<br />
the level of service provided. The Directors also considered the scope of the services provided by the Sub-Advisers, noting<br />
that there were no changes in the services provided. In connection with the Portfolios sub-advised by PIMCO, the Directors<br />
236 Approval and Continuance of Investment Sub-Advisory Agreements
Approval and Continuance of Investment<br />
Sub-Advisory Agreements<br />
considered information relating to PIMCO’s appointment as the asset manager for the Federal Reserve’s Commercial Paper<br />
Funding Facility, as well as PIMCO’s explanation of how it intended to allocate resources to provide services to the Portfolios<br />
in light of such appointment. The Directors also considered the succession plans with respect to the management of certain of<br />
the Sub-Advised Portfolios. Consideration was also given to the Sub-Advisers' reputations in the industry in providing<br />
investment management services, the Sub-Advisers' experience and the performance of the Sub-Advised Portfolios. Based on<br />
their review of these factors, their discussions with the Sub-Advisers and their experience with the services provided by the<br />
Sub-Advisers for the respective Sub-Advised Portfolios, other than as discussed below, the Directors concluded that they were<br />
satisfied with the nature, extent and quality of services provided by Sub-Advisers on behalf of the respective Sub-Advised<br />
Portfolios, and the resources committed by each Sub-Adviser in providing those services.<br />
With respect to the Board’s decision to replace the sub-adviser for the Mid Cap Value Portfolio, the Directors considered<br />
ongoing discussions with AllianceBernstein relating to certain issues that had arisen based on AllianceBernstein’s portfolio<br />
management style, including certain difficulties created in terms of measuring the Portfolio’s performance relative to its mid<br />
cap value peers. The Board generally felt that AllianceBernstein’s approach to resolving the issues was not likely to be<br />
successful, particularly given the facts and circumstances relating to the manner in which AllianceBernstein managed accounts<br />
with a mandate similar to the Portfolio’s. While the Board considered the Portfolio’s long-term performance record and lower<br />
expense ratio to be satisfactory, the Board concluded that the Investment Sub-Advisory Agreement with AllianceBernstein<br />
should be continued only until such time as a sub-adviser whose management style more closely fit the Portfolio could be<br />
identified.<br />
Investment Performance. The Directors reviewed the investment performance of each of the Sub-Advised Portfolios over a<br />
variety of time periods. In addition to absolute performance for each Sub-Advised Portfolio for both short and long-term<br />
periods, the Directors considered (i) a comparison of each Sub-Advised Portfolio's one-, three- and five-year (as applicable)<br />
performance to the returns of appropriate peer groups created by an independent research firm, certain benchmarks and indices,<br />
and to the performance averages of each Sub-Advised Portfolio's respective Morningstar and Lipper categories for the same<br />
periods, (ii) the Morningstar overall star rating for each Portfolio, if available, and (iii) the Morningstar and the Lipper rankings<br />
for the one-, three- and five-year (as applicable) periods. The Directors evaluated each Sub-Advised Portfolio's performance<br />
against these peer groups and industry benchmarks and indices, and viewed this information as providing an objective<br />
comparative benchmark against which they could assess the performance of the Sub-Advised Portfolios. The Directors noted<br />
in particular the consistently strong investment results of the Focused Appreciation Portfolio. The Directors also considered<br />
the performance of accounts managed in a similar manner by each of the Sub-Advisers and information from the Sub-Advisers<br />
regarding any significant differences in the performance of those accounts from that of the Sub-Advised Portfolios. In<br />
connection with their evaluation of the performance of the Sub-Advised Portfolios, the Directors also took into consideration<br />
the risk profile for each Sub-Advised Portfolio over the short and long term relative to its performance. In addition to<br />
performance information presented at the meeting, the Directors considered the detailed performance information, market<br />
commentary, portfolio analysis and portfolio manager presentations they received periodically throughout the year. Generally<br />
speaking, while attentive to short term performance and what trends it might indicate, the Directors provided greater weight to<br />
longer term performance.<br />
With respect to the relative performance of the Inflation Protection Portfolio, the Directors considered ACI’s explanation for<br />
the slight underperformance. In particular, the Directors considered the impact on the performance of the Inflation Protection<br />
Portfolio of Internal Revenue Code provisions governing insurance products that limited the Portfolio’s allocation to noninflation<br />
linked securities. The Directors also considered the explanations of T. Rowe Price and PIMCO for the recent<br />
performance of the Small Cap Value Portfolio and the Long-Term U.S. Government Bond Portfolio. For the reasons and based<br />
on the discussion summarized above, the Board concluded that, on balance, it was satisfied with the relative investment<br />
performance of the Sub-Advised Portfolios.<br />
Management Fees and Other Expenses. In evaluating the management fees and total expenses paid by the Sub-Advised<br />
Portfolios, the Directors considered the actual and contractual fees paid by each Sub-Advised Portfolio. The Directors also<br />
considered the sub-advisory fees, which fees are paid by Mason Street Advisers out of its management fee, including a<br />
comparison of those fees with fees charged by certain of the Sub-Advisers for similarly managed accounts. The Directors also<br />
considered a comparison of the actual and contractual management fees of the Sub-Advised Portfolios and those of an<br />
independently selected peer group of mutual funds for each of the Sub-Advised Portfolios. The Directors considered the<br />
comparative data as a tool to help assess the reasonableness of each Sub-Advised Portfolio's advisory fee, though they noted<br />
that it was difficult to make precise comparisons with other funds because the exact nature of services provided to peer funds is<br />
often not apparent. The Directors considered that the fee schedules for certain of the Sub-Advised Portfolios contained<br />
Approval and Continuance of Investment Sub-Advisory Agreements 237
Approval and Continuance of Investment<br />
Sub-Advisory Agreements<br />
breakpoints, and that the fee schedules and breakpoints evidenced an appropriate sharing of economies of scale between the<br />
each Sub-Advised Portfolio and Mason Street Advisors. In considering the level of management fees, the Directors also<br />
considered the size of the Sub-Advised Portfolios, the increase in management, compliance and related costs, expenses<br />
assumed by Mason Street Advisors, and the existing expense cap arrangements agreed to by Mason Street Advisors with<br />
respect to the Sub-Advised Portfolios.<br />
The Directors also considered the total operating expenses of each of the Sub-Advised Portfolios and compared those expenses<br />
with those of each Sub-Advised Portfolio's respective peer group. The Directors noted that four of the Sub-Advised Portfolios<br />
were in the top two Lipper quintiles (meaning lowest expenses) of their respective peer groups, two were in the third quintile,<br />
one was in the fourth quintile and one was in the fifth quintile, with respect to total net operating expenses. With respect to the<br />
two Portfolios in the fourth and fifth quintiles, the Directors considered the nature of the expenses that had contributed to the<br />
higher total net operating expenses and noted that expense cap agreements were in place with respect to each such Portfolio.<br />
Based on their review of the above information and other factors deemed relevant by the Directors, the Directors concluded<br />
that the management fees and total expenses of each of the Sub-Advised Portfolios were reasonable in relation to the nature,<br />
scope and quality of services provided and the performance of the Sub-Advised Portfolios over time.<br />
Costs and Profitability. The Directors also considered the profitability information related to certain of the Sub-Advised<br />
Portfolios where such information had been provided and the financial statements of certain Sub-Advisers or their affiliates<br />
who had not provided specific profitability information. The Directors also considered the profitability of Mason Street<br />
Advisors. In cases where profitability information had not been provided, the Directors noted that the sub-advisory fees were<br />
the result of arm's-length negotiations between Mason Street Advisors and such Sub-Advisers. The Directors also recognized<br />
that there are limitations inherent in allocating costs and calculating profitability for organizations such as the Sub-Advisers,<br />
and that it is difficult to make comparisons of profitability among investment advisers because comparative information is not<br />
generally publicly available and, when available, such information had been developed using a variety of assumptions and<br />
other factors. In connection with their review, the Directors were presented with information concerning the Sub-Advisers’<br />
soft dollar arrangements, including the Sub-Advisers’ policies for allocating brokerage for brokerage and research services and<br />
any other benefits to the Sub-Advisers arising from the Sub-Advised Portfolios. Based on their review, the Directors<br />
concluded that they were satisfied that the fees paid by each of the Sub-Advised Portfolios was not excessive.<br />
Other Information<br />
The Directors were presented with other information intended to assist them in their consideration of the approval of the New<br />
Sub-Advisory Agreement and the continuation of the Existing Sub-Advisory Agreements, including information about the<br />
services provided by affiliates of Mason Street Advisors, pending or recent litigation or regulatory actions to which a Sub-<br />
Adviser or its affiliates may have been a party, and the applicable Sub-Adviser's responses to those actions, reports from<br />
Mason Street Advisors on its review of the respective compliance programs of the Sub-Advisers, the inclusion of certain Sub-<br />
Advisers in various distribution programs of affiliates of Mason Street Advisors, and information regarding portfolio turnover,<br />
business continuity, codes of ethics, and business structure and history.<br />
Conclusions of the Directors<br />
Based on a consideration of all information they deemed relevant in its totality, the Board, including the Independent Directors,<br />
and assisted by the advice of legal counsel independent of Mason Street Advisors, in the exercise of its business judgment<br />
concluded that it was in the best interests of each Portfolio to approve the New Sub-Advisory Agreement between Mason<br />
Street Advisors and ACI and the continuation of each of the Existing Sub-Advisory Agreements between Mason Street<br />
Advisors and the Sub-Advisers.<br />
238 Approval and Continuance of Investment Sub-Advisory Agreements
VIP Mid Cap Initial Class<br />
S&P MidCap 400 Index<br />
$28,122<br />
$15,471<br />
$
VIP Mid Cap Initial Class<br />
S&P MidCap 400 Index<br />
$28,122<br />
$15,471<br />
$
VIP Mid Cap Initial Class<br />
S&P MidCap 400 Index<br />
$28,122<br />
$15,471<br />
$
VIP Mid Cap Initial Class<br />
S&P MidCap 400 Index<br />
$28,122<br />
$15,471<br />
$
VIP Mid Cap Initial Class<br />
S&P MidCap 400 Index<br />
$28,122<br />
$15,471<br />
$
VIP Mid Cap Initial Class<br />
S&P MidCap 400 Index<br />
$28,122<br />
$15,471<br />
$
VIP Mid Cap Initial Class<br />
S&P MidCap 400 Index<br />
$28,122<br />
$15,471<br />
$
VIP Mid Cap Initial Class<br />
S&P MidCap 400 Index<br />
$28,122<br />
$15,471<br />
$
VIP Mid Cap Initial Class<br />
S&P MidCap 400 Index<br />
$28,122<br />
$15,471<br />
$
VIP Mid Cap Initial Class<br />
S&P MidCap 400 Index<br />
$28,122<br />
$15,471<br />
$
VIP Mid Cap Initial Class<br />
S&P MidCap 400 Index<br />
$28,122<br />
$15,471<br />
$
VIP Mid Cap Initial Class<br />
S&P MidCap 400 Index<br />
$28,122<br />
$15,471<br />
$
VIP Mid Cap Initial Class<br />
S&P MidCap 400 Index<br />
$28,122<br />
$15,471<br />
$
VIP Mid Cap Initial Class<br />
S&P MidCap 400 Index<br />
$28,122<br />
$15,471<br />
$
VIP Mid Cap Initial Class<br />
S&P MidCap 400 Index<br />
$28,122<br />
$15,471<br />
$
VIP Mid Cap Initial Class<br />
S&P MidCap 400 Index<br />
$28,122<br />
$15,471<br />
$
VIP Mid Cap Initial Class<br />
S&P MidCap 400 Index<br />
$28,122<br />
$15,471<br />
$
VIP Mid Cap Initial Class<br />
S&P MidCap 400 Index<br />
$28,122<br />
$15,471<br />
$
VIP Mid Cap Initial Class<br />
S&P MidCap 400 Index<br />
$28,122<br />
$15,471<br />
$
VIP Mid Cap Initial Class<br />
S&P MidCap 400 Index<br />
$28,122<br />
$15,471<br />
$
VIP Mid Cap Initial Class<br />
S&P MidCap 400 Index<br />
$28,122<br />
$15,471<br />
$
VIP Mid Cap Initial Class<br />
S&P MidCap 400 Index<br />
$28,122<br />
$15,471<br />
$
VIP Mid Cap Initial Class<br />
S&P MidCap 400 Index<br />
$28,122<br />
$15,471<br />
$
VIP Mid Cap Initial Class<br />
S&P MidCap 400 Index<br />
$28,122<br />
$15,471<br />
$
VIP Mid Cap Initial Class<br />
S&P MidCap 400 Index<br />
$28,122<br />
$15,471<br />
$
VIP Mid Cap Initial Class<br />
S&P MidCap 400 Index<br />
$28,122<br />
$15,471<br />
$
ÁÁÁÁÁÁÁÁÁÁÁÁÁÁÁÁÁÁÁÁÁÁÁÁÁÁÁÁÁÁÁÁÁÁÁÁÁ<br />
ÁÁÁÁÁÁÁÁÁÁÁÁÁÁÁÁÁÁÁÁÁÁÁÁÁÁÁÁÁÁÁÁÁ<br />
ÁÁÁÁÁ<br />
<br />
<br />
ÁÁÁÁÁÁÁÁÁÁÁÁÁÁÁÁÁÁÁÁÁÁÁÁÁÁÁÁÁÁÁÁÁÁÁÁÁ<br />
ÁÁÁÁÁÁÁÁÁÁÁÁÁÁÁÁÁÁÁÁÁÁÁÁÁÁÁÁÁÁÁÁÁ<br />
ÁÁÁÁÁ<br />
ÁÁÁÁÁÁÁÁÁÁÁÁÁÁÁÁÁÁÁÁÁÁÁÁÁÁÁÁÁÁÁÁÁ<br />
ÁÁÁÁÁ<br />
<br />
<br />
<br />
<br />
<br />
<br />
<br />
<br />
<br />
<br />
<br />
<br />
<br />
<br />
<br />
<br />
ÁÁÁÁÁÁÁÁÁÁÁÁÁÁÁÁÁÁÁÁÁÁÁÁÁÁÁÁÁÁÁÁÁÁÁÁÁ<br />
ÁÁÁÁÁÁÁÁÁÁÁÁÁÁÁÁÁÁÁÁÁÁÁÁÁÁÁÁÁÁÁÁÁ<br />
ÁÁÁÁÁ<br />
ÁÁÁÁÁÁÁÁÁÁÁÁÁÁÁÁÁÁÁÁÁÁÁÁÁÁÁÁÁÁÁÁÁÁÁÁÁ<br />
ÁÁÁÁÁÁÁÁÁÁÁÁÁÁÁÁÁÁÁÁÁÁÁÁÁÁÁÁÁÁÁÁÁ<br />
ÁÁÁÁÁ<br />
<br />
<br />
<br />
<br />
<br />
<br />
<br />
<br />
<br />
<br />
ÁÁÁÁÁÁÁÁÁÁÁÁÁÁÁÁÁÁÁÁÁÁÁÁÁÁÁÁÁÁÁÁÁÁÁÁÁ<br />
ÁÁÁÁÁÁÁÁÁÁÁÁÁÁÁÁÁÁÁÁÁÁÁÁÁÁÁÁÁÁÁÁÁ<br />
ÁÁÁÁÁ<br />
ÁÁÁÁÁÁÁÁÁÁÁÁÁÁÁÁÁÁÁÁÁÁÁÁÁÁÁÁÁÁÁÁÁÁÁÁÁ<br />
ÁÁÁÁÁÁÁÁÁÁÁÁÁÁÁÁÁÁÁÁÁÁÁÁÁÁÁÁÁÁÁÁÁ<br />
ÁÁÁÁÁ<br />
ÁÁÁÁÁÁÁÁÁÁÁÁÁÁÁÁÁÁÁÁÁÁÁÁÁÁÁÁÁÁÁÁÁÁÁÁÁ<br />
ÁÁÁÁÁÁÁÁÁÁÁÁÁÁÁÁÁÁÁÁÁÁÁÁÁÁÁÁÁÁÁÁÁ<br />
ÁÁÁÁÁ<br />
ÁÁÁÁÁÁÁÁÁÁÁÁÁÁÁÁÁÁÁÁÁÁÁÁÁÁÁÁÁÁÁÁÁÁÁÁÁ<br />
ÁÁÁÁÁÁÁÁÁÁÁÁÁÁÁÁÁÁÁÁÁÁÁÁÁÁÁÁÁÁÁÁÁ<br />
ÁÁÁÁÁ<br />
<br />
<br />
<br />
<br />
<br />
ÁÁÁÁÁÁÁÁÁÁÁÁÁÁÁÁÁÁÁÁÁÁÁÁÁÁÁÁÁÁÁÁÁ<br />
ÁÁÁÁÁ
ÁÁÁÁÁÁÁÁÁÁÁÁÁÁÁÁÁÁÁÁÁÁÁÁÁÁÁÁÁÁÁÁÁÁÁÁÁ<br />
ÁÁÁÁÁÁÁÁÁÁÁÁÁÁÁÁÁÁÁÁÁÁÁÁÁÁÁÁÁÁÁÁÁ<br />
ÁÁÁÁÁ<br />
ÁÁÁÁÁÁÁÁÁÁÁÁÁÁÁÁÁÁÁÁÁÁÁÁÁÁÁÁÁÁÁÁÁÁÁÁÁ<br />
ÁÁÁÁÁÁÁÁÁÁÁÁÁÁÁÁÁÁÁÁÁÁÁÁÁÁÁÁÁÁÁÁÁ<br />
ÁÁÁÁÁ<br />
<br />
<br />
<br />
<br />
<br />
ÁÁÁÁÁÁÁÁÁÁÁÁÁÁÁÁÁÁÁÁÁÁÁÁÁÁÁÁÁÁÁÁÁÁÁÁÁ<br />
ÁÁÁÁÁÁÁÁÁÁÁÁÁÁÁÁÁÁÁÁÁÁÁÁÁÁÁÁÁÁÁÁÁ<br />
ÁÁÁÁÁ<br />
ÁÁÁÁÁÁÁÁÁÁÁÁÁÁÁÁÁÁÁÁÁÁÁÁÁÁÁÁÁÁÁÁÁÁÁÁÁ<br />
ÁÁÁÁÁÁÁÁÁÁÁÁÁÁÁÁÁÁÁÁÁÁÁÁÁÁÁÁÁÁÁÁÁ<br />
ÁÁÁÁÁ<br />
<br />
<br />
<br />
ÁÁÁÁÁÁÁÁÁÁÁÁÁÁÁÁÁÁÁÁÁÁÁÁÁÁÁÁÁÁÁÁÁÁÁÁÁ<br />
ÁÁÁÁÁÁÁÁÁÁÁÁÁÁÁÁÁÁÁÁÁÁÁÁÁÁÁÁÁÁÁÁÁ<br />
ÁÁÁÁÁ<br />
ÁÁÁÁÁÁÁÁÁÁÁÁÁÁÁÁÁÁÁÁÁÁÁÁÁÁÁÁÁÁÁÁÁ<br />
ÁÁÁÁÁ<br />
<br />
<br />
<br />
<br />
<br />
<br />
ÁÁÁÁÁÁÁÁÁÁÁÁÁÁÁÁÁÁÁÁÁÁÁÁÁÁÁÁÁÁÁÁÁÁÁÁÁ<br />
ÁÁÁÁÁÁÁÁÁÁÁÁÁÁÁÁÁÁÁÁÁÁÁÁÁÁÁÁÁÁÁÁÁ<br />
ÁÁÁÁÁ<br />
<br />
<br />
ÁÁÁÁÁÁÁÁÁÁÁÁÁÁÁÁÁÁÁÁÁÁÁÁÁÁÁÁÁÁÁÁÁÁÁÁÁ<br />
ÁÁÁÁÁÁÁÁÁÁÁÁÁÁÁÁÁÁÁÁÁÁÁÁÁÁÁÁÁÁÁÁÁ<br />
ÁÁÁÁÁ<br />
<br />
<br />
<br />
ÁÁÁÁÁÁÁÁÁÁÁÁÁÁÁÁÁÁÁÁÁÁÁÁÁÁÁÁÁÁÁÁÁÁÁÁÁ<br />
ÁÁÁÁÁÁÁÁÁÁÁÁÁÁÁÁÁÁÁÁÁÁÁÁÁÁÁÁÁÁÁÁÁ<br />
ÁÁÁÁÁ<br />
<br />
<br />
ÁÁÁÁÁÁÁÁÁÁÁÁÁÁÁÁÁÁÁÁÁÁÁÁÁÁÁÁÁÁÁÁÁÁÁÁÁ<br />
ÁÁÁÁÁÁÁÁÁÁÁÁÁÁÁÁÁÁÁÁÁÁÁÁÁÁÁÁÁÁÁÁÁ<br />
ÁÁÁÁÁ<br />
<br />
<br />
<br />
<br />
<br />
ÁÁÁÁÁÁÁÁÁÁÁÁÁÁÁÁÁÁÁÁÁÁÁÁÁÁÁÁÁÁÁÁÁÁÁÁÁ<br />
ÁÁÁÁÁÁÁÁÁÁÁÁÁÁÁÁÁÁÁÁÁÁÁÁÁÁÁÁÁÁÁÁÁ<br />
ÁÁÁÁÁ<br />
ÁÁÁÁÁÁÁÁÁÁÁÁÁÁÁÁÁÁÁÁÁÁÁÁÁÁÁÁÁÁÁÁÁÁÁÁÁ<br />
ÁÁÁÁÁÁÁÁÁÁÁÁÁÁÁÁÁÁÁÁÁÁÁÁÁÁÁÁÁÁÁÁÁ<br />
ÁÁÁÁÁ<br />
<br />
<br />
<br />
<br />
<br />
ÁÁÁÁÁÁÁÁÁÁÁÁÁÁÁÁÁÁÁÁÁÁÁÁÁÁÁÁÁÁÁÁÁÁÁÁÁ<br />
ÁÁÁÁÁÁÁÁÁÁÁÁÁÁÁÁÁÁÁÁÁÁÁÁÁÁÁÁÁÁÁÁÁ<br />
ÁÁÁÁÁ<br />
ÁÁÁÁÁÁÁÁÁÁÁÁÁÁÁÁÁÁÁÁÁÁÁÁÁÁÁÁÁÁÁÁÁÁÁÁÁ<br />
ÁÁÁÁÁÁÁÁÁÁÁÁÁÁÁÁÁÁÁÁÁÁÁÁÁÁÁÁÁÁÁÁÁ<br />
ÁÁÁÁÁ<br />
ÁÁÁÁÁÁÁÁÁÁÁÁÁÁÁÁÁÁÁÁÁÁÁÁÁÁÁÁÁÁÁÁÁ<br />
ÁÁÁÁÁ<br />
<br />
ÁÁÁÁÁÁÁÁÁÁÁÁÁÁÁÁÁÁÁÁÁÁÁÁÁÁÁÁÁÁÁÁÁ<br />
ÁÁÁÁÁ<br />
ÁÁÁÁÁÁÁÁÁÁÁÁÁÁÁÁÁÁÁÁÁÁÁÁÁÁÁÁÁÁÁÁÁ<br />
ÁÁÁÁÁ
ÁÁÁÁÁÁÁÁÁÁÁÁÁÁÁÁÁÁÁÁÁÁÁÁÁÁÁÁÁÁÁÁÁÁÁÁÁ<br />
ÁÁÁÁÁÁÁÁÁÁÁÁÁÁÁÁÁÁÁÁÁÁÁÁÁÁÁÁÁÁÁÁÁ<br />
ÁÁÁÁÁ<br />
ÁÁÁÁÁÁÁÁÁÁÁÁÁÁÁÁÁÁÁÁÁÁÁÁÁÁÁÁÁÁÁÁÁÁÁÁÁ<br />
ÁÁÁÁÁÁÁÁÁÁÁÁÁÁÁÁÁÁÁÁÁÁÁÁÁÁÁÁÁÁÁÁÁ<br />
ÁÁÁÁÁ<br />
<br />
<br />
<br />
<br />
ÁÁÁÁÁÁÁÁÁÁÁÁÁÁÁÁÁÁÁÁÁÁÁÁÁÁÁÁÁÁÁÁÁÁÁÁÁ<br />
ÁÁÁÁÁÁÁÁÁÁÁÁÁÁÁÁÁÁÁÁÁÁÁÁÁÁÁÁÁÁÁÁÁ<br />
ÁÁÁÁÁ<br />
ÁÁÁÁÁÁÁÁÁÁÁÁÁÁÁÁÁÁÁÁÁÁÁÁÁÁÁÁÁÁÁÁÁÁÁÁÁ<br />
ÁÁÁÁÁÁÁÁÁÁÁÁÁÁÁÁÁÁÁÁÁÁÁÁÁÁÁÁÁÁÁÁÁ<br />
ÁÁÁÁÁ<br />
ÁÁÁÁÁÁÁÁÁÁÁÁÁÁÁÁÁÁÁÁÁÁÁÁÁÁÁÁÁÁÁÁÁ<br />
ÁÁÁÁÁ<br />
<br />
<br />
<br />
<br />
<br />
<br />
ÁÁÁÁÁÁÁÁÁÁÁÁÁÁÁÁÁÁÁÁÁÁÁÁÁÁÁÁÁÁÁÁÁÁÁÁÁ<br />
ÁÁÁÁÁÁÁÁÁÁÁÁÁÁÁÁÁÁÁÁÁÁÁÁÁÁÁÁÁÁÁÁÁ<br />
ÁÁÁÁÁ<br />
ÁÁÁÁÁÁÁÁÁÁÁÁÁÁÁÁÁÁÁÁÁÁÁÁÁÁÁÁÁÁÁÁÁÁÁÁÁ<br />
ÁÁÁÁÁÁÁÁÁÁÁÁÁÁÁÁÁÁÁÁÁÁÁÁÁÁÁÁÁÁÁÁÁ<br />
ÁÁÁÁÁ<br />
<br />
<br />
<br />
<br />
<br />
ÁÁÁÁÁÁÁÁÁÁÁÁÁÁÁÁÁÁÁÁÁÁÁÁÁÁÁÁÁÁÁÁÁ<br />
ÁÁÁÁÁ<br />
ÁÁÁÁÁÁÁÁÁÁÁÁÁÁÁÁÁÁÁÁÁÁÁÁÁÁÁÁÁÁÁÁÁ<br />
ÁÁÁÁÁ<br />
<br />
<br />
ÁÁÁÁÁÁÁÁÁÁÁÁÁÁÁÁÁÁÁÁÁÁÁÁÁÁÁÁÁÁÁÁÁÁÁÁÁ<br />
ÁÁÁÁÁÁÁÁÁÁÁÁÁÁÁÁÁÁÁÁÁÁÁÁÁÁÁÁÁÁÁÁÁ<br />
ÁÁÁÁÁ<br />
<br />
<br />
<br />
ÁÁÁÁÁÁÁÁÁÁÁÁÁÁÁÁÁÁÁÁÁÁÁÁÁÁÁÁÁÁÁÁÁÁÁÁÁ<br />
ÁÁÁÁÁÁÁÁÁÁÁÁÁÁÁÁÁÁÁÁÁÁÁÁÁÁÁÁÁÁÁÁÁ<br />
ÁÁÁÁÁ<br />
<br />
<br />
ÁÁÁÁÁÁÁÁÁÁÁÁÁÁÁÁÁÁÁÁÁÁÁÁÁÁÁÁÁÁÁÁÁÁÁÁÁ<br />
ÁÁÁÁÁÁÁÁÁÁÁÁÁÁÁÁÁÁÁÁÁÁÁÁÁÁÁÁÁÁÁÁÁ<br />
ÁÁÁÁÁ<br />
<br />
<br />
<br />
ÁÁÁÁÁÁÁÁÁÁÁÁÁÁÁÁÁÁÁÁÁÁÁÁÁÁÁÁÁÁÁÁÁÁÁÁÁ<br />
ÁÁÁÁÁÁÁÁÁÁÁÁÁÁÁÁÁÁÁÁÁÁÁÁÁÁÁÁÁÁÁÁÁ<br />
ÁÁÁÁÁ<br />
ÁÁÁÁÁÁÁÁÁÁÁÁÁÁÁÁÁÁÁÁÁÁÁÁÁÁÁÁÁÁÁÁÁÁÁÁÁ<br />
ÁÁÁÁÁÁÁÁÁÁÁÁÁÁÁÁÁÁÁÁÁÁÁÁÁÁÁÁÁÁÁÁÁ<br />
ÁÁÁÁÁ<br />
<br />
<br />
ÁÁÁÁÁÁÁÁÁÁÁÁÁÁÁÁÁÁÁÁÁÁÁÁÁÁÁÁÁÁÁÁÁ<br />
ÁÁÁÁÁ
VIP Contrafund Initial Class S&P 500<br />
$12,092<br />
$<br />
$8,700
VIP Contrafund Initial Class S&P 500<br />
$12,092<br />
$<br />
$8,700
VIP Contrafund Initial Class S&P 500<br />
$12,092<br />
$<br />
$8,700
VIP Contrafund Initial Class S&P 500<br />
$12,092<br />
$<br />
$8,700
VIP Contrafund Initial Class S&P 500<br />
$12,092<br />
$<br />
$8,700
VIP Contrafund Initial Class S&P 500<br />
$12,092<br />
$<br />
$8,700
VIP Contrafund Initial Class S&P 500<br />
$12,092<br />
$<br />
$8,700
VIP Contrafund Initial Class S&P 500<br />
$12,092<br />
$<br />
$8,700
VIP Contrafund Initial Class S&P 500<br />
$12,092<br />
$<br />
$8,700
VIP Contrafund Initial Class S&P 500<br />
$12,092<br />
$<br />
$8,700
VIP Contrafund Initial Class S&P 500<br />
$12,092<br />
$<br />
$8,700
VIP Contrafund Initial Class S&P 500<br />
$12,092<br />
$<br />
$8,700
VIP Contrafund Initial Class S&P 500<br />
$12,092<br />
$<br />
$8,700
VIP Contrafund Initial Class S&P 500<br />
$12,092<br />
$<br />
$8,700
VIP Contrafund Initial Class S&P 500<br />
$12,092<br />
$<br />
$8,700
VIP Contrafund Initial Class S&P 500<br />
$12,092<br />
$<br />
$8,700
VIP Contrafund Initial Class S&P 500<br />
$12,092<br />
$<br />
$8,700
VIP Contrafund Initial Class S&P 500<br />
$12,092<br />
$<br />
$8,700
VIP Contrafund Initial Class S&P 500<br />
$12,092<br />
$<br />
$8,700
VIP Contrafund Initial Class S&P 500<br />
$12,092<br />
$<br />
$8,700
VIP Contrafund Initial Class S&P 500<br />
$12,092<br />
$<br />
$8,700
VIP Contrafund Initial Class S&P 500<br />
$12,092<br />
$<br />
$8,700
VIP Contrafund Initial Class S&P 500<br />
$12,092<br />
$<br />
$8,700
VIP Contrafund Initial Class S&P 500<br />
$12,092<br />
$<br />
$8,700
VIP Contrafund Initial Class S&P 500<br />
$12,092<br />
$<br />
$8,700
ÁÁÁÁÁÁÁÁÁÁÁÁÁÁÁÁÁÁÁÁÁÁÁÁÁÁÁÁÁÁÁÁÁÁÁÁÁ<br />
ÁÁÁÁÁÁÁÁÁÁÁÁÁÁÁÁÁÁÁÁÁÁÁÁÁÁÁÁÁÁÁÁÁ<br />
ÁÁÁÁÁ<br />
<br />
<br />
ÁÁÁÁÁÁÁÁÁÁÁÁÁÁÁÁÁÁÁÁÁÁÁÁÁÁÁÁÁÁÁÁÁÁÁÁÁ<br />
ÁÁÁÁÁÁÁÁÁÁÁÁÁÁÁÁÁÁÁÁÁÁÁÁÁÁÁÁÁÁÁÁÁ<br />
ÁÁÁÁÁ<br />
ÁÁÁÁÁÁÁÁÁÁÁÁÁÁÁÁÁÁÁÁÁÁÁÁÁÁÁÁÁÁÁÁÁ<br />
ÁÁÁÁÁ<br />
<br />
<br />
<br />
<br />
<br />
<br />
<br />
<br />
<br />
<br />
<br />
<br />
<br />
<br />
<br />
<br />
ÁÁÁÁÁÁÁÁÁÁÁÁÁÁÁÁÁÁÁÁÁÁÁÁÁÁÁÁÁÁÁÁÁÁÁÁÁ<br />
ÁÁÁÁÁÁÁÁÁÁÁÁÁÁÁÁÁÁÁÁÁÁÁÁÁÁÁÁÁÁÁÁÁ<br />
ÁÁÁÁÁ<br />
ÁÁÁÁÁÁÁÁÁÁÁÁÁÁÁÁÁÁÁÁÁÁÁÁÁÁÁÁÁÁÁÁÁÁÁÁÁ<br />
ÁÁÁÁÁÁÁÁÁÁÁÁÁÁÁÁÁÁÁÁÁÁÁÁÁÁÁÁÁÁÁÁÁ<br />
ÁÁÁÁÁ<br />
<br />
<br />
<br />
<br />
<br />
<br />
<br />
<br />
<br />
<br />
ÁÁÁÁÁÁÁÁÁÁÁÁÁÁÁÁÁÁÁÁÁÁÁÁÁÁÁÁÁÁÁÁÁÁÁÁÁ<br />
ÁÁÁÁÁÁÁÁÁÁÁÁÁÁÁÁÁÁÁÁÁÁÁÁÁÁÁÁÁÁÁÁÁ<br />
ÁÁÁÁÁ<br />
ÁÁÁÁÁÁÁÁÁÁÁÁÁÁÁÁÁÁÁÁÁÁÁÁÁÁÁÁÁÁÁÁÁÁÁÁÁ<br />
ÁÁÁÁÁÁÁÁÁÁÁÁÁÁÁÁÁÁÁÁÁÁÁÁÁÁÁÁÁÁÁÁÁ<br />
ÁÁÁÁÁ<br />
ÁÁÁÁÁÁÁÁÁÁÁÁÁÁÁÁÁÁÁÁÁÁÁÁÁÁÁÁÁÁÁÁÁÁÁÁÁ<br />
ÁÁÁÁÁÁÁÁÁÁÁÁÁÁÁÁÁÁÁÁÁÁÁÁÁÁÁÁÁÁÁÁÁ<br />
ÁÁÁÁÁ<br />
ÁÁÁÁÁÁÁÁÁÁÁÁÁÁÁÁÁÁÁÁÁÁÁÁÁÁÁÁÁÁÁÁÁÁÁÁÁ<br />
ÁÁÁÁÁÁÁÁÁÁÁÁÁÁÁÁÁÁÁÁÁÁÁÁÁÁÁÁÁÁÁÁÁ<br />
ÁÁÁÁÁ<br />
<br />
<br />
<br />
<br />
<br />
ÁÁÁÁÁÁÁÁÁÁÁÁÁÁÁÁÁÁÁÁÁÁÁÁÁÁÁÁÁÁÁÁÁ<br />
ÁÁÁÁÁ
ÁÁÁÁÁÁÁÁÁÁÁÁÁÁÁÁÁÁÁÁÁÁÁÁÁÁÁÁÁÁÁÁÁÁÁÁÁ<br />
ÁÁÁÁÁÁÁÁÁÁÁÁÁÁÁÁÁÁÁÁÁÁÁÁÁÁÁÁÁÁÁÁÁ<br />
ÁÁÁÁÁ<br />
ÁÁÁÁÁÁÁÁÁÁÁÁÁÁÁÁÁÁÁÁÁÁÁÁÁÁÁÁÁÁÁÁÁÁÁÁÁ<br />
ÁÁÁÁÁÁÁÁÁÁÁÁÁÁÁÁÁÁÁÁÁÁÁÁÁÁÁÁÁÁÁÁÁ<br />
ÁÁÁÁÁ<br />
<br />
<br />
<br />
<br />
<br />
ÁÁÁÁÁÁÁÁÁÁÁÁÁÁÁÁÁÁÁÁÁÁÁÁÁÁÁÁÁÁÁÁÁÁÁÁÁ<br />
ÁÁÁÁÁÁÁÁÁÁÁÁÁÁÁÁÁÁÁÁÁÁÁÁÁÁÁÁÁÁÁÁÁ<br />
ÁÁÁÁÁ<br />
ÁÁÁÁÁÁÁÁÁÁÁÁÁÁÁÁÁÁÁÁÁÁÁÁÁÁÁÁÁÁÁÁÁÁÁÁÁ<br />
ÁÁÁÁÁÁÁÁÁÁÁÁÁÁÁÁÁÁÁÁÁÁÁÁÁÁÁÁÁÁÁÁÁ<br />
ÁÁÁÁÁ<br />
<br />
<br />
<br />
<br />
ÁÁÁÁÁÁÁÁÁÁÁÁÁÁÁÁÁÁÁÁÁÁÁÁÁÁÁÁÁÁÁÁÁÁÁÁÁ<br />
ÁÁÁÁÁÁÁÁÁÁÁÁÁÁÁÁÁÁÁÁÁÁÁÁÁÁÁÁÁÁÁÁÁ<br />
ÁÁÁÁÁ<br />
<br />
<br />
<br />
ÁÁÁÁÁÁÁÁÁÁÁÁÁÁÁÁÁÁÁÁÁÁÁÁÁÁÁÁÁÁÁÁÁÁÁÁÁ<br />
ÁÁÁÁÁÁÁÁÁÁÁÁÁÁÁÁÁÁÁÁÁÁÁÁÁÁÁÁÁÁÁÁÁ<br />
ÁÁÁÁÁ<br />
<br />
<br />
ÁÁÁÁÁÁÁÁÁÁÁÁÁÁÁÁÁÁÁÁÁÁÁÁÁÁÁÁÁÁÁÁÁÁÁÁÁ<br />
ÁÁÁÁÁÁÁÁÁÁÁÁÁÁÁÁÁÁÁÁÁÁÁÁÁÁÁÁÁÁÁÁÁ<br />
ÁÁÁÁÁ<br />
<br />
<br />
<br />
ÁÁÁÁÁÁÁÁÁÁÁÁÁÁÁÁÁÁÁÁÁÁÁÁÁÁÁÁÁÁÁÁÁ<br />
ÁÁÁÁÁ<br />
ÁÁÁÁÁÁÁÁÁÁÁÁÁÁÁÁÁÁÁÁÁÁÁÁÁÁÁÁÁÁÁÁÁ<br />
ÁÁÁÁÁ<br />
<br />
<br />
<br />
<br />
ÁÁÁÁÁÁÁÁÁÁÁÁÁÁÁÁÁÁÁÁÁÁÁÁÁÁÁÁÁÁÁÁÁÁÁÁÁ<br />
ÁÁÁÁÁÁÁÁÁÁÁÁÁÁÁÁÁÁÁÁÁÁÁÁÁÁÁÁÁÁÁÁÁ<br />
ÁÁÁÁÁ<br />
ÁÁÁÁÁÁÁÁÁÁÁÁÁÁÁÁÁÁÁÁÁÁÁÁÁÁÁÁÁÁÁÁÁÁÁÁÁ<br />
ÁÁÁÁÁÁÁÁÁÁÁÁÁÁÁÁÁÁÁÁÁÁÁÁÁÁÁÁÁÁÁÁÁ<br />
ÁÁÁÁÁ<br />
<br />
<br />
<br />
<br />
<br />
ÁÁÁÁÁÁÁÁÁÁÁÁÁÁÁÁÁÁÁÁÁÁÁÁÁÁÁÁÁÁÁÁÁÁÁÁÁ<br />
ÁÁÁÁÁÁÁÁÁÁÁÁÁÁÁÁÁÁÁÁÁÁÁÁÁÁÁÁÁÁÁÁÁ<br />
ÁÁÁÁÁ<br />
ÁÁÁÁÁÁÁÁÁÁÁÁÁÁÁÁÁÁÁÁÁÁÁÁÁÁÁÁÁÁÁÁÁÁÁÁÁ<br />
ÁÁÁÁÁÁÁÁÁÁÁÁÁÁÁÁÁÁÁÁÁÁÁÁÁÁÁÁÁÁÁÁÁ<br />
ÁÁÁÁÁ<br />
<br />
<br />
<br />
<br />
<br />
ÁÁÁÁÁÁÁÁÁÁÁÁÁÁÁÁÁÁÁÁÁÁÁÁÁÁÁÁÁÁÁÁÁÁÁÁÁ<br />
ÁÁÁÁÁÁÁÁÁÁÁÁÁÁÁÁÁÁÁÁÁÁÁÁÁÁÁÁÁÁÁÁÁ<br />
ÁÁÁÁÁ<br />
ÁÁÁÁÁÁÁÁÁÁÁÁÁÁÁÁÁÁÁÁÁÁÁÁÁÁÁÁÁÁÁÁÁÁÁÁÁ<br />
ÁÁÁÁÁÁÁÁÁÁÁÁÁÁÁÁÁÁÁÁÁÁÁÁÁÁÁÁÁÁÁÁÁ<br />
ÁÁÁÁÁ<br />
<br />
<br />
<br />
ÁÁÁÁÁÁÁÁÁÁÁÁÁÁÁÁÁÁÁÁÁÁÁÁÁÁÁÁÁÁÁÁÁÁÁÁÁ<br />
ÁÁÁÁÁÁÁÁÁÁÁÁÁÁÁÁÁÁÁÁÁÁÁÁÁÁÁÁÁÁÁÁÁ<br />
ÁÁÁÁÁ<br />
<br />
<br />
<br />
ÁÁÁÁÁÁÁÁÁÁÁÁÁÁÁÁÁÁÁÁÁÁÁÁÁÁÁÁÁÁÁÁÁ<br />
ÁÁÁÁÁ<br />
ÁÁÁÁÁÁÁÁÁÁÁÁÁÁÁÁÁÁÁÁÁÁÁÁÁÁÁÁÁÁÁÁÁ<br />
ÁÁÁÁÁ<br />
<br />
<br />
ÁÁÁÁÁÁÁÁÁÁÁÁÁÁÁÁÁÁÁÁÁÁÁÁÁÁÁÁÁÁÁÁÁ<br />
ÁÁÁÁÁ
ÁÁÁÁÁÁÁÁÁÁÁÁÁÁÁÁÁÁÁÁÁÁÁÁÁÁÁÁÁÁÁÁÁÁÁÁÁ<br />
ÁÁÁÁÁÁÁÁÁÁÁÁÁÁÁÁÁÁÁÁÁÁÁÁÁÁÁÁÁÁÁÁÁ<br />
ÁÁÁÁÁ<br />
ÁÁÁÁÁÁÁÁÁÁÁÁÁÁÁÁÁÁÁÁÁÁÁÁÁÁÁÁÁÁÁÁÁÁÁÁÁ<br />
ÁÁÁÁÁÁÁÁÁÁÁÁÁÁÁÁÁÁÁÁÁÁÁÁÁÁÁÁÁÁÁÁÁ<br />
ÁÁÁÁÁ<br />
<br />
<br />
<br />
<br />
ÁÁÁÁÁÁÁÁÁÁÁÁÁÁÁÁÁÁÁÁÁÁÁÁÁÁÁÁÁÁÁÁÁÁÁÁÁ<br />
ÁÁÁÁÁÁÁÁÁÁÁÁÁÁÁÁÁÁÁÁÁÁÁÁÁÁÁÁÁÁÁÁÁ<br />
ÁÁÁÁÁ<br />
ÁÁÁÁÁÁÁÁÁÁÁÁÁÁÁÁÁÁÁÁÁÁÁÁÁÁÁÁÁÁÁÁÁÁÁÁÁ<br />
ÁÁÁÁÁÁÁÁÁÁÁÁÁÁÁÁÁÁÁÁÁÁÁÁÁÁÁÁÁÁÁÁÁ<br />
ÁÁÁÁÁ<br />
ÁÁÁÁÁÁÁÁÁÁÁÁÁÁÁÁÁÁÁÁÁÁÁÁÁÁÁÁÁÁÁÁÁ<br />
ÁÁÁÁÁ<br />
<br />
<br />
<br />
<br />
<br />
<br />
ÁÁÁÁÁÁÁÁÁÁÁÁÁÁÁÁÁÁÁÁÁÁÁÁÁÁÁÁÁÁÁÁÁÁÁÁÁ<br />
ÁÁÁÁÁÁÁÁÁÁÁÁÁÁÁÁÁÁÁÁÁÁÁÁÁÁÁÁÁÁÁÁÁ<br />
ÁÁÁÁÁ<br />
ÁÁÁÁÁÁÁÁÁÁÁÁÁÁÁÁÁÁÁÁÁÁÁÁÁÁÁÁÁÁÁÁÁÁÁÁÁ<br />
ÁÁÁÁÁÁÁÁÁÁÁÁÁÁÁÁÁÁÁÁÁÁÁÁÁÁÁÁÁÁÁÁÁ<br />
ÁÁÁÁÁ<br />
<br />
<br />
<br />
<br />
<br />
ÁÁÁÁÁÁÁÁÁÁÁÁÁÁÁÁÁÁÁÁÁÁÁÁÁÁÁÁÁÁÁÁÁ<br />
ÁÁÁÁÁ<br />
ÁÁÁÁÁÁÁÁÁÁÁÁÁÁÁÁÁÁÁÁÁÁÁÁÁÁÁÁÁÁÁÁÁ<br />
ÁÁÁÁÁ<br />
<br />
<br />
ÁÁÁÁÁÁÁÁÁÁÁÁÁÁÁÁÁÁÁÁÁÁÁÁÁÁÁÁÁÁÁÁÁÁÁÁÁ<br />
ÁÁÁÁÁÁÁÁÁÁÁÁÁÁÁÁÁÁÁÁÁÁÁÁÁÁÁÁÁÁÁÁÁ<br />
ÁÁÁÁÁ<br />
<br />
<br />
<br />
ÁÁÁÁÁÁÁÁÁÁÁÁÁÁÁÁÁÁÁÁÁÁÁÁÁÁÁÁÁÁÁÁÁÁÁÁÁ<br />
ÁÁÁÁÁÁÁÁÁÁÁÁÁÁÁÁÁÁÁÁÁÁÁÁÁÁÁÁÁÁÁÁÁ<br />
ÁÁÁÁÁ<br />
<br />
<br />
ÁÁÁÁÁÁÁÁÁÁÁÁÁÁÁÁÁÁÁÁÁÁÁÁÁÁÁÁÁÁÁÁÁÁÁÁÁ<br />
ÁÁÁÁÁÁÁÁÁÁÁÁÁÁÁÁÁÁÁÁÁÁÁÁÁÁÁÁÁÁÁÁÁ<br />
ÁÁÁÁÁ<br />
<br />
<br />
<br />
ÁÁÁÁÁÁÁÁÁÁÁÁÁÁÁÁÁÁÁÁÁÁÁÁÁÁÁÁÁÁÁÁÁÁÁÁÁ<br />
ÁÁÁÁÁÁÁÁÁÁÁÁÁÁÁÁÁÁÁÁÁÁÁÁÁÁÁÁÁÁÁÁÁ<br />
ÁÁÁÁÁ<br />
ÁÁÁÁÁÁÁÁÁÁÁÁÁÁÁÁÁÁÁÁÁÁÁÁÁÁÁÁÁÁÁÁÁÁÁÁÁ<br />
ÁÁÁÁÁÁÁÁÁÁÁÁÁÁÁÁÁÁÁÁÁÁÁÁÁÁÁÁÁÁÁÁÁ<br />
ÁÁÁÁÁ<br />
<br />
<br />
ÁÁÁÁÁÁÁÁÁÁÁÁÁÁÁÁÁÁÁÁÁÁÁÁÁÁÁÁÁÁÁÁÁ<br />
ÁÁÁÁÁ
Neuberger Berman<br />
Advisers Management Trust<br />
Socially Responsive Portfolio<br />
I Class Shares<br />
S Class Shares<br />
<strong>Annual</strong> Report<br />
December 31, 2008<br />
B1017 02/09
Socially Responsive Portfolio Managers’ Commentary<br />
During 2008, there was virtually no place to hide in the stock market. During one of the worst years in market history, all<br />
10 S&P 500 sectors posted losses, with nine of 10 falling more than 20%; Financials stocks dropped by more than 55%.<br />
Even traditionally defensive groups such as Consumer Staples, Health Care and Utilities failed to preserve investor capital.<br />
Our research process is based on business fundamentals, and provided limited defense in an environment of indiscriminate<br />
selling by highly leveraged hedge funds faced with margin calls, mutual funds forced to meet redemptions, and panicked<br />
individual investors. While the Neuberger Berman Advisers Management Trust (AMT) Socially Responsive Portfolio<br />
managed to outperform in four of the eight sectors in which it was invested, it experienced an overall decline that trailed its<br />
S&P 500 benchmark.<br />
Like the broader market, the AMT Socially Responsive Portfolio failed to generate positive returns in any sector. However,<br />
investments in the Industrials, Materials and Financials sectors performed better than corresponding benchmark sector<br />
components. In Industrials, the comparatively moderate decline of Canadian National Railway enhanced relative returns.<br />
In Materials, our only sector holding, industrial gases producer Praxair, held up relatively well. In Financials, leading<br />
transaction processor State Street (sold in July 2008) and property and casualty insurer Progressive Corp. outperformed.<br />
In general, our strategy since 2006 of avoiding more credit sensitive financial companies benefited relative performance.<br />
Investments in the Energy and Consumer Discretionary sectors penalized relative returns. The Portfolio was underweighted<br />
in Energy, but our bias toward exploration, production and services companies, which sustained much more damage than<br />
the more diversified integrated oils as energy prices collapsed from mid-summer highs, hurt relative performance. Oil<br />
services company Smith International and exploration and production company Newfield Exploration were among our<br />
poorer performers in this sector. Consumer Discretionary investments underperformed by a relatively small margin, but the<br />
Portfolio’s substantial overweighting in this sector penalized returns. Auto parts manufacturer BorgWarner and media<br />
companies Liberty Global and Scripps Networks Interactive were among our disappointments. The Portfolio was also<br />
disadvantaged by not owning any Consumer Staples stocks — the S&P 500’s best performing sector.<br />
The credit crisis and volatile financial markets have negatively impacted virtually every economy in the world. We<br />
currently believe that the global economic malaise could likely extend into 2009 before we see some improvement in the<br />
second half as aggressive efforts to stimulate economic growth by U.S. and international authorities begin to take root.<br />
Lower food and fuel costs should take some pressure off household budgets, and lower commodity costs may help<br />
cushion profit margins for companies experiencing a decline in demand for their products.<br />
The damage sustained in 2008 has shaken investor confidence in equities and the near-term economic outlook remains<br />
clouded by ongoing financial market turmoil. Taking a longer view, we believe business prospects over the three- to<br />
five-year time horizon encompassed in our investment approach are likely to improve. Following the last three recessions,<br />
the economy expanded by 40 - 70% over extended periods of time. Companies with the right customer value proposition<br />
and thoughtful managements have disproportionately benefited in such cycles.<br />
We can’t be certain when the global economy will begin to stabilize or when the stock market will begin to reflect an<br />
improving economic climate. The potential for positive growth drives us to continue to search for high quality, good<br />
corporate citizens capable of building market share and growing earnings faster than their peers across economic and<br />
market cycles. Following 2008’s dramatic decline in the equity market, many equities of such “growth advantaged”<br />
companies are trading at prices that conform to our value and investment criteria. This gives us confidence that the AMT<br />
Socially Responsive Portfolio can reward shareholders in the years ahead.<br />
Sincerely,<br />
Arthur Moretti and Ingrid Dyott<br />
Portfolio Co-Managers<br />
1
Socially Responsive Portfolio<br />
SECTOR ALLOCATION<br />
(% of Equity Market Value)<br />
Energy 9.6%<br />
Materials 3.1<br />
Industrials 15.2<br />
Consumer Discretionary 20.3<br />
Health Care 11.8<br />
Financials 15.1<br />
Information Technology 20.2<br />
Utilities 4.7<br />
Total 100.0%<br />
AVERAGE ANNUAL TOTAL RETURN 1<br />
Inception<br />
Life of<br />
Date 1 Year 5 Year Fund*<br />
Socially Responsive Portfolio Class I 02/18/99 (39.44%) (2.15%) 1.20%<br />
Socially Responsive Portfolio Class S 2 05/01/06 (39.43%) (2.21%) 1.17%<br />
S&P 500 3 (37.00%) (2.19%) (1.37%)<br />
Performance data quoted represent past performance, which is no guarantee<br />
of future results. The investment return and principal value of an investment<br />
will fluctuate so that an investor’s shares, when redeemed may be worth<br />
more or less than their original cost. Results are shown on a “total return”<br />
basis and include reinvestment of all dividends and capital gain distributions.<br />
Current performance may be lower or higher than the performance data<br />
quoted. For performance data current to the most recent month end, please<br />
visit https://www.nb.com.<br />
* Index returns are as of inception date 2/18/99.<br />
As stated in the Portfolio’s most recent prospectus, the total annual fund operating<br />
expense ratio for fiscal year 2007 was 0.92% and 1.17% for Class I and Class S shares,<br />
respectively (prior to any fee waivers or expense reimbursements). Neuberger Berman<br />
Management LLC has contractually agreed to limit certain expenses of the Portfolio<br />
through 12/31/2011.<br />
COMPARISON OF A $10,000 INVESTMENT<br />
20,000<br />
15,000<br />
10,000<br />
5,000<br />
0<br />
2/18/99 1999 2000 2001 2002 2003 2004 2005 2006 2007 2008<br />
Socially Responsive Portfolio Class I<br />
S&P 500<br />
Value as of 12/31/08<br />
$11,250<br />
$8,723<br />
The chart shows the value of a hypothetical $10,000 investment in the Portfolio over the<br />
past 10 fiscal years, or since the Portfolio’s inception, if it has not operated for 10 years.<br />
The graphs are based on Class I shares only; performance of other classes will vary due<br />
to differences in fee structures (see Average <strong>Annual</strong> Total Return chart above). The result<br />
is compared with benchmarks, which may include a broad-based market index and/or a<br />
narrower index. Please note that market indexes do not include expenses. All results<br />
include the reinvestment of dividends and capital gain distributions. Results represent<br />
past performance and do not indicate future results. The chart and table do not reflect<br />
the deduction of taxes that a shareholder would pay on Portfolio distributions or the<br />
redemption of Portfolio shares.<br />
Please see Endnotes for additional information.<br />
2
Endnotes<br />
1 “Total Return” includes reinvestment of all income dividends and capital gain distributions. Results represent past<br />
performance and do not indicate future results. The value of an investment in the Portfolio and the return on the<br />
investment both will fluctuate, and redemption process may be higher or lower than an investor’s original cost. The<br />
performance information does not reflect fees and expenses of the variable annuity and variable life insurance<br />
policies or the pension plans whose proceeds are invested in the Portfolio. Neuberger Berman Management LLC<br />
(“NBM LLC”) has agreed to absorb certain expenses of the AMT Portfolios, including the Portfolio. Without this<br />
arrangement, which is subject to change, the total returns of the Portfolio may have been less.<br />
2 Performance shown prior to May 1, 2006, for the Class S shares is that of the Class I shares, which has lower<br />
expenses than Class S shares and correspondingly higher returns.<br />
3 The S&P 500 Index is widely regarded as the standard for measuring large-cap U.S. stock market performance and<br />
includes a representative sample of leading companies in leading industries. Please note that indices do not take<br />
into account any fees and expenses of investing in the individual securities that they track, and that individuals<br />
cannot invest directly in any index. Data about the performance of this index is prepared or obtained by NBM LLC<br />
and include reinvestment of all dividends and capital gain distributions. The Portfolio may invest directly in many<br />
securities not included in the above-described index.<br />
Any ratios or other measurements using a factor of forecasted earnings of a company discussed herein are based on<br />
consensus estimates, not NBM LLC’s own projections, and they may or may not be realized. In addition, any<br />
revision to a forecast could affect the market price of a security. By quoting them herein, NBM LLC does not offer<br />
an opinion as to the accuracy of and does not guarantee these forecasted numbers.<br />
The investments for the Portfolio are managed by the same portfolio manager(s) who manage one or more other<br />
mutual funds that have similar names, investment objectives and investment styles as the Portfolio. You should be<br />
aware that the Portfolio is likely to differ from the other mutual funds in size, cash flow pattern and tax matters.<br />
Accordingly, the holdings and performance of the Portfolio can be expected to vary from those of the other<br />
mutual funds.<br />
The composition, industries and holdings of the Portfolio are subject to change.<br />
Shares of the separate AMT Portfolios are sold only through the currently effective prospectus and are not available<br />
to the general public. Shares of this Portfolio may be purchased only by life insurance companies to be used with<br />
their separate accounts that fund variable annuity and variable life insurance policies and by qualified pension and<br />
retirement plans.<br />
© 2009 Neuberger Berman Management LLC distributor. All rights reserved.<br />
3
Information About Your Fund’s Expenses<br />
This table is designed to provide information regarding costs related to your investments. All mutual funds incur<br />
operating expenses, which include management fees, fees for administrative services and costs of shareholder reports,<br />
among others. The following examples are based on an investment of $1,000 made at the beginning of the six month<br />
period ended December 31, 2008. The table illustrates the fund’s costs in two ways:<br />
Actual Expenses and Performance:<br />
Hypothetical Example for<br />
Comparison Purposes:<br />
The first section of the table provides information about actual account values<br />
and actual expenses in dollars, based on the fund’s actual performance during<br />
the period. You may use the information in this line, together with the amount<br />
you invested, to estimate the expenses you paid over the period. Simply divide<br />
your account value by $1,000 (for example, an $8,600 account value divided by<br />
$1,000 = 8.6), then multiply the result by the number in the first section of the<br />
table under the heading entitled “Expenses Paid During the Period” to estimate<br />
the expenses you paid over the period.<br />
The second section of the table provides information about hypothetical<br />
account values and hypothetical expenses based on the fund’s actual expense<br />
ratio and an assumed rate of return at 5% per year before expenses. This<br />
return is not the fund’s actual return. The hypothetical account values and<br />
expenses may not be used to estimate the actual ending account balance or<br />
expenses you paid for the period. You may use this information to compare the<br />
ongoing costs of investing in this fund versus other funds. To do so, compare<br />
the expenses shown in this 5% hypothetical example with the 5% hypothetical<br />
examples that appear in the shareholder reports of other funds.<br />
Please note that the expenses in the table are meant to highlight your ongoing costs only. The table and expense example<br />
do not include any transactional costs, such as fees and expenses that are, or may be, imposed under your variable<br />
contract or qualified pension plan. Therefore, the information under the heading “Hypothetical (5% annual return before<br />
expenses)” is useful in comparing ongoing costs only, and will not help you determine the relative total costs of owning<br />
different funds. In addition, if these transactional costs were included, your costs would have been higher.<br />
Expense Information as of 12/31/08 (Unaudited)<br />
NEUBERGER BERMAN ADVISERS MANAGEMENT TRUST SOCIALLY RESPONSIVE PORTFOLIO<br />
Expenses Paid During<br />
Beginning Account Ending Account the Period* Expense<br />
Actual Value 7/1/08 Value 12/31/08 7/1/08 – 12/31/08 Ratio<br />
Class I $1,000.00 $ 667.90 $4.23 1.01%<br />
Class S $1,000.00 $ 669.00 $4.99 1.19%<br />
Hypothetical (5% annual return before expenses)**<br />
Class I $1,000.00 $1,020.06 $5.13 1.01%<br />
Class S $1,000.00 $1,019.15 $6.04 1.19%<br />
* For each class of the fund, expenses are equal to the annualized expense ratio for the class, multiplied by the average account value over<br />
the period, multiplied by 184/366 (to reflect the one-half year period shown).<br />
** Hypothetical 5% annual return before expenses is calculated by multiplying the number of days in the most recent half year divided by 366.<br />
4
Schedule of Investments Socially Responsive Portfolio<br />
NUMBER OF SHARES MARKET VALUE †<br />
NUMBER OF SHARES MARKET VALUE †<br />
Common Stocks (97.3%)<br />
Auto Components (2.0%)<br />
94,030 BorgWarner, Inc. $ 2,047,033<br />
Automobiles (2.0%)<br />
30,820 Toyota Motor ADR 2,016,861<br />
Biotechnology (4.6%)<br />
63,570 Genzyme Corp. 4,219,141*<br />
82,850 Medarex, Inc. 462,303*<br />
4,681,444<br />
Capital Markets (5.2%)<br />
115,835 Bank of New York Mellon 3,281,605<br />
123,729 Charles Schwab 2,000,698<br />
5,282,303<br />
Commercial Services & Supplies (2.8%)<br />
84,385 Manpower Inc. 2,868,246<br />
Diversified Financial Services (3.4%)<br />
4,065 CME Group 845,967<br />
32,250 IntercontinentalExchange Inc. 2,658,690*<br />
3,504,657<br />
Electronic Equipment, Instruments &<br />
Components (8.2%)<br />
115,825 Anixter International 3,488,649*<br />
199,875 National Instruments 4,868,955<br />
8,357,604<br />
Energy Equipment & Services (1.8%)<br />
79,250 Smith International 1,814,033<br />
Health Care Providers & Services (2.6%)<br />
99,020 UnitedHealth Group 2,633,932<br />
Industrial Conglomerates (3.6%)<br />
63,515 3M Co. 3,654,653<br />
Life Science Tools & Services (1.0%)<br />
20,765 Millipore Corp. $ 1,069,813*<br />
Machinery (4.9%)<br />
88,790 Danaher Corp. 5,026,402<br />
Media (15.9%)<br />
308,177 Comcast Corp. Class A Special 4,977,059<br />
139,600 Liberty Global Class A 2,222,432*<br />
24,051 Liberty Global Class C 365,094*<br />
195,825 Scripps Networks Interactive 4,308,150<br />
11,059 Washington Post 4,315,775<br />
16,188,510<br />
Multi-Utilities (4.6%)<br />
472,334 National Grid 4,645,033<br />
Oil, Gas & Consumable Fuels (7.5%)<br />
179,563 BG Group PLC 2,470,656<br />
80,675 Cimarex Energy 2,160,477<br />
153,010 Newfield Exploration 3,021,947*<br />
7,653,080<br />
Pharmaceuticals (3.2%)<br />
5,186 Novo Nordisk A/S ADR 266,508<br />
59,539 Novo Nordisk A/S Class B 3,013,282<br />
3,279,790<br />
Road & Rail (3.4%)<br />
94,985 Canadian National Railway 3,491,649<br />
Semiconductors & Semiconductor<br />
Equipment (8.5%)<br />
336,355 Altera Corp. 5,620,492<br />
192,750 Texas Instruments 2,991,480<br />
8,611,972<br />
Software (3.0%)<br />
126,650 Intuit Inc. 3,013,004*<br />
Total Common Stocks<br />
(Cost $138,166,993) 99,062,215<br />
Industrial Gases (3.0%)<br />
51,390 Praxair, Inc. 3,050,510<br />
Insurance (6.1%)<br />
194,375 Progressive Corp. 2,878,694<br />
132,355 Willis Group Holdings 3,292,992<br />
6,171,686<br />
See Notes to Schedule of Investments 5
PRINCIPAL AMOUNT MARKET VALUE †<br />
Repurchase Agreements (2.2%)<br />
$2,247,000 Repurchase Agreement<br />
with Fixed Income<br />
Clearing Corp., 0.01%,<br />
due 1/2/09, dated 12/31/08,<br />
Maturity Value $2,247,001,<br />
Collateralized by $2,230,000,<br />
Fannie Mae, 4.33%,<br />
due 7/28/11<br />
(Collateral Value $2,316,413)<br />
(Cost $2,247,000) $ 2,247,000 #<br />
Certificates of Deposit (0.2%)<br />
100,000 Shorebank Chicago, 2.00%,<br />
due 3/15/09 100,000<br />
100,000 Shorebank Pacific, 1.28%,<br />
due 2/7/09 100,000<br />
Total Certificates of Deposit<br />
(Cost $200,000) 200,000 #<br />
Total Investments (99.7%)<br />
(Cost $140,613,993) 101,509,215 ##<br />
Cash, receivables and other assets,<br />
less liabilities (0.3%) 271,515<br />
Total Net Assets (100.0%) $101,780,730<br />
See Notes to Schedule of Investments 6
Notes to Schedule of Investments Socially Responsive<br />
Portfolio<br />
† Investments in equity securities by Neuberger Berman Advisers Management Trust Socially Responsive Portfolio<br />
(the “Fund”) are valued by obtaining valuations from an independent pricing service. The independent pricing<br />
service values equity securities at the latest sale price when that price is readily available. Securities traded primarily<br />
on the NASDAQ Stock Market are normally valued by the Fund at the NASDAQ Official Closing Price (“NOCP”)<br />
provided by NASDAQ each business day. The NOCP is the most recently reported price as of 4:00:02 p.m.,<br />
Eastern time, unless that price is outside the range of the “inside” bid and asked prices (i.e., the bid and asked prices<br />
that dealers quote to each other when trading for their own accounts); in that case, NASDAQ will adjust the price<br />
to equal the inside bid or asked price, whichever is closer. Because of delays in reporting trades, the NOCP may not<br />
be based on the price of the last trade to occur before the market closes. If there is no reported sale of a security on<br />
a particular day, the independent pricing service may value the security based on reported market quotations. If a<br />
valuation is not available from an independent pricing service, the Fund seeks to obtain quotations from principal<br />
market makers. If such quotations are not readily available, securities are valued using methods the Board of<br />
Trustees of Neuberger Berman Advisers Management Trust (the “Board”) has approved on the belief that they<br />
reflect fair value. Numerous factors may be considered when determining the fair value of a security, including<br />
available analyst, media or other reports, trading in futures or ADRs and whether the issuer of the security being<br />
fair valued has other securities outstanding. Foreign security prices are furnished by independent quotation<br />
services and expressed in local currency values. Foreign security prices are currently translated from the local<br />
currency into U.S. dollars using the exchange rate as of 4:00 p.m., Eastern time. The Board has approved the use of<br />
Interactive Data Pricing and Reference Data, Inc. (“Interactive”) to assist in determining the fair value of the Fund’s<br />
foreign equity securities when changes in the value of a certain index suggest that the closing prices on the foreign<br />
exchanges may no longer represent the amount that the Fund could expect to receive for those securities. In this<br />
event, Interactive will provide adjusted prices for certain foreign equity securities using a statistical analysis of<br />
historical correlations of multiple factors. In the absence of precise information about the market values of these<br />
foreign securities as of the close of the New York Stock Exchange, the Board has determined on the basis of<br />
available data that prices adjusted in this way are likely to be closer to the prices the Fund could realize on a current<br />
sale than are the prices of those securities established at the close of the foreign markets in which the securities<br />
primarily trade. Fair value prices are necessarily estimates, and there is no assurance that such a price will be at or<br />
close to the price at which the security next trades. Short-term debt securities with less than 60 days until maturity<br />
may be valued at cost which, when combined with interest earned, approximates market value.<br />
The Fund adopted Financial Accounting Standards Board (“FASB”) Statement of Financial Accounting Standards<br />
No. 157, Fair Value Measurements (“FAS 157”), effective January 1, 2008. In accordance with FAS 157, “fair value” is<br />
defined as the price that a Fund would receive upon selling an investment in an orderly transaction to an<br />
independent buyer in the principal or most advantageous market for the investment. Various inputs are used in<br />
determining the value of the Fund’s investments.<br />
In addition to defining fair value, FAS 157 established a three-tier hierarchy of inputs to establish a classification of<br />
fair value measurements for disclosure purposes. The three-tier hierarchy of inputs is summarized in the three<br />
broad Levels listed below.<br />
• Level 1 – quoted prices in active markets for identical investments<br />
• Level 2 – other significant observable inputs (including quoted prices for similar investments, interest rates,<br />
prepayment speeds, credit risk, amortized cost, etc.)<br />
• Level 3 – significant unobservable inputs (including the Fund’s own assumptions in determining the fair value of<br />
investments)<br />
See Notes to Financial Statements 7
Notes to Schedule of Investments Socially Responsive<br />
Portfolio (cont’d)<br />
The inputs or methodology used for valuing an investment are not necessarily an indication of the risk associated<br />
with investing in those securities.<br />
The following is a summary of the inputs used to value the Fund’s investments as of December 31, 2008:<br />
Valuation Inputs<br />
Investments in<br />
Securities<br />
Level 1 – Quoted Prices $ 99,062,215<br />
Level 2 – Other Significant Observable Inputs 2,447,000<br />
Level 3 – Significant Unobservable Inputs —<br />
Total $101,509,215<br />
# At cost, which approximates market value.<br />
## At December 31, 2008, the cost of investments for U.S. federal income tax purposes was $143,676,429. Gross unrealized<br />
appreciation of investments was $1,200,961 and gross unrealized depreciation of investments was $43,368,175,<br />
resulting in net unrealized depreciation of $42,167,214, based on cost for U.S. federal income tax purposes.<br />
* Security did not produce income during the last twelve months.<br />
See Notes to Financial Statements 8
Statement of Assets and Liabilities<br />
Neuberger Berman Advisers Management Trust<br />
SOCIALLY<br />
RESPONSIVE<br />
PORTFOLIO<br />
December 31, 2008<br />
Assets<br />
Investments in securities, at market value* (Note A)—see Schedule of Investments:<br />
Unaffiliated issuers $101,509,215<br />
Cash 13,083<br />
Foreign currency 50<br />
Dividends and interest receivable 143,486<br />
Receivable for Fund shares sold 305,131<br />
Receivable for securities lending income (Note A) 1,007<br />
Prepaid expenses and other assets 39<br />
Total Assets 101,972,011<br />
Liabilities<br />
Payable for Fund shares redeemed 65,774<br />
Payable to investment manager (Notes A & B) 45,257<br />
Payable to administrator—net (Note B) 8,951<br />
Accrued expenses and other payables 71,299<br />
Total Liabilities 191,281<br />
Net Assets at value $101,780,730<br />
Net Assets consist of:<br />
Paid-in capital $153,993,632<br />
Undistributed net investment income (loss) 2,218,992<br />
Accumulated net realized gains (losses) on investments (15,324,736)<br />
Net unrealized appreciation (depreciation) in value of investments (39,107,158)<br />
Net Assets at value $101,780,730<br />
Net Assets<br />
Class I $51,636,425<br />
Class S 50,144,305<br />
Shares Outstanding ($.001 par value; unlimited shares authorized)<br />
Class I 5,497,641<br />
Class S 5,331,411<br />
Net Asset Value, offering and redemption price per share<br />
Class I $9.39<br />
Class S 9.41<br />
*Cost of Investments:<br />
Unaffiliated issuers $140,613,993<br />
Total cost of foreign currency $57<br />
See Notes to Financial Statements 9
Statement of Operations<br />
Neuberger Berman Advisers Management Trust<br />
SOCIALLY<br />
RESPONSIVE<br />
PORTFOLIO<br />
For the<br />
Year Ended<br />
December 31, 2008<br />
Investment Income:<br />
Income (Note A):<br />
Dividend income—unaffiliated issuers $6,491,936<br />
Interest income—unaffiliated issuers 235,421<br />
Income from securities loaned—net (Note F) 55,582<br />
Foreign taxes withheld (135,997)<br />
Total income $6,646,942<br />
Expenses:<br />
Investment management fees (Notes A & B) 2,209,487<br />
Administration fees (Note B):<br />
Class I 1,018,771<br />
Class S 223,668<br />
Distribution fees (Note B):<br />
Class S 186,390<br />
Audit fees 40,493<br />
Custodian fees (Note B) 135,937<br />
Insurance expense 16,275<br />
Legal fees 98,358<br />
Shareholder reports 93,368<br />
Trustees’ fees and expenses 38,147<br />
Miscellaneous 23,800<br />
Total expenses 4,084,694<br />
Expenses reimbursed by administrator (Note B) (71,032)<br />
Expenses reduced by custodian fee expense offset and commission recapture arrangements (Note B) (29,295)<br />
Total net expenses 3,984,367<br />
Net investment income (loss) $2,662,575<br />
Realized and Unrealized Gain (Loss) on Investments (Note A)<br />
Net realized gain (loss) on:<br />
Sales of investment securities of unaffiliated issuers (12,311,535)<br />
Sales of investment securities of affiliated issuers (462,545)<br />
Redemption in-kind 5,365,827<br />
Foreign currency (136,744)<br />
Change in net unrealized appreciation (depreciation) in value of:<br />
Unaffiliated investment securities (95,753,828)<br />
Foreign currency (7,524)<br />
Net gain (loss) on investments (103,306,349)<br />
Net increase (decrease) in net assets resulting from operations $(100,643,774)<br />
See Notes to Financial Statements 10
Statements of Changes in Net Assets<br />
Neuberger Berman Advisers Management Trust<br />
SOCIALLY RESPONSIVE PORTFOLIO<br />
Year Ended<br />
Year Ended<br />
December 31, December 31,<br />
2008 2007<br />
Increase (Decrease) in Net Assets:<br />
From Operations:<br />
Net investment income (loss) $2,662,575 $3,004,933<br />
Net realized gain (loss) on investments (7,544,997) 8,746,817<br />
Change in net unrealized appreciation (depreciation) of investments (95,761,352) 18,142,679<br />
Net increase (decrease) in net assets resulting from operations (100,643,774) 29,894,429<br />
Distributions to Shareholders From (Note A):<br />
Net investment income:<br />
Class I (1,623,563) (427,951)<br />
Class S (1,370,229) (17,131)<br />
Net realized gain on investments:<br />
Class I (5,548,809) (1,609,650)<br />
Class S (5,503,467) (302,640)<br />
Total distributions to shareholders (14,046,068) (2,357,372)<br />
From Fund Share Transactions (Note D):<br />
Proceeds from shares sold:<br />
Class I 68,378,900 296,255,440<br />
Class S 5,844,369 8,865,625<br />
Proceeds from reinvestment of dividends and distributions:<br />
Class I 7,172,372 2,037,601<br />
Class S 6,873,696 319,771<br />
Payments for shares redeemed:<br />
Class I (508,016,238) (24,274,098)<br />
Class S (11,960,896) (16,760,067)<br />
Net increase (decrease) from Fund share transactions (431,707,797) 266,444,272<br />
Net Increase (Decrease) in Net Assets (546,397,639) 293,981,329<br />
Net Assets:<br />
Beginning of year 648,178,369 354,197,040<br />
End of year $101,780,730 $648,178,369<br />
Undistributed net investment income (loss) at end of year $2,218,992 $2,992,750<br />
See Notes to Financial Statements 11
Notes to Financial Statements Socially Responsive Portfolio<br />
Note A—Summary of Significant Accounting Policies:<br />
1 General: Socially Responsive Portfolio (the “Fund”) is a separate operating series of Neuberger Berman Advisers<br />
Management Trust (the “Trust”), a Delaware statutory trust organized pursuant to a Trust Instrument dated<br />
May 23, 1994. The Trust is currently comprised of ten separate operating series (each a “Series,” collectively, the<br />
“Funds”) each of which is diversified. The Trust is registered as an open-end management investment company<br />
under the Investment Company Act of 1940, as amended (the “1940 Act”), and its shares are registered under the<br />
Securities Act of 1933, as amended (the “1933 Act”). The Fund currently offers Class I and Class S shares. The<br />
Board of Trustees of the Trust (the “Board”) may establish additional series or classes of shares without the<br />
approval of shareholders.<br />
The assets of each Series belong only to that Series, and the liabilities of each Series are borne solely by that Series<br />
and no other.<br />
The preparation of financial statements in accordance with U.S. generally accepted accounting principles requires<br />
Neuberger Berman Management LLC (“Management”) to make estimates and assumptions at the date of the<br />
financial statements. Actual results could differ from those estimates.<br />
Management, the investment manager of the Fund, and Neuberger Berman, LLC (“Neuberger”), the Fund’s<br />
sub-adviser, are wholly owned subsidiaries of Lehman Brothers Holdings Inc. (“Lehman Brothers”), a publicly<br />
owned holding company. On September 15, 2008, Lehman Brothers filed a voluntary petition under Chapter 11 of<br />
the U.S. Bankruptcy Code. On December 3, 2008, NBSH Acquisition, LLC (“NBSH”), an entity organized by key<br />
members of Neuberger Berman’s senior management, was selected as the successful bidder in the public auction to<br />
acquire a majority interest in Neuberger Berman’s business and the fixed income and certain alternative asset<br />
management businesses of Lehman Brothers’ Investment Management Division (together with Neuberger Berman,<br />
the “Acquired Businesses”) (the “Proposed Acquisition”). On December 22, 2008, the bankruptcy court having<br />
jurisdiction over the Lehman Brothers matter approved the sale of the Acquired Businesses to NBSH (or its<br />
successor or assign), as the successful bidder. At the closing of the Proposed Acquisition, a majority interest in the<br />
Acquired Businesses will be directly or indirectly owned by portfolio managers, Neuberger Berman’s management<br />
team and certain key members and senior professionals of the former Investment Management Division, as well as<br />
by Lehman Brothers and certain affiliates of Lehman Brothers. The transaction is subject to certain conditions and<br />
approvals.<br />
These events, while affecting Lehman Brothers, have not had a material impact on the Fund or its operations.<br />
Management and Neuberger will continue to operate in the ordinary course of business as the investment manager<br />
and sub-adviser of the Fund.<br />
Included in the Acquired Businesses are Management and Neuberger. The consummation of the Proposed<br />
Acquisition has been deemed to result in an “assignment” of the Fund’s Management and Sub-Advisory<br />
Agreements which would, by law, automatically terminate those agreements. Accordingly, the Board, including the<br />
Trustees who are not “interested persons” of the Fund’s investment manager and its affiliates or the Fund, has<br />
approved the new Management Agreements and Sub-Advisory Agreements for the Fund. The new agreements also<br />
will require the approval of the Fund’s shareholders.<br />
2 Portfolio valuation: Investment securities are valued as indicated in the notes following the Schedule of<br />
Investments.<br />
3 Foreign currency translation: The accounting records of the Fund are maintained in U.S. dollars. Foreign currency<br />
amounts are currently translated into U.S. dollars using the exchange rates as of 4:00 p.m., Eastern time, to<br />
determine the value of investments, other assets and liabilities. Purchase and sale prices of securities, and income<br />
and expenses, are translated into U.S. dollars at the prevailing rate of exchange on the respective dates of such<br />
12
transactions. Net unrealized foreign currency gain (loss) arises from changes in the value of assets and liabilities,<br />
other than investments in securities, as a result of changes in exchange rates and is stated separately in the<br />
Statement of Operations.<br />
4 Securities transactions and investment income: Securities transactions are recorded on trade date for financial<br />
reporting purposes. Dividend income is recorded on the ex-dividend date or, for certain foreign dividends, as soon<br />
as the Fund becomes aware of the dividends. Non-cash dividends included in dividend income, if any, are recorded<br />
at the fair market value of the securities received. Interest income, including accretion of original issue discount,<br />
where applicable, and accretion of discount on short-term investments, is recorded on the accrual basis. Realized<br />
gains and losses from securities transactions and foreign currency transactions, if any, are recorded on the basis of<br />
identified cost and stated separately in the Statement of Operations. Included in net realized gain (loss) on<br />
investments are proceeds from the settlements of class action litigation in which the Fund participated as a<br />
plaintiff. The amount of such proceeds for the year ended December 31, 2008 was $309,838.<br />
5 Income tax information: The Funds are treated as separate entities for U.S. federal income tax purposes. It is the<br />
policy of the Fund to continue to qualify as a regulated investment company by complying with the requirements<br />
of Subchapter M of the Internal Revenue Code applicable to regulated investment companies and to distribute<br />
substantially all of its earnings to shareholders. Therefore, no federal income or excise tax provision is required.<br />
The Fund has adopted the provisions of Financial Accounting Standards Board Interpretation No. 48 (“FIN 48”)<br />
“Accounting for Uncertainty in Income Taxes—an interpretation of FASB Statement No. 109”. FIN 48 sets forth a<br />
minimum threshold for financial statement recognition of the benefit of a tax position taken, or expected to be<br />
taken, in a tax return. The Fund recognizes interest and penalties, if any, related to unrecognized tax benefits as an<br />
income tax expense in the Statement of Operations. The Fund is subject to examination by U.S. federal and state<br />
tax authorities for returns filed for the prior three fiscal years 2005 - 2007. As of December 31, 2008, the Fund did<br />
not have any unrecognized tax benefits.<br />
Income distributions and capital gain distributions are determined in accordance with income tax regulations,<br />
which may differ from U.S. generally accepted accounting principles. These differences are primarily due to<br />
differing treatments of income and gains on various investment securities held by the Fund, timing differences and<br />
differing characterization of distributions made by the Fund as a whole. The Fund may also utilize earnings and<br />
profits distributed to shareholders on redemption of shares as a part of the dividends paid deduction for income<br />
tax purposes.<br />
As determined on December 31, 2008, permanent differences resulting primarily from different book and tax<br />
accounting for foreign currency gains and losses, capital gain distributions from real estate investment trusts and<br />
redemptions in kind were reclassified at fiscal year-end. These reclassifications had no effect on net income, net<br />
asset value or net asset value per share of the Fund.<br />
The tax character of distributions paid during the years ended December 31, 2008 and December 31, 2007 was as<br />
follows:<br />
Distributions Paid From:<br />
Long-Term<br />
Ordinary Income Capital Gain Total<br />
2008 2007 2008 2007 2008 2007<br />
$4,101,032 $2,357,372 $9,945,036 $— $14,046,068 $2,357,372<br />
As of December 31, 2008, the components of distributable earnings (accumulated losses) on a U.S. federal income<br />
tax basis were as follows:<br />
Undistributed Undistributed Unrealized Loss<br />
Ordinary Long-Term Appreciation Carryforwards<br />
Income Gain (Depreciation) and Deferrals Total<br />
$2,218,992 $— $(42,169,595) $(12,262,299) $(52,212,902)<br />
13
The difference between book basis and tax basis distributable earnings is attributable primarily to timing<br />
differences of wash sales, partnership basis adjustment, capital loss carryforwards and post October loss deferral.<br />
To the extent the Fund’s net realized capital gains, if any, can be offset by capital loss carryforwards, it is the policy<br />
of the Fund not to distribute such gains. As determined at December 31, 2008, the Fund had unused capital loss<br />
carryforwards available for federal income tax purposes to offset net realized capital gains, if any, as follows:<br />
Expiring In:<br />
2016<br />
$7,357,742<br />
Under current tax law, the use of these losses to offset future gains may be limited in a given year. Under current tax<br />
law, certain net capital and net foreign currency losses realized after October 31 within the taxable year may be<br />
deferred and treated as occurring on the first day of the following tax year. For the year ended December 31, 2008,<br />
the Fund elected to defer $4,904,557 net capital losses arising between November 1, 2008 and December 31, 2008.<br />
6 Distributions to shareholders: The Fund may earn income, net of expenses, daily on its investments. Distributions<br />
from net investment income and net realized capital gains, if any, generally are distributed in October. Income<br />
distributions and capital gain distributions to shareholders are recorded on the ex-date.<br />
7 Foreign taxes: Foreign taxes withheld represent amounts withheld by foreign tax authorities, net of refunds<br />
recoverable.<br />
8 Expense allocation: Certain expenses are applicable to multiple funds. Expenses directly attributable to a Series are<br />
charged to that Series. Expenses of the Trust that are not directly attributed to a Series are allocated among the<br />
Funds, on the basis of relative net assets, except where a more appropriate allocation of expenses to each of the<br />
Funds can otherwise be made fairly. Expenses borne by the complex of related investment companies, which<br />
includes open-end and closed-end investment companies for which Management serves as investment manager,<br />
that are not directly attributed to a Series or the Trust are allocated among the Fund and the other investment<br />
companies in the complex or series thereof on the basis of relative net assets, except where a more appropriate<br />
allocation of expenses to each investment company in the complex or series thereof can otherwise be made fairly.<br />
The Fund’s expenses (other than those specific to each class) are allocated proportionally each day between the<br />
classes based upon the relative net assets of each class.<br />
9 Security lending: A third party, eSecLending, has assisted the Fund in conducting a bidding process to identify<br />
agents/principals that would pay a guaranteed amount to the Fund in consideration of the Fund entering into an<br />
exclusive securities lending arrangement.<br />
eSecLending currently serves as exclusive lending agent for the Fund. Under the securities lending arrangement, the<br />
Fund receives cash collateral at the beginning of each transaction equal to at least 102% of the prior day’s market<br />
value of the loaned securities (105% in the case of international securities). The Fund may invest all the cash<br />
collateral in Neuberger Berman Securities Lending Quality Fund, LLC (“Quality Fund”), a fund managed by<br />
Lehman Brothers Asset Management LLC (“LBAM”), an affiliate of Management.<br />
At various times during the course of the Fund’s fiscal year ended December 31, 2008, the Quality Fund’s NAV was<br />
below $1.00 per share, which could have affected the NAV of the Fund with securities loans outstanding during the<br />
period. The Quality Fund’s price per share on December 31, 2008 was $1.00. The market value of the Fund’s<br />
investments in the Quality Fund as of that date, if any, is reflected in the Fund’s Schedule of Investments. If it were<br />
necessary to liquidate assets in the Quality Fund to meet returns on outstanding securities loans at a time when the<br />
Quality Fund’s price per share was less than $1.00, the Fund may not receive an amount from the Quality Fund that<br />
is equal in amount to the collateral the Fund would be required to return to the borrower of the securities and the<br />
Fund would be required to make up for this shortfall. In addition, as a result of recent reduced liquidity in the<br />
credit and fixed income markets, it may be difficult to dispose quickly of some securities in the Quality Fund at the<br />
price at which the Quality Fund is carrying them. The Quality Fund is not a money market fund that operates in<br />
accordance with Rule 2a-7 under the 1940 Act and there is no assurance that it will maintain a $1.00 share price.<br />
14
Net income from the lending program represents the guaranteed amount received from a principal plus income<br />
earned on the cash collateral invested in Quality Fund or in other investments, less cash collateral fees and other<br />
expenses associated with the loans. For the fiscal year ended December 31, 2008, the Fund received net income<br />
under the securities lending arrangement of $55,582, which is reflected in the Statement of Operations under the<br />
caption “Income from securities loaned—net.” For the fiscal year ended December 31, 2008, “Income from<br />
securities loaned—net” consisted of $570,817 in income earned on cash collateral and guaranteed amounts<br />
(including $502,402 of interest income earned from the Quality Fund), less fees and expenses paid of $515,235.<br />
10 Repurchase agreements: The Fund may enter into repurchase agreements with institutions that Management has<br />
determined are creditworthy. Each repurchase agreement is recorded at cost. The Fund requires that the securities<br />
purchased in a repurchase agreement be transferred to the custodian in a manner sufficient to enable the Fund to<br />
assert a perfected security interest in those securities in the event of a default under the repurchase agreement. The<br />
Fund monitors, on a daily basis, the value of the securities transferred to ensure that their value, including accrued<br />
interest, is greater than amounts owed to the Fund under each such repurchase agreement.<br />
11 Indemnifications: Like many other companies, the Trust’s organizational documents provide that its officers and<br />
trustees are indemnified against certain liabilities arising out of the performance of their duties to the Trust. In<br />
addition, both in some of its principal service contracts and in the normal course of its business, the Trust enters<br />
into contracts that provide indemnifications to other parties for certain types of losses or liabilities. The Trust’s<br />
maximum exposure under these arrangements is unknown as this could involve future claims against the Trust.<br />
12 Other: All net investment income and realized and unrealized capital gains and losses of the Fund are allocated, on<br />
the basis of relative net assets, pro rata among its respective classes.<br />
Note B—Management Fees, Administration Fees, Distribution Arrangements, and Other<br />
Transactions With Affiliates:<br />
Fund shares are issued and redeemed in connection with investments in and payments under certain variable<br />
annuity contracts and variable life insurance policies issued through separate accounts of life insurance companies<br />
and are also offered directly to qualified pension and retirement plans.<br />
The Fund retains Management as its investment manager under a Management Agreement. For such investment<br />
management services, the Fund pays Management a fee at the annual rate of 0.55% of the first $250 million of the<br />
Fund’s average daily net assets, 0.525% of the next $250 million, 0.50% of the next $250 million, 0.475% of the<br />
next $250 million, 0.45% of the next $500 million, 0.425% of the next $2.5 billion, and 0.40% of average daily net<br />
assets in excess of $4 billion.<br />
The Fund retains Management as its administrator under an Administration Agreement. Each class pays<br />
Management an administration fee at the annual rate of 0.30% of its average daily net assets under this agreement.<br />
Additionally, Management retains State Street Bank and Trust Company (“State Street”) as its sub-administrator<br />
under a Sub-Administration Agreement. Management pays State Street a fee for all services received under this<br />
agreement.<br />
The Board adopted a non-fee distribution plan for the Fund’s Class I.<br />
For the Fund’s Class S, Management acts as agent in arranging for the sale of class shares without commission and<br />
bears advertising and promotion expenses. The Board has adopted a distribution plan (the “Plan”) with respect to<br />
this class, pursuant to Rule 12b-1 under the 1940 Act. The Plan provides that, as compensation for administrative<br />
and other services provided to this class, Management’s activities and expenses related to the sale and distribution<br />
of this class of shares, and ongoing services provided to investors in this class, Management receives from this class<br />
a fee at an annual rate of 0.25% of Class S’s average daily net assets. Management receives this amount to provide<br />
distribution and shareholder servicing for this class and pays a portion of it to institutions that provide such<br />
services. Those institutions may use payments for, among other purposes, compensating employees engaged in<br />
15
sales and/or shareholder servicing. The amount of fees paid by the class during any year may be more or less than<br />
the cost of distribution and other services provided to this class. FINRA rules limit the amount of annual<br />
distribution fees that may be paid by a mutual fund and impose a ceiling on the cumulative distribution fees paid.<br />
The Trust’s Plan complies with those rules.<br />
Management has contractually undertaken to forgo current payment of fees and/or reimburse the Fund’s Class I<br />
and Class S shares for their operating expenses (exclusive of interest, taxes, brokerage commissions, extraordinary<br />
expenses, and transaction costs) (“Operating Expenses”) which exceed the expense limitation as detailed in the<br />
following table:<br />
Reimbursement from<br />
Management for<br />
the Year Ended<br />
Expense Limitation (1) Expiration December 31, 2008<br />
Class I 1.30% 12/31/11 $—<br />
Class S 1.17% 12/31/11 $71,032<br />
(1) Expense limitation per annum of the respective class’ average daily net assets.<br />
Each respective class has agreed to repay Management through December 31, 2014 for fees and expenses foregone<br />
and/or its excess Operating Expenses previously reimbursed by Management, so long as its annual Operating<br />
Expenses during that period do not exceed its expense limitation, and the repayment is made within three years<br />
after the year in which Management issued the reimbursement or waived fees. During the year ended December 31,<br />
2008, there was no repayment to Management under these agreements. At December 31, 2008, the Fund’s Class I<br />
shares had no contingent liability to Management under this agreement. At December 31, 2008, the Fund’s Class S<br />
shares contingent liabilities to Management under this agreement were as follows:<br />
Expiring in:<br />
2009 2011 Total<br />
Class S $5,094 $71,032 $76,126<br />
Neuberger is retained by Management to furnish it with investment recommendations and research information<br />
without added cost to the Fund. Several individuals who are officers and/or trustees of the Trust are also employees<br />
of Neuberger and/or Management.<br />
The Fund had entered into a commission recapture program, which enabled it to pay some of its operational<br />
expenses by recouping a portion of the commissions it paid to a broker that was not a related party of the Fund.<br />
Pursuant to the agreement, brokers paid recaptured commissions to the Fund’s custodian and the custodian<br />
directed these amounts toward payment of expenses such as custodial, transfer agency or accounting services.<br />
Effective April 1, 2008, this commission recapture program was terminated. For the period ended March 31, 2008,<br />
the impact of this arrangement was a reduction of expenses of $26,520.<br />
The Fund has an expense offset arrangement in connection with its custodian contract. For the year ended<br />
December 31, 2008, the impact of this arrangement was a reduction of expenses of $2,775.<br />
Note C—Securities Transactions:<br />
During the year ended December 31, 2008, there were purchase and sale transactions (excluding short-term<br />
securities) of $166,504,965 and $580,535,029, respectively.<br />
During the year ended December 31, 2008, brokerage commissions on securities transactions paid to affiliated<br />
brokers were as follows: Neuberger received $0 and Lehman Brothers Inc. received $55,044.<br />
16
Note D—Fund Share Transactions:<br />
Share activity for the years ended December 31, 2008 and December 31, 2007 was as follows:<br />
For the Year Ended December 31, 2008<br />
Shares Issued on<br />
Reinvestment of<br />
Dividends and Shares<br />
Shares Sold Distributions Redeemed Total<br />
Class I 4,171,564 740,183 (30,562,519) (25,650,772)<br />
Class S 388,203 708,629 (818,006) 278,826<br />
For the Year Ended December 31, 2007<br />
Shares Issued on<br />
Reinvestment of<br />
Dividends and Shares<br />
Shares Sold Distributions Redeemed Total<br />
Class I 16,651,437 111,283 (1,331,641) 15,431,079<br />
Class S 498,048 17,502 (951,011) (435,461)<br />
Note E—Line of Credit:<br />
At December 31, 2008, the Fund was a participant in a single committed, unsecured $150,000,000 line of credit<br />
with State Street, to be used only for temporary or emergency purposes. Other investment companies managed by<br />
Management also participate in this line of credit on the same terms. Interest is charged on borrowings under this<br />
line of credit at the overnight Federal Funds Rate plus 0.50% per annum. A facility fee of 0.07% (as of<br />
September 19, 2008, 0.09%) per annum of the available line of credit is charged, of which the Fund has agreed to<br />
pay its pro rata share, based on the ratio of its individual net assets to the net assets of all participants at the time<br />
the fee is due and payable. The fee is paid quarterly in arrears. Because several investment companies participate,<br />
there is no assurance that an individual Fund will have access to all or any part of the $150,000,000 at any<br />
particular time. There were no loans outstanding pursuant to this line of credit at December 31, 2008. During the<br />
year ended December 31, 2008, the Fund did not utilize this line of credit.<br />
Note F—Investments In Affiliates:<br />
Income from<br />
Investments<br />
Balance of Balance of in Affiliated<br />
Shares Held Gross Gross Shares Held Value Issuers<br />
December 31, Purchases Sales and December 31, December 31, Included in<br />
Name of Issuer 2007 and Additions Reductions 2008 2008 Total Income<br />
Neuberger Berman<br />
Securities Lending<br />
Quality Fund, LLC* 31,645,361 171,469,498 203,114,859 — $— $502,402<br />
* Quality Fund, a fund managed by LBAM, an affiliate of Management, is used to invest cash the Fund receives as<br />
collateral for securities loans as approved by the Board. Because all shares of Quality Fund are held by funds in the<br />
related investment management complex, Quality Fund may be considered an affiliate of the Fund.<br />
17
Note G—Recent Accounting Pronouncement:<br />
In March 2008, Statement of Financial Accounting Standards No. 161, “Disclosures about Derivative Instruments<br />
and Hedging Activities—an amendment of FASB Statement No. 133” (“FAS 161”), was issued. FAS 161 is intended<br />
to improve financial reporting for derivative instruments by requiring enhanced disclosure that enables investors to<br />
understand how and why an entity uses derivatives, how derivatives are accounted for, and how derivative<br />
instruments affect an entity’s results of operations and financial position. In September 2008, FASB Staff Position<br />
No. 133-1 and FASB Interpretation No. 45-4 (the “FSP”), “Disclosures about Credit Derivatives and Certain<br />
Guarantees: An Amendment of FASB Statement No. 133 and FASB Interpretation No. 45; and Clarification of the<br />
Effective Date of FASB Statement No. 161” was issued. Certain provisions of the FSP amend FASB Statement<br />
No. 133, “Accounting for Derivative Instruments and Hedging Activities,” to require disclosures by sellers of credit<br />
derivatives, including credit derivatives embedded in hybrid instruments. These FSP provisions are effective for<br />
fiscal years and interim periods ending after November 15, 2008. At this time, Management has assessed the<br />
implication of these FSP provisions and determined there is no impact to the Fund’s financial statements. The FSP<br />
also clarifies the effective date of FAS 161, whereby disclosures required by FAS 161 are effective for financial<br />
statements issued for fiscal years and interim periods beginning after November 15, 2008. The impact of FAS 161<br />
on the Fund’s financial statement disclosures, if any, is currently being assessed.<br />
Note H—Recent Market Events:<br />
The year covered by this report witnessed an unusually high degree of volatility in the financial markets and the net<br />
asset values of many mutual funds, including to some extent the Fund. Both domestic and international equity<br />
markets have been experiencing heightened volatility and turmoil, with issuers that have exposure to the real estate,<br />
mortgage and credit markets particularly affected. In addition to the recent turbulence in financial markets, the<br />
reduced liquidity in credit and fixed income markets has negatively affected many issuers worldwide. The Fund’s<br />
investments in certain issuers, as reflected in the Fund’s schedule of investments, and the financial markets in<br />
general, expose investors to the volatile performance resulting from these market conditions and related events.<br />
18
Financial Highlights<br />
Socially Responsive Portfolio<br />
The following tables include selected data for a share outstanding throughout each period and other performance<br />
information derived from the Financial Statements.<br />
Class I<br />
Year Ended December 31,<br />
2008 2007 2006 2005 2004<br />
Net Asset Value, Beginning of Year $ 17.91 $ 16.71 $ 14.91 $ 13.99 $ 12.35<br />
Income From Investment Operations:<br />
Net Investment Income (Loss) ‡ .11 .12 .05 .08 (.00)<br />
Net Gains or Losses on Securities<br />
(both realized and unrealized) (7.13) 1.16 1.98 .88 1.64<br />
Total From Investment Operations (7.02) 1.28 2.03 .96 1.64<br />
Less Distributions From:<br />
Net Investment Income (.34) (.02) (.03) — —<br />
Net Capital Gains (1.16) (.06) (.20) (.04) —<br />
Total Distributions (1.50) (.08) (.23) (.04) —<br />
Net Asset Value, End of Year $ 9.39 $ 17.91 $ 16.71 $ 14.91 $ 13.99<br />
Total Return †† (39.44)% 7.61% 13.70% 6.86% 13.28%<br />
Ratios/Supplemental Data<br />
Net Assets, End of Year (in millions) $ 51.6 $ 557.9 $ 262.6 $ 50.5 $ 21.7<br />
Ratio of Gross Expenses to Average Net Assets # .92% .92% 1.07% 1.30% 1.31%<br />
Ratio of Net Expenses to Average Net Assets .92% .91% 1.06% § 1.29% § 1.29% §<br />
Ratio of Net Investment Income (Loss) to<br />
Average Net Assets .70% .65% .33% .53% (.03)%<br />
Portfolio Turnover Rate 41% 26% 56% 24% 21%<br />
See Notes to Financial Highlights 19
Financial Highlights (cont’d)<br />
Class S<br />
Period from<br />
May 1, 2006^<br />
Year Ended December 31, to December 31,<br />
2008 2007 2006<br />
Net Asset Value, Beginning of Period $ 17.86 $ 16.69 $ 15.59<br />
Income From Investment Operations:<br />
Net Investment Income (Loss) ‡ .06 .06 .02<br />
Net Gains or Losses on Securities (both realized and unrealized) (7.06) 1.17 1.08<br />
Total From Investment Operations (7.00) 1.23 1.10<br />
Less Distributions From:<br />
Net Investment Income (.29) (.00) —<br />
Net Capital Gains (1.16) (.06) —<br />
Total Distributions (1.45) (.06) —<br />
Net Asset Value, End of Period $ 9.41 $ 17.86 $ 16.69<br />
Total Return †† (39.43)% 7.37% 7.06%**<br />
Ratios/Supplemental Data<br />
Net Assets, End of Period (in millions) $ 50.1 $ 90.2 $ 91.6<br />
Ratio of Gross Expenses to Average Net Assets # 1.17% 1.17% 1.17%*<br />
Ratio of Net Expenses to Average Net Assets § 1.17% 1.16% 1.16%*<br />
Ratio of Net Investment Income (Loss) to Average Net Assets .40% .37% .16%*<br />
Portfolio Turnover Rate 41% 26% 56% Ø<br />
See Notes to Financial Highlights 20
Notes to Financial Highlights Socially Responsive Portfolio<br />
†† Total return based on per share net asset value reflects the effects of changes in net asset value on the performance<br />
of the Fund during each fiscal period and assumes dividends and other distributions, if any, were reinvested.<br />
Results represent past performance and do not guarantee future results. Current returns may be lower or higher<br />
than the performance data quoted. Investment returns and principal may fluctuate and shares when redeemed may<br />
be worth more or less than original cost. Total return would have been lower if Management had not reimbursed<br />
certain expenses. Total return would have been higher if Management had not recouped previously reimbursed<br />
expenses. The total return information shown does not reflect charges and other expenses that apply to the separate<br />
account or the related insurance policies, and the inclusion of these charges and other expenses would reduce the<br />
total return for all fiscal periods shown.<br />
# The Fund is required to calculate an expense ratio without taking into consideration any expense reductions related<br />
to expense offset arrangements.<br />
§ After reimbursement of expenses by Management. Had Management not undertaken such action, the annualized<br />
ratios of net expenses to average daily net assets would have been:<br />
Year Ended December 31,<br />
2008 2007 2006 2005 2004<br />
Socially Responsive Portfolio Class I — — — 1.33% 1.73%<br />
Socially Responsive Portfolio Class S 1.26% — 1.18% (1) — —<br />
(1) Period from May 1, 2006 to December 31, 2006.<br />
After reimbursement of expenses previously paid by Management. Had Management not been reimbursed, the<br />
annualized ratio of net expenses to average daily net assets would have been:<br />
Year Ended December 31,<br />
2007 2006<br />
Socially Responsive Portfolio Class I — 0.97%<br />
Socially Responsive Portfolio Class S 1.16% —<br />
‡ Calculated based on the average number of shares outstanding during each fiscal period.<br />
^<br />
The date investment operations commenced.<br />
Ø Portfolio turnover is calculated at the Fund level. Percentage indicated was calculated for year ended December 31,<br />
2006.<br />
* <strong>Annual</strong>ized.<br />
** Not annualized.<br />
21
Report of Independent Registered Public Accounting Firm<br />
To the Board of Trustees of<br />
Neuberger Berman Advisers Management Trust and<br />
Shareholders of Socially Responsive Portfolio<br />
We have audited the accompanying statement of assets and liabilities, including the schedule of investments, of Socially<br />
Responsive Portfolio, one of the series constituting Neuberger Berman Advisers Management Trust (the “Trust”), as of<br />
December 31, 2008, and the related statement of operations for the year then ended, the statement of changes in net assets<br />
for each of the two years in the period then ended, and the financial highlights for each of the five years in the period then<br />
ended. These financial statements and financial highlights are the responsibility of the Trust’s management. Our<br />
responsibility is to express an opinion on these financial statements and financial highlights based on our audits.<br />
We conducted our audits in accordance with the standards of the Public Company Accounting Oversight Board (United<br />
States). Those standards require that we plan and perform the audit to obtain reasonable assurance about whether the<br />
financial statements and financial highlights are free of material misstatement. We were not engaged to perform an audit<br />
of the Trust’s internal control over financial reporting. Our audits included consideration of internal control over<br />
financial reporting as a basis for designing audit procedures that are appropriate in the circumstances, but not for the<br />
purpose of expressing an opinion on the effectiveness of the Trust’s internal control over financial reporting. Accordingly,<br />
we express no such opinion. An audit also includes examining, on a test basis, evidence supporting the amounts and<br />
disclosures in the financial statements and financial highlights, assessing the accounting principles used and significant<br />
estimates made by management, and evaluating the overall financial statement presentation. Our procedures included<br />
confirmation of securities owned as of December 31, 2008 by correspondence with the custodian and brokers. We believe<br />
that our audits provide a reasonable basis for our opinion.<br />
In our opinion, the financial statements and financial highlights referred to above present fairly, in all material respects,<br />
the financial position of Socially Responsive Portfolio, a series of Neuberger Berman Advisers Management Trust, at<br />
December 31, 2008, the results of its operations for the year then ended, the changes in its net assets for each of the<br />
two years in the period then ended, and the financial highlights for each of the five years in the period then ended, in<br />
conformity with U.S. generally accepted accounting principles.<br />
Boston, Massachusetts<br />
February 9, 2009<br />
22
Trustee and Officer Information<br />
The following tables set forth information concerning the trustees and officers of the Trust. All persons named as trustees<br />
and officers also serve in similar capacities for other funds administered or managed by Neuberger Berman Management LLC<br />
(“NB Management”) and Neuberger Berman, LLC (“Neuberger Berman”). The Statement of Additional Information includes<br />
additional information about fund trustees and is available upon request, without charge, by calling (800) 877-9700.<br />
Information about the Board of Trustees<br />
Name, (Year of Birth), Position and Principal Occupation(s) (3) Number of Other Directorships<br />
and Address (1) Length of Funds in Fund Held Outside Fund<br />
Time Served (2) Complex Complex by Fund<br />
Overseen by Trustee<br />
Fund Trustee<br />
Independent Fund Trustees<br />
John Cannon (1930)<br />
Trustee since<br />
2000<br />
Consultant; formerly,<br />
Chairman, CDC Investment<br />
Advisers (registered<br />
investment adviser), 1993 to<br />
January 1999; formerly,<br />
President and Chief Executive<br />
Officer, AMA Investment<br />
Advisors, an affiliate of the<br />
American Medical Association.<br />
56<br />
Independent Trustee or<br />
Director of three series of<br />
Oppenheimer Funds:<br />
Oppenheimer Limited Term<br />
New York Municipal Fund,<br />
Rochester Fund Municipals,<br />
and Oppenheimer<br />
Convertible Securities Fund<br />
since 1992.<br />
Faith Colish (1935)<br />
Trustee since<br />
1982<br />
Counsel, Carter Ledyard &<br />
Milburn LLP (law firm) since<br />
October 2002; formerly,<br />
Attorney-at-Law and<br />
President, Faith Colish,<br />
A Professional Corporation,<br />
1980 to 2002.<br />
56<br />
Formerly, Director (1997 to<br />
2003) and Advisory<br />
Director (2003 to 2006),<br />
ABA Retirement Funds<br />
(formerly, American Bar<br />
Retirement Association)<br />
(not-for-profit membership<br />
corporation).<br />
Martha C. Goss (1949)<br />
Trustee since<br />
2007<br />
President, Woodhill<br />
Enterprises Inc./Chase Hollow<br />
Associates LLC (personal<br />
investment vehicle), since<br />
2006; Chief Operating and<br />
Financial Officer, Hopewell<br />
Holdings LLC/ Amwell<br />
Holdings, LLC (a holding<br />
company for a healthcare<br />
reinsurance company startup),<br />
since 2003; formerly,<br />
Consultant, Resources<br />
Connection (temporary<br />
staffing), 2002 to 2006.<br />
56<br />
Director, Ocwen Financial<br />
Corporation (mortgage<br />
servicing), since 2005;<br />
Director, American Water<br />
(water utility), since 2003;<br />
Director, Channel<br />
Reinsurance (financial<br />
guaranty reinsurance), since<br />
2006; Advisory Board<br />
Member, Attensity<br />
(software developer), since<br />
2005; Director, Allianz Life<br />
of New York (insurance),<br />
since 2005; Director,<br />
Financial Women’s<br />
Association of New York<br />
(not for profit association),<br />
since 2003; Trustee<br />
Emerita, Brown University,<br />
since 1998.<br />
23
Name, (Year of Birth), Position and Principal Occupation(s) (3) Number of Other Directorships<br />
and Address (1) Length of Funds in Fund Held Outside Fund<br />
Time Served (2) Complex Complex by Fund<br />
Overseen by Trustee<br />
Fund Trustee<br />
C. Anne Harvey (1937)<br />
Trustee since<br />
1998<br />
President, C.A. Harvey<br />
Associates, since<br />
October 2001; formerly,<br />
Director, AARP, 1978 to<br />
December 2001.<br />
56<br />
Formerly, President, Board<br />
of Associates to The<br />
National Rehabilitation<br />
Hospital’s Board of<br />
Directors, 2001 to 2002;<br />
formerly, Member,<br />
Individual Investors<br />
Advisory Committee to the<br />
New York Stock Exchange<br />
Board of Directors, 1998 to<br />
June 2002.<br />
Robert A. Kavesh (1927)<br />
Trustee since<br />
2000<br />
Retired; Marcus Nadler<br />
Professor Emeritus of Finance<br />
and Economics, New York<br />
University Stern School of<br />
Business; formerly, Executive<br />
Secretary-Treasurer, American<br />
Finance Association, 1961 to<br />
1979.<br />
56<br />
Formerly, Director, The<br />
Caring Community (notfor-profit),<br />
1997 to 2006;<br />
formerly, Director,<br />
DEL Laboratories, Inc.<br />
(cosmetics and<br />
pharmaceuticals), 1978 to<br />
2004; formerly, Director,<br />
Apple Bank for Savings,<br />
1979 to 1990; formerly,<br />
Director, Western Pacific<br />
Industries, Inc., 1972 to<br />
1986 (public company).<br />
Michael M. Knetter (1960)<br />
Trustee since<br />
2007<br />
Dean, School of Business,<br />
University of Wisconsin -<br />
Madison; formerly, Professor<br />
of International Economics<br />
and Associate Dean, Amos<br />
Tuck School of Business -<br />
Dartmouth College, 1998 to<br />
2002.<br />
56<br />
Trustee, <strong>Northwestern</strong><br />
<strong>Mutual</strong> Series Fund, Inc.,<br />
since February 2007;<br />
Director, Wausau Paper,<br />
since 2005; Director, Great<br />
Wolf Resorts, since 2004.<br />
Howard A. Mileaf (1937)<br />
Trustee since<br />
1999<br />
Retired; formerly, Vice<br />
President and General<br />
Counsel, WHX Corporation<br />
(holding company), 1993 to<br />
2001.<br />
56<br />
Formerly, Director,<br />
Webfinancial Corporation<br />
(holding company), 2002<br />
to 2008; formerly, Director<br />
WHX Corporation (holding<br />
company), January 2002 to<br />
June 2005; formerly,<br />
Director, State Theatre of<br />
New Jersey (not-for-profit<br />
theater), 2000 to 2005.<br />
24
Name, (Year of Birth), Position and Principal Occupation(s) (3) Number of Other Directorships<br />
and Address (1) Length of Funds in Fund Held Outside Fund<br />
Time Served (2) Complex Complex by Fund<br />
Overseen by Trustee<br />
Fund Trustee<br />
George W. Morriss (1947)<br />
Trustee since<br />
2007<br />
Retired; formerly, Executive<br />
Vice President and Chief<br />
Financial Officer, People’s<br />
Bank, Connecticut (a financial<br />
services company), 1991 to<br />
2001.<br />
56<br />
Manager, Old <strong>Mutual</strong> 2100<br />
fund complex (consisting of<br />
six funds) since<br />
October 2006 for four<br />
funds and since<br />
February 2007 for two<br />
funds; formerly, Member<br />
NASDAQ Issuers’ Affairs<br />
Committee, 1995 to 2003.<br />
Edward I. O’Brien (1928)<br />
Trustee since<br />
2000<br />
Retired; formerly, Member,<br />
Investment Policy Committee,<br />
Edward Jones, 1993 to 2001;<br />
President, Securities Industry<br />
Association (“SIA”) (securities<br />
industry’s representative in<br />
government relations and<br />
regulatory matters at the<br />
federal and state levels), 1974<br />
to 1992; Adviser to SIA,<br />
November 1992 to<br />
November 1993.<br />
56<br />
Formerly, Director, Legg<br />
Mason, Inc. (financial<br />
services holding company),<br />
1993 to July 2008;<br />
formerly, Director, Boston<br />
Financial Group (real estate<br />
and tax shelters), 1993 to<br />
1999.<br />
William E. Rulon (1932)<br />
Trustee since<br />
2000<br />
Retired; formerly, Senior Vice<br />
President, Foodmaker, Inc.<br />
(operator and franchiser of<br />
restaurants), until<br />
January 1997.<br />
56<br />
Formerly, Director, Pro-Kids<br />
Golf and Learning<br />
Academy (teach golf and<br />
computer usage to “at<br />
risk” children), 1998 to<br />
2006; formerly, Director,<br />
Prandium, Inc.<br />
(restaurants), March 2001<br />
to July 2002.<br />
Cornelius T. Ryan (1931)<br />
Trustee since<br />
2000<br />
Founding General Partner,<br />
Oxford Partners and Oxford<br />
Bioscience Partners (venture<br />
capital investing) and<br />
President, Oxford Venture<br />
Corporation, since 1981.<br />
56<br />
None.<br />
25
Name, (Year of Birth), Position and Principal Occupation(s) (3) Number of Other Directorships<br />
and Address (1) Length of Funds in Fund Held Outside Fund<br />
Time Served (2) Complex Complex by Fund<br />
Overseen by Trustee<br />
Fund Trustee<br />
Tom D. Seip (1950)<br />
Trustee since<br />
2000;<br />
Chairman of<br />
the Board<br />
since 2008;<br />
Lead<br />
Independent<br />
Trustee from<br />
2006 to 2008<br />
General Partner, Seip<br />
Investments LP (a private<br />
investment partnership);<br />
formerly, President and CEO,<br />
Westaff, Inc. (temporary<br />
staffing), May 2001 to<br />
January 2002; formerly, Senior<br />
Executive at the Charles<br />
Schwab Corporation, 1983 to<br />
1998, including Chief<br />
Executive Officer, Charles<br />
Schwab Investment<br />
Management, Inc., and<br />
Trustee, Schwab Family of<br />
Funds and Schwab<br />
Investments, 1997 to 1998,<br />
and Executive Vice President-<br />
Retail Brokerage, Charles<br />
Schwab & Co., Inc., 1994 to<br />
1997.<br />
56<br />
Director, H&R Block, Inc.<br />
(financial services<br />
company), since May 2001;<br />
Chairman, Compensation<br />
Committee, H&R Block,<br />
Inc., since 2006; formerly,<br />
Director, Forward<br />
Management, Inc. (asset<br />
management company),<br />
1999 to 2006.<br />
Candace L. Straight (1947)<br />
Trustee since<br />
1999<br />
Private investor and consultant<br />
specializing in the insurance<br />
industry; formerly, Advisory<br />
Director, Securitas Capital LLC<br />
(a global private equity<br />
investment firm dedicated to<br />
making investments in the<br />
insurance sector), 1998 to<br />
December 2003.<br />
56<br />
Director, Montpelier Re<br />
(reinsurance company),<br />
since 2006; formerly,<br />
Director, National Atlantic<br />
Holdings Corporation<br />
(property and casualty<br />
insurance company), 2004<br />
to 2008; formerly, Director,<br />
The Proformance Insurance<br />
Company (property and<br />
casualty insurance<br />
company), 2004 to 2008;<br />
formerly, Director,<br />
Providence Washington<br />
Insurance Company<br />
(property and casualty<br />
insurance company),<br />
December 1998 to<br />
March 2006; formerly,<br />
Director, Summit Global<br />
Partners (insurance<br />
brokerage firm), 2000 to<br />
2005.<br />
Peter P. Trapp (1944)<br />
Trustee since<br />
1984<br />
Retired; formerly, Regional<br />
Manager for Mid-Southern<br />
Region, Ford Motor Credit<br />
Company, September 1997 to<br />
2007; formerly, President,<br />
Ford Life Insurance Company,<br />
April 1995 to August 1997.<br />
56<br />
None.<br />
26
Name, (Year of Birth), Position and Principal Occupation(s) (3) Number of Other Directorships<br />
and Address (1) Length of Funds in Fund Held Outside Fund<br />
Time Served (2) Complex Complex by Fund<br />
Overseen by Trustee<br />
Fund Trustee<br />
Fund Trustees who are “Interested Persons”<br />
Jack L. Rivkin* (1940)<br />
Trustee since<br />
2002;<br />
President from<br />
2002 to 2008<br />
Formerly, Executive Vice<br />
President and Chief<br />
Investment Officer, Neuberger<br />
Berman Holdings LLC (holding<br />
company), 2002 to<br />
August 2008 and 2003 to<br />
August 2008, respectively;<br />
formerly, Managing Director<br />
and Chief Investment Officer,<br />
Neuberger Berman,<br />
December 2005 to<br />
August 2008 and 2003 to<br />
August 2008, respectively;<br />
formerly, Executive Vice<br />
President, Neuberger Berman,<br />
December 2002 to 2005;<br />
formerly, Director and<br />
Chairman, NB Management,<br />
December 2002 to<br />
August 2008; formerly,<br />
Executive Vice President,<br />
Citigroup Investments, Inc.,<br />
September 1995 to<br />
February 2002; formerly,<br />
Executive Vice President,<br />
Citigroup Inc.,<br />
September 1995 to<br />
February 2002.<br />
56<br />
Director, Dale Carnegie and<br />
Associates, Inc. (private<br />
company), since 1998;<br />
Director, Solbright, Inc.<br />
(private company), since<br />
1998.<br />
27
Name, (Year of Birth), Position and Principal Occupation(s) (3) Number of Other Directorships<br />
and Address (1) Length of Funds in Fund Held Outside Fund<br />
Time Served (2) Complex Complex by Fund<br />
Overseen by Trustee<br />
Fund Trustee<br />
Robert Conti* (1956)<br />
Chief<br />
Executive<br />
Officer,<br />
President and<br />
Director since<br />
2008; prior<br />
thereto,<br />
Executive Vice<br />
President in<br />
2008 and Vice<br />
President<br />
2000 to 2008<br />
Managing Director, Neuberger<br />
Berman, since 2007; formerly,<br />
Senior Vice President,<br />
Neuberger Berman, 2003 to<br />
2006; formerly, Vice President,<br />
Neuberger Berman, 1999 to<br />
2003; President and Chief<br />
Executive Officer, NB<br />
Management, since 2008;<br />
formerly, Senior Vice<br />
President, NB Management,<br />
2000 to 2008.<br />
56<br />
Chairman of the Board,<br />
Staten Island Mental Health<br />
Society since 2008.<br />
(1) The business address of each listed person is 605 Third Avenue, New York, New York 10158.<br />
(2) Pursuant to the Trust’s Trust Instrument, each Fund Trustee shall hold office for life or until his or her successor is<br />
elected or the Trust terminates; except that (a) any Fund Trustee may resign by delivering a written resignation;<br />
(b) any Fund Trustee may be removed with or without cause at any time by a written instrument signed by at least<br />
two-thirds of the other Fund Trustees; (c) any Fund Trustee who requests to be retired, or who has become unable<br />
to serve, may be retired by a written instrument signed by a majority of the other Fund Trustees; and (d) any Fund<br />
Trustee may be removed at any shareholder meeting by a vote of at least two-thirds of the outstanding shares.<br />
(3) Except as otherwise indicated, each individual has held the positions shown for at least the last five years.<br />
* Indicates a Fund Trustee who is an “interested person” within the meaning of the 1940 Act. Mr. Conti is an<br />
interested person of the Trust by virtue of the fact that he is an officer of NB Management and Neuberger Berman.<br />
Mr. Rivkin may be deemed an interested person of the Trust by virtue of the fact that, until August 2008, he was a<br />
director of NB Management and an officer of Neuberger Berman.<br />
28
Information about the Officers of the Trust<br />
Name, (Year of Birth), Position and Principal Occupation(s) (3)<br />
and Address (1)<br />
Length of Time<br />
Served (2)<br />
Andrew B. Allard (1961)<br />
Anti-Money<br />
Laundering<br />
Compliance<br />
Officer since<br />
2002<br />
Senior Vice President, Neuberger Berman, since 2006; Deputy General<br />
Counsel, Neuberger Berman, since 2004; formerly, Vice President,<br />
Neuberger Berman, 2000 to 2005; formerly, Associate General Counsel,<br />
Neuberger Berman, 1999 to 2004; Anti-Money Laundering Compliance<br />
Officer, eleven registered investment companies for which NB Management<br />
acts as investment manager and administrator (six since 2002, two since 2003,<br />
two since 2004 and one since 2006).<br />
Michael J. Bradler (1970)<br />
Claudia A. Brandon (1956)<br />
Maxine L. Gerson (1950)<br />
Sheila R. James (1965)<br />
Assistant<br />
Treasurer since<br />
2005<br />
Executive Vice<br />
President since<br />
2008 and<br />
Secretary since<br />
1985<br />
Executive Vice<br />
President since<br />
2008 and<br />
Chief Legal<br />
Officer since<br />
2005 (only for<br />
purposes of<br />
sections 307<br />
and 406 of<br />
the Sarbanes-<br />
Oxley Act of<br />
2002)<br />
Assistant<br />
Secretary since<br />
2002<br />
Vice President, Neuberger Berman, since 2006; Employee, NB Management,<br />
since 1997; Assistant Treasurer, eleven registered investment companies for<br />
which NB Management acts as investment manager and administrator<br />
(ten since 2005 and one since 2006).<br />
Senior Vice President, Neuberger Berman, since 2007 and Employee since 1999;<br />
formerly, Vice President, Neuberger Berman, 2002 to 2006; Senior Vice<br />
President, NB Management, since 2008 and Assistant Secretary since 2004;<br />
formerly, Vice President-<strong>Mutual</strong> Fund Board Relations, NB Management, 2000 to<br />
2008; Executive Vice President, eleven registered investment companies for<br />
which NB Management acts as investment manager and administrator (eleven<br />
since 2008); Secretary, eleven registered investment companies for which<br />
NB Management acts as investment manager and administrator (three since<br />
1985, three since 2002, two since 2003, two since 2004 and one since 2006).<br />
Senior Vice President, Neuberger Berman, since 2002; Deputy General<br />
Counsel and Assistant Secretary, Neuberger Berman, since 2001; Senior Vice<br />
President, NB Management, since 2006; Secretary and General Counsel,<br />
NB Management, since 2004; Executive Vice President, eleven registered<br />
investment companies for which NB Management acts as investment<br />
manager and administrator (eleven since 2008); Chief Legal Officer (only for<br />
purposes of sections 307 and 406 of the Sarbanes-Oxley Act of 2002),<br />
eleven registered investment companies for which NB Management acts as<br />
investment manager and administrator (ten since 2005 and one since 2006).<br />
Vice President, Neuberger Berman, since 2008 and Employee since 1999;<br />
formerly, Assistant Vice President, Neuberger Berman, 2007; Assistant<br />
Secretary, eleven registered investment companies for which NB Management<br />
acts as investment manager and administrator (six since 2002, two since<br />
2003, two since 2004 and one since 2006).<br />
Brian Kerrane (1969)<br />
Vice President<br />
since 2008<br />
Senior Vice President, Neuberger Berman, since 2006; formerly, Vice<br />
President, Neuberger Berman, 2002 to 2006; Vice President, NB Management,<br />
since 2008 and Employee since 1991; Vice President, eleven registered<br />
investment companies for which NB Management acts as investment<br />
manager and administrator (eleven since 2008).<br />
29
Name, (Year of Birth), Position and Principal Occupation(s) (3)<br />
and Address (1)<br />
Length of Time<br />
Served (2)<br />
Kevin Lyons (1955)<br />
Assistant<br />
Secretary since<br />
2003<br />
Assistant Vice President, Neuberger Berman, since 2008 and Employee<br />
since 1999; Assistant Secretary, eleven registered investment companies for<br />
which NB Management acts as investment manager and administrator (eight<br />
since 2003, two since 2004 and one since 2006).<br />
Owen F. McEntee, Jr. (1961)<br />
Vice President<br />
since 2008<br />
Vice President, Neuberger Berman, since 2006; Employee, NB Management,<br />
since 1992; Vice President, eleven registered investment companies for<br />
which NB Management acts as investment manager and administrator<br />
(eleven since 2008).<br />
John M. McGovern (1970)<br />
Treasurer and<br />
Principal<br />
Financial and<br />
Accounting<br />
Officer since<br />
2005; prior<br />
thereto,<br />
Assistant<br />
Treasurer since<br />
2002<br />
Senior Vice President, Neuberger Berman, since 2007; formerly, Vice<br />
President, Neuberger Berman, 2004 to 2006; Employee, NB Management,<br />
since 1993; Treasurer and Principal Financial and Accounting Officer, eleven<br />
registered investment companies for which NB Management acts as<br />
investment manager and administrator (ten since 2005 and one since 2006);<br />
formerly, Assistant Treasurer, eleven registered investment companies for<br />
which NB Management acts as investment manager and administrator,<br />
2002 to 2005.<br />
Andrew Provencher (1965)<br />
Vice President<br />
since 2008<br />
Managing Director, NB Management, since 2008; Managing Director,<br />
Neuberger Berman, since 2005; formerly, Senior Vice President, Neuberger<br />
Berman, 2003 to 2005; formerly, Vice President, Neuberger Berman,<br />
1999 to 2003; Vice President, eleven registered investment companies for<br />
which NB Management acts as investment manager and administrator<br />
(eleven since 2008).<br />
Frank Rosato (1971)<br />
Assistant<br />
Treasurer since<br />
2005<br />
Vice President, Neuberger Berman, since 2006; Employee, NB Management,<br />
since 1995; Assistant Treasurer, eleven registered investment companies for<br />
which NB Management acts as investment manager and administrator<br />
(ten since 2005 and one since 2006).<br />
Neil S. Siegel (1967)<br />
Vice President<br />
since 2008<br />
Managing Director, NB Management, since 2008; Managing Director,<br />
Neuberger Berman, since 2006; formerly, Senior Vice President, Neuberger<br />
Berman, 2004 to 2006; Vice President, eleven registered investment<br />
companies for which NB Management acts as investment manager and<br />
administrator (eleven since 2008); formerly, Head of Institutional Marketing,<br />
Morgan Stanley Investment Management, 1993 to 2004.<br />
30
Name, (Year of Birth), Position and Principal Occupation(s) (3)<br />
and Address (1)<br />
Length of Time<br />
Served (2)<br />
Chamaine Williams (1971)<br />
Chief<br />
Compliance<br />
Officer since<br />
2005<br />
Senior Vice President, Neuberger Berman, since 2007; Chief Compliance<br />
Officer, NB Management, since 2006; Senior Vice President, Lehman<br />
Brothers Inc., since 2007; formerly, Vice President, Lehman Brothers Inc.,<br />
2003 to 2006; Chief Compliance Officer, eleven registered investment<br />
companies for which NB Management acts as investment manager and<br />
administrator (ten since 2005 and one since 2006); formerly, Chief<br />
Compliance Officer, Lehman Brothers Asset Management Inc., 2003 to<br />
2007; formerly, Chief Compliance Officer, Lehman Brothers Alternative<br />
Investment Management LLC, 2003 to 2007; formerly, Vice President,<br />
UBS Global Asset Management (US) Inc. (formerly, Mitchell Hutchins Asset<br />
Management, a wholly-owned subsidiary of PaineWebber Inc.), 1997 to 2003.<br />
(1) The business address of each listed person is 605 Third Avenue, New York, New York 10158.<br />
(2) Pursuant to the By-Laws of the Trust, each officer elected by the Fund Trustees shall hold office until his or her<br />
successor shall have been elected and qualified or until his or her earlier death, inability to serve, or resignation.<br />
Officers serve at the pleasure of the Fund Trustees and may be removed at any time with or without cause.<br />
(3) Except as otherwise indicated, each individual has held the positions shown for at least the last five years.<br />
31
Proxy Voting Policies and Procedures<br />
A description of the policies and procedures that the Trust uses to determine how to vote proxies relating to portfolio<br />
securities is available, without charge, by calling 1-800-877-9700 (toll-free) and on the website of the Securities and<br />
Exchange Commission, at www.sec.gov. Information regarding how the Trust voted proxies relating to portfolio securities<br />
during the most recent 12-month period ended June 30 is also available, without charge, by calling 1-800-877-9700<br />
(toll-free), on the website of the Securities and Exchange Commission at www.sec.gov, and on Management’s website at<br />
www.nb.com.<br />
Quarterly Portfolio Schedule<br />
The Trust files a complete schedule of portfolio holdings for the Fund with the Securities and Exchange Commission for<br />
the first and third quarters of each fiscal year on Form N-Q. The Trust’s Forms N-Q are available on the Securities and<br />
Exchange Commission’s website at www.sec.gov and may be reviewed and copied at the Securities and Exchange<br />
Commission’s Public Reference Room in Washington, DC. Information on the operation of the Public Reference<br />
Room may be obtained by calling 1-800-SEC-0330. The information on Form N-Q is available upon request, without<br />
charge, by calling 1-800-877-9700 (toll free).<br />
Notice to Shareholders (Unaudited)<br />
The Fund hereby designates $9,945,036 as a capital gain distribution.<br />
100.00% of the dividends distributed during the fiscal year ended December 31, 2008 qualifies for the dividends received<br />
deduction for corporate shareholders.<br />
Board Consideration of the Management and Sub-Advisory Agreements<br />
At a meeting held on September 25, 2008, the Board of Trustees of Neuberger Berman Advisers Management Trust<br />
(“Board”), including the Trustees who are not “interested persons” of Neuberger Berman Management LLC<br />
(“Management”) or Neuberger Berman Advisers Management Trust (“Independent Fund Trustees”), approved the<br />
continuance of the Management and Sub-Advisory Agreements (“Agreements”) between Management and Socially<br />
Responsive Portfolio (“Fund”).<br />
In evaluating the Agreements, the Board, including the Independent Fund Trustees, reviewed materials furnished by<br />
Management and Neuberger Berman, LLC (“Neuberger”) in response to questions submitted by counsel to the<br />
Independent Fund Trustees, and met with senior representatives of Management and Neuberger regarding their<br />
personnel and operations. The Independent Fund Trustees were advised by counsel that is experienced in Investment<br />
Company Act of 1940 matters and that is independent of Management and Neuberger. The Independent Fund Trustees<br />
received a memorandum from independent counsel discussing the legal standards for their consideration of the proposed<br />
continuance of the Agreements. They met with such counsel separately from representatives of Management to discuss<br />
the annual contract review. The annual contract review extends over two regular meetings of the Board to ensure that<br />
Management and Neuberger have time to respond to any questions the Independent Fund Trustees may have on their<br />
initial review of the report and that the Independent Fund Trustees have time to consider those responses. In addition,<br />
during this process, the Board held a separate meeting devoted primarily to reviewing and discussing Fund performance.<br />
The Board considered the following factors, among others, in connection with its approval of the continuance of the<br />
Agreements: (1) the nature, extent, and quality of the services provided by Management and Neuberger; (2) the<br />
performance of the Fund compared to a relevant market index and a peer group of investment companies; (3) the costs of<br />
the services provided and profits or losses realized by Management and its affiliates from their relationship with the Fund;<br />
(4) the extent to which economies of scale might be realized as the Fund grows; and (5) whether fee levels reflect any such<br />
32
potential economies of scale for the benefit of investors in the Fund. In their deliberations, the Board members did not<br />
identify any particular information that was all-important or controlling, and each Trustee may have attributed different<br />
weights to the various factors.<br />
The Board considered the continued integrity of Management and Neuberger as organizations, despite the bankruptcy<br />
filing by Lehman Brothers Holdings Inc. The Board discussed the efforts made by Management and Neuberger to retain<br />
employees, and the reported likelihood that such employees would be retained. The Board discussed the provisions that<br />
were being made for ancillary services by Management, Neuberger and their affiliates.<br />
The Board evaluated the terms of the Agreements, the overall fairness of the Agreements to the Fund and whether the<br />
Agreements were in the best interests of the Fund and its shareholders.<br />
With respect to the nature, extent and quality of the services provided, the Board considered the performance of the Fund<br />
and the experience and staffing of the portfolio management and investment research personnel who perform services for<br />
the Fund. The Board noted that Management also provides certain administrative services, including fund accounting<br />
and compliance oversight. The Board also considered Management’s and Neuberger’s policies and practices regarding<br />
brokerage. The Board considered the quality of brokerage execution obtained by Management. The Board’s Portfolio<br />
Transactions and Pricing Committee from time to time reviewed the quality of the brokerage services that Neuberger and<br />
Lehman Brothers Inc. had provided, and periodically reviews studies by an independent firm engaged to review and<br />
evaluate the quality of brokerage execution received by the Fund. The Board also reviewed whether Management and<br />
Neuberger used brokers to execute Fund transactions that provide research and other services to Management and<br />
Neuberger, and the types of benefits potentially derived from such services by Management, Neuberger, the Fund and<br />
other clients of Management and Neuberger. In addition, the Board noted the positive compliance history of<br />
Management and Neuberger, as each firm has been free of significant compliance problems.<br />
The Board considered the performance of the Fund relative to its benchmark and a peer group of investment companies<br />
dedicated to insurance products pursuing broadly similar strategies. The Board also considered performance in relation<br />
to the degree of risk undertaken by the portfolio managers. The Board discussed the Fund’s performance with Management<br />
and discussed steps that Management had taken, or intended to take, to improve the Fund’s performance. The Board also<br />
considered Management’s resources and responsiveness with respect to the Fund.<br />
With respect to the overall fairness of the Agreements, the Board considered the fee structure for the Fund under the<br />
Agreements as compared to a peer group of comparable funds dedicated to insurance products and any fall-out benefits<br />
likely to accrue to Management or Neuberger or their affiliates from their relationship with the Fund. The Board also<br />
considered the profitability of Management and its affiliates from their association with the Fund.<br />
The Board reviewed a comparison of the Fund’s management fee and overall expense ratio to a peer group of broadly<br />
comparable funds dedicated to insurance products. The Board considered the mean and median of the management fees<br />
and expense ratios of the peer group. The Board noted that the Fund’s management fee was higher than the peer group<br />
mean and median. The Board considered whether specific portfolio management or administration needs contributed to<br />
the higher fee. With regard to the sub-advisory fee paid to Neuberger, the Board noted that this fee is “at cost.” In<br />
addition, the Board considered the contractual limit on Fund expenses undertaken by Management. The Board noted<br />
that Management incurred a loss on the Fund in 2005.<br />
The Board considered whether there were other funds that were advised or sub-advised by Management or its affiliates or<br />
separate accounts managed by Management or its affiliates with similar investment objectives, policies and strategies to<br />
the Fund. The Board compared the fees charged to the Fund at various asset levels to the fees charged to an advised fund,<br />
a sub-advised fund and a separate account, each managed in a similar style to the Fund. The Board considered the<br />
appropriateness and reasonableness of any differences between the fees charged to the Fund and the other funds and<br />
account and determined that the differences in fees were consistent with the management and other services provided.<br />
The Board also evaluated any apparent or anticipated economies of scale in relation to the services Management provides<br />
to the Fund. The Board considered that the Fund’s fee structure which provides for a reduction of payments resulting<br />
from the use of breakpoints and whether those breakpoints are set at appropriate asset levels.<br />
33
In concluding that the benefits accruing to Management and its affiliates by virtue of their relationship to the Fund were<br />
reasonable in comparison with the costs of providing the investment advisory services and the benefits accruing to the<br />
Fund, the Board reviewed specific data as to Management’s profit on the Fund for a recent period and the trend in profit<br />
or loss over recent years. The Board also carefully examined Management’s cost allocation methodology and in recent<br />
years had an independent consultant review the methodology. It also reviewed an analysis from an independent data<br />
service on profitability margins in the investment management industry. The Board recognized that Management should<br />
be entitled to earn a reasonable level of profits for services it provides to the Fund and, based on its review, concluded that<br />
Management’s level of profitability was not excessive.<br />
Conclusions<br />
In approving the Agreements, the Board concluded that the terms of each Agreement are fair and reasonable and that<br />
approval of the Agreements is in the best interests of the Fund and its shareholders. In reaching this determination, the<br />
Board considered that Management and Neuberger could be expected to provide a high level of service to the Fund; that<br />
it retained confidence in Management’s and Neuberger’s capabilities to manage the Fund; that the Fund’s fee structure<br />
appeared to the Board to be reasonable given the nature and quality of services provided; and that the benefits accruing to<br />
Management and its affiliates by virtue of their relationship to the Fund were reasonable in comparison with the benefits<br />
accruing to the Fund.<br />
Board Consideration of New and Interim Management and Sub-Advisory Agreements<br />
Lehman Brothers Holdings Inc. (“Lehman Brothers”) has entered into an agreement to sell a controlling interest in the<br />
Fund’s investment adviser. Under the agreement, Lehman Brothers would sell substantially all of the Neuberger Berman<br />
business and the fixed income business and certain alternative asset management businesses of Lehman Brother’s<br />
Investment Management Division (collectively, the “Acquired Businesses”) to NBSH Acquisition, LLC (the “Proposed<br />
Acquisition”). NBSH Acquisition, LLC (“NBSH”) was organized by key members of Neuberger Berman’s management for<br />
the purpose of facilitating the acquisition of the Acquired Businesses. At the closing of the Proposed Acquisition, a<br />
majority interest in the Acquired Businesses will be directly or indirectly owned by portfolio managers, Neuberger<br />
Berman’s management team and certain key members and senior professionals of the former Investment Management<br />
Division (“Management Members”), as well as by Lehman Brothers and certain affiliates of Lehman Brothers.<br />
The Acquired Businesses include Neuberger Berman Management LLC (“Management”) and Neuberger Berman, LLC<br />
(“Neuberger”), the adviser and sub-adviser to the Fund, respectively. The Proposed Acquisition has been deemed to result<br />
in an “assignment” of the Fund’s existing Management Agreement and Sub-Advisory Agreement (the “Existing<br />
Agreements”) under the 1940 Act. As required by the 1940 Act, the Fund’s Existing Agreements provide for their<br />
automatic termination in the event of an assignment, and each will terminate upon the consummation of the Proposed<br />
Acquisition. Accordingly, on December 17, 2008, the Board approved new Management and Sub-Advisory Agreements<br />
with Management and Neuberger, respectively, or their successors (together, the “Advisers”), on the same terms and with<br />
the same compensation structure as are currently in effect (together, “New Agreements”), which would take effect upon<br />
consummation of the Proposed Acquisition if approved by the Fund’s shareholders.<br />
If shareholders of the Fund do not approve the New Agreements before the Proposed Acquisition is completed, the Board<br />
has approved interim Management and Sub-Advisory Agreements with Management and Neuberger, respectively, or their<br />
successors (together, “Interim Agreements”) pending approval of the New Agreements by shareholders of the Fund.<br />
Compensation earned by the Advisers under the Interim Agreements would be held in an interest-bearing escrow account<br />
pending shareholder approval of the New Agreements. If shareholders approve the New Agreements within 150 days from<br />
the termination of the Existing Agreements, the amount held in the escrow account, including interest, will be paid to the<br />
Advisers, as appropriate. If shareholders of the Fund do not approve the New Agreements, the Advisers will be paid the<br />
lesser of the costs incurred in performing their services under the Interim Agreements or the total amount in the escrow<br />
account, including interest earned. If at the end of 150 days following termination of a Fund’s Existing Agreements the<br />
Fund’s shareholders still have not approved the New Agreements, the Trustees would take such actions as they deem to be<br />
in the best interests of the Fund and its shareholders, which may include negotiating a new Management Agreement<br />
34
and/or new Sub-Advisory Agreement with an advisory organization selected by the Board of Trustees or making other<br />
arrangements.<br />
The Trustees of the Trust discussed the Proposed Acquisition on December 17, 2008. Prior to submitting its bid to public<br />
auction, Management met telephonically with the Independent Trustees to brief them on the Proposed Acquisition.<br />
Following the public auction wherein NBSH was determined to be the successful bidder, the Independent Trustees again<br />
met telephonically with Management to obtain additional information about the Proposed Acquisition. The Independent<br />
Trustees, with the assistance of independent counsel, prepared due diligence requests that were presented to Management<br />
and appointed a Task Force of Independent Trustees to lead the due diligence effort (“Task Force”).<br />
Management provided written responses to the due diligence requests. After extensive review and analysis and discussions<br />
during a telephonic and in person meeting of the Independent Trustees, the Task Force submitted clarifying questions.<br />
The Independent Trustees met as a body in person to receive the report of the Task Force and consider the New<br />
Agreements. Throughout the process, the Task Force and the Independent Trustees were advised by experienced 1940 Act<br />
counsel that is independent of Management and NBSH. In addition, the Independent Trustees received a memorandum<br />
from independent counsel discussing the legal standards for their consideration of the New Agreements.<br />
Consideration of the New Agreements followed shortly on the heels of the Independent Trustees’ annual consideration of<br />
whether to renew the Existing Agreements, carried out pursuant to Section 15(c) of the 1940 Act. In that process, which<br />
began prior to the June 2008 quarterly meeting of the Board and was concluded at the September 2008 quarterly meeting,<br />
the Independent Trustees, following an extensive review of materials submitted by Management and a report from an<br />
independent data service, unanimously determined that the Existing Agreements were fair and reasonable and that their<br />
renewal would be in the best interests of the Fund and its shareholders. Accordingly, in considering the New Agreements,<br />
the Independent Trustees took into account the fact that the terms of the New Agreements would be identical to those of<br />
the Existing Agreements in every respect except for the term and termination date and potentially the name of the<br />
investment adviser. The Board considerations in connection with the New Agreements and the Existing Agreements also<br />
entered into the decision by the Board to approve the Interim Agreements, which would take effect if the shareholders of<br />
the Fund do not approve the New Agreements before the Proposed Acquisition is completed. The Independent Trustees’<br />
consideration of the Existing Agreements is described above.<br />
In evaluating the proposed New Agreements, the Independent Trustees considered that they have generally been satisfied<br />
with the nature and quality of the services provided to the Fund by Management and Neuberger, including investment<br />
advisory, administrative and support services, and that the Fund would be best served by an arrangement that appeared<br />
likely to maintain the continuity and stability of the providers of these services. Accordingly, the Independent Trustees<br />
considered very carefully the intentions of NBSH (including its successors or assign) regarding capitalization, management<br />
structure, staffing, compensation and staff retention and whether these seemed designed to provide the desired continuity<br />
and stability. They inquired specifically about staffing and resources in the areas of portfolio management, investment<br />
research, trading, fund accounting, legal and compliance, internal audit, and senior executive staff. Although at the time the<br />
Board considered the New Agreements no final decisions had been reached as to the distribution of equity interests in<br />
NBSH (or its successor or assign), the Trustees were advised that senior members of management, including the Fund<br />
Trustee and nominee for Fund Trustee who are employed by the Advisers, would receive equity interests in NBSH. Because<br />
of these interests, as well as any future employment arrangements with the Advisers, these persons, individually or in the<br />
aggregate, could have a material interest in the Proposed Acquisition and in shareholder approval of the New Agreements.<br />
In considering the New Agreements, the Trustees were aware of these interests.<br />
The Independent Trustees inquired whether NBSH (or its successors or assign) had specific plans for the future structure<br />
of the Neuberger Berman Funds, whether they plan to propose to eliminate any Funds, and whether they intend to<br />
continue or alter certain expansion plans that are already underway. They also inquired whether there are plans to change<br />
the fees or expense structure of any of the Funds. The Independent Trustees inquired about the long-term plans for the<br />
Advisers, including any expectations for cost savings or expense reductions. They also inquired about the capital structure<br />
and working capital likely to be available to NBSH (or its successors or assign).<br />
35
The Independent Trustees considered the following factors, in addition to the factors discussed above, among others, in<br />
connection with their consideration of the New Agreements: (1) the nature, extent, and quality of the services provided<br />
by Management and Neuberger; (2) the performance of the Fund compared to a relevant market index and a peer group<br />
of investment companies; (3) the costs of the services provided and profits or losses realized by Management and its<br />
affiliates from their relationship with the Fund; (4) the extent to which economies of scale might be realized as the Fund<br />
grows; and (5) whether fee levels reflect any such potential economies of scale for the benefit of investors in the Fund. In<br />
their deliberations, the Independent Trustees did not identify any particular information that was all important or<br />
controlling, and each Trustee may have attributed different weights to the various factors.<br />
In unanimously approving and recommending the New Agreements, the Independent Trustees concluded that the terms of<br />
each New Agreement are fair and reasonable and that approval of the New Agreements is in the best interests of the Fund and<br />
its shareholders. In reaching this determination, the Independent Trustees considered the following factors, among others:<br />
(1) that the terms of the New Agreements are identical in all material respects to those of the Existing Agreements;<br />
(2) that the Advisers will maintain operational autonomy and continuity of management following the Proposed<br />
Acquisition;<br />
(3) the favorable history, reputation, qualification, and background of Management and Neuberger, as well as the<br />
qualifications of each entity’s personnel and each entity’s respective financial condition;<br />
(4) the commitment of NBSH (or its successors or assign) to retain key personnel currently employed by Management<br />
and Neuberger who currently provide services to the Fund;<br />
(5) the commitment of NBSH (or its successors or assign) to maintaining the current level and quality of Fund services;<br />
(6) the proposed division of equity in NBSH (or its successor or assign) among Management Members and other<br />
personnel upon consummation of the Proposed Acquisition;<br />
(7) the fees and expense ratio of the Fund relative to comparable mutual funds;<br />
(8) that the fees are identical to those paid under the Existing Agreements;<br />
(9) that the fees and expense ratios of the Fund appear to the Board to be reasonable given the quality of services expected<br />
to be provided;<br />
(10) the commitment of Management to maintaining the Fund’s current contractual expense limitation agreements to<br />
ensure that Fund shareholders of funds that have such arrangements in place do not face an increase in expenses upon<br />
consummation of the Proposed Acquisition;<br />
(11) the performance of the Fund relative to comparable mutual funds and unmanaged indices;<br />
(12) the commitment of Management (or its successor) to pay the expenses of the Fund in connection with the Proposed<br />
Acquisition, including all expenses in connection with the solicitation of proxies, so that shareholders of the Fund would<br />
not have to bear such expenses;<br />
(13) the actual and potential effects on the Advisers of the bankruptcy of Lehman Brothers, and the effects of the Lehman<br />
Brothers bankruptcy on the information considered by the Independent Trustees in their prior analyses of the principal<br />
service contracts;<br />
(14) the provisions made to continue providing to the Advisers certain services that were previously provided to them by<br />
or through Lehman Brothers or its other affiliates;<br />
(15) the possible benefits that may be realized by the Fund and by the Advisers as a result of the Proposed Acquisition;<br />
and<br />
(16) that the Proposed Acquisition is expected to maintain continuity of management of the Fund and may reduce the<br />
potential for future vulnerability to changes in control of the Advisers that could be adverse to the Fund’s interests and<br />
that could affect the retention of key employees providing services to the Fund.<br />
36
[THIS PAGE INTENTIONALLY LEFT BLANK]
2008 ANNUAL REPORT<br />
Russell<br />
Investment Funds<br />
DECEMBER 31, 2008<br />
FUND<br />
Multi-Style Equity Fund<br />
Aggressive Equity Fund<br />
Non-U.S. Fund<br />
Core Bond Fund<br />
Real Estate Securities Fund
Russell Investment Funds<br />
Russell Investment Funds is a series<br />
investment company with nine<br />
different investment portfolios<br />
referred to as Funds. These<br />
financial statements report on five<br />
of these Funds.
Russell Investment Funds<br />
<strong>Annual</strong> Report<br />
December 31, 2008<br />
Table of Contents<br />
Page<br />
To Our Shareholders .................................................... 3<br />
Market Summary ....................................................... 4<br />
Multi-Style Equity Fund ................................................ 10<br />
Aggressive Equity Fund ................................................ 20<br />
Non-U.S. Fund ......................................................... 36<br />
Core Bond Fund ........................................................ 52<br />
Real Estate Securities Fund ............................................ 80<br />
Notes to Schedules of Investments ...................................... 88<br />
Statements of Assets and Liabilities ..................................... 89<br />
Statements of Operations ............................................... 91<br />
Statements of Changes in Net Assets .................................... 92<br />
Financial Highlights .................................................... 94<br />
Notes to Financial Highlights ........................................... 96<br />
Notes to Financial Statements ........................................... 97<br />
Report of Independent Registered Public Accounting Firm .............. 114<br />
Tax Information ........................................................ 115<br />
Basis for Approval of Investment Advisory Contracts .................... 116<br />
Shareholder Requests for Additional Information ........................ 120<br />
Disclosure of Information about Fund Trustees and Officers ............. 121<br />
Adviser, Money Managers and Service Providers ........................ 125
Russell Investment Funds<br />
Copyright © Russell Investments 2009. All rights reserved.<br />
Russell Investments is a Washington, USA corporation, which operates through subsidiaries worldwide and is a<br />
subsidiary of The <strong>Northwestern</strong> <strong>Mutual</strong> Life Insurance Company.<br />
Fund objectives, risks, charges and expenses should be carefully considered before<br />
investing. A prospectus containing this and other important information must precede<br />
or accompany this material. Please read the prospectus carefully before investing.<br />
Securities products and services offered through Russell Financial Services, Inc. (effective June 2,<br />
2008, the name changed from Russell Fund Distributors, Inc.), member FINRA, part of Russell<br />
Investments.<br />
Indices and benchmarks are unmanaged and cannot be invested in directly. Returns represent past performance,<br />
are not a guarantee of future performance, and are not indicative of any specific investment. Index return<br />
information is provided by vendors and although deemed reliable, is not guaranteed by Russell Investments or its<br />
affiliates.<br />
Russell Investments is the owner of the trademarks, service marks, and copyrights related to its respective indexes.<br />
Performance quoted represents past performance and does not guarantee future results. The investment return and<br />
principal value of an investment will fluctuate so that shares, when redeemed, may be worth more or less than their<br />
original cost. Current performance may be lower or higher than the performance data quoted.
To Our Shareholders<br />
We are pleased to provide you with the Russell Investment Funds 2008 <strong>Annual</strong> Report. It includes portfolio<br />
management discussions and fund-specific details that will give you an in-depth understanding of fund performance for<br />
the fiscal year ended December 31, 2008.<br />
It would be an understatement to say that 2008 has been a difficult year and the market crisis of the past couple of<br />
months has defied all predictions. Virtually no sector of the financial industry or the economy has been spared.<br />
All of us at Russell want you to know that we are sensitive to investor concerns. While market events have impacted the<br />
performance of the funds, we believe that investors are well-served by remaining focused on long-term disciplined<br />
investing in well-diversified, asset allocated portfolios.<br />
The Russell Investments team has years of experience in managing people’s money through various market cycles,<br />
trends and turnarounds. As always, we are monitoring our investment managers closely to ensure their adherence to their<br />
long-term strategies despite the recent disruptions.<br />
As we all collectively weather this storm, we believe now is the perfect time for you to talk with your financial advisor to<br />
ensure that your portfolio remains aligned with your long term goals.<br />
Each and every day we strive to improve financial security for people. We will not waiver in that commitment and<br />
sincerely appreciate your continued support.<br />
Best regards,<br />
Greg Stark<br />
Chief Executive Officer, Chairman and President<br />
Russell Investment Management Company<br />
To Our Shareholders 3
Russell Investment Funds<br />
Market Summary as of December 31, 2008 (Unaudited)<br />
U.S. Equity Markets<br />
For the fiscal year ending December 31, 2008, U.S. equity markets were remarkably weak, with the broad market<br />
Russell 3000 ® Index posting a 37.3% drop amid the worst financial crisis in almost a century. Major bankruptcies, the<br />
freezing of credit markets, and the widespread global recession fears which ensued — particularly during the third<br />
quarter and first half of the fourth quarter — drove investors to sell riskier assets as fear and panic pervaded the market.<br />
The economic crisis stemmed from issues in the financial sector. The U.S. housing market stood at the center of the<br />
financial sector’s problems. The housing slowdown that began in the summer of 2006 and continued in 2007 intensified<br />
throughout this fiscal year and led to rising loan default rates and home foreclosures which, in turn, led to further<br />
housing weakness. As home prices dropped and default rates increased, the value of derivative instruments, such as<br />
mortgage-backed securities, whose values were based on these mortgages, plummeted. This forced banks to take massive<br />
write-downs of book values as required by mark-to-market accounting. With the lack of certainty about the real book<br />
value of assets on the balance sheets of banks, banks have been unable and/or hesitant to lend funds to other banks.<br />
Despite aggressive interest rate cuts by the Federal Reserve Board (the “Federal Reserve”), which took the Federal<br />
Funds rate from 5.25% (in third quarter 2007) to a range between 0% and 0.25% (at fiscal year end), mortgage and other<br />
lending rates did not come down as quickly as banks used the wider lending spread to offset their substantial writedowns<br />
on book values. Over the last month and a half of the year, however, these rates did start to drop sharply. In<br />
addition to higher interest rates, banks having stricter lending standards had a profound impact on the availability of<br />
affordable credit for potential homebuyers, small businesses, and other borrowers.<br />
Due to write-downs, dwindling capital bases and a crisis of confidence in their businesses, several large banks, brokers,<br />
mortgage companies and insurance companies filed for bankruptcy, were seized by the federal government and resold, or<br />
were bailed out by the government during the fiscal year, with the most notable ones being Countrywide Financial, Bear<br />
Stearns, IndyMac Bancorp, Lehman Brothers, Federal National Mortgage Association (Fannie Mae), Federal Home Loan<br />
Mortgage Corporation (Freddie Mac), American International Group (AIG), Washington <strong>Mutual</strong> and Wachovia. Amid<br />
concerns of additional bankruptcies and uncertainty surrounding which institutions may be bailed out by the<br />
government, the fear-driven environment has persisted. In addition, there have been a number of problems at hedge<br />
funds, leading to massive deleveraging, or forced selling of assets, in order to meet client redemptions. This forced<br />
selling of assets has put severe downward pressure on many securities, particularly the highly-liquid larger cap U.S.<br />
stocks, regardless of those securities’ fundamentals.<br />
After more than four years of strong growth, corporate profits had dipped fairly sharply by the end of 2008, especially in<br />
the financial services sector. The growth rate of gross domestic product also fell, although it stayed marginally positive<br />
until the third quarter report which showed a contraction of 0.5%, the worst since the 2001 recession. There was<br />
significant deterioration since then, as fourth quarter GDP estimates are -4.2% on average. A significant reduction in<br />
consumer spending had the most substantial negative impact on the GDP number, as consumers became fearful due to<br />
rising unemployment levels, declining home values and increased difficulty in getting loans. The Consumer Confidence<br />
Index released by the Conference Board decreased to 38 in October — the lowest value in the history of the Index<br />
(started in February 1967). It increased slightly in November, before dropping back to the all-time low of 38 in<br />
December. The first half of the year also featured the negative impact of higher energy prices on consumer spending. Oil<br />
prices reached $147/barrel in mid-July before dropping sharply to below $40/barrel in December.<br />
Although the domestic economy slowed during the fiscal year, some segments of the U.S. equity market were helped in<br />
the first half of the year by strong exports to faster-growing, developing, non-U.S. economies. With approximately 40% of<br />
U.S. corporations’ revenues derived from international customers, the declining U.S. dollar in the first half of 2008<br />
provided increased demand for U.S. products abroad. During the second half of the year, however, the U.S. dollar rallied<br />
and the global economy slowed considerably. After being rewarded in the first half of 2008, exposure to companies tied<br />
to the global economy underwent a strong reversal that began in July 2008 and has been swift and dramatic. Higher<br />
valuation cyclical (more linked to the economic cycle) companies and those with more debt on their balance sheets were<br />
among the most negatively impacted over the course of the year. Companies that have high forecasted growth rates have<br />
also been hit hard as investors have become less confident that these growth rates can be sustained going forward.<br />
4 Market Summary
Russell Investment Funds<br />
In the wake of these powerful macroeconomic forces, the fiscal year presented a very difficult active management<br />
environment which was marked by three distinct themes: 1) largely indiscriminate selling of U.S. stocks by panic-driven,<br />
risk-averse investors concerned first about a U.S. recession and then about a global recession, 2) intense selling of<br />
financial stocks for a majority of the period, and 3) the strength of global companies for roughly the first half of the fiscal<br />
year as multinational companies with exposure to developing markets outpaced domestically-driven companies and<br />
commodity-related companies (especially energy) outperformed the general market by a wide margin.<br />
The weakening of the global economy over the last half of the year caused oil prices to fall from their record highs and<br />
led the other energy sector to sell off sharply. Over the course of the year, the worst performing sectors in the Russell<br />
3000 ® Index were other energy -53.6%, financial services -51.1%, the other sector (which is dominated by GE and<br />
contains other large conglomerates, (-50.9%), and materials & processing -47.3%. Meanwhile, the best performing<br />
sectors in the Russell 3000 ® Index were those that are considered to be more defensive. The slower-growing, less<br />
economically-sensitive consumer staples sector was the best relative performer -17.7%, followed by integrated oils<br />
-21.7%, health care -22.4%, and utilities -29%.<br />
Weakness was experienced across investment styles as well as the capitalization spectrum. While both the growth and<br />
value investment styles were down substantially, value outperformed growth in the small cap segment (Russell 2000 ®<br />
Value -28.9%, Russell 2000 ® Growth -38.5%) and to a lesser degree in the large cap segment (Russell 1000 ® Value<br />
-36.9%, Russell 1000 ® Growth -38.4%). In general, small cap stocks outperformed large caps (-33.8% and -37.6% for<br />
the Russell 2000 ® Index and Russell 1000 ® Index, respectively). Midcap and microcap stocks underperformed by the<br />
widest margins with the Russell Midcap ® Index down 41.5%, and the Russell Microcap ® Index down 39.8%.<br />
During 2008, the market environment was largely hostile for active management as investors sold stocks regardless of<br />
fundamentals, the basic determinants of a stock’s value. Small cap fund managers had the most difficult time relative to<br />
their benchmark. Growth managers across the capitalization spectrum also struggled as the shift away from higher growth<br />
stocks came quickly and sharply. Core, or market-oriented, managers struggled less than style-focused managers in<br />
fiscal year 2008. The Lipper ® Small Cap Core Funds Average trailed the Russell 2000 ® Index by 2.7%, the Lipper ®<br />
Small Cap Growth Funds Average underperformed the Russell 2000 ® Growth Index by 3.6% and the Lipper ® Small Cap<br />
Value Funds Average underperformed the Russell 2000 ® Value Index by 4.9%. The Lipper ® Large Cap Core Funds<br />
Average outperformed the Russell 1000 ® Index by 0.1%, the Lipper ® Large Cap Growth Funds Average<br />
underperformed the Russell 1000 ® Growth Index by 1.8% and the Lipper ® Large Cap Value Funds Average<br />
underperformed the Russell 1000 ® Value Index by 0.6%.<br />
Real Estate Securities Market<br />
For the fiscal year ending December 31, 2008, U.S. real estate investment trusts (REITs) generated a 37.7% loss, as<br />
measured by the FTSE NAREIT Equity Index (Index). During this period, REITs performed slightly better than the<br />
broader equity market, which finished down 37.3% as measured by the Russell 3000 Index. The negative REIT<br />
performance was accompanied by an unprecedented amount of volatility during the period. Not only were monthly<br />
returns erratic, demonstrated by the worst and best monthly returns in the history of the Index occurring in October<br />
-31.7% and December 16.4%, respectively, but the largest percentage gain and loss achieved in a single day also both<br />
occurred during the year.<br />
Following the sharp decline in the commercial mortgage-backed securities market and escalating problems in the credit<br />
market, investors began 2008 more risk averse. As recessionary fears began to emerge, the Federal Reserve became<br />
active in an attempt to stave off concerns of a recession by cutting rates aggressively, twice in January alone, and<br />
injecting liquidity into the financial markets through a variety of initiatives. First and second quarter REIT earnings held<br />
up well, although many companies took the opportunity to revise 2009 estimates downwards.<br />
By September 2008, consumer spending had slowed, the unemployment rate was climbing and both corporate and<br />
consumer credit markets remained tight. The collapse of Lehman Brothers Holdings Inc. on September 15 sparked panic<br />
within the financial markets and REITs were heavily sold off over the ensuing weeks. Mirroring the broader equity<br />
market, REITs traded down sharply through October and most of November. A marked change in investor sentiment<br />
occurred in December as investors became less defensive and REITs staged a modest recovery as the year closed.<br />
An overriding theme during the year was the elevated correlation between REITs and the financial services sector of the<br />
broader equity market. This is due to the fact that most broad equity indexes include REITs in the financial services<br />
sector. This weighed heavily on REIT performance during the period, as many general equity investors avoided financial<br />
services stocks and other investors took short positions in individual stocks and exchange traded funds in the financial<br />
Market Summary 5
Russell Investment Funds<br />
services sector. This was also a contributing factor to the exceptionally high volatility observed in the REIT market<br />
during the fiscal year.<br />
Another key trend during the year was a flight towards quality REIT names, with the market especially rewarding<br />
companies that have made a concerted effort to mitigate risk. Companies with the lowest leverage levels, limited near<br />
term refinancing needs and limited development pipelines held up the best. Neither dividend yield nor market<br />
capitalization appeared to be contributing factors to differences in individual company performance.<br />
During the year, returns were disappointing across all property sectors. The poorest performing sectors were industrial<br />
and regional malls. Leverage ratios for the industrial and regional malls companies tend to be higher than the overall<br />
REIT universe, which has negatively impacted those stocks. In addition, meaningful development pipelines in the<br />
leading industrial companies have put added pressure on earnings forecasts due to weaker leasing market conditions.<br />
Two of the better performing property sectors were self storage and health care. Due to the stable nature of the cash flows<br />
embedded in many health care leases, investors sought out this defensive sector given the slowing economy. The self<br />
storage sector is generally driven by the performance of one company that dominates the sector, Public Storage, which<br />
was one of the few stocks to post a positive return for the year. Public Storage held up well due to its strong balance<br />
sheet, including minimal leverage and high levels of cash.<br />
The U.S. REIT market outperformed relative to the international real estate securities market by a wide margin during<br />
the fiscal year. The largest price correction occurred in the Asia Pacific region, with smaller corrections taking place in<br />
Continental Europe and the United Kingdom. While the effects of the global economic slowdown and credit crisis have<br />
spread to the other regions, the U.S. REIT market has fared relatively better, mirroring trends in the broader global<br />
equity markets.<br />
Non-U.S. Developed Equity Markets<br />
Non-U.S. developed stocks fell 43.38% as measured by the MSCI EAFE ® Index for the fiscal year ended December 31,<br />
2008. Appreciation of the U.S. dollar relative to foreign currencies, mainly as a result of the flight to safety in the second<br />
half of the fiscal year ended, exacerbated already weak non-U.S. equity returns. In local currencies, the MSCI EAFE ®<br />
Index fell 40.27% over the 12-month period.<br />
The market struggled under increasing concern over the health of the global financial system. While these concerns<br />
affected markets for nearly the full 12 months, most of the decline in equity values came in September and October<br />
2008, as several prominent financial companies in the U.S. and Europe encountered financial distress. In nearly all<br />
cases, government “bailouts” were necessary for these companies to avoid bankruptcy.<br />
The additional impact of already declining global economic growth increasingly weighed on markets during the period.<br />
Expectations for global economic growth were revised downwards throughout the year. The latter part of the fiscal year<br />
experienced contraction in economic output in Europe and Asia. Output growth of 5% in 2007 slowed sharply for 2008<br />
with abbreviated expectations for growth in developed economies in 2009.<br />
The change in market conditions was evident in a marked increase in market volatility as investors’ complacency<br />
towards risk was quickly replaced by acute risk aversion. Stocks with prices most directly tied to high, long-term growth<br />
prospects suffered some of the steepest declines, as investors doubted the ability of these companies to post strong<br />
growth in a decelerating economic environment. However, due to the sharp declines of financials, the largest sector of<br />
the value index, value lagged growth by 1.39% in the period (the MCSI EAFE Growth Index lost 42.70% and the MSCI<br />
EAFE Value Index lost 44.09%).<br />
Market sectors most leveraged to global economic growth or in the nexus of the financial sector meltdown were the most<br />
severely impacted, though no areas of the market were immune. Financials ended the 12-month period down 55.21% (as<br />
measured by the MSCI EAFE Index financials sector grouping). The strong gains of materials early in the period were<br />
quickly reversed. The sector ended the period down nearly 53.02% as measured by the MSCI EAFE materials sector<br />
grouping. Energy stocks also fell sharply as the price of a barrel of oil fell from a high of more than $145 to below $36.<br />
However, the sector’s one-year stock price decline of 38.18% (as measured by the MSCI EAFE energy sector) was better<br />
than all but the traditionally defensive sectors. Among the defensive sectors of the market, health care, led by<br />
pharmaceutical stocks, held up best with a decline of 18.95% as measured by the MSCI EAFE health care sector.<br />
Utilities and consumer staples, down 28.16% and 31.33% as measured by the MSCI EAFE utilities and MSCI EAFE<br />
consumer staples sector groupings, respectively, were the next best performers. Sector groupings are based on the Global<br />
Industry Classification Standard definitions.<br />
6 Market Summary
Russell Investment Funds<br />
Regional results were generally tied to sensitivity to global economic conditions. The MSCI Pacific ex-Japan ® Index<br />
declined the most, down 50.50%. MSCI Europe ex-United Kingdom ® Index fell 45.54%, while the MSCI United<br />
Kingdom ® Index fell 48.34%. In all three regions, currency impact had a pronounced impact on returns with the regions<br />
down 42.17%, 43.24%, and 28.48%, respectively, in local currencies. MSCI Japan ® Index fell 42.56% in yen, but had<br />
one of the few currencies that managed to appreciate versus the U.S. dollar and fell only 29.21% in U.S. Dollars.<br />
Emerging Markets<br />
During 2008, the MSCI Emerging Markets Index (“Index”) declined 53.18%, the biggest calendar year decline in the<br />
history of the asset class with large return dispersions across sectors and countries. The turmoil in the world’s financial<br />
system meant increasing risk aversion, growing macro risks and heightened levels of volatility and dispersion across<br />
countries, sectors and currencies. Emerging Markets in general may be better positioned and more resilient to a<br />
downturn than developed economies, however, as the crisis changed from financial to economic, emerging markets faced<br />
massive asset de-leveraging and indiscriminate selling as investors adopted a zero tolerance to risk. Price momentum<br />
(i.e. stocks exhibiting trending relative price appreciation) benefited from the continued rally of commodity-related<br />
sectors through the latter part of 2007 and well into 2008 but this reversed as global equity markets began falling<br />
sharply. The faltering global economy and the steep pull-back in commodity prices affected cyclical areas of the market<br />
including industrials, materials and energy sectors while defensive sectors such as healthcare, consumer staples and<br />
utilities were relative safe havens during the period. From a country perspective, smaller markets in general held up<br />
relatively better than the larger markets. In addition to the weak equity returns, most emerging markets currencies<br />
depreciated against the U.S. Dollar with some, such as the South African Rand, Korean Won, Turkish Lira and Brazilian<br />
Real, losing in excess of 30% over the course of the year as investors fled to quality and more liquid currencies.<br />
In terms of regions, Latin America was the top performer, down 51.28% (as measured by the MSCI EM Latin America<br />
Index), supported by the relative outperformance from Mexico and the smaller Latin countries. The Asia region (-52.77%<br />
as measured by the MSCI EM Asia Index) finished behind Latin America but ahead of the broader market. The Europe,<br />
Middle East and Africa region (-55.60% as measured by the MSCI EM Europe, Middle East and Africa Index)<br />
underperformed the broader market due in large part to the significant underperformance from Russia. The BRIC (Brazil,<br />
Russia, India and China) economies, with the exception of China, underperformed the broader Index. China held up<br />
reasonably well over the period due to favorable monetary and fiscal policies during the latter half of the year in an effort<br />
to shore up its slowing economy. Other notable relative underperformers included Pakistan (-74.05% as measured by the<br />
MSCI Pakistan Index) and Turkey (-62.10% as measured by the MSCI Turkey Index).<br />
U.S. Fixed Income Markets<br />
The Barclays Capital U.S. Aggregate Bond Index, a broad measure of U.S. investment grade fixed income securities,<br />
returned 5.24% for the year ended December 31, 2008. Similar to the prior year, the index and its major sectors trailed<br />
equivalent-duration U.S. Treasuries, as the subprime mortgage crisis that started in the summer of 2007 deepened and<br />
developed into a severe liquidity crisis, the size and scope of which had not been seen since the U.S. Great Depression of<br />
the 1930s. During 2008, investors moved their capital away from riskier investments to the safest possible investments<br />
(i.e., U.S. Treasuries), continuing the “flight to quality” trend started in the prior period.<br />
Throughout 2008, in an effort to deal with credit market illiquidity and a slowing economy, the Federal Reserve lowered<br />
the target Federal Funds rate eight times, including two non-scheduled “surprise” cuts of 0.75% in January and 0.50%<br />
in October. The target rate started the year at 4.25% and ended at a 0.00% to 0.25% range after the eighth rate cut on<br />
December 16, 2008.<br />
The downward shift in the yield curve started in 2007 and continued in earnest in 2008, with the curve “steepening”<br />
significantly below the 10-year mark; i.e., yields on shorter-maturity Treasuries declined by a greater degree than longermaturity<br />
Treasuries, resulting in a steeper, upward sloping curve. The change was driven by the Federal Reserve’s<br />
lowering of rates (affecting the short end) and investors’ increasing demand for safe haven U.S. Treasuries (driving down<br />
longer-maturity yields). In 2008, yields on 2-year Treasuries declined by 2.28% to 0.76% while 10-year Treasuries<br />
declined by 1.81% to 2.21%.<br />
The subprime mortgage crisis and deflating housing market were still major issues throughout the year. Home price<br />
depreciation continued to accelerate. By the end of October, the average U.S. national home price as tracked by the<br />
S&P/Case-Shiller Composite 20 Index, had declined 18% from the end of 2007, reaching a level that was down 23%<br />
from its July 2006 peak. Subprime mortgage foreclosures increased from 8.65% at the end of December 2007 to 12.55%<br />
at the end of September 2008, the most recent available data from the Mortgage Bankers Association. Total foreclosures<br />
increased from 2.04% to 2.97% during the same period. Writedowns on the values of mortgages had a large negative<br />
Market Summary 7
Russell Investment Funds<br />
impact on bank balance sheets. During the year, writedowns at financial institutions world-wide amounted to<br />
approximately $930.3 billion, bringing total writedowns since the start of the subprime crisis to approximately $997.4<br />
billion.<br />
During the early months of 2008 the market continued its downward trend, which was capped in mid-March by Bear<br />
Stearns receiving emergency funding from the Federal Reserve and JPMorgan Chase as a three-day run on the bank<br />
depleted its cash reserves. Two days later JPMorgan Chase acquired Bear Stearns for seven percent of its market value<br />
in a sale brokered by the Federal Reserve and the U.S. Department of the Treasury (U.S. Treasury). Investors took this as<br />
a sign that the U.S. government would stand behind financial institutions and credit markets rallied for the next few<br />
months.<br />
During the first part of the year, the U.S. government had become increasingly concerned that the credit crisis would<br />
significantly slow the U.S. economy — particularly the spending of consumers, who account for approximately two-thirds<br />
of GDP. In April, the U.S. Internal Revenue Service started distributing tax rebates as part of a $168 billion economic<br />
stimulus plan.<br />
However, markets continued to weaken as illiquidity reached extreme levels and the financial crisis became global in<br />
scope. In July, IndyMac Bancorp, the then-second-biggest independent U.S. mortgage lender, was seized by federal<br />
regulators after a run by depositors depleted its cash. In August, Commerzbank AG agreed to buy Allianz SE’s Dresdner<br />
Bank for 9.8 billion euros in Germany’s biggest banking takeover in three years.<br />
September started with the U.S. government seizing control of Fannie Mae and Freddie Mac, the largest U.S. mortgagefinance<br />
companies. In the middle of the month, the U.S. government did not arrange a deal or otherwise bail out Lehman<br />
Brothers, and the 158-year old firm filed the largest bankruptcy in U.S. history. This was followed by the bankruptcy of<br />
119-year old Washington <strong>Mutual</strong>. AIG accepted an $85 billion loan from the Federal Reserve to avert what would have<br />
been the worst financial collapse in history, with the U.S. government taking a substantial ownership stake in AIG.<br />
In the same month, the investment banking business model fundamentally changed, with Goldman Sachs and Morgan<br />
Stanley receiving approval to become deposit-taking commercial banks regulated by the Federal Reserve, as tight credit<br />
markets forced Wall Street’s two remaining independent investment banks to widen their sources of funding. Similar<br />
events occurred in Europe and throughout the world, with large financial institutions either merging or with governments<br />
providing support in return for equity stakes.<br />
September finally ended with the U.S. Treasury proposing the Financial Market Rescue Bill, including the Troubled<br />
Asset Relief Program (TARP), which authorized the U.S. Treasury to spend up to $700 billion to buy mortgages and<br />
other distressed assets. The House initially rejected the bill, but subsequently passed it. The bill was signed into law in<br />
early October.<br />
The events of September contributed to the extreme market illiquidity in October, evidenced by spikes in overnight and<br />
three-month LIBOR (the rates at which banks lend to one another). The Federal Reserve took significant steps to<br />
improve liquidity in the short duration markets, which included the creation of the Commercial Paper Funding Facility<br />
(CPFF) and the Money Market Investor Funding Facility (MMIFF).<br />
In November, the U.S. Treasury gave additional support to AIG by announcing the purchase of $40 billion in new<br />
preferred stock. The U.S. Treasury then guaranteed $306 billion in residential and commercial mortgage-backed<br />
securities of Citi ® in exchange for $7 billion in preferred stock. In addition, the U.S. Treasury purchased another $20<br />
billion in preferred stocks from Citi. Shortly thereafter, the Government Sponsored Enterprise (GSE) Debt and Mortgage-<br />
Backed Security Purchase Program was announced stating that the Federal Reserve will buy $100 billion in Fannie Mae,<br />
Freddie Mac and the Federal Home Loan Bank debentures and $500 billion in agency mortgage-backed securities.<br />
Simultaneously, the Term Asset-Backed Securities Loan Facility (TALF) was announced by the U.S. Treasury offering to<br />
provide $200 billion in three-year loans to U.S. companies who can provide high quality AAA-rated auto loans, student<br />
loans, credit card loans or small business loans as collateral.<br />
This trend continued in December as Congress agreed to provide $13.4 billion in short term loans to General Motors and<br />
$4 billion to Chrysler in an effort to aid the suffering auto industry.<br />
December ended on an up note with a majority of fixed income sectors outperforming equivalent-duration Treasuries.<br />
Most notably, the commercial mortgage-backed securities sector (CMBS) returned 16.98% (15.14% above equivalentduration<br />
Treasuries) during the month. The year ended with the Barclays Capital U.S. Aggregate Bond Index returning<br />
5.24%, underperforming by 7.10% U.S. Treasuries.<br />
8 Market Summary
(This page intentionally left blank)
Russell Investment Funds<br />
Multi-Style Equity Fund<br />
Portfolio Management Discussion and Analysis — December 31, 2008 (Unaudited)<br />
Growth of a $10,000 Investment<br />
$15,000<br />
$14,000<br />
$13,000<br />
$12,000<br />
$11,000<br />
$10,000<br />
$9,000<br />
$8,000<br />
$7,000<br />
Multi-Style Equity Fund<br />
Russell 1000® Index**<br />
$6,000<br />
*<br />
1999<br />
2000<br />
2001<br />
2002 2003 2004<br />
Yearly periods ended December 31<br />
2005<br />
2006<br />
2007<br />
2008<br />
Multi-Style Equity Fund<br />
Total<br />
Return<br />
1 Year (41.15)%<br />
5 Years (2.92)%§<br />
10 Years (2.80)%§<br />
Russell 1000 ® Index **<br />
Total<br />
Return<br />
1 Year (37.60)%<br />
5 Years (2.04)%§<br />
10 Years (1.09)%§<br />
* Assumes initial investment on January 1, 1999.<br />
** Russell 1000 ® Index includes the 1,000 largest companies in the Russell 3000 ® Index. The Russell 1000 ® Index represents the universe of stocks from which<br />
most active money managers typically select. The Russell 1000 ® Index return reflects adjustments from income dividends and capital gain distributions<br />
reinvested as of the ex-dividend dates.<br />
§ <strong>Annual</strong>ized.<br />
The performance shown in this section does not reflect any Insurance Company Separate Account or Policy Charges. Performance is historical and assumes<br />
reinvestment of all dividends and capital gains. Investment return and principal value will fluctuate so that an investor’s shares, when redeemed, may be worth more or<br />
less than when purchased. Past performance is not indicative of future results.<br />
10 Multi-Style Equity Fund
Russell Investment Funds<br />
Multi-Style Equity Fund<br />
Portfolio Management Discussion — December 31, 2008 (Unaudited)<br />
The Multi-Style Equity Fund (the “Fund”) allocates most of its<br />
assets among multiple money managers. Russell Investment<br />
Management Company (“RIMCo”), as the Fund’s advisor, may<br />
change the allocation of the Fund’s assets among money<br />
managers at any time. An exemptive order from the Securities<br />
and Exchange Commission (SEC) permits RIMCo to engage or<br />
terminate a money manager at any time, subject to the approval<br />
by the Fund’s Board without a shareholder vote. Pursuant to the<br />
terms of the exemptive order, the Fund is required to notify its<br />
shareholders within 60 days of when a money manager begins<br />
providing services. The Fund currently has eight money<br />
managers.<br />
What is the Fund’s investment objective?<br />
The Fund seeks to provide long term capital growth.<br />
How did the Fund perform relative to its benchmark for<br />
the fiscal year ended December 31, 2008?<br />
For the fiscal year ended December 31, 2008, the Multi-Style<br />
Equity Fund lost 41.15%. This compared to the Russell 1000 ®<br />
Index, which lost 37.60% during the same period. The Fund’s<br />
performance includes operating expenses, whereas Index<br />
returns are unmanaged and do not include expenses of any<br />
kind.<br />
For the year ended December 31, 2008, the Lipper ® Large-Cap<br />
Core Funds (VIP) Average lost 38.29%. This result serves as a<br />
peer comparison and is expressed net of operating expenses.<br />
RIMCo may assign a money manager a specific style or<br />
capitalization benchmark other than the Fund’s index. However,<br />
the Fund’s primary index remains the benchmark for the Fund<br />
and is representative of the aggregate of each money manager’s<br />
benchmark index.<br />
How did the market conditions described in the Market<br />
Summary report affect the Fund’s performance?<br />
During the year, investors sought relative stability and safety<br />
found in more liquid stocks and avoided any stocks perceived<br />
as risky. Investors sold riskier assets as fear and panic took over<br />
the markets, which put severe downward pressure on many<br />
stocks, particularly the highly liquid larger cap U.S. stocks,<br />
regardless of those stocks’ fundamentals.<br />
The consumer staples sector was the strongest performing sector<br />
in the Russell 1000 Index for the period, losing 17.57%, where<br />
solid, well-known household names, such as Proctor & Gamble,<br />
Colgate and Clorox were seen as safe havens. Integrated oils and<br />
health care stocks also performed well compared to other<br />
sectors, losing 21.67% and 22.40%, respectively. Other energy,<br />
which had been a strong performer for the first half of 2008, fell<br />
off sharply in the second half of the year and ended the year<br />
down -53.64%, as energy equipment and coal producers were hit<br />
hard by the drop in oil prices. Financial services stocks bore the<br />
brunt of investor apprehension as write-downs, dwindling capital<br />
and a crisis of investor confidence led to the bankruptcy,<br />
government seizure and rescue packages for many financial<br />
institutions. This sector ended the year down 51.09%.<br />
These unprecedented events created market conditions which<br />
were very difficult for active managers in general and for the<br />
Fund. The Fund was positioned toward attractively valued<br />
companies with higher growth rates, higher beta (beta is the<br />
volatility of a given security compared to the volatility of the<br />
market as a whole) and lower yielding stocks. This positioning<br />
was not rewarded by the market.<br />
The Fund’s strategy of being fully invested and exposing cash<br />
reserves to the performance of appropriate markets by<br />
purchasing equity securities and/or derivatives was a drag on<br />
performance relative to peers that held larger cash positions as<br />
the Russell 1000 ® Index was down over 37%.<br />
How did the investment strategies and techniques<br />
employed by the Fund and its money managers affect<br />
its performance?<br />
Over the past year, the Fund maintained its positioning towards<br />
companies with above-average growth rates and lower yields<br />
that are selling at attractive valuations. This positioning was not<br />
rewarded in this period where investors were driven by fear and<br />
sold stocks regardless of attractive fundamentals.<br />
The Fund’s underperformance resulted from a combination of<br />
sector weighting decisions and stock selection. Underweights to<br />
both the integrated oils and utilities sectors detracted from<br />
returns as those sectors performed better. Weak stock selection<br />
in the consumer discretionary, technology, integrated oils and<br />
health care sectors was also detrimental to returns.<br />
The Fund’s managers had a difficult time in the risk adverse<br />
market environment. Six of the eight managers underperformed<br />
their respective style benchmarks, with one manager essentially<br />
even with its index. Higher-growth and momentum manager,<br />
Turner Investment Partners, Inc.’s more aggressive positioning<br />
was not rewarded in this environment, which was to be expected<br />
in this market environment. Weak selection in the consumer<br />
discretionary and technology sectors led Turner to significantly<br />
trail its benchmark, the Russell 1000 ® Growth Index. Growth<br />
manager, Columbus Circle Investors, also struggled in this<br />
market environment. Given the economic environment,<br />
Columbus’ move to reduce the cyclicality and high level of<br />
forecast growth within its portfolio moderated the level of its<br />
underperformance in the period. Columbus’ holdings in<br />
technology, health care and financial services were the main<br />
drivers of its underperformance. Montag & Caldwell, Inc. is a<br />
larger-cap growth manager with a high quality consistent growth<br />
focus. As expected, Montag performed better in this difficult<br />
environment and provided some downside protection. Marketoriented<br />
manager, Suffolk Capital Management, LLC also<br />
detracted from results as its focus on companies with positive<br />
earnings estimate revisions became less effective due to the<br />
dramatic decline in companies experiencing such revisions.<br />
Suffolk’s performance lagged primarily from an overweight to<br />
the financial services sector and an underweight to integrated<br />
oils, as well as from stock selection within those sectors.<br />
RIMCo currently employs a “select holdings” strategy for a<br />
portion of the Fund’s assets that RIMCo determines not to<br />
Multi-Style Equity Fund 11
Russell Investment Funds<br />
Multi-Style Equity Fund<br />
Portfolio Management Discussion — December 31, 2008 (Unaudited)<br />
allocate to the money managers. Pursuant to this strategy,<br />
RIMCo analyzes the holdings of the Fund’s money managers in<br />
their Fund segments to identify particular stocks that have been<br />
selected by multiple money managers. RIMCo uses a<br />
proprietary model to rank these stocks. Based on this ranking,<br />
RIMCo purchases additional shares of certain stocks for the<br />
Fund. The strategy is designed to increase the Fund’s exposure<br />
to stocks that are viewed as attractive by multiple money<br />
managers. Over the period, the strategy outperformed as it had<br />
exposure to many of the stocks that were perceived by investors<br />
to be less risky.<br />
Money Managers as of<br />
December 31, 2008<br />
Arnhold and S. Bleichroeder Advisers, LLC<br />
Columbus Circle Investors<br />
DePrince, Race & Zollo, Inc.<br />
Institutional Capital LLC<br />
Jacobs Levy Equity Management, Inc.<br />
Montag & Caldwell, Inc.<br />
Suffolk Capital Management, LLC<br />
Turner Investment Partners, Inc.<br />
Styles<br />
Market-Oriented<br />
Growth<br />
Value<br />
Value<br />
Value<br />
Growth<br />
Market-Oriented<br />
Growth<br />
At the stock selection level, the Fund benefited from<br />
overweights to Gilead, McDonald’s and Qualcomm. However, a<br />
significant underweight to Exxon Mobil was the largest single<br />
stock detractor from performance over the one year period.<br />
Additionally, overweights to Morgan Stanley, Halliburton and<br />
Google were detrimental to returns.<br />
The Fund’s performance shown throughout this report was<br />
based on valuations calculated in accordance with Generally<br />
Accepted Accounting Principles (GAAP) and in accordance<br />
with a newly effective accounting statement (SFAS 157),<br />
reflects the December 31, 2008 market value of the pooled<br />
investment vehicle in which the Fund invested its cash<br />
collateral received in securities lending transactions. This<br />
market value is lower than the vehicle’s amortized cost per unit.<br />
This had a negative impact on the Fund’s benchmark relative<br />
performance.<br />
Describe any changes to the Fund’s structure or the<br />
money manager line-up.<br />
There were no changes to the Fund’s structure or money<br />
manager line-up during the year.<br />
The views expressed in this report reflect those of the portfolio<br />
managers only through the end of the period covered by the report.<br />
These views do not necessarily represent the views of RIMCo, or any<br />
other person in RIMCo or any other affiliated organization. These views<br />
are subject to change at any time based upon market conditions or<br />
other events, and RIMCo disclaims any responsibility to update the<br />
views contained herein. These views should not be relied on as<br />
investment advice and, because investment decisions for Russell<br />
Investment Funds (RIF) are based on numerous factors, should not be<br />
relied on as an indication of investment decisions of any RIF Fund.<br />
12 Multi-Style Equity Fund
Russell Investment Funds<br />
Multi-Style Equity Fund<br />
Shareholder Expense Example — December 31, 2008 (Unaudited)<br />
Fund Expenses<br />
The following disclosure provides important information<br />
regarding each Fund’s Expense Example, which appears<br />
on each Fund’s individual page in this <strong>Annual</strong> Report.<br />
Please refer to this information when reviewing the<br />
Expense Example for a Fund.<br />
Example<br />
As a shareholder of the Fund, you incur two types of costs: (1)<br />
transaction costs, and (2) ongoing costs, including management<br />
fees and other Fund expenses. The Example is intended to help<br />
you understand your ongoing costs (in dollars) of investing in<br />
the Fund and to compare these costs with the ongoing costs of<br />
investing in other mutual funds. The Example is based on an<br />
investment of $1,000 invested at the beginning of the period<br />
and held for the entire period indicated, which for this Fund is<br />
from July 1, 2008 to December 31, 2008.<br />
Actual Expenses<br />
The information in the table under the heading “Actual<br />
Performance” provides information about actual account values<br />
and actual expenses. You may use the information in this<br />
column, together with the amount you invested, to estimate the<br />
expenses that you paid over the period. Simply divide your<br />
account value by $1,000 (for example, an $8,600 account value<br />
divided by $1,000 = 8.6), then multiply the result by the<br />
number in the first column in the row entitled “Expenses Paid<br />
During Period” to estimate the expenses you paid on your<br />
account during this period.<br />
Hypothetical Example for Comparison Purposes<br />
The information in the table under the heading “Hypothetical<br />
Performance (5% return before expenses)” provides information<br />
about hypothetical account values and hypothetical expenses<br />
based on the Fund’s actual expense ratio and an assumed rate<br />
of return of 5% per year before expenses, which is not the<br />
Fund’s actual return. The hypothetical account values and<br />
expenses may not be used to estimate the actual ending account<br />
balance or expenses you paid for the period. You may use this<br />
information to compare the ongoing costs of investing in the<br />
Fund and other funds. To do so, compare this 5% hypothetical<br />
example with the 5% hypothetical examples that appear in the<br />
shareholder reports of other funds.<br />
Please note that the expenses shown in the table are meant to<br />
highlight your ongoing costs only and do not reflect any<br />
transactional costs. Therefore, the information under the<br />
heading “Hypothetical Performance (5% return before<br />
expenses)” is useful in comparing ongoing costs only, and will<br />
not help you determine the relative total costs of owning<br />
different funds. In addition, if these transactional costs were<br />
included, your costs would have been higher. The fee and<br />
expenses shown in this section do not reflect any Insurance<br />
Company Separate Account or Policy Charges.<br />
Actual<br />
Performance<br />
Hypothetical<br />
Performance<br />
(5% return<br />
before expenses)<br />
Beginning Account Value<br />
July 1, 2008 $ 1,000.00 $ 1,000.00<br />
Ending Account Value<br />
December 31, 2008 $ 664.53 $ 1,020.76<br />
Expenses Paid During Period* $ 3.64 $ 4.42<br />
* Expenses are equal to the Fund’s annualized expense ratio of 0.87%<br />
(representing the one-half year period annualized), multiplied by the average<br />
account value over the period, multiplied by 184/366 (to reflect the one-half<br />
year period). Reflects amounts waived and/or reimbursed. Without the waiver<br />
and/or reimbursement, expenses would have been higher.<br />
Multi-Style Equity Fund 13
Russell Investment Funds<br />
Multi-Style Equity Fund<br />
Schedule of Investments — December 31, 2008<br />
Amounts in thousands (except share amounts)<br />
Principal<br />
Amount ($)<br />
or Shares<br />
Market<br />
Value<br />
$<br />
Common Stocks - 90.0%<br />
Auto and Transportation - 1.6%<br />
Arkansas Best Corp. (Ñ) 2,600 78<br />
Autoliv, Inc. 6,700 144<br />
Con-way, Inc. (Ñ) 3,500 93<br />
CSX Corp. 31,950 1,038<br />
Delta Air Lines, Inc. (Æ) 70,714 810<br />
Old Dominion Freight Line, Inc. (Æ)(Ñ) 1,900 54<br />
Skywest, Inc. 5,300 99<br />
Toyota Motor Corp. - ADR (Ñ) 7,500 491<br />
TRW Automotive Holdings Corp. (Æ)(Ñ) 12,300 44<br />
Union Pacific Corp. (Ñ) 30,054 1,437<br />
United Parcel Service, Inc. Class B 7,150 394<br />
4,682<br />
Consumer Discretionary - 11.4%<br />
Activision Blizzard, Inc. (Æ) 59,060 510<br />
Amazon.com, Inc. (Æ)(Ñ) 10,000 513<br />
American Eagle Outfitters, Inc. (Ñ) 72,200 676<br />
AnnTaylor Stores Corp. (Æ)(Ñ) 8,400 48<br />
Apollo Group, Inc. Class A (Æ) 2,210 169<br />
AutoNation, Inc. (Æ)(Ñ) 13,100 129<br />
Avis Budget Group, Inc. (Æ) 13,500 9<br />
Black & Decker Corp. (Ñ) 8,900 372<br />
Boyd Gaming Corp. (Ñ) 7,300 35<br />
Brinker International, Inc. 53,200 561<br />
Callaway Golf Co. 4,900 46<br />
CBS Corp. Class B (Ñ) 88,700 726<br />
Clear Channel Outdoor Holdings, Inc.<br />
Class A (Æ) 84,978 523<br />
Comcast Corp. Class A 19,660 332<br />
Costco Wholesale Corp. (Ñ) 25,580 1,343<br />
DIRECTV Group, Inc. (The) (Æ) 40,559 929<br />
Eastman Kodak Co. (Ñ) 16,800 111<br />
Electronic Arts, Inc. (Æ) 37,700 605<br />
Foot Locker, Inc. 13,700 101<br />
FTI Consulting, Inc. (Æ)(Ñ) 4,670 209<br />
Gannett Co., Inc. (Ñ) 31,200 250<br />
Guess ?, Inc. 14,580 224<br />
Home Depot, Inc. 13,400 308<br />
Intercontinental Hotels Group PLC - ADR 30,759 257<br />
International Speedway Corp. Class A 2,300 66<br />
Jack in the Box, Inc. (Æ)(Ñ) 1,400 31<br />
Jarden Corp. (Æ)(Ñ) 4,700 54<br />
JC Penney Co., Inc. (Ñ) 29,600 583<br />
Kimberly-Clark Corp. 6,240 329<br />
Kohl’s Corp. (Æ)(Ñ) 7,270 263<br />
Limited Brands, Inc. 64,200 645<br />
Lowe’s Cos., Inc. 76,300 1,642<br />
Macy’s, Inc. (Ñ) 69,300 717<br />
Manpower, Inc. 3,600 122<br />
McDonald’s Corp. 55,100 3,427<br />
McGraw-Hill Cos., Inc. (The) 9,800 227<br />
Men’s Wearhouse, Inc. (The) (Ñ) 3,600 49<br />
MPS Group, Inc. (Æ) 7,400 56<br />
New York Times Co. (The) Class C (Ñ) 12,400 91<br />
Newell Rubbermaid, Inc. 38,200 374<br />
Principal<br />
Amount ($)<br />
or Shares<br />
Market<br />
Value<br />
$<br />
News Corp. Class A 165,662 1,506<br />
Nike, Inc. Class B 39,401 2,009<br />
Office Depot, Inc. (Æ) 22,800 68<br />
OfficeMax, Inc. (Ñ) 67,600 516<br />
Regis Corp. 1,200 17<br />
Robert Half International, Inc. (Ñ) 12,500 260<br />
RR Donnelley & Sons Co. 33,300 452<br />
Staples, Inc. (Ñ) 20,480 367<br />
Starwood Hotels & Resorts Worldwide,<br />
Inc. (Ñ) 26,400 473<br />
Target Corp. (Ñ) 26,900 929<br />
United Stationers, Inc. (Æ)(Ñ) 2,200 74<br />
Urban Outfitters, Inc. (Æ)(Ñ) 10,330 155<br />
Vail Resorts, Inc. (Æ)(Ñ) 2,900 77<br />
Viacom, Inc. Class B (Æ) 66,800 1,273<br />
Wal-Mart Stores, Inc. (Ñ) 122,244 6,853<br />
Walt Disney Co. (The) (Ñ) 32,400 735<br />
Williams-Sonoma, Inc. (Ñ) 50,600 398<br />
Wyndham Worldwide Corp. 13,200 86<br />
Yum! Brands, Inc. 5,930 187<br />
34,097<br />
Consumer Staples - 7.4%<br />
Chiquita Brands International, Inc. (Æ)(Ñ) 5,600 83<br />
Clorox Co. 16,280 904<br />
Coca-Cola Co. (The) (Ñ) 126,650 5,733<br />
Coca-Cola Enterprises, Inc. 15,200 183<br />
Colgate-Palmolive Co. 16,760 1,149<br />
ConAgra Foods, Inc. 38,400 634<br />
General Mills, Inc. 29,000 1,762<br />
Hershey Co. (The) (Ñ) 13,700 476<br />
Hormel Foods Corp. (Ñ) 4,600 143<br />
JM Smucker Co. (The) 14,524 630<br />
Kroger Co. (The) 9,300 246<br />
Lorillard, Inc. 9,500 535<br />
Molson Coors Brewing Co. Class B 21,150 1,035<br />
NBTY, Inc. (Æ) 1,500 23<br />
Pepsi Bottling Group, Inc. (Ñ) 11,000 248<br />
PepsiCo, Inc. 97,850 5,359<br />
Procter & Gamble Co. 32,940 2,036<br />
Sara Lee Corp. 29,000 284<br />
Spartan Stores, Inc. (Ñ) 2,200 51<br />
SUPERVALU, Inc. 16,000 234<br />
Sysco Corp. 7,300 167<br />
Tyson Foods, Inc. Class A (Ñ) 16,800 147<br />
Walgreen Co. 6,300 155<br />
22,217<br />
Financial Services - 14.3%<br />
ACE, Ltd. 28,800 1,524<br />
Allied Capital Corp. (Ñ) 11,200 30<br />
Allied World Assurance Co. Holdings, Ltd. 2,400 97<br />
Allstate Corp. (The) 11,700 383<br />
American Capital, Ltd. (Ñ) 31,200 101<br />
Annaly Capital Management, Inc. (ö)(Ñ) 47,100 748<br />
Arch Capital Group, Ltd. (Æ) 2,200 154<br />
Arthur J Gallagher & Co. 7,100 184<br />
14 Multi-Style Equity Fund
Russell Investment Funds<br />
Multi-Style Equity Fund<br />
Schedule of Investments, continued — December 31, 2008<br />
Amounts in thousands (except share amounts)<br />
Principal<br />
Amount ($)<br />
or Shares<br />
Market<br />
Value<br />
$<br />
Bank of America Corp. 114,150 1,607<br />
Bank of Hawaii Corp. (Ñ) 5,200 235<br />
Bank of New York Mellon Corp. (The) 88,976 2,521<br />
BlackRock, Inc. Class A (Ñ) 1,630 219<br />
Brandywine Realty Trust (ö) 11,300 87<br />
Camden Property Trust (ö)(Ñ) 4,300 135<br />
Capital One Financial Corp. (Ñ) 30,700 979<br />
CBL & Associates Properties, Inc. (ö)(Ñ) 9,200 60<br />
Charles Schwab Corp. (The) 75,600 1,222<br />
Chubb Corp. 6,200 316<br />
Citigroup, Inc. 52,400 352<br />
CME Group, Inc. Class A (Ñ) 1,900 395<br />
CNA Financial Corp. 3,100 51<br />
Comerica, Inc. (Ñ) 27,300 542<br />
Commerce Bancshares, Inc. (Ñ) 3,360 148<br />
Conseco, Inc. (Æ)(Ñ) 13,800 72<br />
Cullen/Frost Bankers, Inc. 4,300 218<br />
Deluxe Corp. 5,300 79<br />
Developers Diversified Realty Corp. (ö)(Ñ) 4,500 22<br />
Discover Financial Services (Ñ) 28,900 275<br />
East West Bancorp, Inc. (Ñ) 3,100 50<br />
Endurance Specialty Holdings, Ltd. (Ñ) 5,400 165<br />
Federal National Mortgage Association 409,746 311<br />
Fifth Third Bancorp (Ñ) 77,400 639<br />
First American Corp. (Ñ) 2,700 78<br />
First Horizon National Corp. (Ñ) 14,461 153<br />
General Growth Properties, Inc. (ö)(Ñ) 36,300 47<br />
Goldman Sachs Group, Inc. (The) 4,615 390<br />
Hartford Financial Services Group, Inc. (Ñ) 38,200 627<br />
Hospitality Properties Trust (ö)(Ñ) 14,400 214<br />
HRPT Properties Trust (ö) 23,400 79<br />
Huntington Bancshares, Inc. (Ñ) 29,000 222<br />
Jefferies Group, Inc. (Ñ) 27,800 391<br />
Jones Lang LaSalle, Inc. (Ñ) 2,900 80<br />
JPMorgan Chase & Co. 157,515 4,966<br />
Keycorp 79,900 681<br />
Lincoln National Corp. 24,100 454<br />
M&T Bank Corp. (Ñ) 3,900 224<br />
Mack-Cali Realty Corp. (ö) 7,600 186<br />
Marsh & McLennan Cos., Inc. 14,400 350<br />
Marshall & Ilsley Corp. (Ñ) 37,600 513<br />
Mastercard, Inc. Class A (Ñ) 7,500 1,072<br />
Mercury General Corp. (Ñ) 16,500 759<br />
Merrill Lynch & Co., Inc. 52,000 605<br />
MetLife, Inc. 38,083 1,328<br />
MF Global, Ltd. (Æ)(Ñ) 13,000 27<br />
Morgan Stanley 72,500 1,163<br />
National Penn Bancshares, Inc. (Ñ) 8,000 116<br />
PartnerRe, Ltd. - ADR (Ñ) 5,000 356<br />
Piper Jaffray Cos. (Æ)(Ñ) 1,300 52<br />
PNC Financial Services Group, Inc. 12,900 632<br />
Prologis (ö)(Ñ) 12,700 176<br />
Prosperity Bancshares, Inc. (Ñ) 4,000 118<br />
Protective Life Corp. 27,900 400<br />
Prudential Financial, Inc. 14,600 442<br />
Regions Financial Corp. (Ñ) 66,400 529<br />
State Street Corp. 16,332 642<br />
Principal<br />
Amount ($)<br />
or Shares<br />
Market<br />
Value<br />
$<br />
SunTrust Banks, Inc. (Ñ) 28,500 842<br />
T Rowe Price Group, Inc. (Ñ) 11,740 416<br />
Travelers Cos., Inc. (The) 25,200 1,139<br />
UDR, Inc. (ö)(Ñ) 10,800 149<br />
United Rentals, Inc. (Æ)(Ñ) 6,114 56<br />
Visa, Inc. (Ñ) 19,694 1,033<br />
Washington Real Estate Investment<br />
Trust (ö)(Ñ) 5,100 144<br />
Wells Fargo & Co. (Ñ) 164,735 4,856<br />
Western Union Co. (The) 33,500 480<br />
Wilmington Trust Corp. (Ñ) 27,100 603<br />
WR Berkley Corp. 10,200 316<br />
Zions Bancorporation (Ñ) 33,600 824<br />
42,851<br />
Health Care - 14.7%<br />
Abbott Laboratories 49,967 2,667<br />
Aetna, Inc. 17,300 493<br />
Alexion Pharmaceuticals, Inc. (Æ)(Ñ) 11,440 414<br />
Allergan, Inc. 20,500 827<br />
AMERIGROUP Corp. Class A (Æ)(Ñ) 7,200 213<br />
AmerisourceBergen Corp. Class A 5,700 203<br />
Amgen, Inc. (Æ) 14,500 837<br />
Baxter International, Inc. 51,810 2,776<br />
Bristol-Myers Squibb Co. 36,500 849<br />
Cardinal Health, Inc. 3,800 131<br />
Centene Corp. (Æ) 1,900 37<br />
Covidien, Ltd. 26,770 970<br />
CVS Caremark Corp. 144,740 4,160<br />
Eli Lilly & Co. 4,000 161<br />
Express Scripts, Inc. Class A (Æ) 21,170 1,164<br />
Forest Laboratories, Inc. (Æ) 13,400 341<br />
Genzyme Corp. (Æ) 6,630 440<br />
Gilead Sciences, Inc. (Æ)(Ñ) 84,740 4,334<br />
Health Net, Inc. (Æ)(Ñ) 9,100 99<br />
Intuitive Surgical, Inc. (Æ)(Ñ) 4,800 610<br />
Johnson & Johnson 42,050 2,516<br />
King Pharmaceuticals, Inc. (Æ)(Ñ) 17,100 182<br />
Life Technologies Corp. (Æ)(Ñ) 25,200 587<br />
Magellan Health Services, Inc. (Æ)(Ñ) 3,900 153<br />
McKesson Corp. 20,100 778<br />
Merck & Co., Inc. 20,900 635<br />
Mylan, Inc. (Æ)(Ñ) 94,600 936<br />
Novartis AG - ADR 37,200 1,851<br />
Owens & Minor, Inc. (Ñ) 1,600 60<br />
Pfizer, Inc. 103,200 1,828<br />
Schering-Plough Corp. 181,057 3,083<br />
Sequenom, Inc. (Æ)(Ñ) 24,000 476<br />
St. Jude Medical, Inc. (Æ) 11,970 395<br />
Stericycle, Inc. (Æ)(Ñ) 7,880 410<br />
Stryker Corp. 24,600 983<br />
Thermo Fisher Scientific, Inc. (Æ) 46,900 1,598<br />
UnitedHealth Group, Inc. 9,000 239<br />
Vertex Pharmaceuticals, Inc. (Æ)(Ñ) 27,300 829<br />
WellPoint, Inc. (Æ) 8,100 341<br />
Wyeth 111,000 4,164<br />
43,770<br />
Multi-Style Equity Fund 15
Russell Investment Funds<br />
Multi-Style Equity Fund<br />
Schedule of Investments, continued — December 31, 2008<br />
Amounts in thousands (except share amounts)<br />
Principal<br />
Amount ($)<br />
or Shares<br />
Market<br />
Value<br />
$<br />
Integrated Oils - 5.0%<br />
BP PLC - ADR 8,700 407<br />
Chevron Corp. 12,000 888<br />
ConocoPhillips 24,600 1,274<br />
Exxon Mobil Corp. 48,900 3,904<br />
Marathon Oil Corp. 110,000 3,009<br />
Occidental Petroleum Corp. 72,950 4,376<br />
Total SA - ADR 18,100 1,001<br />
14,859<br />
Materials and Processing - 5.8%<br />
Air Products & Chemicals, Inc. 25,600 1,287<br />
Alcoa, Inc. (Ñ) 50,800 572<br />
Archer-Daniels-Midland Co. 62,550 1,803<br />
Ashland, Inc. (Ñ) 35,917 378<br />
Avery Dennison Corp. (Ñ) 15,100 494<br />
BHP Billiton, Ltd. - ADR (Ñ) 4,380 188<br />
Bunge, Ltd. (Ñ) 5,300 274<br />
Cabot Corp. 24,800 379<br />
Celanese Corp. Class A 39,100 486<br />
Century Aluminum Co. (Æ)(Ñ) 7,400 74<br />
Ceradyne, Inc. (Æ)(Ñ) 800 16<br />
Chemtura Corp. 12,900 18<br />
Cytec Industries, Inc. 5,300 112<br />
Domtar Corp. (Æ)(Ñ) 39,000 65<br />
Dow Chemical Co. (The) 23,800 359<br />
Ecolab, Inc. 4,580 161<br />
EI Du Pont de Nemours & Co. 53,550 1,355<br />
Fluor Corp. (Ñ) 32,000 1,436<br />
HB Fuller Co. (Ñ) 5,000 81<br />
International Paper Co. (Ñ) 16,400 194<br />
Lubrizol Corp. 14,700 535<br />
Masco Corp. (Ñ) 69,800 777<br />
Monsanto Co. 12,054 848<br />
Mosaic Co. (The) 15,600 540<br />
Newmont Mining Corp. 16,200 659<br />
Nucor Corp. 3,300 152<br />
OM Group, Inc. (Æ)(Ñ) 4,000 84<br />
Potash Corp. of Saskatchewan 2,300 168<br />
PPG Industries, Inc. 7,200 306<br />
Praxair, Inc. 6,400 380<br />
Precision Castparts Corp. 14,000 833<br />
Quanta Services, Inc. (Æ)(Ñ) 31,800 630<br />
RPM International, Inc. 35,850 476<br />
Sherwin-Williams Co. (The) (Ñ) 4,630 277<br />
Smurfit-Stone Container Corp. (Æ) 11,100 3<br />
Steel Dynamics, Inc. 11,100 124<br />
United States Steel Corp. (Ñ) 900 34<br />
Valspar Corp. (Ñ) 17,700 320<br />
Weyerhaeuser Co. (Ñ) 11,000 337<br />
17,215<br />
Miscellaneous - 2.2%<br />
Berkshire Hathaway, Inc. Class B (Æ) 523 1,681<br />
Fortune Brands, Inc. 7,200 297<br />
General Electric Co. 98,000 1,588<br />
Honeywell International, Inc. 54,900 1,802<br />
Principal<br />
Amount ($)<br />
or Shares<br />
Market<br />
Value<br />
$<br />
Johnson Controls, Inc. (Ñ) 34,300 623<br />
Tyco International, Ltd. 31,500 680<br />
6,671<br />
Other Energy - 5.1%<br />
Anadarko Petroleum Corp. 19,900 767<br />
Apache Corp. 10,600 790<br />
Baker Hughes, Inc. 42,100 1,350<br />
Berry Petroleum Co. Class A (Ñ) 6,100 46<br />
BJ Services Co. (Ñ) 10,900 127<br />
Cabot Oil & Gas Corp. 4,000 104<br />
Cameron International Corp. (Æ) 46,540 954<br />
Chesapeake Energy Corp. 20,600 333<br />
Cimarex Energy Co. (Ñ) 8,600 230<br />
Devon Energy Corp. 48,800 3,207<br />
Dynegy, Inc. Class A (Æ)(Ñ) 36,500 73<br />
Halliburton Co. 39,600 720<br />
Helix Energy Solutions Group, Inc. (Æ)(Ñ) 13,800 100<br />
Mariner Energy, Inc. (Æ) 12,000 123<br />
NRG Energy, Inc. (Æ) 7,336 171<br />
PetroHawk Energy Corp. (Æ)(Ñ) 11,340 177<br />
Schlumberger, Ltd. 40,890 1,731<br />
Southwestern Energy Co. (Æ) 15,110 438<br />
Stone Energy Corp. (Æ)(Ñ) 5,400 60<br />
Sunoco, Inc. 16,200 704<br />
Swift Energy Co. (Æ)(Ñ) 4,600 77<br />
Transocean, Ltd. (Æ) 17,600 832<br />
Unit Corp. (Æ)(Ñ) 1,200 32<br />
Valero Energy Corp. 12,640 274<br />
Williams Cos., Inc. 45,605 660<br />
XTO Energy, Inc. 32,100 1,132<br />
15,212<br />
Producer Durables - 4.9%<br />
American Tower Corp. Class A (Æ) 12,100 355<br />
Applied Materials, Inc. 215,950 2,188<br />
Centex Corp. 10,300 110<br />
Deere & Co. 3,400 130<br />
DR Horton, Inc. (Ñ) 9,200 65<br />
Emerson Electric Co. 62,400 2,284<br />
Gardner Denver, Inc. (Æ) 3,400 79<br />
Herman Miller, Inc. 5,300 69<br />
Illinois Tool Works, Inc. (Ñ) 3,800 133<br />
Ingersoll-Rand Co., Ltd. Class A 25,600 444<br />
Lam Research Corp. (Æ) 16,780 357<br />
Lexmark International, Inc. Class A (Æ) 6,600 178<br />
Lockheed Martin Corp. 29,840 2,509<br />
Northrop Grumman Corp. 16,300 734<br />
NVR, Inc. (Æ)(Ñ) 920 420<br />
Parker Hannifin Corp. 10,099 430<br />
Pentair, Inc. 9,060 214<br />
Pitney Bowes, Inc. 20,400 520<br />
Plantronics, Inc. 2,300 30<br />
Pulte Homes, Inc. (Ñ) 27,140 297<br />
Raytheon Co. 14,600 745<br />
Sunpower Corp. (Æ)(Ñ) 18,261 556<br />
16 Multi-Style Equity Fund
Russell Investment Funds<br />
Multi-Style Equity Fund<br />
Schedule of Investments, continued — December 31, 2008<br />
Amounts in thousands (except share amounts)<br />
Principal<br />
Amount ($)<br />
or Shares<br />
Market<br />
Value<br />
$<br />
Terex Corp. (Æ)(Ñ) 5,700 99<br />
United Technologies Corp. 30,100 1,613<br />
14,559<br />
Technology - 15.5%<br />
ADC Telecommunications, Inc. (Æ)(Ñ) 13,200 72<br />
Adobe Systems, Inc. (Æ) 8,850 188<br />
Amphenol Corp. Class A 73,288 1,758<br />
Analog Devices, Inc. 33,000 628<br />
Apple, Inc. (Æ)(Ñ) 49,660 4,239<br />
Avnet, Inc. (Æ) 3,000 55<br />
Broadcom Corp. Class A (Æ) 32,590 553<br />
Cisco Systems, Inc. (Æ) 237,024 3,864<br />
Citrix Systems, Inc. (Æ) 7,000 165<br />
Computer Sciences Corp. (Æ)(Ñ) 3,000 105<br />
Corning, Inc. 2008 (Ñ) 59,800 570<br />
Emulex Corp. (Æ) 3,000 21<br />
F5 Networks, Inc. (Æ)(Ñ) 12,520 286<br />
First Solar, Inc. (Æ)(Ñ) 6,370 879<br />
Garmin, Ltd. (Ñ) 27,200 521<br />
General Dynamics Corp. 25,604 1,475<br />
Google, Inc. Class A (Æ)(Ñ) 14,400 4,430<br />
Hewlett-Packard Co. 187,278 6,796<br />
Ingram Micro, Inc. Class A (Æ) 8,900 119<br />
Intel Corp. 52,500 770<br />
International Business Machines Corp. 20,710 1,743<br />
Jabil Circuit, Inc. 97,700 660<br />
JDS Uniphase Corp. (Æ) 6,200 23<br />
Juniper Networks, Inc. (Æ)(Ñ) 81,200 1,422<br />
Maxim Integrated Products, Inc. 80,300 917<br />
McAfee, Inc. (Æ)(Ñ) 5,470 189<br />
Microsoft Corp. 36,800 715<br />
Motorola, Inc. 93,100 412<br />
Qualcomm, Inc. 208,986 7,488<br />
Research In Motion, Ltd. (Æ) 16,900 686<br />
Rockwell Automation, Inc. 22,900 738<br />
SanDisk Corp. (Æ)(Ñ) 15,450 148<br />
Seagate Technology 90,200 400<br />
Seagate Technology (Æ) 2,300 —<br />
Siemens AG - ADR 6,210 470<br />
Sun Microsystems, Inc. (Æ) 33,300 127<br />
Symantec Corp. (Æ) 35,900 485<br />
Tellabs, Inc. (Æ)(Ñ) 34,800 143<br />
Texas Instruments, Inc. 81,500 1,265<br />
Tyco Electronics, Ltd. Class W 19,433 315<br />
Vishay Intertechnology, Inc. (Æ)(Ñ) 14,300 49<br />
Xilinx, Inc. (Ñ) 16,850 300<br />
46,189<br />
Principal<br />
Amount ($)<br />
or Shares<br />
Market<br />
Value<br />
$<br />
Consolidated Edison, Inc. 10,200 397<br />
DTE Energy Co. 9,600 342<br />
Duke Energy Corp. 20,500 308<br />
Embarq Corp. 8,500 306<br />
Frontier Communications Corp. 41,900 366<br />
MetroPCS Communications, Inc. (Æ)(Ñ) 20,630 306<br />
New Jersey Resources Corp. (Ñ) 3,600 142<br />
NiSource, Inc. 20,300 223<br />
Northwest Natural Gas Co. (Ñ) 1,500 66<br />
Pepco Holdings, Inc. 14,000 249<br />
Pinnacle West Capital Corp. 9,600 308<br />
Progress Energy, Inc. - CVO 1,300 —<br />
Qwest Communications International,<br />
Inc. (Ñ) 43,800 159<br />
Southwest Gas Corp. (Ñ) 2,900 73<br />
US Cellular Corp. (Æ) 900 39<br />
Verizon Communications, Inc. 1,800 61<br />
Vodafone Group PLC - ADR 88,350 1,806<br />
6,207<br />
Total Common Stocks<br />
(cost $344,298) 268,529<br />
Short-Term Investments - 9.4%<br />
Russell Investment Company<br />
Money Market Fund 27,918,000 27,918<br />
Total Short-Term Investments<br />
(cost $27,918) 27,918<br />
Other Securities - 16.9%<br />
State Street Securities Lending Quality<br />
Trust () 53,419,861 50,487<br />
Total Other Securities<br />
(cost $53,420) 50,487<br />
Total Investments - 116.3%<br />
(identified cost $425,636) 346,934<br />
Other Assets and Liabilities,<br />
Net - (16.3%) (48,723)<br />
Net Assets - 100.0% 298,211<br />
Utilities - 2.1%<br />
American Electric Power Co., Inc. 11,600 386<br />
AT&T, Inc. 20,300 579<br />
Atmos Energy Corp. 1,800 43<br />
Avista Corp. (Ñ) 2,500 48<br />
See accompanying notes which are an integral part of the financial statements.<br />
Multi-Style Equity Fund 17
Russell Investment Funds<br />
Multi-Style Equity Fund<br />
Schedule of Investments, continued — December 31, 2008<br />
Amounts in thousands (except contracts)<br />
Futures Contracts<br />
Number of<br />
Contracts<br />
Notional<br />
Amount<br />
Expiration<br />
Date<br />
Unrealized<br />
Appreciation<br />
(Depreciation)<br />
$<br />
Long Positions<br />
Russell 1000 Mini Index 43 USD 2,089 03/09 18<br />
S&P 500 E-Mini Index (CME) 265 USD 11,926 03/09 32<br />
S&P 500 Index (CME) 53 USD 11,926 03/09 63<br />
S&P Midcap 400 E-Mini Index (CME) 118 USD 6,339 03/09 341<br />
Total Unrealized Appreciation (Depreciation) on Open Futures Contracts 454<br />
Presentation of Portfolio Holdings — December 31, 2008<br />
Portfolio Summary<br />
%ofNet<br />
Assets<br />
Auto and Transportation 1.6<br />
Consumer Discretionary 11.4<br />
Consumer Staples 7.4<br />
Financial Services 14.3<br />
Health Care 14.7<br />
Integrated Oils 5.0<br />
Materials and Processing 5.8<br />
Miscellaneous 2.2<br />
Other Energy 5.1<br />
Producer Durables 4.9<br />
Technology 15.5<br />
Utilities 2.1<br />
Short-Term Investments 9.4<br />
Other Securities 16.9<br />
Total Investments 116.3<br />
Other Assets and Liabilities, Net (16.3)<br />
100.0<br />
Futures Contracts 0.2<br />
See accompanying notes which are an integral part of the financial statements.<br />
18 Multi-Style Equity Fund
(This page intentionally left blank)
Russell Investment Funds<br />
Aggressive Equity Fund<br />
Portfolio Management Discussion and Analysis — December 31, 2008 (Unaudited)<br />
Growth of a $10,000 Investment<br />
$24,000<br />
$22,000<br />
$20,000<br />
$18,000<br />
$16,000<br />
$14,000<br />
$12,000<br />
$10,000<br />
Aggressive Equity Fund<br />
Russell 2500 Index**<br />
$8,000<br />
*<br />
1999<br />
2000<br />
2001<br />
2002 2003 2004<br />
Yearly periods ended December 31<br />
2005<br />
2006<br />
2007<br />
2008<br />
Aggressive Equity Fund<br />
Total<br />
Return<br />
1 Year (44.16)%<br />
5 Years (4.15)%§<br />
10 Years (0.19)%§<br />
Russell 2500 Index **<br />
Total<br />
Return<br />
1 Year (36.79)%<br />
5 Years (0.99)%§<br />
10 Years 4.08%§<br />
* Assumes initial investment on January 1, 1999.<br />
** Russell 2500 Index is composed of the bottom 500 stocks the Russell 1000 ® Index and all the stocks in the Russell 2000 ® Index. The Russell 2500 Index<br />
return reflects adjustments for income dividends and capital gains distributions reinvested as of the ex-dividend dates.<br />
§ <strong>Annual</strong>ized.<br />
The performance shown in this section does not reflect any Insurance Company Separate Account or Policy Charges. Performance is historical and assumes<br />
reinvestment of all dividends and capital gains. Investment return and principal value will fluctuate so that an investor’s shares, when redeemed, may be worth more or<br />
less than when purchased. Past performance is not indicative of future results.<br />
20 Aggressive Equity Fund
Russell Investment Funds<br />
Aggressive Equity Fund<br />
Portfolio Management Discussion — December 31, 2008 (Unaudited)<br />
The Aggressive Equity Fund (the “Fund”) allocates most of its<br />
assets among multiple money managers. Russell Investment<br />
Management Company (“RIMCo”), as the Fund’s advisor, may<br />
change the allocation of the Fund’s assets among money<br />
managers at any time. An exemptive order from the Securities<br />
and Exchange Commission (SEC) permits RIMCo to engage or<br />
terminate a money manager at any time, subject to the approval<br />
by the Fund’s Board without a shareholder vote. Pursuant to the<br />
terms of the exemptive order, the Fund is required to notify its<br />
shareholders within 60 days of when a money manager begins<br />
providing services. The Fund currently has eight money<br />
managers.<br />
What is the Fund’s investment objective?<br />
The Fund seeks to provide long term capital growth.<br />
How did the Fund perform relative to its benchmark for<br />
the fiscal year ended December 31, 2008?<br />
For the fiscal year ended December 31, 2008, the Aggressive<br />
Equity Fund lost 44.16%. This compared to the Russell 2500<br />
Index, which lost 36.79% during the same period. The Fund’s<br />
performance includes operating expenses, whereas Index<br />
returns are unmanaged and do not include expenses of any<br />
kind.<br />
For the year ended December 31, 2008, the Lipper ® Small-Cap<br />
Core Funds (VIP) Average lost 36.02%. This result serves as a<br />
peer comparison and is expressed net of operating expenses.<br />
How did the market conditions described in the Market<br />
Summary report affect the Fund’s performance?<br />
The financial crisis that unfolded in 2008 directly impacted<br />
Fund performance. Throughout the year, the Fund was<br />
underweight regional banks, because of concerns about credit<br />
and the value of their loan portfolios. Despite investor concerns,<br />
the regional banks industry outperformed the broader index by<br />
over 20% as the Federal Reserve and U.S. Treasury offered<br />
wide ranging means of support (cutting interest rates, instituting<br />
the Troubled Assets Relief Program (TARP) funds and<br />
acquiring of troubled securities). An overweight to other energy<br />
hurt the Fund as the prices of energy stocks fell as the price of<br />
oil fell. Additionally, stock selection within producer durables<br />
and technology sectors hurt the Fund as consumer demand for<br />
related products in these sectors slowed. Stocks that started the<br />
year with higher estimated growth (a typical overweight within<br />
the Fund) underperformed as many securities with these<br />
characteristics saw forward earnings estimates decreased<br />
significantly.<br />
The Fund’s strategy of being fully invested and exposing cash<br />
reserves to the performance of appropriate markets by<br />
purchasing equity securities and/or derivatives was a drag on<br />
performance relative to peers that held larger cash positions as<br />
the Russell 2500 Index was down over 35%.<br />
How did the investment strategies and techniques<br />
employed by the Fund and its money managers affect<br />
its performance?<br />
The Fund employs eight managers: three growth, two marketoriented,<br />
and three value managers. PanAgora Asset<br />
Management Company LLC was the only manager to outperform<br />
its benchmark. The remaining managers underperformed by<br />
varying degrees. Those managers on the style extremes, with<br />
larger sector deviation, detracted the most from performance.<br />
Signia Capital Management, LLC, which was added to the Fund<br />
in March, has underperformed since being added to the Fund.<br />
Gould Investment Partners LLC, Ranger Investment<br />
Management, L.P., and Signia were the worst performing<br />
managers. Gould, a high-growth manager, underperformed as a<br />
result of an overweight to other energy in addition to negative<br />
stock selection within producer durables and consumer<br />
discretionary. Gould’s high-growth process was not rewarded<br />
during the year.<br />
Ranger’s underperformance was driven by stock selection<br />
within the technology, materials and processing and health care<br />
sectors. Like Gould, Ranger’s exposure to the highest growth<br />
stocks detracted from its performance.<br />
Signia, a deep value manager, benefited from stock selection in<br />
the materials and processing sector. However, this was offset by<br />
weak stock selection in the health care and technology sectors,<br />
and an underweight to the financial service sector.<br />
PanAgora modestly outperformed. PanAgora’s lower-beta (beta<br />
is the volatility of a given security compared to the volatility of<br />
the market as a whole) investment strategy was rewarded during<br />
the volatile year. The portfolio benefited from being equally<br />
distributed along the capital spectrum and investing in<br />
moderately valued stocks.<br />
The Fund’s performance shown throughout this report was<br />
based on valuations calculated in accordance with Generally<br />
Accepted Accounting Principles (GAAP) and, in accordance<br />
with a newly effective accounting statement (SFAS 157),<br />
reflects the December 31, 2008 market value of the pooled<br />
investment vehicle in which the Fund invested its cash<br />
collateral received in securities lending transactions. This<br />
market value is lower than the vehicle’s amortized cost. This<br />
had a negative impact on the Fund’s benchmark relative<br />
performance.<br />
Describe any changes to the Fund’s structure or the<br />
money manager line-up.<br />
In March of 2008, Signia Capital Management, LLC was hired<br />
to replace David J. Greene and Company, LLC.<br />
Aggressive Equity Fund 21
Russell Investment Funds<br />
Aggressive Equity Fund<br />
Portfolio Management Discussion — December 31, 2008 (Unaudited)<br />
Money Managers as of<br />
December 31, 2008<br />
ClariVest Asset Management LLC<br />
DePrince, Race, & Zollo, Inc.<br />
Gould Investment Partners LLC<br />
Jacobs Levy Equity Management, LLC<br />
PanAgora Asset Management Company LLC<br />
Ranger Investment Management, L.P.<br />
Signia Capital Management, LLC<br />
Tygh Capital Management, Inc.<br />
Styles<br />
Market Oriented<br />
Value<br />
Growth<br />
Value<br />
Market Oriented<br />
Growth<br />
Value<br />
Growth<br />
The views expressed in this report reflect those of the portfolio<br />
managers only through the end of the period covered by the report.<br />
These views do not necessarily represent the views of RIMCo, or any<br />
other person in RIMCo or any other affiliated organization. These views<br />
are subject to change at any time based upon market conditions or<br />
other events, and RIMCo disclaims any responsibility to update the<br />
views contained herein. These views should not be relied on as<br />
investment advice and, because investment decisions for Russell<br />
Investment Funds (RIF) are based on numerous factors, should not be<br />
relied on as an indication of investment decisions of any RIF Fund.<br />
22 Aggressive Equity Fund
Russell Investment Funds<br />
Aggressive Equity Fund<br />
Shareholder Expense Example — December 31, 2008 (Unaudited)<br />
Fund Expenses<br />
The following disclosure provides important information<br />
regarding each Fund’s Expense Example, which appears<br />
on each Fund’s individual page in this <strong>Annual</strong> Report.<br />
Please refer to this information when reviewing the<br />
Expense Example for a Fund.<br />
Example<br />
As a shareholder of the Fund, you incur two types of costs: (1)<br />
transaction costs, and (2) ongoing costs, including management<br />
fees and other Fund expenses. The Example is intended to help<br />
you understand your ongoing costs (in dollars) of investing in<br />
the Fund and to compare these costs with the ongoing costs of<br />
investing in other mutual funds. The Example is based on an<br />
investment of $1,000 invested at the beginning of the period<br />
and held for the entire period indicated, which for this Fund is<br />
from July 1, 2008 to December 31, 2008.<br />
Actual Expenses<br />
The information in the table under the heading “Actual<br />
Performance” provides information about actual account values<br />
and actual expenses. You may use the information in this<br />
column, together with the amount you invested, to estimate the<br />
expenses that you paid over the period. Simply divide your<br />
account value by $1,000 (for example, an $8,600 account value<br />
divided by $1,000 = 8.6), then multiply the result by the<br />
number in the first column in the row entitled “Expenses Paid<br />
During Period” to estimate the expenses you paid on your<br />
account during this period.<br />
Hypothetical Example for Comparison Purposes<br />
The information in the table under the heading “Hypothetical<br />
Performance (5% return before expenses)” provides information<br />
about hypothetical account values and hypothetical expenses<br />
based on the Fund’s actual expense ratio and an assumed rate<br />
of return of 5% per year before expenses, which is not the<br />
Fund’s actual return. The hypothetical account values and<br />
expenses may not be used to estimate the actual ending account<br />
balance or expenses you paid for the period. You may use this<br />
information to compare the ongoing costs of investing in the<br />
Fund and other funds. To do so, compare this 5% hypothetical<br />
example with the 5% hypothetical examples that appear in the<br />
shareholder reports of other funds.<br />
Please note that the expenses shown in the table are meant to<br />
highlight your ongoing costs only and do not reflect any<br />
transactional costs. Therefore, the information under the<br />
heading “Hypothetical Performance (5% return before<br />
expenses)” is useful in comparing ongoing costs only, and will<br />
not help you determine the relative total costs of owning<br />
different funds. In addition, if these transactional costs were<br />
included, your costs would have been higher. The fee and<br />
expenses shown in this section do not reflect any Insurance<br />
Company Separate Account or Policy Charges.<br />
Actual<br />
Performance<br />
Hypothetical<br />
Performance<br />
(5% return<br />
before expenses)<br />
Beginning Account Value<br />
July 1, 2008 $ 1,000.00 $ 1,000.00<br />
Ending Account Value<br />
December 31, 2008 $ 622.46 $ 1,019.86<br />
Expenses Paid During Period* $ 4.28 $ 5.33<br />
* Expenses are equal to the Fund’s annualized expense ratio of 1.05%<br />
(representing the one-half year period annualized), multiplied by the average<br />
account value over the period, multiplied by 184/366 (to reflect the one-half<br />
year period). Reflects amounts waived and/or reimbursed. Without the waiver<br />
and/or reimbursement, expenses would have been higher.<br />
Aggressive Equity Fund 23
Russell Investment Funds<br />
Aggressive Equity Fund<br />
Schedule of Investments — December 31, 2008<br />
Amounts in thousands (except share amounts)<br />
Principal<br />
Amount ($)<br />
or Shares<br />
Market<br />
Value<br />
$<br />
Common Stocks - 91.3%<br />
Auto and Transportation - 3.9%<br />
Allegiant Travel Co. (Æ)(Ñ) 6,400 311<br />
American Railcar Industries, Inc. (Ñ) 500 5<br />
AMR Corp. (Æ)(Ñ) 20,500 219<br />
Arctic Cat, Inc. (Ñ) 1,800 9<br />
Arkansas Best Corp. (Ñ) 8,341 251<br />
ArvinMeritor, Inc. (Ñ) 9,700 28<br />
Autoliv, Inc. 3,268 70<br />
BorgWarner, Inc. (Ñ) 1,458 32<br />
Con-way, Inc. (Ñ) 7,800 208<br />
Cooper Tire & Rubber Co. (Ñ) 51,400 317<br />
Expeditors International of Washington,<br />
Inc. (Ñ) 5,307 177<br />
Force Protection, Inc. (Æ) 3,700 22<br />
Forward Air Corp. (Ñ) 2,400 58<br />
FreightCar America, Inc. 2,000 37<br />
Genesee & Wyoming, Inc. Class A (Æ) 13,040 398<br />
Global Ship Lease, Inc. (Ñ) 16,200 46<br />
Goodyear Tire & Rubber Co. (The) (Æ) 8,400 50<br />
Greenbrier Cos., Inc. (Ñ) 2,200 15<br />
Hawaiian Holdings, Inc. (Æ)(Ñ) 4,188 27<br />
Kirby Corp. (Æ)(Ñ) 3,323 91<br />
Lear Corp. (Æ)(Ñ) 10,200 14<br />
Navistar International Corp. (Æ) 6,493 139<br />
Old Dominion Freight Line, Inc. (Æ) 40 1<br />
Oshkosh Corp. (Ñ) 165 1<br />
Pacer International, Inc. 10,188 106<br />
PHI, Inc. (Æ)(Ñ) 8,136 114<br />
Polaris Industries, Inc. (Ñ) 2,975 85<br />
Republic Airways Holdings, Inc. (Æ) 1,819 19<br />
Saia, Inc. (Æ) 2,300 25<br />
Skywest, Inc. (Ñ) 20,840 388<br />
Stoneridge, Inc. (Æ)(Ñ) 1,600 7<br />
Strattec Security Corp. 7,607 125<br />
Superior Industries International, Inc. (Ñ) 17,140 180<br />
Tenneco, Inc. (Æ)(Ñ) 6,800 20<br />
Tidewater, Inc. (Ñ) 3,850 155<br />
TRW Automotive Holdings Corp. (Æ)(Ñ) 11,200 40<br />
US Airways Group, Inc. (Æ)(Ñ) 14,900 115<br />
UTI Worldwide, Inc. 13,676 196<br />
Visteon Corp. (Æ)(Ñ) 5,500 2<br />
Wabash National Corp. 2,800 13<br />
Wabtec Corp. (Ñ) 13,542 538<br />
Werner Enterprises, Inc. (Ñ) 9,398 163<br />
YRC Worldwide, Inc. (Æ)(Ñ) 7,800 22<br />
4,839<br />
Consumer Discretionary - 15.1%<br />
4Kids Entertainment, Inc. (Æ) 55,840 109<br />
99 Cents Only Stores (Æ)(Ñ) 23,120 253<br />
Aaron Rents, Inc. (Ñ) 6,600 176<br />
Abercrombie & Fitch Co. Class A (Ñ) 1,925 44<br />
Administaff, Inc. 872 19<br />
Advance Auto Parts, Inc. (Ñ) 5,422 182<br />
AFC Enterprises, Inc. (Æ) 2,800 13<br />
American Eagle Outfitters, Inc. (Ñ) 24,900 233<br />
Principal<br />
Amount ($)<br />
or Shares<br />
Market<br />
Value<br />
$<br />
American Greetings Corp. Class A 5,700 42<br />
American Public Education, Inc. (Æ) 4,500 167<br />
American Woodmark Corp. 800 15<br />
AnnTaylor Stores Corp. (Æ)(Ñ) 9,215 53<br />
Apollo Group, Inc. Class A (Æ) 4,836 371<br />
Asbury Automotive Group, Inc. 7,300 33<br />
AutoNation, Inc. (Æ)(Ñ) 8,600 85<br />
Avis Budget Group, Inc. (Æ)(Ñ) 13,500 9<br />
Bally Technologies, Inc. (Æ)(Ñ) 7,682 185<br />
Barnes & Noble, Inc. 2,300 35<br />
Bebe Stores, Inc. (Ñ) 47,700 356<br />
BJ’s Wholesale Club, Inc. (Æ)(Ñ) 4,789 164<br />
Blockbuster, Inc. Class A (Æ)(Ñ) 34,500 43<br />
Blyth, Inc. (Ñ) 2,400 19<br />
Brightpoint, Inc. (Æ)(Ñ) 19,585 85<br />
Brink’s Co. (The) 1,152 31<br />
Brink’s Home Security Holdings, Inc. (Æ) 1,318 29<br />
Brinker International, Inc. 14,300 151<br />
Brown Shoe Co., Inc. (Ñ) 3,400 29<br />
Buckle, Inc. (The) (Ñ) 3,900 85<br />
Build-A-Bear Workshop, Inc.<br />
Class A (Æ)(Ñ) 3,900 19<br />
Cabela’s, Inc. (Æ)(Ñ) 4,000 23<br />
Capella Education Co. (Æ)(Ñ) 5,641 331<br />
Career Education Corp. (Æ)(Ñ) 5,989 107<br />
Carter’s, Inc. (Æ)(Ñ) 15,450 298<br />
CDI Corp. 1,100 14<br />
Central European Distribution Corp. (Æ)(Ñ) 1,700 34<br />
Charlotte Russe Holding, Inc. (Æ) 3,300 21<br />
Charming Shoppes, Inc. (Æ)(Ñ) 3,867 9<br />
Chemed Corp. (Ñ) 174 7<br />
Childrens Place Retail Stores, Inc.<br />
(The) (Æ) 2,100 46<br />
Chipotle Mexican Grill, Inc. Class A (Æ)(Ñ) 950 59<br />
Chipotle Mexican Grill, Inc. Class B (Æ)(Ñ) 1,310 75<br />
Christopher & Banks Corp. 1,739 10<br />
Churchill Downs, Inc. (Ñ) 4,195 170<br />
Cintas Corp. 3,327 77<br />
CKE Restaurants, Inc. (Ñ) 20,800 181<br />
Conn’s, Inc. (Æ)(Ñ) 500 4<br />
Copart, Inc. (Æ)(Ñ) 15,686 427<br />
Corrections Corp. of America (Æ) 27,622 452<br />
CRA International, Inc. (Æ)(Ñ) 411 11<br />
Cracker Barrel Old Country Store, Inc. (Ñ) 8,000 165<br />
CSS Industries, Inc. 710 13<br />
DeVry, Inc. 9,537 548<br />
Dice Holdings, Inc. (Æ)(Ñ) 2,009 8<br />
Dick’s Sporting Goods, Inc. (Æ)(Ñ) 11,147 157<br />
Dillard’s, Inc. Class A 2,900 12<br />
Dollar Tree, Inc. (Æ)(Ñ) 16,230 678<br />
Domino’s Pizza, Inc. (Æ)(Ñ) 900 4<br />
DSW, Inc. Class A (Æ)(Ñ) 2,100 26<br />
Earthlink, Inc. (Æ)(Ñ) 33,600 227<br />
Eastman Kodak Co. (Ñ) 6,100 40<br />
Ethan Allen Interiors, Inc. (Ñ) 4,000 57<br />
EW Scripps Co. Class A (Ñ) 28,759 64<br />
Ezcorp, Inc. Class A (Æ) 15,800 240<br />
24 Aggressive Equity Fund
Russell Investment Funds<br />
Aggressive Equity Fund<br />
Schedule of Investments, continued — December 31, 2008<br />
Amounts in thousands (except share amounts)<br />
Principal<br />
Amount ($)<br />
or Shares<br />
Market<br />
Value<br />
$<br />
Fastenal Co. (Ñ) 2,509 87<br />
Finish Line (The) Class A 9,400 53<br />
Foot Locker, Inc. (Ñ) 8,658 64<br />
Fred’s, Inc. Class A (Ñ) 6,900 74<br />
FTI Consulting, Inc. (Æ)(Ñ) 3,586 160<br />
Furniture Brands International, Inc. (Ñ) 7,300 16<br />
G&K Services, Inc. Class A (Ñ) 1,637 33<br />
GameStop Corp. Class A (Æ) 10,074 218<br />
Gannett Co., Inc. (Ñ) 12,700 102<br />
Gap, Inc. (The) 19,190 257<br />
Genesco, Inc. (Æ)(Ñ) 3,086 52<br />
Geo Group, Inc. (The) (Æ)(Ñ) 13,523 244<br />
Group 1 Automotive, Inc. (Ñ) 4,400 47<br />
Harman International Industries, Inc. (Ñ) 6,224 104<br />
Haverty Furniture Cos., Inc. (Ñ) 1,700 16<br />
Heidrick & Struggles International, Inc. (Ñ) 5,460 118<br />
Helen of Troy, Ltd. (Æ) 14,600 253<br />
Hewitt Associates, Inc. Class A (Æ) 10,300 292<br />
Hooker Furniture Corp. (Ñ) 1,300 10<br />
HOT Topic, Inc. (Æ)(Ñ) 8,300 77<br />
IAC/InterActiveCorp (Æ)(Ñ) 1,375 22<br />
infoGROUP, Inc. (Ñ) 3,315 16<br />
Infospace, Inc. 685 5<br />
Insight Enterprises, Inc. (Æ)(Ñ) 6,800 47<br />
Interval Leisure Group, Inc. (Æ)(Ñ) 561 3<br />
ITT Educational Services, Inc. (Æ)(Ñ) 2,852 271<br />
Jackson Hewitt Tax Service, Inc. 4,050 64<br />
Jarden Corp. (Æ)(Ñ) 10,400 120<br />
Jo-Ann Stores, Inc. (Æ)(Ñ) 2,200 34<br />
Journal Communications, Inc. Class A (Ñ) 8,000 20<br />
K12, Inc. (Æ)(Ñ) 1,125 21<br />
Kelly Services, Inc. Class A (Ñ) 4,400 57<br />
Kenneth Cole Productions, Inc. Class A (Ñ) 13,727 97<br />
La-Z-Boy, Inc. (Ñ) 5,600 12<br />
Lakeland Industries, Inc. (Æ) 16,885 137<br />
Leggett & Platt, Inc. (Ñ) 3,482 53<br />
LIN TV Corp. Class A (Æ)(Ñ) 3,900 4<br />
LKQ Corp. (Æ)(Ñ) 10,999 128<br />
LS Starrett Co. 4,234 68<br />
Maidenform Brands, Inc. (Æ) 1,700 17<br />
Manpower, Inc. (Ñ) 2,516 86<br />
MAXIMUS, Inc. 556 20<br />
McClatchy Co. Class A (Ñ) 6,600 5<br />
Media General, Inc. Class A (Ñ) 2,681 5<br />
Men’s Wearhouse, Inc. (The) (Ñ) 11,300 153<br />
Meredith Corp. (Ñ) 2,790 48<br />
MPS Group, Inc. (Æ)(Ñ) 2,800 21<br />
Navigant Consulting, Inc. (Æ)(Ñ) 2,503 40<br />
Netease.com - ADR (Æ)(Ñ) 9,800 217<br />
New York & Co., Inc. (Æ)(Ñ) 4,000 9<br />
Nu Skin Enterprises, Inc. Class A (Ñ) 4,300 45<br />
O’Charleys, Inc. (Ñ) 13,446 27<br />
O’Reilly Automotive, Inc. (Æ)(Ñ) 8,903 274<br />
Office Depot, Inc. (Æ) 43,500 130<br />
OfficeMax, Inc. 9,900 76<br />
On Assignment, Inc. (Æ) 15,800 90<br />
Oxford Industries, Inc. 2,300 20<br />
Principal<br />
Amount ($)<br />
or Shares<br />
Market<br />
Value<br />
$<br />
Panera Bread Co. Class A (Æ)(Ñ) 1,056 55<br />
Pantry, Inc. (The) (Æ)(Ñ) 4,400 94<br />
Parlux Fragrances, Inc. (Æ) 35,017 102<br />
PC Connection, Inc. (Æ) 2,000 10<br />
Perry Ellis International, Inc. (Æ)(Ñ) 2,200 14<br />
PetMed Express, Inc. (Æ)(Ñ) 7,000 123<br />
PF Chang’s China Bistro, Inc. (Æ)(Ñ) 1,647 35<br />
Phillips-Van Heusen Corp. 1,435 29<br />
Pool Corp. (Ñ) 5,150 93<br />
Pre-Paid Legal Services, Inc. (Æ)(Ñ) 285 11<br />
Prestige Brands Holdings, Inc. (Æ) 20,939 221<br />
PRG-Schultz International, Inc. (Æ) 4,989 20<br />
Quiksilver, Inc. (Æ) 14,500 27<br />
RadioShack Corp. (Ñ) 5,710 68<br />
RC2 Corp. (Æ)(Ñ) 3,806 41<br />
Red Lion Hotels Corp. (Æ) 24,355 58<br />
Rent-A-Center, Inc. Class A (Æ) 7,200 127<br />
Republic Services, Inc. Class A 22,048 547<br />
Revlon, Inc. Class A (Æ) 1,110 7<br />
Ross Stores, Inc. (Ñ) 8,522 253<br />
RR Donnelley & Sons Co. 1,899 26<br />
Ruby Tuesday, Inc. (Æ)(Ñ) 8,300 13<br />
Rush Enterprises, Inc. Class A (Æ)(Ñ) 3,091 27<br />
Rush Enterprises, Inc. Class B (Æ) 122 1<br />
Scholastic Corp. (Ñ) 4,286 58<br />
School Specialty, Inc. (Æ)(Ñ) 643 12<br />
Shanda Interactive Entertainment, Ltd. -<br />
ADR (Æ)(Ñ) 5,000 162<br />
Shoe Carnival, Inc. (Æ) 1,400 13<br />
Sinclair Broadcast Group, Inc. Class A (Ñ) 9,200 29<br />
Skechers U.S.A., Inc. Class A (Æ) 4,400 56<br />
Sohu.com, Inc. (Æ)(Ñ) 1,697 80<br />
Sonic Automotive, Inc. Class A (Ñ) 7,400 29<br />
Spherion Corp. (Æ) 2,900 6<br />
Stage Stores, Inc. 4,000 33<br />
Stanley Works (The) 2,726 93<br />
Starbucks Corp. (Æ)(Ñ) 11,220 106<br />
Stewart Enterprises, Inc. Class A (Ñ) 65,000 196<br />
Strayer Education, Inc. (Ñ) 2,124 455<br />
Take-Two Interactive Software, Inc. (Æ)(Ñ) 11,800 89<br />
Talbots, Inc. (Ñ) 1,000 2<br />
Tech Data Corp. (Æ) 7,858 140<br />
Tempur-Pedic International, Inc. 5,300 38<br />
thinkorswim Group, Inc. (Æ)(Ñ) 12,800 72<br />
Ticketmaster Entertainment, Inc. (Æ)(Ñ) 184 1<br />
Timberland Co. Class A (Æ)(Ñ) 1,601 19<br />
Toro Co. (Ñ) 613 20<br />
Tractor Supply Co. (Æ)(Ñ) 2,405 87<br />
Tuesday Morning Corp. (Æ)(Ñ) 7,200 12<br />
Tween Brands, Inc. (Æ)(Ñ) 2,500 11<br />
United Online, Inc. (Ñ) 57,381 348<br />
United Stationers, Inc. (Æ) 4,384 147<br />
Universal Electronics, Inc. (Æ) 338 5<br />
Universal Technical Institute, Inc. (Æ) 8,400 144<br />
Urban Outfitters, Inc. (Æ)(Ñ) 7,000 105<br />
Valassis Communications, Inc. (Æ)(Ñ) 6,200 8<br />
Waste Connections, Inc. (Æ)(Ñ) 18,907 597<br />
Aggressive Equity Fund 25
Russell Investment Funds<br />
Aggressive Equity Fund<br />
Schedule of Investments, continued — December 31, 2008<br />
Amounts in thousands (except share amounts)<br />
Principal<br />
Amount ($)<br />
or Shares<br />
Market<br />
Value<br />
$<br />
Watson Wyatt Worldwide, Inc. Class A 1,842 88<br />
WESCO International, Inc. (Æ) 4,431 85<br />
Wet Seal, Inc. (The) Class A (Æ)(Ñ) 45,100 134<br />
Williams-Sonoma, Inc. (Ñ) 24,700 194<br />
WMS Industries, Inc. (Æ)(Ñ) 7,915 213<br />
Wolverine World Wide, Inc. 8,400 177<br />
Wyndham Worldwide Corp. (Ñ) 15,600 102<br />
18,537<br />
Consumer Staples - 2.7%<br />
Casey’s General Stores, Inc. 2,387 54<br />
Chiquita Brands International, Inc. (Æ)(Ñ) 12,946 191<br />
Church & Dwight Co., Inc. (Ñ) 15,234 855<br />
Constellation Brands, Inc. Class A (Æ) 4,877 77<br />
Dean Foods Co. (Æ)(Ñ) 1,462 26<br />
Del Monte Foods Co. 71,321 509<br />
Diamond Foods, Inc. (Ñ) 3,268 66<br />
Fresh Del Monte Produce, Inc. (Æ) 11,100 249<br />
Green Mountain Coffee Roasters,<br />
Inc. (Æ)(Ñ) 6,750 261<br />
Imperial Sugar Co. 900 13<br />
Lance, Inc. (Ñ) 1,100 25<br />
Molson Coors Brewing Co. Class B 3,206 157<br />
Monterey Gourmet Foods, Inc. (Æ)(Å) 125,695 133<br />
Nash Finch Co. (Ñ) 1,100 49<br />
NBTY, Inc. (Æ)(Ñ) 4,704 74<br />
Omega Protein Corp. (Æ) 2,600 11<br />
Ralcorp Holdings, Inc. (Æ) 2,280 133<br />
Schweitzer-Mauduit International, Inc. 2,700 54<br />
Spartan Stores, Inc. (Ñ) 1,700 40<br />
SUPERVALU, Inc. 2,100 31<br />
Tootsie Roll Industries, Inc. (Ñ) 4,434 114<br />
TreeHouse Foods, Inc. (Æ)(Ñ) 5,080 138<br />
Weis Markets, Inc. 1,986 67<br />
3,327<br />
Financial Services - 18.0%<br />
Advance America Cash Advance Centers,<br />
Inc. (Ñ) 7,833 15<br />
Affiliated Managers Group, Inc. (Æ)(Ñ) 7,197 302<br />
Alexandria Real Estate Equities, Inc. (ö)(Ñ) 1,235 75<br />
Alliance Data Systems Corp. (Æ)(Ñ) 9,360 436<br />
Allied Capital Corp. (Ñ) 33,097 89<br />
Allied World Assurance Co. Holdings, Ltd. 5,400 219<br />
American Capital Agency Corp. (ö)(Ñ) 4,650 99<br />
American Equity Investment Life Holding<br />
Co. (Ñ) 20,500 143<br />
American Financial Group, Inc. 6,223 142<br />
Amerisafe, Inc. (Æ) 3,776 78<br />
Amtrust Financial Services, Inc. (Ñ) 7,185 83<br />
Anchor Bancorp Wisconsin, Inc. (Ñ) 2,500 7<br />
Annaly Capital Management, Inc. (ö)(Ñ) 11,200 178<br />
Anthracite Capital, Inc. (ö)(Ñ) 9,700 22<br />
Anworth Mortgage Asset Corp. (ö)(Ñ) 51,700 332<br />
Apartment Investment & Management Co.<br />
Class A (ö)(Ñ) 455 5<br />
Arbor Realty Trust, Inc. (ö)(Ñ) 4,700 14<br />
Principal<br />
Amount ($)<br />
or Shares<br />
Market<br />
Value<br />
$<br />
Arch Capital Group, Ltd. (Æ)(Ñ) 6,400 449<br />
Ares Capital Corp. 23,605 149<br />
Arthur J Gallagher & Co. (Ñ) 8,500 220<br />
Ashford Hospitality Trust, Inc. (ö)(Ñ) 9,100 10<br />
Asset Acceptance Capital Corp. (Æ)(Ñ) 2,400 12<br />
Astoria Financial Corp. (Ñ) 9,659 159<br />
Bancfirst Corp. (Ñ) 1,000 53<br />
Banco Latinoamericano de Exportaciones<br />
SA Class E 4,800 69<br />
Bancorp, Inc. (Æ)(Ñ) 400 1<br />
Bancorpsouth, Inc. (Ñ) 9,079 212<br />
Bank of Hawaii Corp. (Ñ) 5,866 265<br />
Bank of the Ozarks, Inc. (Ñ) 2,201 65<br />
Berkshire Hills Bancorp, Inc. 3,300 102<br />
BioMed Realty Trust, Inc. (ö)(Ñ) 8 —<br />
BOK Financial Corp. (Ñ) 1,271 51<br />
Brandywine Realty Trust (ö)(Ñ) 15,500 120<br />
Calamos Asset Management, Inc.<br />
Class A (Ñ) 4,300 32<br />
Capital City Bank Group, Inc. (Ñ) 600 16<br />
Capitol Bancorp, Ltd. (Ñ) 2,600 20<br />
Capitol Federal Financial (Ñ) 1,788 82<br />
CapLease, Inc. (ö)(Ñ) 4,100 7<br />
Capstead Mortgage Corp. (ö) 18,817 203<br />
Cash America International, Inc. 3,229 88<br />
Cathay General Bancorp (Ñ) 8,300 197<br />
Cedar Shopping Centers, Inc. (ö) 2,000 14<br />
Center Financial Corp. (Ñ) 11,175 69<br />
Central Pacific Financial Corp. (Ñ) 6,500 65<br />
Cigna Corp. 12,100 204<br />
Citizens Republic Bancorp, Inc. (Ñ) 14,900 44<br />
City Holding Co. (Ñ) 3,148 109<br />
CNA Surety Corp. (Æ) 4,038 78<br />
Colonial Properties Trust (ö)(Ñ) 8,200 68<br />
Columbia Banking System, Inc. (Ñ) 2,400 29<br />
Commerce Bancshares, Inc. (Ñ) 7,203 317<br />
Community Bank System, Inc. (Ñ) 9,773 238<br />
Community Trust Bancorp, Inc. (Ñ) 1,000 37<br />
Conseco, Inc. (Æ)(Ñ) 18,600 96<br />
Cullen/Frost Bankers, Inc. (Ñ) 2,229 113<br />
Cybersource Corp. (Æ)(Ñ) 11,250 135<br />
Delphi Financial Group, Inc. Class A 14,829 273<br />
Deluxe Corp. (Ñ) 19,497 292<br />
Digital Realty Trust, Inc. (ö)(Ñ) 1,102 36<br />
Dime Community Bancshares (Ñ) 5,453 73<br />
Discover Financial Services 7,788 74<br />
DuPont Fabros Technology, Inc. (ö) 12,139 25<br />
East West Bancorp, Inc. (Ñ) 560 9<br />
Eaton Vance Corp. (Ñ) 1,070 22<br />
Electro Rent Corp. (Ñ) 25,627 286<br />
EMC Insurance Group, Inc. (Ñ) 900 23<br />
Employers Holdings, Inc. 3,300 54<br />
Encore Capital Group, Inc. (Æ) 1,700 12<br />
Endurance Specialty Holdings, Ltd. (Ñ) 7,600 232<br />
Equity Lifestyle Properties, Inc. (ö)(Ñ) 1,047 40<br />
Evercore Partners, Inc. Class A (Ñ) 12,700 159<br />
FBL Financial Group, Inc. Class A (Ñ) 1,800 28<br />
26 Aggressive Equity Fund
Russell Investment Funds<br />
Aggressive Equity Fund<br />
Schedule of Investments, continued — December 31, 2008<br />
Amounts in thousands (except share amounts)<br />
Principal<br />
Amount ($)<br />
or Shares<br />
Market<br />
Value<br />
$<br />
Federal Realty Investment Trust (ö)(Ñ) 724 45<br />
Federated Investors, Inc. Class B (Ñ) 4,230 72<br />
FelCor Lodging Trust, Inc. (ö)(Ñ) 11,200 21<br />
Fidelity National Information Services, Inc. 3,126 51<br />
First American Corp. 9,300 269<br />
First Bancorp (Ñ) 10,200 114<br />
First Cash Financial Services, Inc. (Æ)(Ñ) 4,475 85<br />
First Community Bancshares, Inc. (Ñ) 400 14<br />
First Financial Bancorp (Ñ) 3,100 38<br />
First Financial Bankshares, Inc. (Ñ) 407 22<br />
First Horizon National Corp. (Ñ) 21,895 231<br />
First Industrial Realty Trust, Inc. (ö)(Ñ) 5,500 42<br />
First Marblehead Corp. (The) (Æ)(Ñ) 9,800 13<br />
First Midwest Bancorp, Inc. (Ñ) 7,800 156<br />
First Niagara Financial Group, Inc. (Ñ) 6,300 102<br />
FirstFed Financial Corp. (Æ)(Ñ) 3,200 6<br />
Flushing Financial Corp. 8,200 98<br />
Franklin Street Properties Corp. (ö)(Ñ) 17,308 255<br />
General Growth Properties, Inc. (ö)(Ñ) 21,500 28<br />
Genworth Financial, Inc. Class A 15,400 44<br />
Getty Realty Corp. (ö)(Ñ) 1,818 38<br />
Glimcher Realty Trust (ö)(Ñ) 5,800 16<br />
Green Bankshares, Inc. (Ñ) 2,019 27<br />
H&E Equipment Services, Inc. (Æ)(Ñ) 3,200 25<br />
H&R Block, Inc. 2,779 63<br />
Hallmark Financial Services (Æ) 835 7<br />
Hanmi Financial Corp. (Ñ) 3,300 7<br />
Hanover Insurance Group, Inc. (The) 2,100 90<br />
Hatteras Financial Corp. (ö) 7,700 205<br />
HCC Insurance Holdings, Inc. 1,350 36<br />
Health Care REIT, Inc. (ö)(Ñ) 3,555 150<br />
Heartland Payment Systems, Inc. (Ñ) 259 5<br />
Hercules Technology Growth Capital,<br />
Inc. (Ñ) 21,900 173<br />
Hersha Hospitality Trust (ö) 4,400 13<br />
Horace Mann Educators Corp. (Ñ) 16,300 150<br />
Hospitality Properties Trust (ö)(Ñ) 15,000 223<br />
HRPT Properties Trust (ö)(Ñ) 5,667 19<br />
Huntington Bancshares, Inc. (Ñ) 29,800 228<br />
Huron Consulting Group, Inc. (Æ)(Ñ) 2,790 160<br />
Hypercom Corp. (Æ) 91,030 98<br />
IBERIABANK Corp. (Ñ) 1,000 48<br />
Independent Bank Corp. (Ñ) 2,300 5<br />
Independent Bank Corp. 200 5<br />
Inland Real Estate Corp. (ö)(Ñ) 3,500 45<br />
Interactive Data Corp. 985 24<br />
Intersections, Inc. (Æ) 27,069 141<br />
Investors Bancorp, Inc. (Æ) 4,500 60<br />
IPC Holdings, Ltd. 8,900 266<br />
Janus Capital Group, Inc. (Ñ) 4,069 33<br />
JER Investment Trust, Inc. (Æ)(Þ) 9,200 9<br />
Knight Capital Group, Inc. Class A (Æ)(Ñ) 22,902 370<br />
LaBranche & Co., Inc. (Æ)(Ñ) 16,300 78<br />
Lexington Realty Trust (ö)(Ñ) 7,200 36<br />
Life Partners Holdings, Inc. (Ñ) 6,525 285<br />
LTC Properties, Inc. (ö) 3,429 70<br />
MainSource Financial Group, Inc. (Ñ) 5,600 87<br />
Principal<br />
Amount ($)<br />
or Shares<br />
Market<br />
Value<br />
$<br />
MarketAxess Holdings, Inc. (Æ)(Ñ) 25,209 206<br />
Marshall & Ilsley Corp. (Ñ) 7,900 108<br />
Meadowbrook Insurance Group, Inc. 5,485 35<br />
MF Global, Ltd. (Æ)(Ñ) 5,400 11<br />
Midwest Banc Holdings, Inc. (Ñ) 3,844 5<br />
MVC Capital, Inc. (Ñ) 1,000 11<br />
National Financial Partners Corp. (Ñ) 4,600 14<br />
National Health Investors, Inc. (ö)(Ñ) 106 3<br />
National Interstate Corp. (Ñ) 326 6<br />
National Penn Bancshares, Inc. (Ñ) 14,963 217<br />
National Retail Properties, Inc. (ö)(Ñ) 14,485 249<br />
Nationwide Health Properties, Inc. (ö)(Ñ) 3,178 91<br />
Navigators Group, Inc. (Æ)(Ñ) 1,745 96<br />
NBT Bancorp, Inc. (Ñ) 2,074 58<br />
New York Community Bancorp, Inc. (Ñ) 5,029 60<br />
NewAlliance Bancshares, Inc. (Ñ) 110 1<br />
NGP Capital Resources Co. 2,100 18<br />
NorthStar Realty Finance Corp. (ö)(Ñ) 3,899 15<br />
Odyssey Re Holdings Corp. 1,060 55<br />
Old National Bancorp (Ñ) 11,658 212<br />
Old Second Bancorp, Inc. (Ñ) 800 9<br />
Omega Healthcare Investors, Inc. (ö)(Ñ) 5,553 89<br />
OneBeacon Insurance Group, Ltd.<br />
Class A (Ñ) 2,300 24<br />
optionsXpress Holdings, Inc. (Ñ) 5,312 71<br />
Oriental Financial Group, Inc. (Ñ) 24,796 150<br />
Pacific Capital Bancorp NA (Ñ) 4,800 81<br />
PacWest Bancorp (Ñ) 4,300 116<br />
Parkway Properties, Inc. (ö)(Ñ) 3,400 61<br />
PartnerRe, Ltd. - ADR (Ñ) 3,500 249<br />
PennantPark Investment Corp. (Ñ) 40,320 146<br />
Pennsylvania Real Estate Investment<br />
Trust (ö)(Ñ) 3,700 28<br />
Penson Worldwide, Inc. (Æ) 2,633 20<br />
People’s United Financial, Inc. (Ñ) 2,275 41<br />
Phoenix Cos., Inc. (The) 3,200 10<br />
Piper Jaffray Cos. (Æ)(Ñ) 10,066 400<br />
Platinum Underwriters Holdings, Ltd. 7,900 285<br />
PMA Capital Corp. Class A (Æ)(Ñ) 1,700 12<br />
PMI Group, Inc. (The) (Ñ) 15,700 31<br />
Potlatch Corp. (ö)(Ñ) 10,200 265<br />
Prosperity Bancshares, Inc. (Ñ) 269 8<br />
Protective Life Corp. 18,500 265<br />
Provident Financial Services, Inc. (Ñ) 15,783 241<br />
PS Business Parks, Inc. (ö)(Ñ) 609 27<br />
Pzena Investment Management, Inc. (Ñ) 8,300 35<br />
Raymond James Financial, Inc. (Ñ) 4,841 83<br />
Rayonier, Inc. (ö)(Ñ) 1,271 40<br />
Reinsurance Group of America, Inc. 2,700 116<br />
RenaissanceRe Holdings, Ltd. 500 26<br />
S1 Corp. (Æ) 8,700 69<br />
Sandy Spring Bancorp, Inc. (Ñ) 1,700 37<br />
Santander BanCorp (Ñ) 1,900 24<br />
SCBT Financial Corp. 500 17<br />
SeaBright Insurance Holdings, Inc. (Æ) 1,700 20<br />
Senior Housing Properties Trust (ö)(Ñ) 5,000 90<br />
South Financial Group, Inc. (The) (Ñ) 8,900 38<br />
Aggressive Equity Fund 27
Russell Investment Funds<br />
Aggressive Equity Fund<br />
Schedule of Investments, continued — December 31, 2008<br />
Amounts in thousands (except share amounts)<br />
Principal<br />
Amount ($)<br />
or Shares<br />
Market<br />
Value<br />
$<br />
Southside Bancshares, Inc. (Ñ) 1,200 28<br />
Southwest Bancorp, Inc. 2,276 29<br />
StanCorp Financial Group, Inc. (Ñ) 7,388 309<br />
Sterling Bancorp (Ñ) 6,200 87<br />
Stewart Information Services Corp. (Ñ) 3,000 70<br />
Stifel Financial Corp. (Æ)(Ñ) 3,872 178<br />
Strategic Hotels & Resorts, Inc. (ö)(Ñ) 10,900 18<br />
Sun Bancorp, Inc. (Æ)(Ñ) 1,575 12<br />
Sunstone Hotel Investors, Inc. (ö)(Ñ) 10,500 65<br />
SVB Financial Group (Æ)(Ñ) 6,047 159<br />
SY Bancorp, Inc. (Ñ) 900 25<br />
Synovus Financial Corp. (Ñ) 20,100 167<br />
Tanger Factory Outlet Centers (ö)(Ñ) 752 28<br />
Texas Capital Bancshares, Inc. (Æ)(Ñ) 11,910 159<br />
Tompkins Financial Corp. (Ñ) 600 35<br />
Tower Group, Inc. (Ñ) 5,400 152<br />
Transatlantic Holdings, Inc. (Ñ) 1,866 75<br />
Trico Bancshares (Ñ) 3,300 82<br />
United America Indemnity, Ltd.<br />
Class A (Æ) 2,000 26<br />
United Financial Bancorp, Inc. (Ñ) 7,000 106<br />
United Rentals, Inc. (Æ)(Ñ) 8,977 82<br />
United Western Bancorp, Inc. 5,400 51<br />
Universal American Corp. (Æ)(Ñ) 8,007 71<br />
Unum Group 14,343 267<br />
Validus Holdings, Ltd. 12,745 333<br />
Ventas, Inc. (ö)(Ñ) 3,416 115<br />
ViewPoint Financial Group 8,400 135<br />
Waddell & Reed Financial, Inc. Class A 18,658 288<br />
Washington Federal, Inc. (Ñ) 6,384 96<br />
Washington Real Estate Investment<br />
Trust (ö)(Ñ) 3,600 102<br />
Webster Financial Corp. (Ñ) 16,300 225<br />
WesBanco, Inc. (Ñ) 2,200 60<br />
Westamerica Bancorporation (Ñ) 1,000 51<br />
Westfield Financial, Inc. (Ñ) 108 1<br />
Wilmington Trust Corp. (Ñ) 11,117 247<br />
Wilshire Bancorp, Inc. (Ñ) 13,000 118<br />
Wintrust Financial Corp. (Ñ) 1,000 21<br />
World Acceptance Corp. (Æ)(Ñ) 568 11<br />
WR Berkley Corp. 2,477 77<br />
Zenith National Insurance Corp. (Ñ) 5,450 172<br />
22,104<br />
Health Care - 16.1%<br />
Affymetrix, Inc. (Æ)(Ñ) 98,931 296<br />
Albany Molecular Research, Inc. (Æ) 8,200 80<br />
Alliance Imaging, Inc. (Æ)(Ñ) 10,500 84<br />
Amedisys, Inc. (Æ)(Ñ) 4,373 181<br />
American Medical Systems Holdings,<br />
Inc. (Æ)(Ñ) 6,714 60<br />
AMERIGROUP Corp. Class A (Æ) 7,500 221<br />
AmerisourceBergen Corp. Class A (Ñ) 887 32<br />
Analogic Corp. (Ñ) 5,599 153<br />
Angiodynamics, Inc. (Æ)(Ñ) 1,580 22<br />
Assisted Living Concepts, Inc. (Æ)(Ñ) 4,897 20<br />
athenahealth, Inc. (Æ)(Ñ) 5,450 205<br />
Principal<br />
Amount ($)<br />
or Shares<br />
Market<br />
Value<br />
$<br />
Bio-Rad Laboratories, Inc. Class A (Æ) 2,540 191<br />
BioScrip, Inc. (Æ) 98,509 219<br />
Candela Corp. (Æ) 163,824 87<br />
Capital Senior Living Corp. (Æ)(Ñ) 4,655 14<br />
Cardiac Science Corp. (Æ) 5,218 39<br />
Catalyst Health Solutions, Inc. (Æ) 7,876 192<br />
Centene Corp. (Æ) 14,845 293<br />
Cephalon, Inc. (Æ)(Ñ) 7,860 606<br />
Charles River Laboratories International,<br />
Inc. (Æ)(Ñ) 4,060 106<br />
Computer Programs & Systems, Inc. (Ñ) 2,846 76<br />
Corvel Corp. (Æ)(Ñ) 1,027 23<br />
Coventry Health Care, Inc. (Æ) 1,900 28<br />
Cubist Pharmaceuticals, Inc. (Æ)(Ñ) 10,555 255<br />
CV Therapeutics, Inc. (Æ)(Ñ) 1,722 16<br />
Datascope Corp. 350 18<br />
DaVita, Inc. (Æ) 7,858 390<br />
Depomed, Inc. (Æ)(Ñ) 2,767 5<br />
Edwards Lifesciences Corp. (Æ)(Ñ) 3,239 178<br />
Emergency Medical Services Corp.<br />
Class A (Æ) 2,300 84<br />
Endo Pharmaceuticals Holdings,<br />
Inc. (Æ)(Ñ) 11,150 289<br />
eResearchTechnology, Inc. (Æ)(Ñ) 30,482 202<br />
Gen-Probe, Inc. (Æ) 5,827 250<br />
Genomic Health, Inc. (Æ)(Ñ) 2,200 43<br />
Genoptix, Inc. (Æ) 2,740 93<br />
Gentiva Health Services, Inc. (Æ)(Ñ) 7,537 221<br />
Haemonetics Corp. (Æ)(Ñ) 4,360 246<br />
Hanger Orthopedic Group, Inc. (Æ)(Ñ) 1,400 20<br />
Harvard Bioscience, Inc. (Æ)(Ñ) 49,156 130<br />
Health Net, Inc. (Æ)(Ñ) 1,700 19<br />
Healthsouth Corp. (Æ)(Ñ) 2,623 29<br />
Healthspring, Inc. (Æ)(Ñ) 18,688 373<br />
Henry Schein, Inc. (Æ)(Ñ) 365 13<br />
Hill-Rom Holdings, Inc. (Ñ) 6,214 102<br />
HMS Holdings Corp. (Æ)(Ñ) 23,184 731<br />
Hologic, Inc. (Æ)(Ñ) 20,193 264<br />
Icon PLC - ADR (Æ) 7,577 149<br />
Idexx Laboratories, Inc. (Æ)(Ñ) 3,517 127<br />
Illumina, Inc. (Æ)(Ñ) 22,814 594<br />
Immucor, Inc. (Æ) 22,951 610<br />
Immunomedics, Inc. (Æ) 647 1<br />
Intuitive Surgical, Inc. (Æ)(Ñ) 655 83<br />
Isis Pharmaceuticals, Inc. (Æ)(Ñ) 6,535 93<br />
Kendle International, Inc. (Æ)(Ñ) 2,964 76<br />
Kensey Nash Corp. (Æ)(Ñ) 3,731 72<br />
Kindred Healthcare, Inc. (Æ) 8,033 105<br />
Kinetic Concepts, Inc. (Æ)(Ñ) 1,017 20<br />
King Pharmaceuticals, Inc. (Æ)(Ñ) 67,264 714<br />
Laboratory Corp. of America Holdings (Æ) 3,312 213<br />
LHC Group, Inc. (Æ)(Ñ) 8,215 296<br />
Life Technologies Corp. (Æ)(Ñ) 8,227 192<br />
LifePoint Hospitals, Inc. (Æ)(Ñ) 1,871 43<br />
Lincare Holdings, Inc. (Æ)(Ñ) 12,915 348<br />
Luminex Corp. (Æ)(Ñ) 11,600 248<br />
Magellan Health Services, Inc. (Æ) 7,466 292<br />
28 Aggressive Equity Fund
Russell Investment Funds<br />
Aggressive Equity Fund<br />
Schedule of Investments, continued — December 31, 2008<br />
Amounts in thousands (except share amounts)<br />
Principal<br />
Amount ($)<br />
or Shares<br />
Market<br />
Value<br />
$<br />
Martek Biosciences Corp. (Æ)(Ñ) 1,400 42<br />
Masimo Corp. (Æ)(Ñ) 17,090 510<br />
Medical Action Industries, Inc. (Æ) 566 6<br />
Medicis Pharmaceutical Corp. Class A (Ñ) 4,994 69<br />
Mednax, Inc. (Æ) 5,337 169<br />
Mentor Corp. (Ñ) 9,200 285<br />
Merit Medical Systems, Inc. (Æ) 19,077 342<br />
Molina Healthcare, Inc. (Æ)(Ñ) 6,325 111<br />
Myriad Genetics, Inc. (Æ) 4,200 278<br />
Nabi Biopharmaceuticals (Æ)(Ñ) 15,600 52<br />
Natus Medical, Inc. (Æ)(Ñ) 17,020 220<br />
NPS Pharmaceuticals, Inc. (Æ)(Ñ) 12,211 76<br />
NuVasive, Inc. (Æ)(Ñ) 6,604 229<br />
Odyssey HealthCare, Inc. (Æ) 3,000 28<br />
Omnicare, Inc. (Ñ) 11,928 331<br />
OSI Pharmaceuticals, Inc. (Æ)(Ñ) 2,623 102<br />
Par Pharmaceutical Cos., Inc. (Æ)(Ñ) 6,400 86<br />
Parexel International Corp. (Æ) 4,674 45<br />
Patterson Cos., Inc. (Æ) 5,209 98<br />
PDL BioPharma, Inc. (Ñ) 7,861 49<br />
Perrigo Co. (Ñ) 15,852 512<br />
Pharmaceutical Product Development,<br />
Inc. (Ñ) 3,538 103<br />
PharMerica Corp. (Æ)(Ñ) 5,500 86<br />
Phase Forward, Inc. (Æ)(Ñ) 9,800 123<br />
Psychiatric Solutions, Inc. (Æ)(Ñ) 23,285 649<br />
Quality Systems, Inc. (Ñ) 7,200 314<br />
RehabCare Group, Inc. (Æ) 4,300 65<br />
Res-Care, Inc. (Æ)(Ñ) 3,483 52<br />
Resmed, Inc. (Æ) 6,569 246<br />
Retractable Technologies, Inc. (Æ)(Å) 72,750 62<br />
Sirona Dental Systems, Inc. (Æ)(Ñ) 3,801 40<br />
Somanetics Corp. (Æ) 300 5<br />
SonoSite, Inc. (Æ)(Ñ) 1,591 30<br />
Stericycle, Inc. (Æ)(Ñ) 15,607 813<br />
STERIS Corp. 9,627 230<br />
SurModics, Inc. (Æ)(Ñ) 92 2<br />
Techne Corp. 8,046 519<br />
Thoratec Corp. (Æ)(Ñ) 6,875 223<br />
Triple-S Management Corp. (Æ)(Ñ) 900 10<br />
United Therapeutics Corp. (Æ)(Ñ) 1,418 89<br />
Universal Health Services, Inc. Class B 1,900 71<br />
VCA Antech, Inc. (Æ)(Ñ) 9,099 181<br />
Viropharma, Inc. (Æ)(Ñ) 20,436 266<br />
Watson Pharmaceuticals, Inc.<br />
Class B (Æ)(Ñ) 21,311 566<br />
19,860<br />
Integrated Oils - 0.1%<br />
Vaalco Energy, Inc. (Æ) 23,900 178<br />
Materials and Processing - 7.7%<br />
Aceto Corp. 11,311 113<br />
Acuity Brands, Inc. (Ñ) 1,759 61<br />
Aecom Technology Corp. (Æ) 4,100 126<br />
Airgas, Inc. 7,907 308<br />
Andersons, Inc. (The) (Ñ) 2,700 45<br />
Principal<br />
Amount ($)<br />
or Shares<br />
Market<br />
Value<br />
$<br />
Armstrong World Industries, Inc. (Ñ) 2,167 47<br />
Ashland, Inc. 8,107 85<br />
Beacon Roofing Supply, Inc. (Æ)(Ñ) 795 11<br />
Brady Corp. Class A (Ñ) 1,746 42<br />
Buckeye Technologies, Inc. (Æ)(Ñ) 8,200 30<br />
Cabot Corp. (Ñ) 13,600 208<br />
Carpenter Technology Corp. (Ñ) 2,862 59<br />
Celanese Corp. Class A (Ñ) 3,237 40<br />
Century Aluminum Co. (Æ)(Ñ) 9,401 94<br />
Ceradyne, Inc. (Æ)(Ñ) 5,470 111<br />
CF Industries Holdings, Inc. 269 13<br />
Chemtura Corp. (Ñ) 7,027 10<br />
Clean Harbors, Inc. (Æ)(Ñ) 800 51<br />
Clearwater Paper Corp. (Æ)(Ñ) 585 5<br />
Comfort Systems USA, Inc. (Ñ) 9,800 105<br />
Commercial Metals Co. (Ñ) 14,200 169<br />
Compass Minerals International, Inc. 2,800 164<br />
Cytec Industries, Inc. 10,700 227<br />
Domtar Corp. (Æ)(Ñ) 52,691 88<br />
Dycom Industries, Inc. (Æ) 11,394 94<br />
Eagle Materials, Inc. (Ñ) 11,700 215<br />
Ecolab, Inc. 6,806 239<br />
EMCOR Group, Inc. (Æ) 15,152 340<br />
Encore Wire Corp. (Ñ) 4,600 87<br />
Energizer Holdings, Inc. (Æ)(Ñ) 3,951 214<br />
Energy Conversion Devices, Inc. (Æ)(Ñ) 2,700 68<br />
EnerSys (Æ) 2,480 27<br />
Exide Technologies (Æ)(Ñ) 24,200 128<br />
Facet Biotech Corp. (Æ)(Ñ) 1,572 15<br />
FMC Corp. (Ñ) 8,635 386<br />
Glatfelter (Ñ) 21,100 196<br />
Haynes International, Inc. (Æ)(Ñ) 4,040 100<br />
HB Fuller Co. (Ñ) 8,800 142<br />
Hecla Mining Co. (Æ)(Ñ) 18,600 52<br />
IAMGOLD Corp. 51,257 313<br />
Innophos Holdings, Inc. (Ñ) 6,716 133<br />
Innospec, Inc. (Ñ) 4,791 28<br />
Insituform Technologies, Inc.<br />
Class A (Æ)(Ñ) 19,951 393<br />
Insteel Industries, Inc. 2,465 28<br />
Jacobs Engineering Group, Inc. (Æ)(Ñ) 5,690 274<br />
KapStone Paper and Packaging Corp. (Æ) 1,000 2<br />
Koppers Holdings, Inc. 2,360 51<br />
Layne Christensen Co. (Æ) 6,456 155<br />
Lennox International, Inc. (Ñ) 3,457 112<br />
Lydall, Inc. (Æ)(Ñ) 4,521 26<br />
McDermott International, Inc. (Æ) 6,006 59<br />
MeadWestvaco Corp. 4,060 45<br />
Mercer International, Inc. (Æ)(Ñ) 1,500 3<br />
Myers Industries, Inc. (Ñ) 16,300 130<br />
Neenah Paper, Inc. (Ñ) 10,800 96<br />
Olympic Steel, Inc. (Ñ) 3,300 67<br />
OM Group, Inc. (Æ)(Ñ) 14,705 310<br />
Owens-Illinois, Inc. (Æ) 3,050 83<br />
PAN American Silver Corp. (Æ)(Ñ) 12,746 218<br />
Perini Corp. (Æ)(Ñ) 4,900 115<br />
PolyOne Corp. (Æ) 3,100 10<br />
Aggressive Equity Fund 29
Russell Investment Funds<br />
Aggressive Equity Fund<br />
Schedule of Investments, continued — December 31, 2008<br />
Amounts in thousands (except share amounts)<br />
Principal<br />
Amount ($)<br />
or Shares<br />
Market<br />
Value<br />
$<br />
Quaker Chemical Corp. 1,000 16<br />
Quanta Services, Inc. (Æ)(Ñ) 8,188 162<br />
Reliance Steel & Aluminum Co. 11,519 230<br />
Richmont Mines, Inc. (Æ)(Ñ) 3,994 7<br />
Rockwood Holdings, Inc. (Æ)(Ñ) 3,541 38<br />
Schulman A, Inc. 4,222 72<br />
Shaw Group, Inc. (The) (Æ)(Ñ) 2,875 59<br />
Silgan Holdings, Inc. 4,100 196<br />
Sims Metal Management, Ltd. - ADR (Ñ) 9,034 112<br />
Smurfit-Stone Container Corp. (Æ) 36,900 9<br />
Sonoco Products Co. 2,525 59<br />
Spartech Corp. 2,400 15<br />
Standard Register Co. (The) (Ñ) 2,100 19<br />
Symyx Technologies (Æ)(Ñ) 44,248 263<br />
Terra Industries, Inc. 4,973 83<br />
Texas Industries, Inc. (Ñ) 800 28<br />
Titanium Metals Corp. (Ñ) 13,513 119<br />
Tredegar Corp. 1,393 25<br />
Universal Forest Products, Inc. (Ñ) 3,100 83<br />
URS Corp. (Æ) 15,275 623<br />
US Concrete, Inc. (Æ)(Ñ) 4,200 14<br />
Valspar Corp. (Ñ) 917 17<br />
Xerium Technologies, Inc. (Æ) 2,112 1<br />
9,416<br />
Miscellaneous - 1.3%<br />
Carlisle Cos., Inc. (Ñ) 5,800 120<br />
Castlepoint Holdings, Ltd. (Þ) 30,900 419<br />
GenTek, Inc. (Æ)(Ñ) 133 2<br />
Kaman Corp. Class A (Ñ) 10,600 192<br />
Lancaster Colony Corp. 5,114 176<br />
Teleflex, Inc. 9,726 487<br />
Trinity Industries, Inc. (Ñ) 10,100 159<br />
Walter Industries, Inc. Class A (Ñ) 167 3<br />
1,558<br />
Other Energy - 3.8%<br />
Allis-Chalmers Energy, Inc. (Æ)(Ñ) 3,070 17<br />
Alpha Natural Resources, Inc. (Æ) 6,700 108<br />
Arena Resources, Inc. (Æ)(Ñ) 3,830 108<br />
Atwood Oceanics, Inc. (Æ)(Ñ) 2,105 32<br />
Brigham Exploration Co. (Æ)(Ñ) 26,724 86<br />
Bronco Drilling Co., Inc. (Æ)(Ñ) 3,178 21<br />
Callon Petroleum Co. (Æ)(Ñ) 224 1<br />
Cameron International Corp. (Æ) 7,650 157<br />
CARBO Ceramics, Inc. (Ñ) 9,540 339<br />
Cimarex Energy Co. (Ñ) 13,519 362<br />
Clayton Williams Energy, Inc. (Æ) 579 26<br />
Complete Production Services, Inc. (Æ)(Ñ) 7,427 61<br />
Comstock Resources, Inc. (Æ) 1,088 51<br />
Concho Resources, Inc. (Æ)(Ñ) 8,635 197<br />
Contango Oil & Gas Co. (Æ)(Ñ) 400 23<br />
Continental Resources, Inc. (Æ)(Ñ) 10,419 216<br />
Core Laboratories NV 2,072 124<br />
Dawson Geophysical Co. (Æ)(Ñ) 6,568 117<br />
Dynegy, Inc. Class A (Æ)(Ñ) 4,300 9<br />
Encore Acquisition Co. (Æ) 2,092 53<br />
Principal<br />
Amount ($)<br />
or Shares<br />
Market<br />
Value<br />
$<br />
Energy Partners, Ltd. (Æ)(Ñ) 7,267 10<br />
Energy XXI Bermuda, Ltd. 14,500 11<br />
EXCO Resources, Inc. (Æ)(Ñ) 18,777 170<br />
Exterran Holdings, Inc. (Æ)(Ñ) 4,588 98<br />
FMC Technologies, Inc. (Æ)(Ñ) 2,174 52<br />
Foundation Coal Holdings, Inc. 2,141 30<br />
Frontier Oil Corp. (Ñ) 24,000 303<br />
Geokinetics, Inc. (Æ) 23,010 57<br />
Gran Tierra Energy, Inc. (Æ)(Ñ) 9,001 25<br />
Helmerich & Payne, Inc. (Ñ) 7,450 169<br />
Hornbeck Offshore Services, Inc. (Æ)(Ñ) 8,641 141<br />
Key Energy Services, Inc. (Æ) 3,458 15<br />
Mariner Energy, Inc. (Æ)(Ñ) 8,649 88<br />
Massey Energy Co. (Ñ) 1,185 16<br />
Matrix Service Co. (Æ)(Ñ) 2,006 15<br />
McMoRan Exploration Co. (Æ)(Ñ) 2,151 21<br />
Meridian Resource Corp. (Æ) 4,900 3<br />
Newpark Resources (Æ) 32,300 119<br />
NV Energy, Inc. 6,137 61<br />
Oceaneering International, Inc. (Æ) 4,026 117<br />
Oil States International, Inc. (Æ) 1,800 34<br />
Parker Drilling Co. (Æ) 13,800 40<br />
Patterson-UTI Energy, Inc. (Ñ) 17,744 204<br />
Penn Virginia Corp. 3,328 86<br />
Penn Virginia GP Holdings, LP (Ñ) 272 3<br />
Precision Drilling Trust (Ñ) 2,960 25<br />
Reliant Energy, Inc. (Æ) 4,000 23<br />
Rowan Cos., Inc. (Ñ) 5,693 91<br />
Stone Energy Corp. (Æ)(Ñ) 5,167 57<br />
Superior Energy Services, Inc. (Æ) 6,924 110<br />
Swift Energy Co. (Æ)(Ñ) 3,900 66<br />
Targa Resources Partners, LP (Ñ) 13,242 103<br />
TXCO Resources, Inc. (Æ)(Ñ) 3,500 5<br />
Union Drilling, Inc. (Æ)(Ñ) 1,300 7<br />
Unit Corp. (Æ)(Ñ) 5,675 152<br />
W&T Offshore, Inc. (Ñ) 3,032 43<br />
Western Refining, Inc. (Ñ) 6,500 50<br />
4,728<br />
Producer Durables - 5.7%<br />
Actuant Corp. Class A (Ñ) 3,879 74<br />
Aerovironment, Inc. (Æ)(Ñ) 8,100 298<br />
AGCO Corp. (Æ)(Ñ) 14,365 339<br />
Alliant Techsystems, Inc. (Æ)(Ñ) 198 17<br />
AM Castle & Co. (Ñ) 1,308 14<br />
Ametek, Inc. 2,800 85<br />
AO Smith Corp. (Ñ) 4,400 130<br />
Argon ST, Inc. (Æ)(Ñ) 2,600 49<br />
ATMI, Inc. (Æ)(Ñ) 164 2<br />
Baldor Electric Co. (Ñ) 13,000 232<br />
Bucyrus International, Inc. Class A (Ñ) 2,671 49<br />
Cascade Corp. (Ñ) 2,100 63<br />
Centex Corp. (Ñ) 17,700 188<br />
Chart Industries, Inc. (Æ) 3,295 35<br />
Cognex Corp. (Ñ) 2,154 32<br />
Cohu, Inc. (Ñ) 10,650 129<br />
Columbus McKinnon Corp. (Æ) 800 11<br />
30 Aggressive Equity Fund
Russell Investment Funds<br />
Aggressive Equity Fund<br />
Schedule of Investments, continued — December 31, 2008<br />
Amounts in thousands (except share amounts)<br />
Principal<br />
Amount ($)<br />
or Shares<br />
Market<br />
Value<br />
$<br />
Covanta Holding Corp. (Æ)(Ñ) 770 17<br />
Crane Co. 5,332 92<br />
CTS Corp. (Ñ) 6,282 35<br />
Cummins, Inc. 1,227 33<br />
Donaldson Co., Inc. (Ñ) 4,100 138<br />
Dover Corp. (Ñ) 2,237 74<br />
DR Horton, Inc. (Ñ) 39,200 277<br />
Ducommun, Inc. 1,900 32<br />
Electro Scientific Industries, Inc. (Æ)(Ñ) 39,870 271<br />
EnPro Industries, Inc. (Æ) 500 11<br />
Esterline Technologies Corp. (Æ) 2,503 95<br />
Federal Signal Corp. (Ñ) 10,400 85<br />
Flowserve Corp. 3,286 169<br />
Gardner Denver, Inc. (Æ)(Ñ) 5,661 132<br />
GrafTech International, Ltd. (Æ) 14,767 123<br />
Hardinge, Inc. (Ñ) 1,400 6<br />
Herman Miller, Inc. (Ñ) 9,721 127<br />
Hovnanian Enterprises, Inc. Class A (Æ)(Ñ) 11,900 20<br />
Hubbell, Inc. Class B (Ñ) 2,846 93<br />
Itron, Inc. (Æ)(Ñ) 4,854 309<br />
Joy Global, Inc. (Ñ) 8,452 193<br />
Kimball International, Inc. Class B (Ñ) 36,861 317<br />
Ladish Co., Inc. (Æ) 5,000 69<br />
Lam Research Corp. (Æ)(Ñ) 4,221 90<br />
Lexmark International, Inc. Class A (Æ)(Ñ) 11,636 313<br />
Lincoln Electric Holdings, Inc. (Ñ) 1,743 89<br />
LTX-Credence Corp. (Æ) 7,232 2<br />
MasTec, Inc. (Æ)(Ñ) 12,100 140<br />
MDC Holdings, Inc. 1,971 60<br />
Meritage Homes Corp. (Æ) 4,200 51<br />
Mettler Toledo International, Inc. (Æ)(Ñ) 1,684 113<br />
NVR, Inc. (Æ)(Ñ) 529 241<br />
Orbital Sciences Corp. (Æ) 1,722 34<br />
Park-Ohio Holdings Corp. (Æ) 1,100 7<br />
Perceptron, Inc. (Æ) 40,269 136<br />
Plantronics, Inc. (Ñ) 9,623 127<br />
Powerwave Technologies, Inc. (Æ)(Ñ) 17,000 8<br />
Pulte Homes, Inc. (Ñ) 15,247 167<br />
Regal-Beloit Corp. (Ñ) 255 10<br />
Ritchie Bros Auctioneers, Inc. (Ñ) 15,305 328<br />
Robbins & Myers, Inc. (Ñ) 4,085 66<br />
SBA Communications Corp. Class A (Æ)(Ñ) 12,126 198<br />
Standex International Corp. 57 1<br />
Steelcase, Inc. Class A (Ñ) 317 2<br />
Symmetricom, Inc. (Æ)(Ñ) 783 3<br />
Technitrol, Inc. 3,100 11<br />
Tecumseh Products Co. Class A (Æ)(Ñ) 4,519 43<br />
Terex Corp. (Æ) 1,700 29<br />
Thermadyne Holdings Corp. (Æ)(Ñ) 3,575 25<br />
Thomas & Betts Corp. (Æ) 1,725 41<br />
Ultratech, Inc. (Æ) 2,739 33<br />
Waters Corp. (Æ) 4,819 177<br />
7,010<br />
Technology - 11.8%<br />
3Com Corp. (Æ)(Ñ) 52,949 121<br />
Acxiom Corp. 24,106 195<br />
Principal<br />
Amount ($)<br />
or Shares<br />
Market<br />
Value<br />
$<br />
Adaptec, Inc. (Æ)(Ñ) 91,165 301<br />
ADC Telecommunications, Inc. (Æ)(Ñ) 19,000 104<br />
Adtran, Inc. (Ñ) 5,900 88<br />
Affiliated Computer Services, Inc.<br />
Class A (Æ) 6,800 312<br />
American Reprographics Co. (Æ) 6,488 45<br />
American Science & Engineering, Inc. (Ñ) 2,650 196<br />
Amkor Technology, Inc. (Æ)(Ñ) 30,300 66<br />
Amphenol Corp. Class A 12,295 295<br />
Ansys, Inc. (Æ)(Ñ) 7,976 222<br />
Applied Micro Circuits Corp. (Æ)(Ñ) 16,900 66<br />
Arrow Electronics, Inc. (Æ) 10,750 203<br />
Autodesk, Inc. (Æ)(Ñ) 1,804 35<br />
Avnet, Inc. (Æ) 5,750 105<br />
Avocent Corp. (Æ)(Ñ) 3,052 55<br />
AVX Corp. (Ñ) 30,600 243<br />
Benchmark Electronics, Inc. (Æ) 16,600 212<br />
BMC Software, Inc. (Æ)(Ñ) 3,508 94<br />
Bookham, Inc. (Æ)(Ñ) 5,800 3<br />
Broadcom Corp. Class A (Æ)(Ñ) 8,303 141<br />
Cadence Design Systems, Inc. (Æ)(Ñ) 6,911 25<br />
Cavium Networks, Inc. (Æ)(Ñ) 3,800 40<br />
Celestica, Inc. (Æ)(Ñ) 18,350 85<br />
Ciber, Inc. (Æ)(Ñ) 23,200 112<br />
Computer Sciences Corp. (Æ) 2,159 76<br />
Compuware Corp. (Æ)(Ñ) 24,708 167<br />
COMSYS IT Partners, Inc. (Æ)(Ñ) 1,500 3<br />
Comtech Telecommunications Corp. (Æ)(Ñ) 4,200 192<br />
Concur Technologies, Inc. (Æ)(Ñ) 7,800 256<br />
Constant Contact, Inc. (Æ)(Ñ) 8,950 119<br />
CSG Systems International, Inc. (Æ)(Ñ) 10,097 176<br />
Cubic Corp. (Ñ) 4,300 117<br />
Digital River, Inc. (Æ) 3,440 85<br />
Emulex Corp. (Æ) 3,000 21<br />
Equinix, Inc. (Æ)(Ñ) 6,280 334<br />
Extreme Networks (Æ)(Ñ) 1,508 3<br />
F5 Networks, Inc. (Æ)(Ñ) 3,776 86<br />
Flextronics International, Ltd. (Æ)(Ñ) 72,775 186<br />
Flir Systems, Inc. (Æ)(Ñ) 9,330 286<br />
Hittite Microwave Corp. (Æ)(Ñ) 5,891 174<br />
Hutchinson Technology, Inc. (Æ)(Ñ) 3,600 12<br />
II-VI, Inc. (Æ)(Ñ) 78 1<br />
Imation Corp. (Ñ) 2,366 32<br />
Informatica Corp. (Æ)(Ñ) 13,950 192<br />
Ingram Micro, Inc. Class A (Æ) 25,371 340<br />
Integrated Device Technology, Inc. (Æ)(Ñ) 34,200 192<br />
InterDigital, Inc. (Æ)(Ñ) 2,089 57<br />
International Rectifier Corp. (Æ) 19,233 260<br />
Intersil Corp. Class A 16,000 147<br />
Interwoven, Inc. (Æ) 10,900 137<br />
Intuit, Inc. (Æ)(Ñ) 7,375 175<br />
Jabil Circuit, Inc. 43,300 292<br />
JDA Software Group, Inc. (Æ) 3,700 49<br />
JDS Uniphase Corp. (Æ)(Ñ) 31,979 117<br />
LSI Corp. (Æ)(Ñ) 5,066 17<br />
Mantech International Corp. Class A (Æ) 3,400 184<br />
Mentor Graphics Corp. (Æ)(Ñ) 8,702 45<br />
Aggressive Equity Fund 31
Russell Investment Funds<br />
Aggressive Equity Fund<br />
Schedule of Investments, continued — December 31, 2008<br />
Amounts in thousands (except share amounts)<br />
Principal<br />
Amount ($)<br />
or Shares<br />
Market<br />
Value<br />
$<br />
Methode Electronics, Inc. 2,900 20<br />
Micrel, Inc. (Ñ) 38,090 278<br />
Micros Systems, Inc. (Æ)(Ñ) 12,614 206<br />
Microsemi Corp. (Æ) 1,078 14<br />
MicroStrategy, Inc. Class A (Æ)(Ñ) 1,621 60<br />
Monolithic Power Systems, Inc. (Æ)(Ñ) 8,490 107<br />
NAM TAI Electronics, Inc. 30,100 166<br />
National Semiconductor Corp. (Ñ) 5,757 58<br />
NCR Corp. (Æ) 10,787 152<br />
Ness Technologies, Inc. (Æ) 2,700 12<br />
NetApp, Inc. (Æ) 5,375 75<br />
Netezza Corp. (Æ) 4,050 27<br />
Netlogic Microsystems, Inc. (Æ)(Ñ) 8,117 179<br />
Nice Systems, Ltd. - ADR (Æ) 21,404 481<br />
Novatel Wireless, Inc. (Æ) 3,400 16<br />
Novell, Inc. (Æ) 1,100 4<br />
OSI Systems, Inc. (Æ) 13,248 183<br />
PerkinElmer, Inc. 5,997 83<br />
Perot Systems Corp. Class A (Æ) 1,080 15<br />
QLogic Corp. (Æ)(Ñ) 9,100 122<br />
Quantum Corp. (Æ)(Ñ) 17,500 6<br />
Rackspace Hosting, Inc. (Æ) 10,956 59<br />
SAIC, Inc. (Æ) 15,778 307<br />
Sanmina-SCI Corp. (Æ)(Ñ) 119,573 56<br />
Sapient Corp. (Æ)(Ñ) 1,968 9<br />
Silicon Image, Inc. (Æ)(Ñ) 9,653 41<br />
Solera Holdings, Inc. (Æ) 13,402 323<br />
Standard Microsystems Corp. (Æ) 167 3<br />
Stanley, Inc. (Æ)(Ñ) 6,600 239<br />
Sunpower Corp. Class A (Æ)(Ñ) 800 30<br />
Sybase, Inc. (Æ)(Ñ) 17,078 423<br />
Synaptics, Inc. (Æ)(Ñ) 1,756 29<br />
Syniverse Holdings, Inc. (Æ) 36,615 437<br />
SYNNEX Corp. (Æ)(Ñ) 5,600 63<br />
Synopsys, Inc. (Æ) 5,870 109<br />
TeleCommunication Systems, Inc. (Æ) 13,700 118<br />
Tellabs, Inc. (Æ) 57,700 238<br />
Teradata Corp. (Æ) 2,282 34<br />
TIBCO Software, Inc. (Æ)(Ñ) 14,555 76<br />
Tier Technologies, Inc. Class B (Æ) 54,387 294<br />
Trimble Navigation, Ltd. (Æ)(Ñ) 6,061 131<br />
TTM Technologies, Inc. (Æ)(Ñ) 3,400 18<br />
Tyler Technologies, Inc. (Æ)(Ñ) 7,600 91<br />
Utstarcom, Inc. (Æ)(Ñ) 10,141 19<br />
Varian Semiconductor Equipment<br />
Associates, Inc. (Æ)(Ñ) 7,745 140<br />
Verint Systems, Inc. (Æ)(Ñ) 6,327 44<br />
Vignette Corp. (Æ)(Ñ) 3,820 36<br />
Vishay Intertechnology, Inc. (Æ) 74,595 255<br />
Vocus, Inc. (Æ)(Ñ) 10,952 199<br />
Western Digital Corp. (Æ) 15,258 175<br />
White Electronic Designs Corp. (Æ) 96,057 352<br />
14,506<br />
Principal<br />
Amount ($)<br />
or Shares<br />
Market<br />
Value<br />
$<br />
Utilities - 5.1%<br />
AGL Resources, Inc. (Ñ) 9,529 299<br />
Allete, Inc. 3,300 106<br />
Alliant Energy Corp. 9,733 284<br />
Atlantic Tele-Network, Inc. 1,600 42<br />
Atmos Energy Corp. 18,517 439<br />
Avista Corp. 11,984 232<br />
California Water Service Group 3,400 158<br />
CenturyTel, Inc. (Ñ) 12,256 335<br />
Cleco Corp. (Ñ) 11,096 253<br />
CMS Energy Corp. (Ñ) 13,600 137<br />
Constellation Energy Group, Inc. (Ñ) 1,783 45<br />
El Paso Electric Co. (Æ) 2,000 36<br />
Embarq Corp. 1,415 51<br />
Energen Corp. 2,926 86<br />
Frontier Communications Corp. 2,179 19<br />
Hawaiian Electric Industries, Inc. (Ñ) 2,400 53<br />
Idacorp, Inc. (Ñ) 12,685 374<br />
Integrys Energy Group, Inc. (Ñ) 600 26<br />
Iowa Telecommunications Services, Inc. (Ñ) 5,815 83<br />
Laclede Group, Inc. (The) 2,800 131<br />
Leap Wireless International, Inc. (Æ)(Ñ) 4,316 116<br />
MDU Resources Group, Inc. 5,037 109<br />
MGE Energy, Inc. (Ñ) 300 10<br />
New Jersey Resources Corp. (Ñ) 9,550 376<br />
Nicor, Inc. (Ñ) 4,400 153<br />
NII Holdings, Inc. (Æ)(Ñ) 7,400 134<br />
Northwest Natural Gas Co. (Ñ) 2,300 102<br />
NTELOS Holdings Corp. 50 1<br />
OGE Energy Corp. (Ñ) 4,506 116<br />
Oneok, Inc. 1,300 38<br />
Otter Tail Corp. (Ñ) 6,600 154<br />
Pepco Holdings, Inc. 2,500 44<br />
Portland General Electric Co. 4,900 95<br />
Premiere Global Services, Inc. (Æ) 20,015 172<br />
SCANA Corp. (Ñ) 2,519 90<br />
Southwest Gas Corp. (Ñ) 13,840 349<br />
Southwest Water Co. (Ñ) 2,500 8<br />
TECO Energy, Inc. (Ñ) 7,600 94<br />
Telephone & Data Systems, Inc. 1,100 35<br />
UGI Corp. 27,478 671<br />
US Cellular Corp. (Æ) 1,100 48<br />
USA Mobility, Inc. (Æ) 3,600 42<br />
Westar Energy, Inc. 2,318 47<br />
Windstream Corp. (Ñ) 7,562 70<br />
6,263<br />
Total Common Stocks<br />
(cost $145,506) 112,326<br />
Short-Term Investments - 9.5%<br />
Russell Investment Company Russell<br />
Money Market Fund 11,729,000 11,729<br />
Total Short-Term Investments<br />
(cost $11,729) 11,729<br />
32 Aggressive Equity Fund
Russell Investment Funds<br />
Aggressive Equity Fund<br />
Schedule of Investments, continued — December 31, 2008<br />
Amounts in thousands (except share amounts)<br />
Principal<br />
Amount ($)<br />
or Shares<br />
Market<br />
Value<br />
$<br />
Other Securities - 39.2%<br />
State Street Securities Lending Quality<br />
Trust () 51,074,560 48,271<br />
Total Other Investments<br />
(cost $51,075) 48,271<br />
Total Investments - 140.0%<br />
(identified cost $208,310) 172,326<br />
Other Assets and Liabilities,<br />
Net - (40.0%) (49,238)<br />
Net Assets - 100.0% 123,088<br />
A portion of the portfolio has been fair valued as of period end.<br />
See accompanying notes which are an integral part of the financial statements.<br />
Aggressive Equity Fund 33
Russell Investment Funds<br />
Aggressive Equity Fund<br />
Schedule of Investments, continued — December 31, 2008<br />
Amounts in thousands (except contracts)<br />
Futures Contracts<br />
Number of<br />
Contracts<br />
Notional<br />
Amount<br />
Expiration<br />
Date<br />
Unrealized<br />
Appreciation<br />
(Depreciation)<br />
$<br />
Long Positions<br />
Russell 2000 Mini Index (CME) 274 USD 13,642 03/09 643<br />
Total Unrealized Appreciation (Depreciation) on Open Futures Contracts 643<br />
Presentation of Portfolio Holdings — December 31, 2008<br />
Portfolio Summary<br />
%ofNet<br />
Assets<br />
Auto and Transportation 3.9<br />
Consumer Discretionary 15.1<br />
Consumer Staples 2.7<br />
Financial Services 18.0<br />
Health Care 16.1<br />
Integrated Oils 0.1<br />
Materials and Processing 7.7<br />
Miscellaneous 1.3<br />
Other Energy 3.8<br />
Producer Durables 5.7<br />
Technology 11.8<br />
Utilities 5.1<br />
Short-Term Investments 9.5<br />
Other Securities 39.2<br />
Total Investments 140.0<br />
Other Assets and Liabilities, Net (40.0)<br />
100.0<br />
Futures Contracts 0.5<br />
See accompanying notes which are an integral part of the financial statements.<br />
34 Aggressive Equity Fund
(This page intentionally left blank)
Russell Investment Funds<br />
Non-U.S. Fund<br />
Portfolio Management Discussion and Analysis — December 31, 2008 (Unaudited)<br />
Growth of a $10,000 Investment<br />
$20,000<br />
$18,000<br />
$16,000<br />
$14,000<br />
$12,000<br />
$10,000<br />
$8,000<br />
Non-U.S. Fund<br />
MSCI EAFE® Index Net (USD)**<br />
$6,000<br />
*<br />
1999<br />
2000<br />
2001<br />
2002 2003 2004<br />
Yearly periods ended December 31<br />
2005<br />
2006<br />
2007<br />
2008<br />
Non-U.S. Fund<br />
Total<br />
Return<br />
1 Year (42.79)%<br />
5 Years 0.93%§<br />
10 Years 0.94%§<br />
MSCI EAFE ® Index Net (USD) **<br />
Total<br />
Return<br />
1 Year (43.38)%<br />
5 Years 1.66%§<br />
10 Years 0.80%§<br />
* Assumes initial investment on January 1, 1999.<br />
** Morgan Stanley Capital International Europe, Australia, Far East (MSCI EAFE) Index is an index composed of an arithmetic, market value-weighted average of<br />
the performance of approximately 1,600 securities listed on the stock exchange of the countries of Europe, Australia, and the Far East. The index is calculated<br />
on a total-return basis, which includes reinvestment of gross dividends before deduction of withholding taxes.<br />
§ <strong>Annual</strong>ized.<br />
The performance shown in this section does not reflect any Insurance Company Separate Account or Policy Charges. Performance is historical and assumes<br />
reinvestment of all dividends and capital gains. Investment return and principal value will fluctuate so that an investor’s shares, when redeemed, may be worth more or<br />
less than when purchased. Past performance is not indicative of future results.<br />
36 Non-U.S. Fund
Russell Investment Funds<br />
Non-U.S. Fund<br />
Portfolio Management Discussion — December 31, 2008 (Unaudited)<br />
The Non-US Fund (the “Fund”) allocates most of its assets<br />
among multiple money managers. Russell Investment<br />
Management Company (“RIMCo”), as the Fund’s advisor, may<br />
change the allocation of the Fund’s assets among money<br />
managers at any time. An exemptive order from the Securities<br />
and Exchange Commission (SEC) permits RIMCo to engage or<br />
terminate a money manager at any time, subject to the approval<br />
by the Fund’s Board without a shareholder vote. Pursuant to the<br />
terms of the exemptive order, the Fund is required to notify its<br />
shareholders within 60 days of when a money manager begins<br />
providing services. The Fund currently has four money<br />
managers.<br />
What is the Fund’s investment objective?<br />
The Fund seeks to provide long term capital growth.<br />
How did the Fund perform relative to its benchmark for<br />
the fiscal year ended December 31, 2008?<br />
For the fiscal year ended December 31, 2008, the Non-U.S.<br />
Fund lost 42.79%. This compared to its benchmark the MSCI<br />
EAFE ® Index Net (USD), which lost 43.38%. The Fund’s<br />
performance includes operating expenses, whereas Index<br />
returns are unmanaged and do not include expenses of any<br />
kind.<br />
For the year ended December 31, 2008, the Lipper ®<br />
International Core Funds (VIP) Average lost 43.13%. This<br />
result serves as a peer comparison and is expressed net of<br />
operating expenses.<br />
How did the market conditions described in the Market<br />
Summary report affect the Fund’s performance?<br />
The market environment proved extremely challenging.<br />
Precipitous changes in market leadership and economic trends<br />
left few places for managers to find protection from falling<br />
prices. Increasingly negative sentiment and rising risk aversion<br />
resulted in indiscriminate selling of stocks. Nowhere was this<br />
more evident than in the financials sector where managers<br />
sought safe havens in companies with less direct exposure to<br />
the credit crisis and stronger balance sheets they believed<br />
would offer competitive advantages in the midst of deteriorating<br />
conditions.<br />
The Fund’s larger exposure to defensive strategies and its rotation<br />
earlier in the year into more defensive sectors, which fared better<br />
in this market environment, contributed to its performance<br />
relative to the MSCI EAFE Index. The Fund’s sector positioning,<br />
in the form of an overweight to the consumer staples and health<br />
care sectors, two relative outperforming sectors contributed<br />
positively to benchmark relative performance. The Fund’s<br />
underweight and favorable stock selection in the weak performing<br />
financials sector contributed positively to benchmark-relative<br />
results.<br />
How did the investment strategies and techniques<br />
employed by the Fund and its money managers affect<br />
its performance?<br />
The Fund’s multi-style discipline provided some risk control in<br />
the period given the extreme variability in investment style and<br />
market leadership during the year. More defensive strategies<br />
helped moderate the impact of strategies more focused on<br />
stronger economic conditions. Wellington Management<br />
Company, LLP, the Fund’s aggressive, high growth manager,<br />
underperformed in this market environment. The combination of<br />
downward earnings revisions (i.e., lowered growth expectations)<br />
and contraction in valuations contributed to Wellington’s<br />
underperformance. However, the Fund’s more defensive<br />
managers were more effective in moderating downside risk.<br />
MFS Institutional Advisors, Inc., the Fund’s quality growth<br />
manager, benefited from exposure to the more stable earnings<br />
trends of consumer staples and health care, but also managed to<br />
avoid much of the volatility in the financials and materials<br />
sectors with a combination of underweighted positions and more<br />
defensive stock picks. Altrinsic Global Advisors, LLC, the<br />
Fund’s value manager, provided the best performance of the<br />
Fund’s four managers. Its quality value orientation effectively<br />
gained exposure to many of the market’s less negative trends.<br />
Altrinsic was particularly effective in its financial stock<br />
selection. The firm’s emphasis on Japanese banks, which it<br />
believed to be more insulated from the housing market<br />
problems affecting U.S., U.K., and other European banks,<br />
contributed positively to performance. The firm’s large<br />
overweight to consumer staples also contributed positively to its<br />
relative performance.<br />
The Fund’s performance shown throughout this report was based<br />
on valuations calculated in accordance with Generally Accepted<br />
Accounting Principles (GAAP) and in accordance with a newly<br />
effective accounting statement (SFAS 157), reflects the<br />
December 31, 2008 market value of the pooled investment<br />
vehicle in which the Fund invested its cash collateral received<br />
in securities lending transactions. This market value is lower<br />
than the vehicle’s amortized cost per unit. This had a negative<br />
impact on the Fund’s benchmark relative performance.<br />
Describe any changes to the Fund’s structure or the<br />
money manager line-up.<br />
There were no changes to the Fund’s structure or money<br />
manager line-up during the year.<br />
Money Managers as of<br />
December 31, 2008<br />
Altrinsic Global Advisors, LLC<br />
AQR Capital Management, LLC<br />
MFS Institutional Advisors, Inc.<br />
Wellington Management Company, LLP<br />
Styles<br />
Value<br />
Market Oriented<br />
Growth<br />
Growth<br />
The views expressed in this report reflect those of the portfolio<br />
managers only through the end of the period covered by the<br />
report. These views do not necessarily represent the views of<br />
RIMCo, or any other person in RIMCo or any other affiliated<br />
organization. These views are subject to change at any time<br />
based upon market conditions or other events, and RIMCo<br />
disclaims any responsibility to update the views contained<br />
herein. These views should not be relied on as investment<br />
advice and, because investment decisions for Russell<br />
Non-U.S. Fund 37
Russell Investment Funds<br />
Non-U.S. Fund<br />
Portfolio Management Discussion — December 31, 2008 (Unaudited)<br />
Investment Funds (RIF) are based on numerous factors, should<br />
not be relied on as an indication of investment decisions of any<br />
RIF Fund.<br />
38 Non-U.S. Fund
Russell Investment Funds<br />
Non-U.S. Fund<br />
Shareholder Expense Example — December 31, 2008 (Unaudited)<br />
Fund Expenses<br />
The following disclosure provides important information<br />
regarding each Fund’s Expense Example, which appears<br />
on each Fund’s individual page in this <strong>Annual</strong> Report.<br />
Please refer to this information when reviewing the<br />
Expense Example for a Fund.<br />
Example<br />
As a shareholder of the Fund, you incur two types of costs: (1)<br />
transaction costs, and (2) ongoing costs, including management<br />
fees and other Fund expenses. The Example is intended to help<br />
you understand your ongoing costs (in dollars) of investing in<br />
the Fund and to compare these costs with the ongoing costs of<br />
investing in other mutual funds. The Example is based on an<br />
investment of $1,000 invested at the beginning of the period<br />
and held for the entire period indicated, which for this Fund is<br />
from July 1, 2008 to December 31, 2008.<br />
Actual Expenses<br />
The information in the table under the heading “Actual<br />
Performance” provides information about actual account values<br />
and actual expenses. You may use the information in this<br />
column, together with the amount you invested, to estimate the<br />
expenses that you paid over the period. Simply divide your<br />
account value by $1,000 (for example, an $8,600 account value<br />
divided by $1,000 = 8.6), then multiply the result by the<br />
number in the first column in the row entitled “Expenses Paid<br />
During Period” to estimate the expenses you paid on your<br />
account during this period.<br />
Hypothetical Example for Comparison Purposes<br />
The information in the table under the heading “Hypothetical<br />
Performance (5% return before expenses)” provides information<br />
about hypothetical account values and hypothetical expenses<br />
based on the Fund’s actual expense ratio and an assumed rate<br />
of return of 5% per year before expenses, which is not the<br />
Fund’s actual return. The hypothetical account values and<br />
expenses may not be used to estimate the actual ending account<br />
balance or expenses you paid for the period. You may use this<br />
information to compare the ongoing costs of investing in the<br />
Fund and other funds. To do so, compare this 5% hypothetical<br />
example with the 5% hypothetical examples that appear in the<br />
shareholder reports of other funds.<br />
Please note that the expenses shown in the table are meant to<br />
highlight your ongoing costs only and do not reflect any<br />
transactional costs. Therefore, the information under the<br />
heading “Hypothetical Performance (5% return before<br />
expenses)” is useful in comparing ongoing costs only, and will<br />
not help you determine the relative total costs of owning<br />
different funds. In addition, if these transactional costs were<br />
included, your costs would have been higher. The fee and<br />
expenses shown in this section do not reflect any Insurance<br />
Company Separate Account or Policy Charges.<br />
Actual<br />
Performance<br />
Hypothetical<br />
Performance<br />
(5% return<br />
before expenses)<br />
Beginning Account Value<br />
July 1, 2008 $ 1,000.00 $ 1,000.00<br />
Ending Account Value<br />
December 31, 2008 $ 645.38 $ 1,019.36<br />
Expenses Paid During Period* $ 4.76 $ 5.84<br />
* Expenses are equal to the Fund’s annualized expense ratio of 1.15%<br />
(representing the one-half year period annualized), multiplied by the average<br />
account value over the period, multiplied by 184/366 (to reflect the one-half<br />
year period). Reflects amounts waived and/or reimbursed. Without the waiver<br />
and/or reimbursement, expenses would have been higher.<br />
Non-U.S. Fund 39
Russell Investment Funds<br />
Non-U.S. Fund<br />
Schedule of Investments — December 31, 2008<br />
Amounts in thousands (except share amounts)<br />
Principal<br />
Amount ($)<br />
or Shares<br />
Market<br />
Value<br />
$<br />
Common Stocks - 85.7%<br />
Australia - 1.8%<br />
ABC Learning Centres, Ltd. 5,058 2<br />
AGL Energy, Ltd. 2,214 24<br />
Allco Finance Group, Ltd. (Æ) 99,445 10<br />
Amcor, Ltd. 9,245 37<br />
AMP, Ltd. 3,583 14<br />
Ansell, Ltd. - GDR 9,646 85<br />
APN News & Media, Ltd. 3,571 6<br />
Aristocrat Leisure, Ltd. 3,217 9<br />
Asciano Group 3,522 4<br />
Austereo Group, Ltd. 1,180 1<br />
Australia & New Zealand Banking Group, Ltd. 10,048 108<br />
AWB, Ltd. 8,288 15<br />
AXA Asia Pacific Holdings, Ltd. 8,105 28<br />
BHP Billiton, Ltd. 24,544 517<br />
BlueScope Steel, Ltd. 20,491 50<br />
Brambles, Ltd. 12,055 63<br />
Caltex Australia, Ltd. 1,581 8<br />
Centennial Coal Co., Ltd. 1,311 3<br />
CFS Retail Property Trust (ö) 11,495 15<br />
Coca-Cola Amatil, Ltd. 2,513 16<br />
Commonwealth Bank of Australia 9,685 196<br />
CSL, Ltd. 17,686 418<br />
Dexus Property Group (ö) 19,680 11<br />
Downer EDI, Ltd. 24,211 65<br />
Fairfax Media, Ltd. 2,156 2<br />
Felix Resources, Ltd. 10,357 64<br />
Flight Centre, Ltd. 1,861 10<br />
Foster’s Group, Ltd. 35,811 138<br />
Goodman Group (ö) 11,147 6<br />
GPT Group (ö) 25,815 17<br />
Insurance Australia Group, Ltd. 5,003 14<br />
Macquarie Infrastructure Group 8,462 10<br />
Macquarie Office Trust (ö) 20,228 3<br />
Metcash, Ltd. 14,233 44<br />
Mirvac Group (ö) 7,928 7<br />
Mount Gibson Iron, Ltd. (Æ) 46,934 15<br />
National Australia Bank, Ltd. 38,026 557<br />
Newcrest Mining, Ltd. 29,968 711<br />
Origin Energy, Ltd. 5,224 59<br />
PaperlinX, Ltd. 21,919 11<br />
Qantas Airways, Ltd. 24,638 45<br />
QBE Insurance Group, Ltd. 19,514 355<br />
Rio Tinto, Ltd. 1,615 43<br />
Santos, Ltd. 4,216 44<br />
Spotless Group, Ltd. 2,419 5<br />
Stockland (ö) 8,441 24<br />
Suncorp-Metway, Ltd. 13,187 78<br />
TABCORP Holdings, Ltd. 11,727 57<br />
Telstra Corp., Ltd. 43,915 118<br />
Wesfarmers, Ltd. 3,696 47<br />
Westfield Group (ö) 11,911 110<br />
Westpac Banking Corp. 19,473 232<br />
Woolworths, Ltd. 7,174 134<br />
4,665<br />
Principal<br />
Amount ($)<br />
or Shares<br />
Market<br />
Value<br />
$<br />
Austria - 0.3%<br />
Erste Bank der Oesterreichischer<br />
Sparkassen AG (Ñ) 29,622 694<br />
Belgium - 0.2%<br />
Delhaize Group 176 11<br />
Euronav NV 2,483 34<br />
Hansen Transmissions International<br />
NV (Æ) 193,827 327<br />
Nationale A Portefeuille 1,525 74<br />
Tessenderlo Chemie NV 2,988 91<br />
Umicore 2,248 44<br />
581<br />
Bermuda - 0.3%<br />
Catlin Group, Ltd. 6,829 43<br />
Cheung Kong Infrastructure Holdings, Ltd. 2,000 8<br />
Chinese Estates Holdings, Ltd. 18,000 21<br />
Esprit Holdings, Ltd. 6,652 38<br />
First Pacific Co. 4,000 1<br />
Giordano International, Ltd. 11,474 3<br />
Great Eagle Holdings, Ltd. 1,000 1<br />
Hongkong Land Holdings, Ltd. 1,000 2<br />
Jardine Matheson Holdings, Ltd. 400 7<br />
Li & Fung, Ltd. 286,000 493<br />
Mongolia Energy Co. Ltd (Æ) 1,000 —<br />
Noble Group, Ltd. 11,000 8<br />
Orient Overseas International, Ltd. 8,300 19<br />
Pacific Basin Shipping, Ltd. 6,000 3<br />
Seadrill, Ltd. 17,850 145<br />
Texwinca Holdings, Ltd. 16,000 7<br />
VTech Holdings, Ltd. 1,133 5<br />
804<br />
Brazil - 0.4%<br />
Cia Vale do Rio Doce - ADR (Ñ) 29,700 360<br />
Petroleo Brasileiro SA - ADR 19,300 472<br />
Unibanco - Uniao de Bancos Brasileiros<br />
SA - ADR 2,600 168<br />
1,000<br />
Canada - 1.5%<br />
Barrick Gold Corp. 21,100 776<br />
Canadian National Railway Co. 23,330 857<br />
Canadian Natural Resources, Ltd. 11,300 446<br />
Potash Corp. of Saskatchewan 5,900 432<br />
Research In Motion, Ltd. (Æ)(Ñ) 9,900 402<br />
Rogers Communications, Inc. 13,600 403<br />
Suncor Energy, Inc. 23,200 446<br />
3,762<br />
Cayman Islands - 0.1%<br />
Ctrip.com International, Ltd. (Ñ) 8,500 202<br />
Hutchison Telecommunications<br />
International, Ltd. 71,457 19<br />
LDK Solar Co., Ltd. - ADR (Æ)(Ñ) 5,300 70<br />
291<br />
40 Non-U.S. Fund
Russell Investment Funds<br />
Non-U.S. Fund<br />
Schedule of Investments, continued — December 31, 2008<br />
Amounts in thousands (except share amounts)<br />
Principal<br />
Amount ($)<br />
or Shares<br />
Market<br />
Value<br />
$<br />
China - 0.2%<br />
China Communications Construction Co.,<br />
Ltd. Class H 295,000 369<br />
China Merchants Bank Co., Ltd. 104,000 195<br />
564<br />
Czech Republic - 0.2%<br />
Komercni Banka AS (Ñ) 2,918 449<br />
Denmark - 0.3%<br />
AP Moller - Maersk A/S 49 263<br />
H Lundbeck A/S (Ñ) 2,289 48<br />
Novo Nordisk A/S Series B 234 12<br />
TDC A/S 7 —<br />
Vestas Wind Systems A/S (Æ) 8,856 526<br />
849<br />
Finland - 0.8%<br />
Fortum OYJ 15,513 333<br />
Konecranes OYJ 3,872 66<br />
Nokia OYJ 90,439 1,402<br />
Oriola-KD OYJ 3,393 6<br />
Outokumpu OYJ 5,849 69<br />
Rautaruukki OYJ 2,789 48<br />
Sanoma OYJ 1,652 22<br />
Stora Enso OYJ Class R 3,481 27<br />
1,973<br />
France - 12.3%<br />
Air Liquide SA 13,283 1,215<br />
Alcatel-Lucent - ADR (Æ)(Ñ) 10,008 22<br />
Alstom SA 853 50<br />
AXA SA 87,852 1,959<br />
bioMerieux 733 61<br />
BNP Paribas 18,902 798<br />
Bouygues 229 10<br />
Carrefour SA (Ñ) 39,160 1,504<br />
Christian Dior SA 579 33<br />
Ciments Francais SA 461 39<br />
CNP Assurances 3,062 222<br />
Credit Agricole SA 5,796 66<br />
Eramet 155 30<br />
France Telecom SA 42,984 1,202<br />
GDF Suez (Ñ) 55,393 2,743<br />
Ipsos 466 13<br />
L’Oreal SA (Ñ) 10,667 927<br />
Lagardere SCA 2,958 120<br />
Legrand SA (Ñ) 45,299 870<br />
LVMH Moet Hennessy Louis Vuitton SA 35,062 2,356<br />
M6-Metropole Television 1,694 33<br />
Neopost SA 2,450 222<br />
Nexans SA (Ñ) 1,333 80<br />
Pernod-Ricard SA (Ñ) 17,684 1,311<br />
PPR (Ñ) 2,485 162<br />
Sanofi-Aventis SA 48,675 3,092<br />
Schneider Electric SA (Ñ) 25,940 1,938<br />
Principal<br />
Amount ($)<br />
or Shares<br />
Market<br />
Value<br />
$<br />
Sodexo 876 48<br />
Teleperformance - GDR 13,303 371<br />
Thales SA 29,699 1,239<br />
Total SA 92,896 5,064<br />
UBISOFT Entertainment (Æ) 7,641 149<br />
Unibail-Rodamco (ö) 140 21<br />
Valeo SA (Ñ) 5,813 86<br />
Vallourec (Ñ) 385 44<br />
Veolia Environnement 3,912 123<br />
Vivendi 99,323 3,234<br />
31,457<br />
Germany - 7.3%<br />
Allianz SE 17,268 1,852<br />
BASF SE 14,826 586<br />
Bayer AG (Ñ) 31,705 1,862<br />
Commerzbank AG (Ñ) 8,596 82<br />
Daimler AG 3,075 117<br />
Deutsche Bank AG (Ñ) 5,466 218<br />
Deutsche Boerse AG 9,300 677<br />
Deutsche Lufthansa AG 5,694 90<br />
Deutsche Postbank AG (Æ)(Ñ) 2,274 50<br />
Deutsche Telekom AG 37,023 563<br />
E.ON AG 47,189 1,908<br />
Fielmann AG 357 23<br />
Fresenius Medical Care AG & Co. 8,643 405<br />
Generali Deutschland Holding AG 319 33<br />
Hannover Rueckversicherung AG (Æ) 14,074 448<br />
Lanxess AG 6,445 125<br />
Linde AG 24,080 2,038<br />
Merck KGAA 14,690 1,336<br />
Metro AG 21,121 856<br />
MTU Aero Engines Holding AG 4,491 124<br />
Muenchener Rueckversicherungs AG 5,451 857<br />
Norddeutsche Affinerie AG 340 14<br />
RWE AG 3,282 295<br />
Salzgitter AG 5,485 433<br />
SAP AG 38,020 1,363<br />
Siemens AG 13,069 979<br />
Symrise AG 70,217 992<br />
ThyssenKrupp AG 228 6<br />
Tognum AG 6,881 88<br />
Volkswagen AG 548 192<br />
Wacker Chemie AG 709 75<br />
Wincor Nixdorf AG 1,073 51<br />
18,738<br />
Hong Kong - 0.7%<br />
BOC Hong Kong Holdings, Ltd. 37,500 43<br />
Cheung Kong Holdings, Ltd. 65,340 623<br />
China Mobile, Ltd. 35,500 360<br />
CLP Holdings, Ltd. 15,500 105<br />
Hang Lung Group, Ltd. 8,763 27<br />
Hang Lung Properties, Ltd. - ADR 9,000 20<br />
Hang Seng Bank, Ltd. 3,200 42<br />
Henderson Land Development Co., Ltd. 5,000 19<br />
Hong Kong & China Gas Co., Ltd. 2,000 3<br />
Non-U.S. Fund 41
Russell Investment Funds<br />
Non-U.S. Fund<br />
Schedule of Investments, continued — December 31, 2008<br />
Amounts in thousands (except share amounts)<br />
Principal<br />
Amount ($)<br />
or Shares<br />
Market<br />
Value<br />
$<br />
Hong Kong Exchanges and Clearing, Ltd. 6,654 64<br />
HongKong & Shanghai Hotels (The) 1,500 1<br />
HongKong Electric Holdings 13,500 76<br />
Hopewell Holdings 9,000 30<br />
Hutchison Whampoa, Ltd. 19,000 96<br />
Hysan Development Co., Ltd. 20,000 33<br />
Industrial and Commercial Bank of China<br />
Asia, Ltd. 28,000 30<br />
Link REIT (The) (ö) 13,500 22<br />
New World Development, Ltd. 16,000 16<br />
Sun Hung Kai Properties, Ltd. 7,667 64<br />
Swire Pacific, Ltd. 8,000 55<br />
Television Broadcasts, Ltd. 9,000 30<br />
Wharf Holdings, Ltd. 7,000 19<br />
Wheelock & Co., Ltd. 13,205 29<br />
1,807<br />
India - 0.2%<br />
Infosys Technologies, Ltd. - ADR (Ñ) 25,620 629<br />
Indonesia - 0.0%<br />
Telekomunikasi Indonesia Tbk PT - ADR 1,750 44<br />
Israel - 0.5%<br />
Teva Pharmaceutical Industries, Ltd. -<br />
ADR (Ñ) 29,000 1,235<br />
Italy - 1.7%<br />
Alleanza Assicurazioni SpA (Ñ) 93,388 761<br />
Ansaldo STS SpA 38,948 549<br />
Banco Popolare SC 10,472 73<br />
Buzzi Unicem SpA 3,159 52<br />
Credito Emiliano SpA 3,435 18<br />
Davide Campari-Milano SpA 11,086 75<br />
Enel SpA 23,244 149<br />
ENI SpA 62,559 1,482<br />
Fondiaria-Sai SpA 50 1<br />
Indesit Co. SpA 7,935 48<br />
Intesa Sanpaolo SpA (Æ) 195,484 704<br />
Maire Tecnimont SpA 6,342 13<br />
Mediaset SpA (Ñ) 16,214 93<br />
Milano Assicurazioni SPA 6,076 19<br />
Pirelli & C SpA 146,470 54<br />
Saras SpA 4,025 14<br />
Terna Rete Elettrica Nazionale SpA 49,456 162<br />
UniCredit SpA (Æ) 11,873 29<br />
Unione di Banche Italiane SCPA 657 9<br />
Unipol Gruppo Finanziario SpA 9,537 15<br />
4,320<br />
Japan - 19.1%<br />
77 Bank, Ltd. (The) 5,000 27<br />
Aeon Credit Service Co., Ltd. (Ñ) 41,000 434<br />
Aiful Corp. (Ñ) 4,400 13<br />
Aioi Insurance Co., Ltd. 8,000 42<br />
Aisin Seiki Co., Ltd. 3,100 44<br />
Alps Electric Co., Ltd. 7,300 36<br />
Principal<br />
Amount ($)<br />
or Shares<br />
Market<br />
Value<br />
$<br />
Amada Co., Ltd. 5,000 24<br />
Aruze Corp. 700 7<br />
Asahi Glass Co., Ltd. 6,000 34<br />
Astellas Pharma, Inc. 13,400 545<br />
Bank of Yokohama, Ltd. (The) 165,366 978<br />
Bridgestone Corp. 3,400 51<br />
Brother Industries, Ltd. (Ñ) 9,700 58<br />
Calsonic Kansei Corp. 18,000 26<br />
Canon Marketing Japan, Inc. (Ñ) 7,600 123<br />
Canon, Inc. 98,400 3,089<br />
Casio Computer Co., Ltd. 5,900 37<br />
Central Glass Co., Ltd. 20,000 81<br />
Central Japan Railway Co. 4 35<br />
Chubu Electric Power Co., Inc. 5,300 161<br />
Circle K Sunkus Co., Ltd. (Ñ) 6,600 119<br />
Coca-Cola West Co., Ltd. (Ñ) 2,200 48<br />
COMSYS Holdings Corp. 5,000 46<br />
Credit Saison Co., Ltd. (Ñ) 1,000 14<br />
Dai Nippon Printing Co., Ltd. 11,000 121<br />
Daiei, Inc. (The) (Æ)(Ñ) 6,500 42<br />
Daiichi Chuo Kisen Kaisha 9,000 25<br />
Daiichi Sankyo Co., Ltd. 3,200 76<br />
Daishi Bank, Ltd. (The) 10,000 44<br />
Daito Trust Construction Co., Ltd. 500 26<br />
Daiwa Securities Group, Inc. (Ñ) 87,450 521<br />
Denso Corp. 7,700 128<br />
DIC Corp. 4,000 8<br />
Doutor Nichires Holdings Co., Ltd. 700 15<br />
East Japan Railway Co. (Å) 52 415<br />
Ebara Corp. (Ñ) 13,000 30<br />
Eisai Co., Ltd. (Ñ) 6,800 282<br />
Exedy Corp. 2,600 26<br />
FamilyMart Co., Ltd. 2,100 91<br />
Fanuc, Ltd. 19,600 1,394<br />
Fuji Fire & Marine Insurance Co., Ltd.<br />
(The) 22,000 33<br />
Fuji Media Holdings, Inc. 554 793<br />
FUJIFILM Holdings Corp. 4,800 106<br />
Fujitsu, Ltd. 3,000 15<br />
Funai Electric Co., Ltd. 1,900 39<br />
Furukawa Electric Co., Ltd. 2,000 10<br />
FUTABA Corp. 1,500 19<br />
Glory, Ltd. 5,100 100<br />
Gunze, Ltd. 5,000 16<br />
H2O Retailing Corp. (Ñ) 6,000 45<br />
Hachijuni Bank, Ltd. (The) (Ñ) 3,000 17<br />
Hakuhodo DY Holdings, Inc. 450 25<br />
Higo Bank, Ltd. (The) 9,000 57<br />
Hino Motors, Ltd. 8,000 16<br />
Hirose Electric Co., Ltd. (Ñ) 5,200 525<br />
Hitachi Cable, Ltd. 13,000 29<br />
Hitachi Capital Corp. 4,800 60<br />
Hitachi High-Technologies Corp. (Ñ) 2,100 34<br />
Hitachi Software Engineering Co., Ltd. 3,300 51<br />
Hitachi Transport System, Ltd. 5,000 75<br />
Hitachi, Ltd. 22,000 85<br />
Hokkoku Bank, Ltd. (The) (Ñ) 12,000 42<br />
42 Non-U.S. Fund
Russell Investment Funds<br />
Non-U.S. Fund<br />
Schedule of Investments, continued — December 31, 2008<br />
Amounts in thousands (except share amounts)<br />
Principal<br />
Amount ($)<br />
or Shares<br />
Market<br />
Value<br />
$<br />
Honda Motor Co., Ltd. 8,800 191<br />
Hoya Corp. 63,900 1,110<br />
Inpex Holdings, Inc. 186 1,470<br />
Isuzu Motors, Ltd. 47,000 60<br />
Itoham Foods, Inc. 22,000 80<br />
JFE Holdings, Inc. (Ñ) 2,300 61<br />
JFE Shoji Holdings, Inc. 16,000 49<br />
JGC Corp. 3,000 45<br />
Joyo Bank, Ltd. (The) (Ñ) 266,940 1,521<br />
JSR Corp. (Ñ) 8,200 92<br />
Kagoshima Bank, Ltd. (The) 12,000 100<br />
Kaken Pharmaceutical Co., Ltd. 6,000 66<br />
Kamigumi Co., Ltd. 6,000 54<br />
Kandenko Co., Ltd. (Ñ) 2,000 16<br />
Kaneka Corp. 10,000 64<br />
Kansai Electric Power Co., Inc. (The) 700 20<br />
Kansai Paint Co., Ltd. 21,000 107<br />
Kao Corp. 64,000 1,938<br />
KDDI Corp. 14 100<br />
Keihin Corp. (Ñ) 9,900 72<br />
Keiyo Bank, Ltd. (The) 2,000 10<br />
Keyence Corp. 3,556 728<br />
Kinden Corp. 4,000 36<br />
Kintetsu World Express, Inc. (Ñ) 1,000 20<br />
Kobayashi Pharmaceutical Co., Ltd. (Ñ) 500 21<br />
Komatsu, Ltd. (Ñ) 17,500 222<br />
Komori Corp. 6,800 75<br />
Konica Minolta Holdings, Inc. 24,000 186<br />
Kose Corp. 60,640 1,524<br />
Kuraray Co., Ltd. (Ñ) 9,000 70<br />
Kyocera Corp. 1,100 79<br />
Kyoei Steel, Ltd. (Ñ) 1,400 28<br />
Lawson, Inc. 1,700 98<br />
Leopalace21 Corp. 2,300 23<br />
Lintec Corp. 3,800 53<br />
Matsumotokiyoshi Holdings Co., Ltd. 1,000 21<br />
Mediceo Paltac Holdings Co., Ltd. (Æ) 1,300 16<br />
MID Reit, Inc. Class A (ö) 180 345<br />
Miraca Holdings, Inc. 1,500 33<br />
Mitsubishi Corp. 5,400 76<br />
Mitsubishi Electric Corp. 4,000 25<br />
Mitsubishi Estate Co., Ltd. 8,000 132<br />
Mitsubishi Heavy Industries, Ltd. 5,000 22<br />
Mitsubishi Materials Corp. 17,000 43<br />
Mitsubishi UFJ Financial Group, Inc. 155,992 968<br />
Mitsubishi UFJ Lease & Finance Co.,<br />
Ltd. (Ñ) 2,610 66<br />
Mitsui & Co., Ltd. 13,000 133<br />
Mitsui Fudosan Co., Ltd. 27,000 449<br />
Mitsui OSK Lines, Ltd. 8,000 49<br />
Mitsui Sumitomo Insurance Group<br />
Holdings, Inc. 53,200 1,697<br />
Mizuho Financial Group, Inc. (Ñ)(Å) 168 501<br />
Musashino Bank, Ltd. (The) 900 35<br />
Nachi-Fujikoshi Corp. 3,000 6<br />
Namco Bandai Holdings, Inc. 5,000 55<br />
NEC Corp. (Ñ) 21,000 70<br />
Principal<br />
Amount ($)<br />
or Shares<br />
Market<br />
Value<br />
$<br />
NEC Electronics Corp. (Æ) 3,600 34<br />
NGK Insulators, Ltd. 4,000 45<br />
Nichirei Corp. 24,000 114<br />
Nifco, Inc. 3,000 31<br />
Nintendo Co., Ltd. 2,500 961<br />
Nippon Building Fund, Inc. Class A (ö) 2 22<br />
Nippon Commercial Investment Corp. (ö)(Ñ) 131 139<br />
Nippon Electric Glass Co., Ltd. 9,000 47<br />
Nippon Express Co., Ltd. 27,000 114<br />
Nippon Kayaku Co., Ltd. 11,000 57<br />
Nippon Konpo Unyu Soko Co., Ltd. 4,000 44<br />
Nippon Oil Corp. 17,000 86<br />
Nippon Seiki Co., Ltd. 1,000 6<br />
Nippon Sheet Glass Co., Ltd. 6,000 20<br />
Nippon Shinyaku Co., Ltd. 1,000 12<br />
Nippon Steel Corp. 26,000 85<br />
Nippon Telegraph & Telephone Corp. 30 167<br />
Nippon Yusen KK (Ñ) 10,000 62<br />
Nipponkoa Insurance Co., Ltd. 239,490 1,862<br />
Nishimatsuya Chain Co., Ltd. 1,600 15<br />
Nissan Motor Co., Ltd. 11,100 40<br />
Nissan Shatai Co., Ltd. 11,000 68<br />
Nissay Dowa General Insurance Co., Ltd. 4,000 25<br />
Nisshin Seifun Group, Inc. 5,000 66<br />
Nissin Kogyo Co., Ltd. 500 4<br />
Nitto Denko Corp. 2,300 44<br />
Nomura Holdings, Inc. (Ñ) 95,020 784<br />
Nomura Research Institute, Ltd. (Ñ) 69,165 1,313<br />
NTN Corp. (Ñ) 6,000 18<br />
NTT DoCoMo, Inc. 209 412<br />
Okinawa Electric Power Co., Inc. (The) 800 60<br />
OKUMA Corp. (Æ) 4,000 15<br />
Omron Corp. 21,700 291<br />
Ono Pharmaceutical Co., Ltd. 400 21<br />
ORIX Corp. 890 51<br />
Osaka Gas Co., Ltd. 25,000 115<br />
Panasonic Corp. 14,000 175<br />
Promise Co., Ltd. (Ñ) 1,150 29<br />
QP Corp. (Ñ) 6,800 93<br />
Ricoh Co., Ltd. 1,000 13<br />
Rohm Co., Ltd. 3,000 151<br />
San-In Godo Bank, Ltd. (The) 4,000 32<br />
Sankyo Co., Ltd. 1,900 96<br />
SBI Holdings, Inc. (Æ)(Ñ) 87 13<br />
Seiko Epson Corp. (Ñ) 2,800 45<br />
Seino Holdings Corp. 10,000 56<br />
Sekisui House, Ltd. 3,000 26<br />
Seven & I Holdings Co., Ltd. 43,260 1,482<br />
Sharp Corp. (Ñ) 7,000 50<br />
Shima Seiki Manufacturing, Ltd. - GDR 2,100 41<br />
Shin-Etsu Chemical Co., Ltd. 38,400 1,761<br />
Shinsei Bank, Ltd. (Æ) 18,000 28<br />
Showa Shell Sekiyu KK 8,000 79<br />
SMC Corp. 13,748 1,407<br />
Snow Brand Milk Products Co., Ltd. (Ñ) 11,000 42<br />
Softbank Corp. (Ñ) 50,600 916<br />
Sony Corp. (Ñ) 5,800 126<br />
Non-U.S. Fund 43
Russell Investment Funds<br />
Non-U.S. Fund<br />
Schedule of Investments, continued — December 31, 2008<br />
Amounts in thousands (except share amounts)<br />
Principal<br />
Amount ($)<br />
or Shares<br />
Market<br />
Value<br />
$<br />
Stanley Electric Co., Ltd. 3,300 35<br />
Sugi Holdings Co., Ltd. - GDR (Ñ) 43,899 1,171<br />
Sumco Corp. (Ñ) 3,000 38<br />
Sumitomo Bakelite Co., Ltd. (Ñ) 8,000 32<br />
Sumitomo Corp. 6,900 61<br />
Sumitomo Forestry Co., Ltd. (Ñ) 8,300 67<br />
Sumitomo Metal Mining Co., Ltd. 2,000 21<br />
Sumitomo Mitsui Financial Group, Inc. (Ñ) 40 179<br />
Sumitomo Realty & Development Co., Ltd. 2,000 30<br />
Sumitomo Trust & Banking Co., Ltd. (The) 202,033 1,196<br />
Suzuken Co., Ltd. 2,400 72<br />
Suzuki Motor Corp. 56,919 787<br />
Taisho Pharmaceutical Co., Ltd. 1,000 21<br />
Takara Holdings, Inc. 6,000 36<br />
Takasago Thermal Engineering Co., Ltd. 1,000 8<br />
Takata Corp. (Ñ) 2,300 16<br />
Takeda Pharmaceutical Co., Ltd. 7,100 368<br />
Takefuji Corp. (Ñ) 3,700 30<br />
TDK Corp. (Ñ) 1,600 59<br />
THK Co., Ltd. (Ñ) 30,620 322<br />
Toagosei Co., Ltd. 8,000 24<br />
Toho Pharmaceutical Co., Ltd. 2,990 41<br />
Tohoku Electric Power Co., Inc. 800 22<br />
Tokai Rika Co., Ltd. 7,800 68<br />
Tokai Rubber Industries, Inc. 8,100 67<br />
Tokai Tokyo Securities Co., Ltd. 5,000 14<br />
Tokio Marine Holdings, Inc. 3,800 111<br />
Tokyo Electric Power Co., Inc. (The) 5,400 180<br />
Tokyo Electron, Ltd. 8,800 309<br />
Tokyo Gas Co., Ltd. 27,000 137<br />
Tokyo Steel Manufacturing Co., Ltd. (Ñ) 8,800 92<br />
Tokyu Land Corp. 4,000 15<br />
Toppan Forms Co., Ltd. 800 10<br />
Toppan Printing Co., Ltd. (Ñ) 7,000 54<br />
Toshiba TEC Corp. 20,000 60<br />
Toyo Ink Manufacturing Co., Ltd. (Ñ) 3,000 9<br />
Toyo Seikan Kaisha, Ltd. 6,400 133<br />
Toyoda Gosei Co., Ltd. 2,300 27<br />
Toyota Auto Body Co., Ltd. 6,200 91<br />
Toyota Motor Corp. 15,800 517<br />
Toyota Tsusho Corp. 3,300 35<br />
TS Tech Co., Ltd. 1,135 7<br />
TV Asahi Corp. 5 7<br />
Unicharm Corp. 8,000 605<br />
United Urban Investment Corp. (ö) 80 316<br />
USS Co., Ltd. 900 48<br />
West Japan Railway Co. 17 77<br />
Yahoo! Japan Corp. (Ñ) 1,156 473<br />
Yamaha Corp. (Ñ) 3,700 34<br />
Yamato Holdings Co., Ltd. (Ñ) 5,000 65<br />
Yamato Kogyo Co., Ltd. - GDR 700 19<br />
48,766<br />
Luxembourg - 0.0%<br />
ArcelorMittal (Ñ) 3,501 84<br />
Oriflame Cosmetics SA (Ñ) 1,104 32<br />
Reinet Investments SCA (Æ) 593 6<br />
122<br />
Principal<br />
Amount ($)<br />
or Shares<br />
Market<br />
Value<br />
$<br />
Malaysia - 0.1%<br />
Sime Darby Berhad 162,317 246<br />
Mauritius - 0.0%<br />
Golden Agri-Resources, Ltd. 134,176 22<br />
Mexico - 0.3%<br />
America Movil SAB de CV Series L (Ñ) 14,700 456<br />
Grupo Modelo SAB de CV (Ñ) 114,500 362<br />
818<br />
Netherlands - 3.8%<br />
Aegon NV (Æ) 6,298 40<br />
Akzo Nobel NV 9,343 385<br />
ASML Holding NV 40,841 729<br />
CSM 7,091 114<br />
European Aeronautic Defence and Space<br />
Co. NV 7,257 122<br />
Heineken NV 114,438 3,516<br />
Imtech NV 6,926 117<br />
ING Groep NV (Æ) 31,975 334<br />
James Hardie Industries NV (Æ) 10,036 33<br />
Koninklijke Ahold NV 50,273 618<br />
Koninklijke Philips Electronics NV (Ñ) 3,785 74<br />
Royal KPN NV 64,142 930<br />
SNS Reaal 14,666 81<br />
STMicroelectronics NV 5,952 40<br />
TNT NV 57,060 1,096<br />
TomTom NV (Æ) 2,610 19<br />
Unilever NV 6,915 168<br />
Wolters Kluwer NV 67,990 1,284<br />
9,700<br />
Netherlands Antilles - 0.0%<br />
Hunter Douglas NV 1,257 41<br />
Norway - 0.2%<br />
StatoilHydro ASA 25,902 427<br />
Portugal - 0.2%<br />
Energias de Portugal SA 148,542 560<br />
Singapore - 0.7%<br />
Ascendas Real Estate Investment<br />
Trust (Æ)(ö) 4,000 4<br />
CapitaLand, Ltd. 2,343 5<br />
CapitaMall Trust (Æ)(ö) 5,643 6<br />
China Aviation Oil Singapore Corp., Ltd. 1,000 1<br />
ComfortDelgro Corp., Ltd. 14,000 14<br />
Cosco Corp. Singapore, Ltd. 12,000 8<br />
DBS Group Holdings, Ltd. 65,400 388<br />
Haw Par Corp., Ltd. 3,000 8<br />
Indofood Agri Resources, Ltd. (Æ) 2,552 1<br />
Jardine Cycle & Carriage, Ltd. 3,800 25<br />
Keppel Corp., Ltd. 13,555 41<br />
Keppel Land, Ltd. 1,000 1<br />
44 Non-U.S. Fund
Russell Investment Funds<br />
Non-U.S. Fund<br />
Schedule of Investments, continued — December 31, 2008<br />
Amounts in thousands (except share amounts)<br />
Principal<br />
Amount ($)<br />
or Shares<br />
Market<br />
Value<br />
$<br />
Neptune Orient Lines, Ltd. 8,000 6<br />
Oversea-Chinese Banking Corp., Ltd. 15,000 52<br />
Pacific Century Regional Developments,<br />
Ltd. 53,000 5<br />
Singapore Airlines, Ltd. 5,970 47<br />
Singapore Exchange, Ltd. 6,000 22<br />
Singapore Petroleum Co., Ltd. 6,312 10<br />
Singapore Technologies Engineering, Ltd. 6,000 10<br />
Singapore Telecommunications, Ltd. 540,000 962<br />
SMRT Corp., Ltd. 3,000 3<br />
United Overseas Bank, Ltd. 6,572 59<br />
UOL Group, Ltd. 7,000 11<br />
Venture Corp., Ltd. 3,000 9<br />
1,698<br />
South Africa - 0.4%<br />
Gold Fields, Ltd. - ADR (Ñ) 61,740 613<br />
MTN Group, Ltd. 35,760 423<br />
1,036<br />
South Korea - 0.5%<br />
KB Financial Group, Inc. - ADR (Ñ) 9,648 253<br />
Samsung Electronics Co., Ltd. 3,029 1,100<br />
STX Pan Ocean Co., Ltd. (Æ) 400 2<br />
1,355<br />
Spain - 1.2%<br />
Banco Bilbao Vizcaya Argentaria SA 25,656 315<br />
Banco Santander SA 71,989 694<br />
Criteria Caixacorp SA 1,133 5<br />
Ebro Puleva SA (Æ) 801 11<br />
Endesa SA 983 40<br />
Gas Natural SDG SA 3,271 89<br />
Iberia Lineas Aereas de Espana 42,192 118<br />
Inditex SA 6,049 267<br />
Prosegur Cia de Seguridad SA 3,561 118<br />
Red Electrica de Espana 1,190 60<br />
Repsol YPF SA 12,286 262<br />
Telefonica SA 49,466 1,109<br />
Union Fenosa SA 284 7<br />
Vertice Trescientos Sesenta Grados (Æ) 3,257 3<br />
Viscofan SA 1,801 35<br />
3,133<br />
Sweden - 1.3%<br />
Axfood AB 2,051 44<br />
Electrolux AB 1,279 11<br />
Hennes & Mauritz AB Series B Class B (Ñ) 13,765 538<br />
Intrum Justitia AB 3,441 35<br />
Investor AB Class B 265 4<br />
Loomis AB (Æ)(Ñ) 1,388 9<br />
Nordea Bank AB 18,703 132<br />
SAS AB (Æ) 7,286 35<br />
Scania AB Class B (Æ) 14,402 144<br />
Securitas AB Class B 6,527 54<br />
Skanska AB Class B 17,600 175<br />
Principal<br />
Amount ($)<br />
or Shares<br />
Market<br />
Value<br />
$<br />
Svenska Cellulosa AB Class B 24,676 211<br />
Svenska Handelsbanken AB Class A 1,051 17<br />
Swedish Match AB 30,949 443<br />
Tele2 AB Class B 17,944 159<br />
Telefonaktiebolaget LM Ericsson<br />
Class B (Ñ) 167,893 1,288<br />
TeliaSonera AB 6,039 30<br />
3,329<br />
Switzerland - 8.9%<br />
ABB, Ltd. (Æ) 29,262 441<br />
Actelion, Ltd. (Ñ) 18,298 1,031<br />
Baloise Holding AG 145 11<br />
Barry Callebaut AG (Æ) 160 104<br />
Compagnie Financiere Richemont SA -<br />
Class A 39,758 772<br />
Credit Suisse Group AG 17,113 469<br />
Givaudan SA (Ñ) 2,040 1,607<br />
Helvetia Holding AG (Æ) 884 192<br />
Holcim, Ltd. 786 45<br />
Jelmoli Holding AG (Æ) 30 56<br />
Julius Baer Holding AG 41,036 1,578<br />
Nestle SA 176,792 6,968<br />
Novartis AG 34,970 1,752<br />
Roche Holding AG 35,536 5,470<br />
Sonova Holding AG 4,023 243<br />
Swiss Reinsurance 18,389 893<br />
UBS AG (Æ) 50,040 726<br />
Zurich Financial Services AG 1,638 356<br />
22,714<br />
Taiwan - 0.6%<br />
Taiwan Semiconductor Manufacturing Co.,<br />
Ltd. 588,500 805<br />
Taiwan Semiconductor Manufacturing Co.,<br />
Ltd. - ADR 81,390 643<br />
1,448<br />
Thailand - 0.1%<br />
Bangkok Bank PCL 106,800 219<br />
United Kingdom - 18.3%<br />
3i Group PLC 70,392 277<br />
Aggreko PLC 20,368 131<br />
AMEC PLC - GDR 8,892 64<br />
Anglo American PLC 33,295 761<br />
Antofagasta PLC 106,300 657<br />
ARM Holdings PLC 408,214 511<br />
AstraZeneca PLC 41,539 1,683<br />
Atkins WS PLC 20,893 203<br />
Autonomy Corp. PLC (Æ) 52,100 717<br />
BAE Systems PLC 98,373 536<br />
Barclays PLC 73,696 166<br />
BBA Aviation PLC 68,277 68<br />
BG Group PLC 28,062 390<br />
BHP Billiton PLC 70,338 1,325<br />
Non-U.S. Fund 45
Russell Investment Funds<br />
Non-U.S. Fund<br />
Schedule of Investments, continued — December 31, 2008<br />
Amounts in thousands (except share amounts)<br />
Principal<br />
Amount ($)<br />
or Shares<br />
Market<br />
Value<br />
$<br />
BP PLC 168,222 1,289<br />
BP PLC - ADR (Ñ) 32,320 1,511<br />
British Airways PLC (Æ) 15,490 40<br />
British American Tobacco PLC 24,994 649<br />
British Land Co. PLC (ö) 3,139 25<br />
BT Group PLC 90,874 179<br />
Burberry Group PLC 109,900 353<br />
Cadbury PLC 189,311 1,657<br />
Capita Group PLC (The) 87,323 930<br />
Centrica PLC 66,162 254<br />
Close Brothers Group PLC 13,297 102<br />
Davis Service Group PLC 3,306 13<br />
Dawnay Day Treveria PLC (Æ) 586,180 60<br />
De La Rue PLC 3,360 44<br />
Diageo PLC 218,440 3,039<br />
Drax Group PLC 26,761 217<br />
DSG International PLC (Æ) 95,452 24<br />
easyJet PLC (Æ) 231,779 940<br />
Experian PLC 232,975 1,459<br />
GlaxoSmithKline PLC 184,948 3,433<br />
Hammerson PLC (ö) 2,600 20<br />
Hays PLC 258,897 261<br />
HBOS PLC (Æ) 26,806 —<br />
HBOS PLC 19,371 20<br />
HMV Group PLC 21,073 33<br />
Home Retail Group PLC 20,327 62<br />
HSBC Holdings PLC 125,296 1,199<br />
Imperial Tobacco Group PLC 5,721 153<br />
Intermediate Capital Group PLC 5,983 56<br />
J Sainsbury PLC 183,057 871<br />
Kingfisher PLC 145,803 285<br />
Ladbrokes PLC 143,825 385<br />
Land Securities Group PLC (ö) 1,609 21<br />
Legal & General Group PLC 133,906 149<br />
Lloyds TSB Group PLC 63,382 81<br />
Michael Page International PLC 118,192 368<br />
Mondi PLC 12,176 36<br />
Next PLC 9,583 150<br />
Old <strong>Mutual</strong> PLC 238,254 190<br />
Petrofac, Ltd. 15,193 76<br />
Reckitt Benckiser Group PLC 78,826 2,937<br />
Reed Elsevier PLC 4,022 29<br />
Regus PLC 118,259 85<br />
Rio Tinto PLC 5,678 123<br />
Royal Bank of Scotland Group PLC 243,487 176<br />
Royal Dutch Shell PLC<br />
Class A 109 2,850<br />
Class B 23,321 587<br />
Scottish & Southern Energy PLC 47,729 840<br />
Shire PLC 22,503 329<br />
Smiths Group PLC 62,469 804<br />
Standard Chartered PLC 133,097 1,701<br />
Tate & Lyle PLC 23,338 136<br />
Tesco PLC 97,301 507<br />
Tomkins PLC 35,588 64<br />
Trinity Mirror PLC 14,023 11<br />
Unilever PLC 11,658 265<br />
Principal<br />
Amount ($)<br />
or Shares<br />
Market<br />
Value<br />
$<br />
United Utilities Group PLC 17,269 156<br />
Vodafone Group PLC 793,269 1,597<br />
Vodafone Group PLC - ADR 84,300 1,723<br />
William Hill PLC 177,897 553<br />
WM Morrison Supermarkets PLC 211,255 857<br />
WPP Group PLC 395,417 2,305<br />
46,758<br />
United States - 1.2%<br />
Philip Morris International, Inc. 23,950 1,042<br />
Synthes, Inc. 15,835 2,002<br />
3,044<br />
Total Common Stocks<br />
(cost $278,503) 219,298<br />
Preferred Stocks - 0.5%<br />
Germany - 0.5%<br />
Fresenius SE 2,559 150<br />
Henkel AG & Co. KGaA (Ñ) 36,107 1,158<br />
Volkswagen AG 1,627 87<br />
Total Preferred Stocks<br />
(cost $2,086) 1,395<br />
Warrants & Rights - 0.0%<br />
Belgium - 0.0%<br />
Fortis (Æ) 10 13<br />
Singapore - 0.0%<br />
DBS Group Holdings, Ltd. (Æ) 33 68<br />
Total Warrants & Rights<br />
(cost $—) 81<br />
Short-Term Investments - 9.5%<br />
United States - 9.5%<br />
Russell Investment Company<br />
Money Market Fund 24,227,000 24,227<br />
Total Short-Term Investments<br />
(cost $24,227) 24,227<br />
Other Securities - 9.8%<br />
State Street Securities Lending Quality<br />
Trust () 26,399,671 24,950<br />
Total Other Securities<br />
(cost $26,400) 24,950<br />
Total Investments - 105.5%<br />
(identified cost $331,216) 269,951<br />
Other Assets and Liabilities,<br />
Net - (5.5%) (14,201)<br />
Net Assets - 100.0% 255,750<br />
See accompanying notes which are an integral part of the financial statements.<br />
46 Non-U.S. Fund
Russell Investment Funds<br />
Non-U.S. Fund<br />
Schedule of Investments, continued — December 31, 2008<br />
Amounts in thousands (except contracts)<br />
Futures Contracts<br />
Number of<br />
Contracts<br />
Notional<br />
Amount<br />
Expiration<br />
Date<br />
Unrealized<br />
Appreciation<br />
(Depreciation)<br />
$<br />
Long Positions<br />
AEX Index (Netherlands) 48 EUR 2,365 01/09 (10)<br />
CAC-40 Index (France) 167 EUR 5,379 01/09 13<br />
DAX Index (Germany) 16 EUR 1,934 03/09 49<br />
EUR STOXX 50 Index 177 EUR 4,337 03/09 (4)<br />
FTSE-100 Index (UK) 167 GBP 7,332 03/09 258<br />
MIB-30 (Italy) 29 EUR 2,816 03/09 26<br />
MSCI Singapore Index 2 SGD 88 01/09 2<br />
TOPIX Index (Japan) 94 JPY 810,280 03/09 423<br />
Short Positions<br />
DAX Index (Germany) 21 EUR 2,538 03/09 (85)<br />
Hang Seng Index (Hong Kong) 10 HKD 7,203 01/09 30<br />
IBEX Plus Index (Spain) 13 EUR 1,185 01/09 (11)<br />
OMX Stockholm 30 Index (Sweden) 21 SEK 1,384 01/09 —<br />
SPI 200 Index (Australia) 44 AUD 4,121 03/09 (144)<br />
TOPIX Index (Japan) 15 JPY 129,300 03/09 (34)<br />
Total Unrealized Appreciation (Depreciation) on Open Futures Contracts 513<br />
See accompanying notes which are an integral part of the financial statements.<br />
Non-U.S. Fund 47
Russell Investment Funds<br />
Non-U.S. Fund<br />
Schedule of Investments, continued — December 31, 2008<br />
Amounts in thousands<br />
Foreign Currency Exchange Contracts<br />
Amount<br />
Sold<br />
Amount<br />
Bought<br />
Settlement<br />
Date<br />
Unrealized<br />
Appreciation<br />
(Depreciation)<br />
$<br />
USD 118 AUD 171 01/05/09 1<br />
USD 22 AUD 31 03/18/09 —<br />
USD 501 AUD 732 03/18/09 6<br />
USD 686 AUD 1,034 03/18/09 30<br />
USD 742 AUD 1,085 03/18/09 9<br />
USD 1,001 AUD 1,465 03/18/09 13<br />
USD 6 CHF 6 01/05/09 —<br />
USD 7 CHF 8 01/06/09 —<br />
USD 283 CHF 299 01/06/09 (2)<br />
USD 343 CHF 400 03/18/09 32<br />
USD 344 CHF 400 03/18/09 32<br />
USD 344 CHF 400 03/18/09 32<br />
USD 344 CHF 400 03/18/09 32<br />
USD 630 CHF 664 03/18/09 (6)<br />
USD 28 DKK 155 03/18/09 1<br />
USD 28 DKK 155 03/18/09 1<br />
USD 28 DKK 155 03/18/09 1<br />
USD 28 DKK 155 03/18/09 1<br />
USD 70 DKK 373 03/18/09 (1)<br />
USD 85 EUR 60 01/02/09 (1)<br />
USD 243 EUR 172 01/02/09 (4)<br />
USD 31 EUR 22 01/05/09 —<br />
USD 57 EUR 41 01/06/09 —<br />
USD 280 EUR 200 03/18/09 (3)<br />
USD 431 EUR 300 03/18/09 (15)<br />
USD 645 EUR 500 03/18/09 49<br />
USD 683 EUR 485 03/18/09 (10)<br />
USD 692 EUR 516 03/18/09 23<br />
USD 692 EUR 516 03/18/09 23<br />
USD 1,265 EUR 1,000 03/18/09 121<br />
USD 1,288 EUR 1,000 03/18/09 99<br />
USD 2,840 EUR 2,218 03/18/09 236<br />
USD 2,840 EUR 2,218 03/18/09 236<br />
USD 2,841 EUR 2,218 03/18/09 235<br />
USD 2,841 EUR 2,218 03/18/09 235<br />
USD 2,850 EUR 2,218 03/18/09 226<br />
USD 17 GBP 12 01/02/09 —<br />
USD 87 GBP 58 03/18/09 (4)<br />
USD 87 GBP 58 03/18/09 (5)<br />
USD 87 GBP 58 03/18/09 (4)<br />
USD 88 GBP 58 03/18/09 (5)<br />
USD 147 GBP 100 03/18/09 (4)<br />
USD 155 GBP 100 03/18/09 (12)<br />
USD 206 GBP 138 03/18/09 (9)<br />
USD 206 GBP 138 03/18/09 (9)<br />
USD 591 GBP 400 03/18/09 (17)<br />
USD 1,187 GBP 809 03/18/09 (26)<br />
USD 1,189 GBP 809 03/18/09 (28)<br />
USD 1,189 GBP 809 03/18/09 (27)<br />
USD 1,190 GBP 809 03/18/09 (29)<br />
USD 1,192 GBP 809 03/18/09 (31)<br />
Foreign Currency Exchange Contracts<br />
Amount<br />
Sold<br />
Amount<br />
Bought<br />
Settlement<br />
Date<br />
Unrealized<br />
Appreciation<br />
(Depreciation)<br />
$<br />
USD 1,752 GBP 1,210 03/18/09 (15)<br />
USD 19 HKD 147 03/18/09 —<br />
USD 24 HKD 190 03/18/09 —<br />
USD 24 HKD 190 03/18/09 —<br />
USD 24 HKD 190 03/18/09 —<br />
USD 24 HKD 190 03/18/09 —<br />
USD 41 HKD 318 03/18/09 —<br />
USD 436 JPY 40,000 03/18/09 6<br />
USD 545 JPY 50,000 03/18/09 8<br />
USD 562 JPY 50,000 03/18/09 (9)<br />
USD 908 JPY 82,141 03/18/09 (1)<br />
USD 909 JPY 82,141 03/18/09 (1)<br />
USD 909 JPY 82,141 03/18/09 (1)<br />
USD 911 JPY 82,141 03/18/09 (3)<br />
USD 2,172 JPY 201,000 03/18/09 49<br />
USD 2,179 JPY 201,000 03/18/09 41<br />
USD 2,179 JPY 201,000 03/18/09 41<br />
USD 2,179 JPY 201,000 03/18/09 41<br />
USD 2,182 JPY 201,000 03/18/09 39<br />
USD 166 NOK 1,162 01/02/09 —<br />
USD 72 NOK 506 03/18/09 (1)<br />
USD 72 NOK 506 03/18/09 (1)<br />
USD 73 NOK 506 03/18/09 (1)<br />
USD 73 NOK 506 03/18/09 (1)<br />
USD 786 NZD 1,434 03/18/09 45<br />
USD 786 NZD 1,434 03/18/09 45<br />
USD 787 NZD 1,434 03/18/09 44<br />
USD 787 NZD 1,434 03/18/09 44<br />
USD 92 SEK 713 01/07/09 (2)<br />
USD 2 SGD 3 01/05/09 —<br />
USD 22 SGD 32 03/18/09 1<br />
USD 22 SGD 32 03/18/09 —<br />
USD 22 SGD 32 03/18/09 —<br />
USD 22 SGD 32 03/18/09 —<br />
AUD 31 USD 22 01/06/09 —<br />
AUD 7 USD 5 03/18/09 —<br />
AUD 7 USD 5 03/18/09 —<br />
AUD 7 USD 5 03/18/09 —<br />
AUD 7 USD 5 03/18/09 —<br />
AUD 171 USD 117 03/18/09 (1)<br />
CAD — USD — 01/02/09 —<br />
CHF 299 USD 283 03/18/09 2<br />
CHF 832 USD 711 03/18/09 (70)<br />
CHF 832 USD 711 03/18/09 (70)<br />
DKK 373 USD 71 01/06/09 1<br />
DKK 78 USD 15 03/18/09 —<br />
DKK 171 USD 31 03/18/09 (1)<br />
EUR 441 USD 622 01/05/09 9<br />
EUR 216 USD 305 01/06/09 5<br />
EUR 41 USD 57 03/18/09 —<br />
EUR 100 USD 137 03/18/09 (2)<br />
See accompanying notes which are an integral part of the financial statements.<br />
48 Non-U.S. Fund
Russell Investment Funds<br />
Non-U.S. Fund<br />
Schedule of Investments, continued — December 31, 2008<br />
Amounts in thousands<br />
Foreign Currency Exchange Contracts<br />
Amount<br />
Sold<br />
Amount<br />
Bought<br />
Settlement<br />
Date<br />
Unrealized<br />
Appreciation<br />
(Depreciation)<br />
$<br />
EUR 200 USD 285 03/18/09 8<br />
EUR 203 USD 285 03/18/09 3<br />
EUR 342 USD 463 03/18/09 (11)<br />
EUR 342 USD 464 03/18/09 (11)<br />
EUR 342 USD 463 03/18/09 (12)<br />
EUR 342 USD 463 03/18/09 (12)<br />
EUR 350 USD 445 03/18/09 (40)<br />
EUR 650 USD 840 03/18/09 (61)<br />
EUR 700 USD 955 03/18/09 (15)<br />
EUR 1,400 USD 1,817 03/18/09 (123)<br />
EUR 1,809 USD 2,542 03/18/09 34<br />
EUR 2,000 USD 2,889 03/18/09 116<br />
GBP 94 USD 138 03/18/09 3<br />
GBP 300 USD 457 03/18/09 27<br />
GBP 300 USD 460 03/18/09 29<br />
GBP 400 USD 590 03/18/09 15<br />
HKD 92 USD 12 01/02/09 —<br />
HKD 117 USD 15 01/02/09 —<br />
HKD 147 USD 19 01/05/09 —<br />
HKD 140 USD 18 03/18/09 —<br />
JPY 3,846 USD 42 03/18/09 —<br />
JPY 20,000 USD 224 03/18/09 3<br />
JPY 26,273 USD 290 03/18/09 —<br />
JPY 60,000 USD 663 03/18/09 —<br />
JPY 70,000 USD 759 03/18/09 (15)<br />
JPY 70,300 USD 775 03/18/09 (2)<br />
JPY 105,911 USD 1,169 03/18/09 (2)<br />
JPY 150,000 USD 1,683 03/18/09 26<br />
NOK 1,012 USD 146 03/18/09 2<br />
NOK 1,012 USD 146 03/18/09 2<br />
NZD 56 USD 32 03/18/09 —<br />
SEK 708 USD 89 03/18/09 (1)<br />
SEK 708 USD 89 03/18/09 (1)<br />
SEK 713 USD 92 03/18/09 2<br />
SEK 2,547 USD 316 03/18/09 (6)<br />
SEK 2,547 USD 316 03/18/09 (6)<br />
SEK 2,547 USD 316 03/18/09 (6)<br />
SEK 2,547 USD 317 03/18/09 (5)<br />
SGD 3 USD 2 03/18/09 —<br />
SGD 6 USD 4 03/18/09 —<br />
SGD 11 USD 7 03/18/09 —<br />
Total Unrealized Appreciation (Depreciation) on Open<br />
Foreign Currency Exchange Contracts 1,604<br />
See accompanying notes which are an integral part of the financial statements.<br />
Non-U.S. Fund 49
Russell Investment Funds<br />
Non-U.S. Fund<br />
Schedule of Investments, continued — December 31, 2008<br />
Amounts in thousands (except share amounts)<br />
Industry Diversification<br />
(Unaudited)<br />
%of<br />
Net<br />
Assets<br />
Market<br />
Value<br />
$<br />
Auto and Transportation 3.2 8,212<br />
Consumer Discretionary 9.1 23,405<br />
Consumer Staples 12.3 31,514<br />
Financial Services 24.4 62,517<br />
Health Care 9.5 24,280<br />
Integrated Oils 5.8 14,794<br />
Materials and Processing 8.8 22,633<br />
Miscellaneous 1.2 3,018<br />
Other Energy 1.0 2,504<br />
Producer Durables 7.1 18,176<br />
Technology 4.9 12,415<br />
Utilities 8.7 22,176<br />
Warrants & Rights — 81<br />
Other Securities 9.5 24,227<br />
Geographic Diversification<br />
(Unaudited)<br />
%of<br />
Net<br />
Assets<br />
Market<br />
Value<br />
$<br />
Africa 0.4 1,058<br />
Asia 5.0 12,743<br />
Europe 39.5 101,178<br />
Japan 19.1 48,766<br />
Latin America 1.1 2,913<br />
Middle East 0.5 1,235<br />
Other Regions 12.1 31,074<br />
United Kingdom 18.3 46,758<br />
Other Securities 9.5 24,227<br />
Total Investments 105.5 269,952<br />
Other Assets and Liabilities, Net (5.5) (14,202)<br />
Net Assets 100.0 255,750<br />
Total Investments 105.5 269,952<br />
Other Assets and Liabilities, Net (5.5) (14,202)<br />
Net Assets 100.0 255,750<br />
See accompanying notes which are an integral part of the financial statements.<br />
50 Non-U.S. Fund
Russell Investment Funds<br />
Non-U.S. Fund<br />
Presentation of Portfolio Holdings — December 31, 2008<br />
Catagories<br />
%ofNet<br />
Assets<br />
Australia 1.8<br />
Austria 0.3<br />
Belgium 0.2<br />
Bermuda 0.3<br />
Brazil 0.4<br />
Canada 1.5<br />
Cayman Islands 0.1<br />
China 0.2<br />
Czech Republic 0.2<br />
Denmark 0.3<br />
Finland 0.8<br />
France 12.3<br />
Germany 7.3<br />
Hong Kong 0.7<br />
India 0.2<br />
Indonesia —*<br />
Israel 0.5<br />
Italy 1.7<br />
Japan 19.1<br />
Luxembourg —*<br />
Malaysia 0.1<br />
Mauritius —*<br />
Mexico 0.3<br />
Netherlands 3.8<br />
Netherlands Antilles —*<br />
Norway 0.2<br />
Portugal 0.2<br />
Singapore 0.7<br />
South Africa 0.4<br />
South Korea 0.5<br />
Spain 1.2<br />
Sweden 1.3<br />
Switzerland 8.9<br />
Taiwan 0.6<br />
Thailand 0.1<br />
United Kingdom 18.3<br />
United States 1.2<br />
Preferred Stocks 0.5<br />
Warrants & Rights —*<br />
Short-Term Investments 9.5<br />
Other Securities 9.8<br />
Total Investments 105.5<br />
Other Assets and Liabilities, Net (5.5)<br />
100.0<br />
Futures Contracts 0.2<br />
Foreign Currency Exchange Contracts 0.6<br />
* Less than .05% of net assets.<br />
See accompanying notes which are an integral part of the financial statements.<br />
Non-U.S. Fund 51
Russell Investment Funds<br />
Core Bond Fund<br />
Portfolio Management Discussion and Analysis — December 31, 2008 (Unaudited)<br />
Growth of a $10,000 Investment<br />
$18,000<br />
Core Bond Fund<br />
Barclays Capital U.S. Aggregate Bond Index**<br />
$16,000<br />
$14,000<br />
$12,000<br />
$10,000<br />
$8,000<br />
*<br />
1999<br />
2000<br />
2001<br />
2002 2003 2004<br />
Yearly periods ended December 31<br />
2005<br />
2006<br />
2007<br />
2008<br />
Core Bond Fund<br />
Total<br />
Return<br />
1 Year (3.87)%<br />
5 Years 2.68%§<br />
10 Years 4.47%§<br />
Barclays Capital U.S. Aggregate Bond Index **<br />
Total<br />
Return<br />
1 Year 5.24%<br />
5 Years 4.65%§<br />
10 Years 5.63%§<br />
* Assumes initial investment on January 1, 1999.<br />
** On October 31, 2008, Barclays Capital, which acquired the Lehman family of indexes in September 2008, announced that it would be re-branding Lehman<br />
indexes under the Barclays Capital name; the underlying index structures are to remain unchanged. As a result, the Lehman Brothers Aggregate Bond Index has<br />
been renamed the Barclays Capital U.S. Aggregate Bond Index.<br />
Barclays Capital U.S. Aggregate Bond Index is composed of securities from Barclays Capital U.S. Government/Corporate Bond Index, Mortgage-Backed<br />
Securities Index, and the Asset-Backed Securities Index. Total return comprises price appreciation/depreciation and income as a percentage of the original<br />
investment. Indexes are rebalanced monthly by market capitalization.<br />
§ <strong>Annual</strong>ized.<br />
The performance shown in this section does not reflect any Insurance Company Separate Account or Policy Charges. Performance is historical and assumes<br />
reinvestment of all dividends and capital gains. Investment return and principal value will fluctuate so that an investor’s shares, when redeemed, may be worth more or<br />
less than when purchased. Past performance is not indicative of future results.<br />
52 Core Bond Fund
Russell Investment Funds<br />
Core Bond Fund<br />
Portfolio Management Discussion and Analysis — December 31, 2008 (Unaudited)<br />
The Core Bond Fund (the “Fund”) allocates most of its assets<br />
among multiple money managers. Russell Investment<br />
Management Company (“RIMCo”), as the Fund’s advisor, may<br />
change the allocation of the Fund’s assets among money<br />
managers at any time. An exemptive order from the Securities<br />
and Exchange Commission (SEC) permits RIMCo to engage or<br />
terminate a money manager at any time, subject to the approval<br />
by the Fund’s Board without a shareholder vote. Pursuant to the<br />
terms of the exemptive order, the Fund is required to notify its<br />
shareholders within 60 days of when a money manager begins<br />
providing services. The Fund currently has three money<br />
managers.<br />
What is the Fund’s investment objective?<br />
The Fund seeks to provide current income, and as a secondary<br />
objective, capital appreciation.<br />
How did the Fund perform relative to its benchmark for<br />
the fiscal year ended December 31, 2008?<br />
For the fiscal year ended December 31, 2008, the Core Bond<br />
Fund lost 3.87%. This compared to its benchmark the Barclays<br />
Capital U.S. Aggregate Bond Index, which gained 5.24% during<br />
the same period. The Fund’s performance includes operating<br />
expenses, whereas Index returns are unmanaged and do not<br />
include expenses of any kind.<br />
For the year ended December 31, 2008, the Lipper ® BBB<br />
Rated Corp Debt Funds (VIP) Average lost 4.86%. This result<br />
serves as a peer comparison and is expressed net of operating<br />
expenses.<br />
How did the market conditions described in the Market<br />
Summary report affect the Fund’s performance?<br />
Investors’ departure from investments with more risk to the<br />
relative safety of U.S. Treasuries and the subsequent re-pricing<br />
of risk (i.e., the market demanding increased compensation for<br />
assuming a given level of risk) impacted nearly all non-Treasury<br />
fixed income investments. As a result, non-Treasury<br />
investments posted lower returns than the benchmark. The<br />
Fund’s money managers typically invest in non-Treasury<br />
sectors. As a result, the Fund underperformed its benchmark.<br />
However, the managers’ sector allocation and security selection<br />
decisions resulted in the Fund outperforming its peers as<br />
measured by the Lipper ® BBB Rated Corp Debt Funds (VIP)<br />
Average.<br />
The decrease in interest rates across the yield curve had little<br />
impact on Fund performance as the Fund’s money managers<br />
implemented offsetting duration strategies. Several managers<br />
anticipated the decline in interest rates and increased<br />
sensitivity to interest rates (also called increased duration)<br />
which had a positive impact on their returns. Other managers<br />
decreased duration exposure expecting that interest rates would<br />
rise in response to the fact that inflation had been a concern<br />
during part of the year stemming from exceptionally high oil<br />
prices. This positioning detracted from their performance. In<br />
general, as interest rates decline bond prices increase and vice<br />
versa. The benefits of the long duration positioning by some<br />
managers were offset by the negative effects of the short<br />
duration positioning by other managers.<br />
Finally, as the Federal Reserve decreased the federal funds<br />
target rate, short-term yields declined relative to yields at the<br />
intermediate portion and long end of the yield curve, resulting<br />
in a relative shift in yields otherwise known as yield curve<br />
“steepening.” This yield curve movement benefited the Fund as<br />
several of the Fund’s money managers anticipated the change<br />
and varied the maturity of their securities accordingly.<br />
How did the investment strategies and techniques<br />
employed by the Fund and its money managers affect<br />
its performance?<br />
By far, the largest affect on the Fund’s underperformance<br />
relative to benchmark was from the re-pricing of risk (i.e., the<br />
market demanding increased compensation for assuming a<br />
given level of risk), the fundamental concern regarding the<br />
consumer’s ability to make mortgage payments, and the<br />
negative impact that market and credit issues had on virtually<br />
all non-Treasury segments of the fixed income markets. The<br />
Fund had a material overweight to mortgage-backed securities.<br />
This contributed significantly to the Fund’s benchmark-relative<br />
underperformance. An overweight to and security selection in<br />
consumer-related asset-backed securities, and exposure to<br />
investment grade and high yield corporate securities that were<br />
hard hit by the weakening economic environment, also<br />
detracted from Fund performance.<br />
Interest rates across maturities on the yield curve decreased<br />
and the curve “steepened” over the calendar year. Several of<br />
the Fund’s money managers, most notably Pacific Investment<br />
Management Company LLC (“PIMCO”), and to a lesser extent<br />
Goldman Sachs Asset Management, L.P., anticipated the<br />
change in interest rates and positioned their portfolios to benefit<br />
from these changes.<br />
All of the Fund’s money managers underperformed in this<br />
historically challenging environment. Goldman underperformed<br />
by the largest amount. Goldman’s underperformance was driven<br />
by mortgage-related exposure, but this was partially mitigated<br />
by its long duration positioning. PIMCO had the least amount of<br />
underperformance. Though PIMCO’s performance suffered due<br />
to security selection within investment grade corporate bonds<br />
(notably financials) and mortgage exposure, its yield curve<br />
positioning provided a degree of downside protection.<br />
The managers who were in the Fund for only a part of the year<br />
also underperformed. Bear Stearns Asset Management Inc. was<br />
replaced by Metropolitan West Asset Management, LLC in<br />
March 2008. Bear Stearns’ underperformed given their<br />
underweight to Treasuries and overweight to mortgage-backed<br />
and high yield securities. Metropolitan West underperformed<br />
largely due to their overweight to and security selection within<br />
mortgage-backed securities.<br />
Core Bond Fund 53
Russell Investment Funds<br />
Core Bond Fund<br />
Portfolio Management Discussion and Analysis — December 31, 2008 (Unaudited)<br />
The Fund’s performance shown throughout this report was<br />
based on valuations calculated in accordance with Generally<br />
Accepted Accounting Principles (GAAP) and in accordance<br />
with a newly effective accounting statement (SFAS 157),<br />
reflects the December 31, 2008 market value of the pooled<br />
investment vehicle in which the Fund invested its cash<br />
collateral received in securities lending transactions. This<br />
market value is lower than the vehicle’s amortized cost per unit.<br />
This had a negative impact on the Fund’s benchmark relative<br />
performance.<br />
54 Core Bond Fund
Russell Investment Funds<br />
Core Bond Fund<br />
Portfolio Management Discussion — December 31, 2008 (Unaudited)<br />
Describe any changes to the Fund’s structure or the<br />
money manager line-up.<br />
In March 2008, Bear Stearns Asset Management Inc. was<br />
replaced by Metropolitan West Asset Management, LLC.<br />
Money Managers as of<br />
December 31, 2008<br />
Goldman Sachs Asset Management, L.P.<br />
Metropolitan West Asset Management, LLC<br />
Pacific Investment Management Company LLC<br />
Styles<br />
Fully Discretionary<br />
Sector Rotation<br />
Fully Discretionary<br />
The views expressed in this report reflect those of the portfolio<br />
managers only through the end of the period covered by the report.<br />
These views do not necessarily represent the views of RIMCo, or any<br />
other person in RIMCo or any other affiliated organization. These views<br />
are subject to change at any time based upon market conditions or<br />
other events, and RIMCo disclaims any responsibility to update the<br />
views contained herein. These views should not be relied on as<br />
investment advice and, because investment decisions for Russell<br />
Investment Funds (RIF) are based on numerous factors, should not be<br />
relied on as an indication of investment decisions of any RIF Fund.<br />
Core Bond Fund 55
Russell Investment Funds<br />
Core Bond Fund<br />
Shareholder Expense Example — December 31, 2008 (Unaudited)<br />
Fund Expenses<br />
The following disclosure provides important information<br />
regarding each Fund’s Expense Example, which appears<br />
on each Fund’s individual page in this <strong>Annual</strong> Report.<br />
Please refer to this information when reviewing the<br />
Expense Example for a Fund.<br />
Example<br />
As a shareholder of the Fund, you incur two types of costs: (1)<br />
transaction costs, and (2) ongoing costs, including management<br />
fees and other Fund expenses. The Example is intended to help<br />
you understand your ongoing costs (in dollars) of investing in<br />
the Fund and to compare these costs with the ongoing costs of<br />
investing in other mutual funds. The Example is based on an<br />
investment of $1,000 invested at the beginning of the period<br />
and held for the entire period indicated, which for this Fund is<br />
from July 1, 2008 to December 31, 2008.<br />
Actual Expenses<br />
The information in the table under the heading “Actual<br />
Performance” provides information about actual account values<br />
and actual expenses. You may use the information in this<br />
column, together with the amount you invested, to estimate the<br />
expenses that you paid over the period. Simply divide your<br />
account value by $1,000 (for example, an $8,600 account value<br />
divided by $1,000 = 8.6), then multiply the result by the<br />
number in the first column in the row entitled “Expenses Paid<br />
During Period” to estimate the expenses you paid on your<br />
account during this period.<br />
Hypothetical Example for Comparison Purposes<br />
The information in the table under the heading “Hypothetical<br />
Performance (5% return before expenses)” provides information<br />
about hypothetical account values and hypothetical expenses<br />
based on the Fund’s actual expense ratio and an assumed rate<br />
of return of 5% per year before expenses, which is not the<br />
Fund’s actual return. The hypothetical account values and<br />
expenses may not be used to estimate the actual ending account<br />
balance or expenses you paid for the period. You may use this<br />
information to compare the ongoing costs of investing in the<br />
Fund and other funds. To do so, compare this 5% hypothetical<br />
example with the 5% hypothetical examples that appear in the<br />
shareholder reports of other funds.<br />
Please note that the expenses shown in the table are meant to<br />
highlight your ongoing costs only and do not reflect any<br />
transactional costs. Therefore, the information under the<br />
heading “Hypothetical Performance (5% return before<br />
expenses)” is useful in comparing ongoing costs only, and will<br />
not help you determine the relative total costs of owning<br />
different funds. In addition, if these transactional costs were<br />
included, your costs would have been higher. The fee and<br />
expenses shown in this section do not reflect any Insurance<br />
Company Separate Account or Policy Charges.<br />
Actual<br />
Performance<br />
Hypothetical<br />
Performance<br />
(5% return<br />
before expenses)<br />
Beginning Account Value<br />
July 1, 2008 $ 1,000.00 $ 1,000.00<br />
Ending Account Value<br />
December 31, 2008 $ 970.84 $ 1,021.62<br />
Expenses Paid During Period* $ 3.47 $ 3.56<br />
* Expenses are equal to the Fund’s annualized expense ratio of 0.70%<br />
(representing the one-half year period annualized), multiplied by the average<br />
account value over the period, multiplied by 184/366 (to reflect the one-half<br />
year period). Reflects amounts waived and/or reimbursed. Without the waiver<br />
and/or reimbursement, expenses would have been higher.<br />
56 Core Bond Fund
Russell Investment Funds<br />
Core Bond Fund<br />
Schedule of Investments — December 31, 2008<br />
Amounts in thousands (except share amounts)<br />
Principal<br />
Amount ($)<br />
or Shares<br />
Market<br />
Value<br />
$<br />
Long-Term Investments - 111.7%<br />
Asset-Backed Securities - 4.7%<br />
Access Group, Inc. (Ê)<br />
Series 2008-1 Class A<br />
4.835% due 10/27/25 900 828<br />
Accredited Mortgage Loan Trust (Ê)<br />
Series 2004-2 Class A2<br />
0.771% due 07/25/34 37 14<br />
ACE Securities Corp. (Ê)<br />
Series 2003-OP1 Class M2<br />
1.971% due 12/25/33 35 26<br />
Series 2005-SD3 Class A<br />
0.871% due 08/25/45 175 141<br />
Aegis Asset Backed Securities Trust (Ê)<br />
Series 2003-3 Class M2<br />
2.946% due 01/25/34 110 51<br />
American Express Credit Account<br />
Master Trust (Ê)(Þ)<br />
Series 2004-C Class C<br />
1.695% due 02/15/12 32 28<br />
Ameriquest Mortgage Securities, Inc. (Ê)<br />
Series 2002-D Class M1<br />
4.221% due 02/25/33 90 48<br />
Series 2004-R8 Class A5<br />
0.841% due 09/25/34 12 12<br />
Series 2004-R10 Class A5<br />
0.861% due 11/25/34 — 1<br />
ARES CLO Funds (Ê)(Þ)<br />
Series 2005-10A Class A3<br />
2.088% due 09/18/17 520 393<br />
Bank of America Credit Card Trust (Ê)<br />
Series 2008-A1 Class A1<br />
1.775% due 04/15/13 200 182<br />
Bayview Financial Acquisition Trust<br />
Series 2006-A Class 1A3<br />
5.865% due 02/28/41 190 101<br />
Centex Home Equity (Ê)<br />
Series 2006-A Class AV4<br />
0.721% due 06/25/36 700 312<br />
CIT Mortgage Loan Trust (Ê)(Å)<br />
Series 2007-1 Class 2A1<br />
1.471% due 10/25/37 328 267<br />
Series 2007-1 Class 2A2<br />
1.721% due 10/25/37 130 49<br />
Series 2007-1 Class 2A3<br />
1.921% due 10/25/37 180 61<br />
Citigroup Mortgage Loan Trust, Inc. (Ê)<br />
Series 2006-WFH Class A2<br />
0.571% due 10/25/36 827 758<br />
Series 2007-AMC Class A2A<br />
0.531% due 05/25/37 459 368<br />
Countrywide Asset-Backed Certificates<br />
Series 2004-AB2 Class M3 (Ê)<br />
1.071% due 05/25/36 95 28<br />
Series 2004-BC1 Class M1 (Ê)<br />
0.971% due 02/25/34 95 58<br />
Principal<br />
Amount ($)<br />
or Shares<br />
Market<br />
Value<br />
$<br />
Series 2006-11 Class 1AF4<br />
6.300% due 09/25/46 170 60<br />
Countrywide Home Equity Loan Trust (Ê)<br />
Series 2006-HW Class 2A1B<br />
1.345% due 11/15/36 528 256<br />
First Franklin Mortgage Loan Asset Backed<br />
Certificates (Ê)<br />
Series 2006-FF1 Class A3<br />
0.521% due 11/25/36 118 107<br />
Series 2007-FF1 Class A2B<br />
0.561% due 01/25/38 1,000 732<br />
GMAC Mortgage Corp. Loan Trust<br />
Series 2007-HE3 Class 1A1<br />
7.000% due 09/25/37 76 25<br />
Series 2007-HE3 Class 2A1<br />
7.000% due 09/25/37 80 22<br />
GSAA Trust (Ê)<br />
Series 2006-2 Class 2A3<br />
0.741% due 12/25/35 320 272<br />
Series 2006-4 Class 1A2<br />
5.993% due 03/25/36 215 51<br />
Series 2006-4 Class 3A1<br />
6.103% due 03/25/36 1,476 683<br />
GSAMP Trust (Ê)<br />
Series 2003-HE2 Class M1<br />
1.121% due 08/25/33 72 51<br />
Series 2004-SEA Class A2A<br />
0.761% due 03/25/34 28 27<br />
HFC Home Equity Loan Asset Backed<br />
Certificates (Ê)<br />
Series 2005-1 Class A<br />
0.798% due 01/20/34 200 137<br />
Series 2007-1 Class AS<br />
0.708% due 03/20/36 814 462<br />
Series 2007-3 Class APT<br />
1.708% due 11/20/36 358 209<br />
HSI Asset Securitization Corp. Trust (Ê)<br />
Series 2006-HE2 Class 2A1<br />
0.521% due 12/25/36 39 34<br />
Indymac Residential Asset Backed<br />
Trust (Ê)<br />
Series 2006-H2 Class A<br />
0.621% due 06/28/36 342 174<br />
Lehman XS Trust (Ê)(Ø)<br />
Series 2005-1 Class 2A2<br />
1.971% due 07/25/35 81 62<br />
Series 2005-5N Class 3A1A<br />
0.771% due 11/25/35 439 204<br />
Series 2005-7N Class 1A1A<br />
0.741% due 12/25/35 483 222<br />
Series 2006-2N Class 1A2<br />
0.811% due 02/25/46 211 46<br />
Series 2006-16N Class A1A<br />
0.551% due 11/25/46 116 107<br />
Series 2006-16N Class A4A<br />
0.661% due 11/25/46 751 322<br />
Core Bond Fund 57
Russell Investment Funds<br />
Core Bond Fund<br />
Schedule of Investments, continued — December 31, 2008<br />
Amounts in thousands (except share amounts)<br />
Principal<br />
Amount ($)<br />
or Shares<br />
Market<br />
Value<br />
$<br />
Long Beach Mortgage Loan Trust (Ê)<br />
Series 2004-4 Class 1A1<br />
0.751% due 10/25/34 5 2<br />
Series 2006-9 Class 2A1<br />
0.531% due 10/25/36 247 234<br />
Mastr Asset Backed Securities Trust (Ê)<br />
Series 2003-WMC Class M2<br />
2.946% due 08/25/33 57 20<br />
Series 2006-WMC Class A4<br />
0.631% due 08/25/36 850 244<br />
Morgan Stanley ABS Capital I (Ê)<br />
Series 2003-NC8 Class M3<br />
3.621% due 09/25/33 32 4<br />
Series 2006-HE7 Class A2A<br />
0.521% due 09/25/36 215 203<br />
New Century Home Equity Loan Trust (Ê)<br />
Series 2004-4 Class M2<br />
1.001% due 02/25/35 215 144<br />
Option One Mortgage Loan Trust (Ê)<br />
Series 2003-2 Class M2<br />
3.021% due 04/25/33 40 16<br />
Series 2003-3 Class M3<br />
3.471% due 06/25/33 29 4<br />
Series 2003-4 Class M2<br />
2.121% due 07/25/33 27 12<br />
Park Place Securities, Inc. (Ê)<br />
Series 2005-WCW Class M1<br />
0.921% due 09/25/35 210 114<br />
Popular ABS Mortgage Pass-Through Trust<br />
Series 2005-6 Class A3<br />
5.680% due 01/25/36 227 206<br />
Renaissance Home Equity Loan Trust<br />
Series 2005-1 Class M1<br />
5.357% due 05/25/35 67 40<br />
Series 2005-2 Class AF4<br />
4.934% due 08/25/35 85 57<br />
Series 2006-1 Class AF6<br />
5.746% due 05/25/36 175 134<br />
Residential Asset Mortgage Products, Inc.<br />
Series 2003-RS1 Class AI6A<br />
5.980% due 12/25/33 161 89<br />
Series 2006-RZ4 Class A1A (Ê)<br />
0.551% due 10/25/36 288 267<br />
Residential Asset Securities Corp.<br />
Series 2003-KS2 Class MI1<br />
4.800% due 04/25/33 258 181<br />
Series 2003-KS2 Class MI3<br />
6.100% due 04/25/33 64 22<br />
Series 2003-KS4 Class AIIB (Ê)<br />
1.051% due 06/25/33 43 25<br />
Series 2006-KS9 Class AI1 (Ê)<br />
0.541% due 11/25/36 58 56<br />
Series 2007-KS2 Class AI1 (Ê)<br />
0.541% due 02/25/37 233 204<br />
SBI Heloc Trust (Ê)(Þ)<br />
Series 2006-1A Class 1A2A<br />
0.641% due 08/25/36 65 61<br />
Principal<br />
Amount ($)<br />
or Shares<br />
Market<br />
Value<br />
$<br />
SLM Student Loan Trust (Ê)<br />
Series 2007-3 Class A1<br />
3.525% due 10/27/14 341 330<br />
Series 2008-2 Class A1<br />
3.835% due 01/26/15 93 92<br />
Series 2008-7 Class A2<br />
4.035% due 10/25/17 2,800 2,629<br />
Small Business Administration<br />
Series 2000-P10 Class 1<br />
7.449% due 08/10/10 5 5<br />
Series 2005-20G Class 1<br />
4.750% due 07/01/25 794 799<br />
Soundview Home Equity Loan Trust<br />
Series 2006-WF1 Class A2<br />
5.645% due 10/25/36 290 281<br />
Structured Asset Investment Loan Trust (Ê)<br />
Series 2005-3 Class M2<br />
0.911% due 04/25/35 120 40<br />
Structured Asset Securities Corp. (Ê)<br />
Series 2006-BC3 Class A2<br />
0.521% due 10/25/36 92 85<br />
Series 2007-BC3 Class 2A2<br />
0.611% due 08/25/09 920 479<br />
15,070<br />
Corporate Bonds and Notes - 18.9%<br />
Ace Capital Trust II<br />
9.700% due 04/01/30 175 134<br />
Allied Waste North America, Inc.<br />
Series B<br />
7.125% due 05/15/16 90 82<br />
Allstate Life Global Funding Trusts<br />
5.375% due 04/30/13 200 197<br />
Altria Group, Inc.<br />
9.700% due 11/10/18 275 297<br />
American Electric Power Co., Inc. (Ñ)<br />
Series C<br />
5.375% due 03/15/10 35 35<br />
American Express Bank FSB<br />
Series BKNT<br />
5.500% due 04/16/13 300 284<br />
6.000% due 09/13/17 400 375<br />
American Express Centurion Bank<br />
Series BKN1<br />
6.000% due 09/13/17 400 375<br />
American Express Co.<br />
7.000% due 03/19/18 200 202<br />
American General Finance Corp.<br />
4.875% due 05/15/10 225 134<br />
6.900% due 12/15/17 400 173<br />
American International Group, Inc.<br />
4.700% due 10/01/10 20 18<br />
5.850% due 01/16/18 900 603<br />
Americo Life, Inc. (Å)<br />
7.875% due 05/01/13 75 71<br />
Amgen, Inc.<br />
6.900% due 06/01/38 1,000 1,142<br />
58 Core Bond Fund
Russell Investment Funds<br />
Core Bond Fund<br />
Schedule of Investments, continued — December 31, 2008<br />
Amounts in thousands (except share amounts)<br />
Principal<br />
Amount ($)<br />
or Shares<br />
Market<br />
Value<br />
$<br />
ANZ Capital Trust (ƒ)(Þ)<br />
4.484% due 12/31/49 225 174<br />
Appalachian Power Co.<br />
Series O<br />
5.650% due 08/15/12 65 62<br />
ArcelorMittal USA (Ñ)<br />
6.500% due 04/15/14 210 149<br />
Arizona Public Service Co.<br />
5.800% due 06/30/14 100 84<br />
6.250% due 08/01/16 150 121<br />
AT&T, Inc.<br />
4.950% due 01/15/13 200 201<br />
5.500% due 02/01/18 200 202<br />
6.300% due 01/15/38 975 1,031<br />
6.400% due 05/15/38 400 428<br />
Bank of America Corp.<br />
5.625% due 10/14/16 115 113<br />
6.000% due 09/01/17 335 340<br />
5.750% due 12/01/17 490 489<br />
5.650% due 05/01/18 175 176<br />
8.000% due 12/29/49 (ƒ) 2,500 1,798<br />
8.125% due 12/29/49 (ƒ) 375 280<br />
Bank of America NA (Ê)<br />
Series BKNT<br />
2.276% due 06/15/16 200 134<br />
BankAmerica Capital III (Ê)<br />
Series*<br />
5.323% due 01/15/27 350 186<br />
Bear Stearns Cos. LLC (The)<br />
4.903% due 07/19/10 (Ê) 600 581<br />
6.950% due 08/10/12 600 623<br />
7.250% due 02/01/18 645 707<br />
Bellsouth Telecommunications, Inc.<br />
7.000% due 12/01/95 245 192<br />
BNP Paribas Capital Trust (ƒ)(Ñ)(Å)<br />
9.003% due 12/29/49 450 276<br />
Boardwalk Pipelines, LP<br />
5.875% due 11/15/16 225 188<br />
Burlington Northern Santa Fe Corp.<br />
6.875% due 12/01/27 25 25<br />
6.750% due 03/15/29 10 10<br />
Calpine Construction Finance Co., LP<br />
and CCFC Finance Corp. (Ê)(Þ)<br />
11.603% due 08/26/11 300 274<br />
Caterpillar Financial Services Corp.<br />
4.850% due 12/07/12 100 95<br />
Catlin Insurance Co., Ltd. (ƒ)(Å)<br />
7.249% due 12/31/49 100 40<br />
Cellco Partnership (Þ)<br />
8.500% due 11/15/18 225 264<br />
CenterPoint Energy Houston Electric<br />
LLC (Ñ)<br />
Series J2<br />
5.700% due 03/15/13 110 105<br />
CenterPoint Energy Resources Corp.<br />
6.125% due 11/01/17 50 42<br />
Series B<br />
7.875% due 04/01/13 165 153<br />
Principal<br />
Amount ($)<br />
or Shares<br />
Market<br />
Value<br />
$<br />
Chubb Corp.<br />
6.375% due 03/29/67 175 109<br />
Series 1<br />
6.500% due 05/15/38 50 48<br />
Citigroup Capital XXI<br />
8.300% due 12/21/57 250 193<br />
Citigroup, Inc.<br />
5.500% due 08/27/12 200 194<br />
5.500% due 04/11/13 700 682<br />
5.850% due 07/02/13 425 410<br />
6.500% due 08/19/13 565 570<br />
4.700% due 05/29/15 50 43<br />
5.850% due 08/02/16 (Ñ) 55 53<br />
6.000% due 08/15/17 400 398<br />
6.125% due 11/21/17 405 409<br />
6.125% due 08/25/36 300 269<br />
6.875% due 03/05/38 325 370<br />
8.400% due 04/29/49 (ƒ) 750 495<br />
CNA Financial Corp.<br />
6.500% due 08/15/16 125 89<br />
Columbus Southern Power Co.<br />
Series C<br />
5.500% due 03/01/13 10 10<br />
Comcast Cable Communications<br />
Holdings, Inc. (Ñ)<br />
9.455% due 11/15/22 125 140<br />
Comcast Cable Holdings LLC<br />
9.800% due 02/01/12 180 190<br />
7.875% due 08/01/13 245 252<br />
Comcast Corp. (Ñ)<br />
5.500% due 03/15/11 100 98<br />
Comcast Holdings Corp.<br />
10.625% due 07/15/12 125 133<br />
Commonwealth Edison Co.<br />
6.950% due 07/15/18 50 47<br />
5.900% due 03/15/36 75 62<br />
Series 105<br />
5.400% due 12/15/11 125 122<br />
Community Health Systems, Inc. (Ñ)<br />
Series WI<br />
8.875% due 07/15/15 235 216<br />
Continental Airlines, Inc.<br />
Series 071A<br />
5.983% due 04/19/22 150 101<br />
Series 991A<br />
6.545% due 08/02/20 298 238<br />
Countrywide Financial Corp.<br />
Series MTN<br />
5.800% due 06/07/12 100 97<br />
Countrywide Home Loans, Inc.<br />
Series MTNL<br />
4.000% due 03/22/11 290 276<br />
COX Communications, Inc.<br />
4.625% due 01/15/10 350 339<br />
5.875% due 12/01/16 (Þ) 75 67<br />
Credit Suisse USA, Inc.<br />
5.500% due 08/15/13 45 44<br />
4.875% due 01/15/15 (Ñ) 55 50<br />
Core Bond Fund 59
Russell Investment Funds<br />
Core Bond Fund<br />
Schedule of Investments, continued — December 31, 2008<br />
Amounts in thousands (except share amounts)<br />
Principal<br />
Amount ($)<br />
or Shares<br />
Market<br />
Value<br />
$<br />
CSC Holdings, Inc. (Ñ)<br />
Series WI<br />
6.750% due 04/15/12 90 82<br />
CSX Corp.<br />
6.250% due 03/15/18 75 69<br />
DCP Midstream LLC<br />
6.875% due 02/01/11 20 19<br />
Dell, Inc. (Ñ)<br />
4.700% due 04/15/13 400 376<br />
Delta Air Lines, Inc.<br />
Series 00A2<br />
7.570% due 11/18/10 205 172<br />
Series 01A2<br />
7.111% due 09/18/11 400 320<br />
Detroit Edison Co. (The)<br />
6.350% due 10/15/32 50 47<br />
DPL, Inc.<br />
6.875% due 09/01/11 193 190<br />
Echostar DBS Corp. (Ñ)<br />
7.125% due 02/01/16 125 104<br />
El Paso Corp. (Ñ)<br />
8.050% due 10/15/30 200 130<br />
El Paso Natural Gas Co.<br />
7.500% due 11/15/26 100 83<br />
Energy Transfer Partners, LP<br />
5.950% due 02/01/15 325 279<br />
6.700% due 07/01/18 200 169<br />
Enterprise Products Operating LLC<br />
4.950% due 06/01/10 125 120<br />
6.500% due 01/31/19 100 84<br />
8.375% due 08/01/66 100 55<br />
Federal Express Corp.<br />
7.600% due 07/01/97 75 68<br />
Fifth Third Bancorp<br />
8.250% due 03/01/38 1,100 909<br />
FirstEnergy Corp.<br />
Series B<br />
6.450% due 11/15/11 280 265<br />
Series C<br />
7.375% due 11/15/31 125 118<br />
Ford Motor Credit Co. LLC<br />
7.875% due 06/15/10 200 160<br />
Frontier Communications Corp. (Ñ)<br />
9.250% due 05/15/11 125 119<br />
General Electric Capital Corp.<br />
4.573% due 01/20/10 (Ê) 200 191<br />
5.875% due 01/14/38 300 294<br />
6.375% due 11/15/67 (Ñ) 1,900 1,194<br />
Series GMTN (Ñ)<br />
5.500% due 04/28/11 220 225<br />
Series MTNA (Ê)(Ñ)<br />
2.256% due 09/15/14 300 231<br />
General Electric Co.<br />
5.250% due 12/06/17 150 150<br />
Goldman Sachs Group, Inc. (The)<br />
4.500% due 06/15/10 (Ñ) 125 123<br />
4.750% due 07/15/13 (Ñ) 350 315<br />
Principal<br />
Amount ($)<br />
or Shares<br />
Market<br />
Value<br />
$<br />
6.250% due 09/01/17 600 582<br />
6.150% due 04/01/18 150 144<br />
6.750% due 10/01/37 800 649<br />
Series MTNB (Ê)(Ñ)<br />
4.459% due 07/22/15 100 70<br />
GrafTech Finance, Inc.<br />
10.250% due 02/15/12 12 11<br />
HCA, Inc.<br />
9.125% due 11/15/14 (Ñ) 125 116<br />
9.250% due 11/15/16 235 216<br />
HCP, Inc.<br />
5.950% due 09/15/11 300 249<br />
Historic TW, Inc.<br />
8.050% due 01/15/16 195 193<br />
HSBC Finance Corp. (Ê)<br />
2.179% due 03/12/10 300 273<br />
2.638% due 05/10/10 100 90<br />
Idearc, Inc. (Ñ)<br />
8.000% due 11/15/16 125 9<br />
ING Capital Funding Trust III (ƒ)<br />
8.439% due 12/29/49 275 138<br />
Inmarsat Finance PLC<br />
10.375% due 11/15/12 125 111<br />
International Lease Finance Corp. (Ñ)<br />
4.950% due 02/01/11 100 72<br />
International Paper Co.<br />
5.850% due 10/30/12 510 440<br />
Jackson National Life Fund LLC (Ê)<br />
2.981% due 08/06/11 2,800 2,668<br />
Jersey Central Power & Light Co. (Ñ)<br />
5.625% due 05/01/16 90 84<br />
JPMorgan Chase Capital XIII (Ê)<br />
Series M<br />
2.418% due 09/30/34 480 343<br />
JPMorgan Chase & Co.<br />
5.375% due 01/15/14 (Ñ) 170 172<br />
6.000% due 01/15/18 (Ñ) 200 211<br />
6.400% due 05/15/38 323 382<br />
Series 1 (ƒ)<br />
7.900% due 04/29/49 840 699<br />
JPMorgan Chase Bank NA<br />
Series BKNT<br />
5.875% due 06/13/16 70 70<br />
6.000% due 10/01/17 400 403<br />
Kerr-McGee Corp.<br />
6.950% due 07/01/24 125 110<br />
KeyBank NA (Ê)<br />
Series BKNT<br />
4.467% due 06/02/10 300 289<br />
Kinder Morgan Energy Partners, LP<br />
5.950% due 02/15/18 700 597<br />
Kraft Foods, Inc.<br />
6.500% due 08/11/17 100 101<br />
6.125% due 02/01/18 200 196<br />
L-3 Communications Corp.<br />
Series B<br />
6.375% due 10/15/15 125 117<br />
60 Core Bond Fund
Russell Investment Funds<br />
Core Bond Fund<br />
Schedule of Investments, continued — December 31, 2008<br />
Amounts in thousands (except share amounts)<br />
Principal<br />
Amount ($)<br />
or Shares<br />
Market<br />
Value<br />
$<br />
Lehman Brothers Holdings, Inc. (Ø)<br />
2.951% due 05/25/10 (Ê) 200 18<br />
5.625% due 01/24/13 200 19<br />
6.200% due 09/26/14 200 19<br />
Manufacturers & Traders Trust Co.<br />
5.585% due 12/28/20 84 60<br />
Merrill Lynch & Co., Inc.<br />
6.050% due 08/15/12 100 99<br />
5.450% due 02/05/13 200 192<br />
6.400% due 08/28/17 325 326<br />
6.875% due 04/25/18 500 523<br />
MetLife, Inc.<br />
6.125% due 12/01/11 205 202<br />
6.400% due 12/15/36 100 60<br />
Series A<br />
6.817% due 08/15/18 200 190<br />
Metropolitan Life Global<br />
Funding I (Ê)(Þ)<br />
2.189% due 05/17/10 400 359<br />
Midamerican Energy Holdings Co.<br />
5.750% due 04/01/18 125 122<br />
6.125% due 04/01/36 150 139<br />
Mirant Mid Atlantic Trust<br />
Series A<br />
8.625% due 06/30/12 295 268<br />
Mohegan Tribal Gaming Authority (Ñ)<br />
8.000% due 04/01/12 125 76<br />
Morgan Stanley<br />
4.233% due 05/14/10 (Ê) 400 372<br />
4.209% due 03/01/13 (Ê) 600 612<br />
4.953% due 10/18/16 (Ê) 435 299<br />
6.250% due 08/28/17 100 85<br />
5.950% due 12/28/17 125 104<br />
6.625% due 04/01/18 450 395<br />
Series GMTN<br />
5.750% due 08/31/12 125 117<br />
Series MTN (Ê)(Ñ)<br />
4.843% due 01/15/10 300 276<br />
Nationwide Life Global Funding I (Ê)(Þ)<br />
2.439% due 05/19/10 1,900 1,856<br />
Nelnet, Inc.<br />
7.400% due 09/29/36 125 37<br />
Nevada Power Co.<br />
Series L<br />
5.875% due 01/15/15 100 96<br />
New Cingular Wireless Services, Inc.<br />
7.875% due 03/01/11 150 155<br />
News America Holdings, Inc.<br />
7.900% due 12/01/95 90 81<br />
8.250% due 10/17/96 20 19<br />
News America, Inc.<br />
6.650% due 11/15/37 225 223<br />
NGPL Pipeco LLC (Þ)<br />
6.514% due 12/15/12 200 190<br />
Nisource Finance Corp.<br />
7.875% due 11/15/10 125 114<br />
6.400% due 03/15/18 145 90<br />
Principal<br />
Amount ($)<br />
or Shares<br />
Market<br />
Value<br />
$<br />
Norfolk Southern Corp.<br />
7.900% due 05/15/97 415 455<br />
Ohio Power Co. (Ñ)<br />
Series F<br />
5.500% due 02/15/13 20 19<br />
Oncor Electric Delivery Co. (Þ)<br />
6.800% due 09/01/18 550 527<br />
ONEOK Partners, LP<br />
6.650% due 10/01/36 100 77<br />
6.850% due 10/15/37 100 79<br />
Philip Morris International, Inc.<br />
5.650% due 05/16/18 350 347<br />
6.375% due 05/16/38 100 104<br />
Phoenix Life Insurance Co. (Þ)<br />
7.150% due 12/15/34 150 92<br />
PNC Bank NA<br />
Series BKNT<br />
6.875% due 04/01/18 250 266<br />
Progress Energy, Inc.<br />
7.100% due 03/01/11 77 76<br />
5.625% due 01/15/16 40 37<br />
Public Service Co. of New Mexico<br />
7.950% due 05/15/18 260 212<br />
Pulte Homes, Inc.<br />
5.250% due 01/15/14 1,000 715<br />
Qwest Corp.<br />
7.625% due 06/15/15 100 82<br />
RBS Capital Trust III (ƒ)(Ñ)<br />
5.512% due 09/29/49 200 80<br />
Reckson Operating Partnership, LP<br />
5.150% due 01/15/11 92 68<br />
Reinsurance Group of America, Inc.<br />
6.750% due 12/15/65 75 28<br />
Rohm & Haas Co.<br />
6.000% due 09/15/17 100 91<br />
Sabine Pass LNG, LP (Ñ)<br />
7.250% due 11/30/13 275 201<br />
Simon Property Group, LP<br />
5.600% due 09/01/11 200 167<br />
5.300% due 05/30/13 765 572<br />
6.100% due 05/01/16 130 83<br />
6.125% due 05/30/18 (Ñ) 175 118<br />
SLM Corp.<br />
Series MTN<br />
5.400% due 10/25/11 100 76<br />
5.125% due 08/27/12 75 56<br />
8.450% due 06/15/18 100 79<br />
State Street Capital Trust III (ƒ)<br />
8.250% due 12/29/49 200 155<br />
Sun Life Financial Global<br />
Funding, LP (Ê)(Þ)<br />
1.718% due 07/06/10 1,500 1,481<br />
Swiss Re Capital I, LP (ƒ)(Þ)<br />
6.854% due 05/29/49 225 72<br />
Symetra Financial Corp. (Å)<br />
6.125% due 04/01/16 150 123<br />
Core Bond Fund 61
Russell Investment Funds<br />
Core Bond Fund<br />
Schedule of Investments, continued — December 31, 2008<br />
Amounts in thousands (except share amounts)<br />
Principal<br />
Amount ($)<br />
or Shares<br />
Market<br />
Value<br />
$<br />
Target Corp. (Ñ)<br />
5.125% due 01/15/13 400 395<br />
Tennessee Gas Pipeline Co. (Ñ)<br />
7.000% due 10/15/28 50 38<br />
TEPPCO Partners, LP<br />
6.650% due 04/15/18 250 202<br />
Time Warner Cable, Inc.<br />
Series WI<br />
5.400% due 07/02/12 300 280<br />
6.550% due 05/01/37 75 72<br />
Time Warner, Inc.<br />
5.875% due 11/15/16 400 359<br />
Travelers Cos., Inc. (The)<br />
6.250% due 06/15/37 100 96<br />
Union Electric Co.<br />
6.400% due 06/15/17 205 187<br />
Union Pacific Corp.<br />
5.700% due 08/15/18 400 385<br />
United States Steel Corp.<br />
5.650% due 06/01/13 35 26<br />
6.050% due 06/01/17 95 62<br />
6.650% due 06/01/37 40 20<br />
UnitedHealth Group, Inc.<br />
5.250% due 03/15/11 (Ñ) 95 89<br />
4.875% due 02/15/13 (Ñ) 200 187<br />
6.000% due 06/15/17 35 32<br />
Series WI<br />
6.500% due 06/15/37 45 38<br />
Valero Energy Corp.<br />
6.625% due 06/15/37 225 165<br />
Verizon Communications, Inc.<br />
6.400% due 02/15/38 175 186<br />
Wachovia Capital Trust III (ƒ)<br />
5.800% due 03/15/42 125 74<br />
Wachovia Corp.<br />
5.500% due 05/01/13 450 445<br />
5.625% due 10/15/16 100 91<br />
5.750% due 06/15/17 (Ñ) 155 154<br />
5.750% due 02/01/18 (Ñ) 500 501<br />
Wells Fargo & Co.<br />
5.625% due 12/11/17 800 835<br />
Series K (ƒ)(Ñ)<br />
7.980% due 02/28/49 3,585 3,056<br />
Wells Fargo Capital XIII (ƒ)<br />
Series GMTN<br />
7.700% due 12/29/49 150 124<br />
Wells Fargo Capital XV (ƒ)(Ñ)<br />
9.750% due 12/29/49 150 152<br />
Windstream Corp.<br />
Series WI<br />
8.625% due 08/01/16 125 111<br />
XTO Energy, Inc.<br />
6.500% due 12/15/18 325 315<br />
ZFS Finance USA Trust I (Þ)<br />
6.150% due 12/15/65 500 280<br />
60,233<br />
Principal<br />
Amount ($)<br />
or Shares<br />
Market<br />
Value<br />
$<br />
International Debt - 5.3%<br />
America Movil SAB de CV<br />
5.500% due 03/01/14 100 92<br />
ANZ National International, Ltd. (Þ)<br />
6.200% due 07/19/13 600 581<br />
ArcelorMittal<br />
6.125% due 06/01/18 300 205<br />
AstraZeneca PLC<br />
5.900% due 09/15/17 100 106<br />
AXA SA (ƒ)(Þ)<br />
6.463% due 12/14/18 100 44<br />
Ballyrock CDO, Ltd. (Ê)(Å)<br />
Series 2005-3A Class A2<br />
3.765% due 07/25/17 1,000 764<br />
Barclays Bank PLC<br />
5.450% due 09/12/12 1,300 1,316<br />
6.050% due 12/04/17 (Þ) 200 176<br />
Barrick Gold Financeco LLC (Ñ)<br />
6.125% due 09/15/13 270 256<br />
BAT International Finance PLC (Þ)<br />
9.500% due 11/15/18 200 222<br />
Black Diamond CLO, Ltd. (Ê)(Å)<br />
Series 2007-1A Class AD<br />
3.758% due 04/29/19 1,000 700<br />
BNP Paribas (ƒ)<br />
5.186% due 06/29/49 300 170<br />
Callidus Debt Partners Fund, Ltd. (Ê)(Å)<br />
Series 2003-2A Class A<br />
2.649% due 05/15/15 973 779<br />
Canadian Natural Resources, Ltd.<br />
5.150% due 02/01/13 100 93<br />
5.700% due 05/15/17 75 65<br />
6.500% due 02/15/37 100 82<br />
Credit Suisse NY<br />
5.000% due 05/15/13 330 318<br />
6.000% due 02/15/18 450 413<br />
Deutsche Bank AG/London<br />
6.000% due 09/01/17 600 637<br />
Deutsche Telekom International<br />
Finance BV<br />
5.375% due 03/23/11 (Ñ) 75 74<br />
8.750% due 06/15/30 100 123<br />
Egypt Government AID Bonds<br />
4.450% due 09/15/15 295 319<br />
EnCana Corp.<br />
6.500% due 02/01/38 225 181<br />
Endurance Specialty Holdings, Ltd.<br />
6.150% due 10/15/15 100 87<br />
Enel Finance International SA (Þ)<br />
6.250% due 09/15/17 600 507<br />
HBOS PLC (Þ)<br />
6.750% due 05/21/18 825 726<br />
HSBC Holdings PLC<br />
6.500% due 05/02/36 100 102<br />
6.500% due 09/15/37 100 102<br />
Inco, Ltd.<br />
5.700% due 10/15/15 175 144<br />
62 Core Bond Fund
Russell Investment Funds<br />
Core Bond Fund<br />
Schedule of Investments, continued — December 31, 2008<br />
Amounts in thousands (except share amounts)<br />
Principal<br />
Amount ($)<br />
or Shares<br />
Market<br />
Value<br />
$<br />
Ispat Inland ULC<br />
9.750% due 04/01/14 689 590<br />
Korea Development Bank (Ê)<br />
1.565% due 04/03/10 900 869<br />
Korea Electric Power Corp. (Þ)<br />
5.125% due 04/23/34 60 53<br />
Loomis Sayles, Ltd. (Ê)(Þ)<br />
Series 2006-1A Class A<br />
3.765% due 10/26/20 1,500 999<br />
MUFG Capital Finance 1, Ltd. (ƒ)<br />
6.346% due 07/29/49 200 139<br />
National Australia Bank, Ltd. (Þ)<br />
5.350% due 06/12/13 800 771<br />
Ras Laffan Liquefied Natural Gas Co.,<br />
Ltd. III (Þ)<br />
5.838% due 09/30/27 250 151<br />
Resona Bank, Ltd. (ƒ)(Þ)<br />
5.850% due 09/29/49 100 57<br />
Resona Preferred Global Securities<br />
Cayman, Ltd. (ƒ)(Þ)<br />
7.191% due 12/29/49 325 155<br />
Rogers Communications, Inc.<br />
6.800% due 08/15/18 200 202<br />
Royal Bank of Scotland Group PLC<br />
6.990% due 10/29/49 (ƒ)(Þ) 450 210<br />
Series 1 (ƒ)<br />
9.118% due 03/31/49 700 598<br />
Santander Perpetual SA Unipersonal (ƒ)(Þ)<br />
6.671% due 10/29/49 300 191<br />
SMFG Preferred Capital USD 1, Ltd. (ƒ)(Þ)<br />
6.078% due 01/29/49 100 67<br />
Sumitomo Mitsui Banking Corp. (ƒ)(Þ)<br />
5.625% due 07/29/49 300 222<br />
Systems 2001 AT LLC (Þ)<br />
7.156% due 12/15/11 73 64<br />
Telecom Italia Capital SA<br />
6.200% due 07/18/11 255 226<br />
7.721% due 06/04/38 200 164<br />
Thomson Reuters Corp.<br />
6.500% due 07/15/18 225 205<br />
TransCapitalInvest, Ltd. for<br />
OJSC AK Transneft (Þ)<br />
8.700% due 08/07/18 100 64<br />
Transocean, Ltd.<br />
6.800% due 03/15/38 150 134<br />
UBS AG<br />
3.779% due 05/05/10 (Ê) 700 699<br />
Series DPNT<br />
5.875% due 12/20/17 400 367<br />
5.750% due 04/25/18 100 91<br />
UBS Luxembourg SA for OJSC<br />
Vimpel Communications<br />
Series REGS<br />
8.250% due 05/23/16 100 54<br />
WEA Finance LLC / WCI Finance LLC (Þ)<br />
5.400% due 10/01/12 125 96<br />
Principal<br />
Amount ($)<br />
or Shares<br />
Market<br />
Value<br />
$<br />
Westfield Capital Corp., Ltd. /<br />
WT Finance Aust Pty Ltd /<br />
WEA Finance LLC (Þ)<br />
5.125% due 11/15/14 125 87<br />
Xstrata Canada Corp.<br />
7.250% due 07/15/12 50 39<br />
6.000% due 10/15/15 45 30<br />
16,978<br />
Loan Agreements - 0.4%<br />
Adam Aircraft Industries, Term Loan (Å)<br />
14.890% due 05/23/12 56 5<br />
NRG Energy, Inc. Term Loan B (Ê)<br />
2.959% due 02/01/13 1,579 1,326<br />
1,331<br />
Mortgage-Backed Securities - 78.1%<br />
ABN Amro Mortgage Corp.<br />
Series 2003-13 Class A3<br />
5.500% due 01/25/34 1,710 1,293<br />
Adjustable Rate Mortgage Trust (Ê)<br />
Series 2004-5 Class 2A1<br />
4.996% due 04/25/35 76 46<br />
Series 2005-3 Class 8A2<br />
0.711% due 07/25/35 126 60<br />
American Home Mortgage Assets (Ê)<br />
Series 2007-4 Class A2<br />
0.661% due 08/25/37 1,060 339<br />
American Home Mortgage Investment<br />
Trust (Ê)<br />
Series 2004-4 Class 4A<br />
4.390% due 02/25/45 105 53<br />
Banc of America Alternative Loan Trust<br />
Series 2003-2 Class CB2 (Ê)<br />
0.971% due 04/25/33 72 62<br />
Series 2003-10 Class 2A2 (Ê)<br />
0.921% due 12/25/33 177 138<br />
Series 2006-5 Class CB17<br />
6.000% due 06/25/46 198 117<br />
Banc of America Commercial Mortgage,<br />
Inc.<br />
Series 2004-3 Class A3<br />
4.875% due 06/10/39 217 215<br />
Series 2005-2 Class A4<br />
4.783% due 07/10/43 333 301<br />
Series 2005-3 Class A2<br />
4.501% due 07/10/43 150 138<br />
Series 2005-5 Class A4<br />
5.115% due 10/10/45 500 408<br />
Series 2006-1 Class A4<br />
5.372% due 09/10/45 280 224<br />
Series 2006-2 Class A4<br />
5.739% due 05/10/45 200 163<br />
Banc of America Funding Corp.<br />
Series 2005-D Class A1 (Ê)<br />
4.155% due 05/25/35 124 88<br />
Core Bond Fund 63
Russell Investment Funds<br />
Core Bond Fund<br />
Schedule of Investments, continued — December 31, 2008<br />
Amounts in thousands (except share amounts)<br />
Principal<br />
Amount ($)<br />
or Shares<br />
Market<br />
Value<br />
$<br />
Series 2006-3 Class 5A8<br />
5.500% due 03/25/36 475 382<br />
Series 2006-A Class 3A2<br />
5.850% due 02/20/36 161 86<br />
Series 2006-A Class 4A1 (Ê)<br />
5.562% due 02/20/36 419 266<br />
Banc of America Mortgage Securities, Inc.<br />
Series 2003-9 Class 1A12 (Ê)<br />
0.921% due 12/25/33 344 312<br />
Series 2004-1 Class 5A1<br />
6.500% due 09/25/33 13 12<br />
Series 2004-2 Class 1A9 (Ê)<br />
0.921% due 03/25/34 177 164<br />
Series 2004-11 Class 2A1<br />
5.750% due 01/25/35 376 316<br />
Series 2005-H Class 2A5 (Ê)<br />
4.805% due 09/25/35 220 123<br />
Series 2005-L Class 3A1 (Ê)<br />
5.460% due 01/25/36 218 169<br />
Series 2006-2 Class A15<br />
6.000% due 07/25/36 212 173<br />
Series 2006-B Class 1A1 (Ê)<br />
6.153% due 11/20/36 121 60<br />
Series 2007-3 Class 1A1<br />
6.000% due 09/25/37 831 523<br />
Bear Stearns Adjustable Rate Mortgage<br />
Trust (Ê)<br />
Series 2003-1 Class 6A1<br />
5.037% due 04/25/33 54 43<br />
Series 2003-8 Class 4A1<br />
5.176% due 01/25/34 92 58<br />
Series 2004-1 Class 21A1<br />
4.707% due 04/25/34 82 57<br />
Series 2004-9 Class 22A1<br />
4.786% due 11/25/34 84 63<br />
Series 2005-2 Class A1<br />
4.125% due 03/25/35 1,282 1,085<br />
Series 2005-3 Class 2A1<br />
5.076% due 06/25/35 284 140<br />
Bear Stearns Alt-A Trust<br />
Series 2005-4 Class 23A1<br />
5.364% due 05/25/35 209 141<br />
Series 2005-7 Class 22A1<br />
5.495% due 09/25/35 99 46<br />
Series 2006-4 Class 13A1 (Ê)<br />
0.631% due 08/25/36 788 312<br />
Bear Stearns Alt-A Trust II<br />
Series 2007-1 Class 1A1<br />
6.196% due 09/25/47 865 392<br />
Bear Stearns Commercial Mortgage<br />
Securities<br />
Series 2005-T20 Class A4A<br />
5.151% due 10/12/42 600 518<br />
Series 2006-PW1 Class A4<br />
5.540% due 09/11/41 1,000 784<br />
Bear Stearns Mortgage Funding Trust (Ê)<br />
Series 2006-AR2 Class 1A1<br />
0.671% due 09/25/46 827 337<br />
Principal<br />
Amount ($)<br />
or Shares<br />
Market<br />
Value<br />
$<br />
Series 2006-AR2 Class 2A1<br />
0.701% due 10/25/36 734 286<br />
Chase Mortgage Finance Corp.<br />
Series 2003-S8 Class A1<br />
4.500% due 09/25/18 134 124<br />
Series 2006-S4 Class A3<br />
6.000% due 12/25/36 216 198<br />
Series 2006-S4 Class A4<br />
6.000% due 12/25/36 139 136<br />
Series 2007-A1 Class 1A3 (Ê)<br />
4.884% due 02/25/37 571 486<br />
Citigroup Commercial Mortgage Trust<br />
Series 2006-C4 Class A3<br />
5.724% due 03/15/49 330 259<br />
Citigroup Mortgage Loan Trust, Inc.<br />
Series 2005-11 Class A2A (Ê)<br />
4.700% due 12/25/35 72 52<br />
Series 2007-AR8 Class 2A1A<br />
5.912% due 07/25/37 209 123<br />
Citigroup/Deutsche Bank Commercial<br />
Mortgage Trust<br />
Series 2005-CD1 Class A4 (Ê)<br />
5.225% due 07/15/44 1,340 1,112<br />
Series 2006-CD3 Class A5<br />
5.617% due 10/15/48 190 151<br />
Citimortgage Alternative Loan Trust<br />
Series 2006-A3 Class 1A5<br />
6.000% due 07/25/36 132 80<br />
Commercial Mortgage Pass Through<br />
Certificates<br />
Series 2006-C8 Class A4<br />
5.306% due 12/10/46 200 146<br />
Series 2007-C9 Class A4 (Ê)<br />
5.816% due 12/10/49 360 273<br />
Countrywide Alternative Loan Trust<br />
Series 2005-1CB Class 2A1<br />
6.000% due 03/25/35 591 390<br />
Series 2005-32T Class A7 (Ê)<br />
0.721% due 08/25/35 129 85<br />
Series 2005-J8 Class 1A3<br />
5.500% due 07/25/35 192 164<br />
Series 2005-J13 Class 2A3<br />
5.500% due 11/25/35 128 77<br />
Series 2006-9T1 Class A7<br />
6.000% due 05/25/36 96 60<br />
Series 2006-43C Class 1A7<br />
6.000% due 02/25/37 254 134<br />
Series 2006-J2 Class A3<br />
6.000% due 04/25/36 149 136<br />
Series 2006-OA1 Class 2A1 (Ê)<br />
0.718% due 03/20/46 570 234<br />
Series 2006-OA1 Class 4A1 (Ê)<br />
0.661% due 08/25/46 621 242<br />
Series 2006-OA1 Class A1 (Ê)<br />
0.688% due 02/20/47 754 310<br />
Series 2007-15C Class A5<br />
5.750% due 07/25/37 872 418<br />
64 Core Bond Fund
Russell Investment Funds<br />
Core Bond Fund<br />
Schedule of Investments, continued — December 31, 2008<br />
Amounts in thousands (except share amounts)<br />
Principal<br />
Amount ($)<br />
or Shares<br />
Market<br />
Value<br />
$<br />
Series 2007-J2 Class 2A1<br />
6.000% due 07/25/37 250 112<br />
Series 2007-OA1 Class A1A (Ê)<br />
3.636% due 04/25/43 956 362<br />
Countrywide Home Loan Mortgage Pass<br />
Through Trust<br />
Series 2003-8 Class A2 (Ê)<br />
0.971% due 05/25/18 145 122<br />
Series 2003-52 Class A1 (Ê)<br />
5.292% due 02/19/34 184 116<br />
Series 2004-16 Class 1A1 (Ê)<br />
0.871% due 09/25/34 153 60<br />
Series 2004-22 Class A3 (Ê)<br />
4.789% due 11/25/34 204 127<br />
Series 2004-HYB Class 1A1 (Ê)<br />
4.730% due 02/20/35 357 222<br />
Series 2004-HYB Class A2 (Ê)<br />
4.540% due 11/20/34 89 47<br />
Series 2005-1 Class 2A1 (Ê)<br />
0.761% due 03/25/35 1,799 838<br />
Series 2005-3 Class 1A2 (Ê)<br />
0.761% due 04/25/35 27 13<br />
Series 2005-HYB Class 2A1 (Ê)<br />
4.897% due 08/20/35 370 184<br />
Series 2005-HYB Class 3A2A (Ê)<br />
5.250% due 02/20/36 66 36<br />
Series 2006-OA5 Class 2A1 (Ê)<br />
0.671% due 04/25/46 737 289<br />
Series 2007-14 Class A19<br />
6.000% due 09/25/37 928 556<br />
Series 2007-18 Class 2A1<br />
6.500% due 11/25/37 234 150<br />
Series 2007-HY1 Class 1A2 (Ê)<br />
5.680% due 04/25/37 87 25<br />
Credit Suisse Mortgage Capital Certificates<br />
Series 2006-8 Class 4A1<br />
6.500% due 10/25/21 756 444<br />
Series 2006-C2 Class A3<br />
5.658% due 03/15/39 100 81<br />
Credit Suisse First Boston Mortgage<br />
Securities Corp.<br />
Series 2005-9 Class 2A1<br />
5.500% due 10/25/35 436 294<br />
Deutsche ALT-A Securities, Inc. Alternate<br />
Loan Trust (Ê)<br />
Series 2005-AR1 Class 2A3<br />
4.964% due 08/25/35 465 286<br />
Series 2007-OA1 Class A1<br />
0.621% due 02/25/47 2,804 1,088<br />
Series 2007-OA2 Class A1<br />
3.249% due 04/25/47 1,557 664<br />
DLJ Commercial Mortgage Corp.<br />
Series 1999-CG1 Class S (Ê)<br />
Interest Only STRIP<br />
0.900% due 03/10/32 2,034 12<br />
Fannie Mae<br />
5.190% due 2012 206 212<br />
6.000% due 2016 11 11<br />
3.848% due 2017 (Ê) 41 41<br />
Principal<br />
Amount ($)<br />
or Shares<br />
Market<br />
Value<br />
$<br />
5.000% due 2017 433 449<br />
6.000% due 2017 65 68<br />
4.000% due 2018 694 712<br />
4.500% due 2018 3,763 3,871<br />
5.000% due 2018 188 194<br />
4.500% due 2019 757 775<br />
5.000% due 2019 924 953<br />
6.000% due 2019 388 404<br />
4.500% due 2020 323 333<br />
5.000% due 2020 758 780<br />
5.500% due 2020 193 199<br />
6.000% due 2020 487 508<br />
4.500% due 2021 493 505<br />
5.000% due 2021 1,168 1,201<br />
5.500% due 2021 354 365<br />
4.500% due 2022 55 57<br />
5.500% due 2022 346 357<br />
4.500% due 2023 5,377 5,513<br />
5.000% due 2023 6,598 6,793<br />
6.500% due 2024 430 447<br />
6.000% due 2026 932 962<br />
6.000% due 2027 463 477<br />
6.000% due 2028 30 31<br />
5.500% due 2029 91 95<br />
6.000% due 2032 466 482<br />
7.000% due 2032 143 151<br />
3.823% due 2033 (Ê) 170 164<br />
4.588% due 2033 (Ê) 75 75<br />
5.000% due 2033 537 550<br />
5.500% due 2033 2,373 2,438<br />
6.000% due 2033 177 183<br />
5.000% due 2034 1,409 1,441<br />
5.500% due 2034 1,517 1,557<br />
5.000% due 2035 3,313 3,388<br />
5.500% due 2035 2,133 2,191<br />
6.000% due 2035 218 224<br />
4.343% due 2036 (Ê) 376 375<br />
5.000% due 2036 2,448 2,503<br />
6.000% due 2036 2,592 2,666<br />
6.500% due 2036 125 131<br />
7.000% due 2036 23 24<br />
5.000% due 2037 5,044 5,156<br />
5.500% due 2037 4,658 4,786<br />
5.560% due 2037 (Ê) 263 269<br />
6.000% due 2037 3,782 3,893<br />
6.500% due 2037 2,871 2,967<br />
7.000% due 2037 660 692<br />
7.500% due 2037 1,610 1,690<br />
5.000% due 2038 1,981 2,025<br />
5.500% due 2038 11,584 11,897<br />
6.000% due 2038 3,947 4,067<br />
6.500% due 2038 159 166<br />
7.000% due 2038 166 174<br />
7.500% due 2038 844 886<br />
Series 2003-343 Class 6<br />
Interest Only STRIP<br />
5.000% due 10/01/33 247 25<br />
Core Bond Fund 65
Russell Investment Funds<br />
Core Bond Fund<br />
Schedule of Investments, continued — December 31, 2008<br />
Amounts in thousands (except share amounts)<br />
Principal<br />
Amount ($)<br />
or Shares<br />
Market<br />
Value<br />
$<br />
Series 2003-345 Class 18<br />
Interest Only STRIP<br />
4.500% due 12/01/18 645 57<br />
Series 2003-345 Class 19<br />
Interest Only STRIP<br />
4.500% due 01/01/19 720 63<br />
Series 2005-365 Class 12<br />
Interest Only STRIP<br />
5.500% due 12/01/35 967 104<br />
Series 2006-369 Class 8<br />
Interest Only STRIP<br />
5.500% due 04/01/36 199 28<br />
15 Year TBA (Ï)<br />
5.000% 2,080 2,121<br />
30 Year TBA (Ï)<br />
4.500% 684 693<br />
5.500% 43,185 42,222<br />
6.000% 21,000 21,617<br />
6.500% 4,000 4,154<br />
Fannie Mae REMICS<br />
Series 1999-56 Class Z<br />
7.000% due 12/18/29 90 97<br />
Series 2003-32 Class FH (Ê)<br />
0.871% due 11/25/22 270 265<br />
Series 2003-35 Class FY (Ê)<br />
0.871% due 05/25/18 343 338<br />
Series 2003-78 Class FI (Ê)<br />
0.871% due 01/25/33 280 273<br />
Series 2004-21 Class FL (Ê)<br />
0.821% due 11/25/32 133 130<br />
Series 2005-79 Class FC (Ê)<br />
0.771% due 02/25/22 125 122<br />
Series 2006-48 Class LG<br />
Principal Only STRIP<br />
Zero coupon due 06/25/36 66 58<br />
Series 2008-56 Class FD (Ê)<br />
1.411% due 07/25/48 961 892<br />
Fannie Mae Whole Loan<br />
Series 2003-W1 Class 1A1<br />
6.500% due 12/25/42 35 36<br />
Federal Home Loan Mortgage Corp.<br />
Structured Pass Through Securities (Ê)<br />
Series 2005-63 Class 1A1<br />
3.679% due 02/25/45 28 26<br />
First Horizon Alternative Mortgage<br />
Securities<br />
Series 2004-AA3 Class A1 (Ê)<br />
5.309% due 09/25/34 45 27<br />
Series 2006-AA5 Class A2 (Ê)<br />
6.510% due 09/25/36 133 33<br />
Series 2006-FA3 Class A6<br />
6.000% due 07/25/36 187 116<br />
First Horizon Asset Securities, Inc. (Ê)<br />
Series 2004-AR6 Class 2A1<br />
4.750% due 12/25/34 38 28<br />
Series 2005-AR5 Class 3A1<br />
5.538% due 10/25/35 105 84<br />
Principal<br />
Amount ($)<br />
or Shares<br />
Market<br />
Value<br />
$<br />
Freddie Mac<br />
6.000% due 2016 20 21<br />
5.000% due 2018 534 552<br />
5.000% due 2019 607 627<br />
5.000% due 2020 1,135 1,169<br />
5.500% due 2020 637 659<br />
5.376% due 2030 (Ê) 1 1<br />
5.000% due 2033 186 190<br />
4.884% due 2034 (Ê) 66 66<br />
5.000% due 2035 1,916 1,961<br />
5.871% due 2036 (Ê) 94 96<br />
5.923% due 2036 (Ê) 174 177<br />
5.968% due 2036 (Ê) 133 136<br />
5.470% due 2037 (Ê) 133 136<br />
5.500% due 2037 1,869 1,875<br />
5.526% due 2037 (Ê) 405 412<br />
5.687% due 2037 (Ê) 536 548<br />
5.702% due 2037 (Ê) 83 85<br />
5.723% due 2037 (Ê) 211 215<br />
5.752% due 2037 (Ê) 171 175<br />
5.805% due 2037 (Ê) 172 176<br />
5.844% due 2037 (Ê) 60 62<br />
5.873% due 2037 (Ê) 85 87<br />
6.000% due 2037 1,136 1,172<br />
5.500% due 2038 7,178 7,355<br />
6.000% due 2038 8,405 8,667<br />
30 Year TBA (Ï)<br />
5.500% 5,000 5,117<br />
6.000% 1,900 1,957<br />
Freddie Mac REMICS<br />
Series 2000-226 Class F (Ê)<br />
1.645% due 11/15/30 15 14<br />
Series 2003-256 Class FJ (Ê)<br />
1.595% due 02/15/33 120 117<br />
Series 2003-262 Class AB<br />
2.900% due 11/15/14 142 141<br />
Series 2004-281 Class DF (Ê)<br />
1.645% due 06/15/23 102 100<br />
Series 2005-294 Class FA (Ê)<br />
1.365% due 03/15/20 186 181<br />
Series 2005-299 Class KF (Ê)<br />
1.595% due 06/15/35 62 61<br />
Series 2005-301 Class IM<br />
Interest Only STRIP<br />
5.500% due 01/15/31 127 10<br />
Series 2006-313 Class FP (Ê)(Å)<br />
Principal Only STRIP<br />
Zero coupon due 04/15/36 125 113<br />
Series 2006-317 Class XI (Ê)(Å)<br />
Principal Only STRIP<br />
Zero coupon due 10/15/35 126 —<br />
Series 2006-323 Class PA<br />
6.000% due 03/15/26 210 213<br />
Series 2007-330 Class GL (Ê)(Å)<br />
12.343% due 04/15/37 60 69<br />
Series 2007-333 Class AF (Ê)<br />
1.345% due 10/15/20 1,621 1,569<br />
66 Core Bond Fund
Russell Investment Funds<br />
Core Bond Fund<br />
Schedule of Investments, continued — December 31, 2008<br />
Amounts in thousands (except share amounts)<br />
Principal<br />
Amount ($)<br />
or Shares<br />
Market<br />
Value<br />
$<br />
Series 2007-333 Class BF (Ê)<br />
1.345% due 07/15/19 291 283<br />
Series 2007-333 Class FT (Ê)<br />
1.345% due 08/15/19 1,157 1,122<br />
Series 2007-334 Class FA (Ê)<br />
1.425% due 02/15/19 1,151 1,106<br />
Series 2008-345 Class MB<br />
4.500% due 06/15/23 1,635 1,598<br />
Ginnie Mae I<br />
6.000% due 2029 11 12<br />
30 Year TBA (Ï)<br />
5.500% 410 422<br />
Ginnie Mae II (Ê)<br />
5.375% due 2026 165 165<br />
4.625% due 2027 10 10<br />
4.750% due 2032 66 65<br />
GMAC Commercial Mortgage<br />
Securities, Inc.<br />
Series 1999-C2 Class A2<br />
6.945% due 09/15/33 115 115<br />
GMAC Mortgage Corp. Loan Trust (Ê)<br />
Series 2004-JR1 Class A6<br />
0.921% due 12/25/33 85 58<br />
Government National Mortgage<br />
Association (Ê)<br />
Series 1999-40 Class FE<br />
1.590% due 11/16/29 94 93<br />
Series 2000-29 Class F<br />
1.008% due 09/20/30 18 17<br />
Greenwich Capital Commercial Funding<br />
Corp.<br />
Series 2003-C2 Class A2<br />
4.022% due 01/05/36 78 76<br />
Series 2004-GG1 Class A7<br />
5.317% due 06/10/36 465 387<br />
Series 2006-GG7 Class A4<br />
5.914% due 07/10/38 290 226<br />
Series 2007-GG9 Class A4<br />
5.444% due 03/10/39 315 240<br />
GS Mortgage Securities Corp. II<br />
Series 2006-GG6 Class A4<br />
5.553% due 04/10/38 320 259<br />
Series 2006-GG8 Class AAB<br />
5.535% due 11/10/39 200 151<br />
GSR Mortgage Loan Trust<br />
Series 2005-AR7 Class 6A1 (Ê)<br />
5.244% due 11/25/35 242 180<br />
Harborview Mortgage Loan Trust (Ê)<br />
Series 2005-3 Class 2A1A<br />
0.821% due 06/19/35 1,615 743<br />
Series 2005-4 Class 3A1<br />
5.142% due 07/19/35 161 88<br />
Series 2005-14 Class 3A1A<br />
5.303% due 12/19/35 88 74<br />
Series 2005-16 Class 3A1A<br />
0.831% due 01/19/36 392 181<br />
Principal<br />
Amount ($)<br />
or Shares<br />
Market<br />
Value<br />
$<br />
Indymac Index Mortgage Loan Trust<br />
Series 2005-AR1 Class A1 (Ê)<br />
5.404% due 09/25/35 633 338<br />
Series 2006-AR2 Class A2 (Ê)<br />
0.551% due 11/25/36 83 76<br />
Series 2006-AR3 Class 2A1A (Ê)<br />
0.641% due 01/25/37 729 227<br />
Series 2006-AR9 Class 1A1 (Ê)<br />
5.970% due 06/25/36 769 484<br />
Series 2007-AR5 Class 1A1<br />
6.201% due 05/25/37 809 398<br />
JPMorgan Alternative Loan Trust (Ê)<br />
Series 2007-A2 Class 12A2<br />
0.571% due 06/25/37 457 348<br />
JPMorgan Chase Commercial Mortgage<br />
Securities Corp.<br />
Series 2001-CIB Class A2<br />
6.244% due 04/15/35 75 74<br />
Series 2004-LN2 Class A1<br />
4.475% due 07/15/41 317 294<br />
Series 2005-LDP Class A3A1<br />
4.871% due 10/15/42 210 180<br />
Series 2005-LDP Class A4<br />
4.918% due 10/15/42 325 256<br />
5.179% due 12/15/44 390 313<br />
Series 2006-CB1 Class A4<br />
5.552% due 05/12/45 220 170<br />
Series 2006-LDP Class A3<br />
5.336% due 05/15/47 305 229<br />
Series 2006-LDP Class A3B<br />
5.447% due 05/15/45 250 174<br />
Series 2006-LDP Class A4<br />
5.875% due 04/15/45 650 519<br />
5.399% due 05/15/45 290 221<br />
Series 2007-CB1 Class A4<br />
5.440% due 06/12/47 1,200 866<br />
5.747% due 02/12/49 340 250<br />
Series 2007-LD1 Class A4<br />
5.882% due 02/15/51 380 270<br />
Series 2007-LDP Class A3<br />
5.420% due 01/15/49 975 689<br />
JPMorgan Mortgage Trust<br />
Series 2005-A1 Class 6T1 (Ê)<br />
5.024% due 02/25/35 122 92<br />
Series 2005-A5 Class TA1<br />
5.432% due 08/25/35 1,043 768<br />
Series 2007-A1 Class 2A2 (Ê)<br />
4.740% due 07/25/35 720 587<br />
Series 2007-S3 Class 1A35<br />
6.000% due 07/25/37 1,188 629<br />
LB-UBS Commercial Mortgage Trust<br />
Series 2006-C1 Class A4<br />
5.156% due 02/15/31 1,000 794<br />
Series 2006-C3 Class A4<br />
5.661% due 03/15/39 210 171<br />
Series 2006-C4 Class A4 (Ê)<br />
5.883% due 06/15/38 105 86<br />
Core Bond Fund 67
Russell Investment Funds<br />
Core Bond Fund<br />
Schedule of Investments, continued — December 31, 2008<br />
Amounts in thousands (except share amounts)<br />
Principal<br />
Amount ($)<br />
or Shares<br />
Market<br />
Value<br />
$<br />
Series 2007-C6 Class A4<br />
5.858% due 07/15/40 270 192<br />
Lehman Mortgage Trust<br />
Series 2005-3 Class 1A3<br />
5.500% due 01/25/36 556 384<br />
Series 2006-8 Class 2A1 (Ê)<br />
0.891% due 12/25/36 814 337<br />
Lehman XS Trust (Ê)<br />
Series 2007-7N Class 1A2<br />
0.711% due 06/25/47 929 314<br />
Mastr Adjustable Rate Mortgages Trust (Ê)<br />
Series 2004-13 Class 3A4<br />
3.788% due 11/21/34 65 63<br />
Mastr Alternative Loans Trust<br />
Series 2003-4 Class B1 (Ê)<br />
5.688% due 06/25/33 181 149<br />
Series 2004-10 Class 5A6<br />
5.750% due 09/25/34 170 138<br />
Mastr Asset Securitization Trust (Ê)<br />
Series 2003-7 Class 4A35<br />
0.871% due 09/25/33 205 184<br />
Series 2004-4 Class 2A2<br />
0.921% due 04/25/34 79 77<br />
Mellon Residential Funding Corp. (Ê)<br />
Series 2000-TBC Class A1<br />
1.675% due 06/15/30 164 135<br />
Merrill Lynch Floating Trust (Ê)(Þ)<br />
Series 2006-1 Class A1<br />
1.265% due 06/15/22 720 546<br />
Merrill Lynch Mortgage Investors, Inc. (Ê)<br />
Series 2005-A10 Class A<br />
0.681% due 02/25/36 92 49<br />
Merrill Lynch/Countrywide Commercial<br />
Mortgage Trust<br />
Series 2007-6 Class A4<br />
5.485% due 03/12/51 100 69<br />
MLCC Mortgage Investors, Inc. (Ê)<br />
Series 2004-HB1 Class A2<br />
3.551% due 04/25/29 31 20<br />
Series 2005-3 Class 5A<br />
0.721% due 11/25/35 55 38<br />
Morgan Stanley Capital I<br />
Series 2005-HQ6 Class A4A<br />
4.989% due 08/13/42 740 605<br />
Series 2005-IQ1 Class AAB<br />
5.178% due 09/15/42 415 339<br />
Series 2006-HQ1 Class A4<br />
5.328% due 11/12/41 130 101<br />
Series 2006-HQ8 Class A4 (Ê)<br />
5.387% due 03/12/44 310 251<br />
Series 2006-HQ9 Class A4<br />
5.731% due 07/12/44 295 228<br />
Series 2007-IQ1 Class A4<br />
5.809% due 12/12/49 320 240<br />
MortgageIT Trust (Ê)<br />
Series 2005-AR1 Class 1A1<br />
0.721% due 11/25/35 444 206<br />
Principal<br />
Amount ($)<br />
or Shares<br />
Market<br />
Value<br />
$<br />
Prime Mortgage Trust (Ê)<br />
Series 2004-CL1 Class 1A2<br />
0.871% due 02/25/34 34 30<br />
Residential Accredit Loans, Inc.<br />
Series 2004-QS5 Class A6 (Ê)<br />
1.071% due 04/25/34 53 43<br />
Series 2004-QS8 Class A4 (Ê)<br />
0.871% due 06/25/34 258 213<br />
Series 2005-QA8 Class NB3 (Ê)<br />
5.486% due 07/25/35 232 141<br />
Series 2005-QO5 Class A1 (Ê)<br />
3.256% due 01/25/46 2,177 937<br />
Series 2005-QS1 Class 2A3<br />
5.750% due 09/25/35 656 571<br />
Series 2006-QS6 Class 1A13<br />
6.000% due 06/25/36 298 181<br />
Series 2007-QH9 Class A1 (Ê)<br />
5.487% due 11/25/37 960 300<br />
Residential Asset Securitization Trust<br />
Series 2003-A15 Class 1A2 (Ê)<br />
0.921% due 02/25/34 294 238<br />
Series 2007-A5 Class 2A3<br />
6.000% due 05/25/37 120 72<br />
Residential Funding Mortgage Securities I (Ê)<br />
Series 2003-S5 Class 1A2<br />
0.921% due 11/25/18 156 156<br />
Series 2003-S14 Class A5<br />
0.871% due 07/25/18 169 106<br />
Series 2003-S20 Class 1A7<br />
0.971% due 12/25/33 55 55<br />
Series 2005-SA4 Class 2A1<br />
5.204% due 09/25/35 642 395<br />
Series 2006-SA4 Class 2A1 (Ê)<br />
6.128% due 11/25/36 427 221<br />
Sequoia Mortgage Trust<br />
Series 2001-5 Class A<br />
0.931% due 10/19/26 55 44<br />
Structured Adjustable Rate Mortgage Loan<br />
Trust<br />
Series 2004-5 Class 3A1<br />
4.380% due 05/25/34 131 84<br />
Series 2004-12 Class 3A2<br />
5.250% due 09/25/34 61 29<br />
Series 2004-16 Class 3A1<br />
5.450% due 11/25/34 226 128<br />
Series 2005-21 Class 7A1 (Ê)<br />
6.007% due 11/25/35 1,168 594<br />
Series 2006-12 Class 2A1 (Ê)<br />
5.929% due 01/25/37 791 415<br />
Structured Asset Mortgage Investments,<br />
Inc. (Ê)<br />
Series 2005-AR5 Class A3<br />
0.831% due 07/19/35 159 107<br />
Series 2006-AR2 Class A1<br />
0.701% due 02/25/36 546 227<br />
Series 2006-AR8 Class A1A<br />
0.671% due 10/25/36 768 303<br />
68 Core Bond Fund
Russell Investment Funds<br />
Core Bond Fund<br />
Schedule of Investments, continued — December 31, 2008<br />
Amounts in thousands (except share amounts)<br />
Principal<br />
Amount ($)<br />
or Shares<br />
Market<br />
Value<br />
$<br />
Series 2007-AR6 Class A1<br />
3.979% due 08/25/47 954 420<br />
Structured Asset Securities Corp.<br />
Series 2004-21X Class 1A3<br />
4.440% due 12/25/34 262 257<br />
Thornburg Mortgage Securities Trust (Ê)<br />
Series 2003-2 Class A1<br />
1.151% due 04/25/43 72 62<br />
Series 2006-5 Class A1<br />
0.591% due 09/25/46 673 558<br />
Series 2006-6 Class A1<br />
0.581% due 11/25/46 121 100<br />
Wachovia Bank Commercial Mortgage Trust (Ê)<br />
Series 2005-C21 Class A4<br />
5.209% due 10/15/44 1,000 817<br />
Washington <strong>Mutual</strong> Alternative Mortgage<br />
Pass-Through Certificates<br />
Series 2005-4 Class CB11<br />
5.500% due 06/25/35 90 63<br />
Series 2007-OA1 Class 2A (Ê)<br />
2.976% due 12/25/46 722 220<br />
Washington <strong>Mutual</strong> Mortgage Pass Through<br />
Certificates<br />
Series 2003-S9 Class A2 (Ê)<br />
1.021% due 10/25/33 313 293<br />
Series 2004-AR3 Class A2<br />
4.243% due 06/25/34 143 101<br />
Series 2005-AR1 Class 1A1 (Ê)<br />
4.834% due 10/25/35 246 194<br />
Series 2005-AR1 Class A1A1 (Ê)<br />
0.761% due 10/25/45 34 19<br />
0.731% due 11/25/45 852 418<br />
0.741% due 12/25/45 420 197<br />
Series 2005-AR6 Class B3 (Ê)(Å)<br />
1.131% due 04/25/45 197 24<br />
Series 2006-AR1 Class 3A1A (Ê)<br />
3.176% due 09/25/46 722 273<br />
Series 2006-AR2 Class 1A1 (Ê)<br />
5.297% due 03/25/37 728 520<br />
Series 2007-HY3 Class 4B1 (Ê)<br />
5.347% due 03/25/37 124 41<br />
Series 2007-HY4 Class 1A1 (Ê)<br />
5.526% due 04/25/37 146 77<br />
Wells Fargo Alternative Loan Trust<br />
Series 2007-PA6 Class A1 (Ê)<br />
6.600% due 12/26/37 834 379<br />
Wells Fargo Mortgage Backed Securities Trust<br />
Series 2005-AR6 Class A1 (Ê)<br />
5.034% due 04/25/35 688 505<br />
Series 2006-2 Class 2A3<br />
5.500% due 03/25/36 388 344<br />
Series 2006-AR2 Class 2A1<br />
4.950% due 03/25/36 287 187<br />
Series 2007-8 Class 1A16<br />
6.000% due 07/25/37 336 218<br />
Series 2007-10 Class 2A5<br />
6.250% due 07/25/37 159 145<br />
249,287<br />
Principal<br />
Amount ($)<br />
or Shares<br />
Market<br />
Value<br />
$<br />
Municipal Bonds - 0.6%<br />
Chicago Transit Authority<br />
Revenue Bonds<br />
6.899% due 12/01/40 400 410<br />
Los Angeles Unified School District<br />
General Obligation Unlimited (μ)<br />
4.500% due 07/01/22 400 375<br />
New York City Municipal Water Finance<br />
Authority Revenue Bonds<br />
4.750% due 06/15/37 1,300 1,131<br />
1,916<br />
Non-US Bonds - 0.4%<br />
Bombardier, Inc. (Å)<br />
7.250% due 11/15/16 EUR 125 104<br />
Brazilian Government International Bond<br />
12.500% due 01/05/22 BRL 300 133<br />
Federative Republic of Brazil<br />
10.250% due 01/10/28 BRL 1,400 540<br />
Hellas Telecommunications Luxembourg V (Ê)<br />
Series REGS<br />
8.818% due 10/15/12 EUR 125 103<br />
Impress Holdings B.V.<br />
8.443% due 09/15/13 EUR 125 130<br />
Ineos Group Holdings PLC<br />
Series REGS<br />
7.875% due 02/15/16 EUR 125 21<br />
UBS AG<br />
5.849% due 12/31/17 EUR 270 48<br />
1,079<br />
United States Government Agencies - 0.3%<br />
Federal Home Loan Mortgage Corp.<br />
5.000% due 12/14/18 100 104<br />
Freddie Mac<br />
5.125% due 11/17/17 (Ñ) 700 811<br />
4.875% due 06/13/18 100 115<br />
1,030<br />
United States Government Treasuries - 3.0%<br />
United States Treasury Principal (Ñ)<br />
Principal Only STRIP<br />
Zero coupon due 11/15/21 1,938 1,256<br />
United States Treasury Inflation Indexed<br />
Bonds<br />
2.000% due 07/15/14 (Ñ) 1,149 1,087<br />
2.000% due 01/15/16 (Ñ) 1,924 1,843<br />
2.500% due 07/15/16 (Ñ) 322 319<br />
2.625% due 07/15/17 314 321<br />
2.000% due 01/15/26 (Ñ) 1,201 1,131<br />
2.375% due 01/15/27 215 216<br />
1.750% due 01/15/28 (Ñ) 3,498 3,232<br />
3.625% due 04/15/28 (Ñ) 134 160<br />
9,565<br />
Total Long-Term Investments<br />
(cost $391,388) 356,489<br />
Core Bond Fund 69
Russell Investment Funds<br />
Core Bond Fund<br />
Schedule of Investments, continued — December 31, 2008<br />
Amounts in thousands (except share amounts)<br />
Principal<br />
Amount ($)<br />
or Shares<br />
Market<br />
Value<br />
$<br />
Preferred Stocks - 0.4%<br />
Financial Services - 0.4%<br />
Bank of America Corp. 1,000 650<br />
DG Funding Trust (Å)(Æ) 49 491<br />
Total Preferred Stocks<br />
(cost $1,409) 1,141<br />
Notional<br />
Amount<br />
Options Purchased - 0.7%<br />
(Number of Contracts)<br />
Mortgage-Backed Securities<br />
Fannie Mae TBA<br />
Feb 2009 94.14 Call (1) USD 1,000 82<br />
Swaptions<br />
(Fund Pays/Fund Receives)<br />
USD Three Month LIBOR/USD<br />
3.000%<br />
Feb 2009 0.00 Call (1) 24,400 720<br />
USD Three Month LIBOR/USD<br />
3.150%<br />
Feb 2009 0.00 Call (1) 8,700 282<br />
USD Three Month LIBOR/USD<br />
3.500%<br />
Feb 2009 0.00 Call (1) 13,200 519<br />
USD Three Month LIBOR/USD<br />
3.600%<br />
July 2009 0.00 Call (1) 2,300 85<br />
USD Three Month LIBOR/USD<br />
3.450%<br />
Aug 2009 0.00 Call (5) 17,900 601<br />
Total Options Purchased<br />
(cost $710) 2,289<br />
Principal<br />
Amount ($)<br />
or Shares<br />
Short-Term Investments - 11.4%<br />
AES Corp. (The) (Ñ)<br />
9.500% due 06/01/09 125 124<br />
Bank of America Corp. (Ê)<br />
2.826% due 11/06/09 100 98<br />
Bank of America NA (Ê)<br />
Series BKNT<br />
2.099% due 06/12/09 700 698<br />
Bank of Scotland PLC (Ê)(Ñ)(Þ)<br />
Series MTN<br />
4.590% due 07/17/09 300 299<br />
Bear Stearns Cos. LLC (The) (Ê)<br />
4.905% due 07/16/09 1,200 1,184<br />
Principal<br />
Amount ($)<br />
or Shares<br />
Market<br />
Value<br />
$<br />
Caterpillar Financial Services Corp. (Ê)<br />
2.296% due 05/18/09 1,100 1,090<br />
Citigroup Funding, Inc. (Ê)<br />
0.474% due 04/23/09 100 99<br />
1.466% due 06/26/09 200 196<br />
Citigroup Global Markets Deutschland AG<br />
for OAO Gazprom<br />
10.500% due 10/21/09 200 201<br />
Citigroup Global Markets<br />
Holdings, Inc. (Ê)<br />
Series MTNA<br />
1.971% due 03/17/09 200 199<br />
Citigroup, Inc. (Ê)(Ñ)<br />
3.505% due 01/30/09 100 100<br />
1.496% due 12/28/09 400 377<br />
Continental Airlines, Inc.<br />
Series 99A2<br />
7.056% due 09/15/09 300 288<br />
Countrywide Financial Corp. (Ê)<br />
4.348% due 01/05/09 150 150<br />
Countrywide Home Loans, Inc.<br />
Series MTNK<br />
5.625% due 07/15/09 175 174<br />
4.125% due 09/15/09 335 331<br />
CSC Holdings, Inc.<br />
Series B<br />
8.125% due 07/15/09 210 209<br />
8.125% due 08/15/09 175 174<br />
Daimler Finance North America LLC (Ê)<br />
2.346% due 03/13/09 400 400<br />
2.426% due 03/13/09 300 289<br />
Deutsche Telekom International<br />
Finance BV (Ê)<br />
1.678% due 03/23/09 300 297<br />
DnB NOR Bank ASA (Ê)(Þ)<br />
4.889% due 10/13/09 1,000 1,000<br />
Federal National Mortgage Association<br />
Discount Notes (ç)(ž)(§)<br />
0.850% due 01/27/09 26 26<br />
0.150% due 02/23/09 111 111<br />
Ford Motor Credit Co. LLC<br />
5.800% due 01/12/09 300 299<br />
General Electric Capital Corp. (Ê)<br />
Series MTN<br />
3.565% due 10/26/09 100 97<br />
GMAC LLC (Ñ)<br />
5.850% due 01/14/09 200 199<br />
Goldman Sachs Group, Inc. (The) (Ê)<br />
1.518% due 03/30/09 400 395<br />
HSBC Finance Corp. (Ê)<br />
4.479% due 10/21/09 100 94<br />
Lehman Brothers Holdings, Inc. (Ø)<br />
2.889% due 01/23/09 600 54<br />
2.878% due 04/03/09 400 36<br />
Mandalay Resort Group<br />
6.500% due 07/31/09 90 87<br />
Merrill Lynch & Co., Inc. (Ê)<br />
Series MTN<br />
2.438% due 05/08/09 900 884<br />
2.290% due 12/04/09 (Ê) 200 192<br />
70 Core Bond Fund
Russell Investment Funds<br />
Core Bond Fund<br />
Schedule of Investments, continued — December 31, 2008<br />
Amounts in thousands (except share amounts)<br />
Principal<br />
Amount ($)<br />
or Shares<br />
Market<br />
Value<br />
$<br />
Morgan Stanley<br />
2.556% due 05/07/09 (Ê) 300 295<br />
Series GMTN<br />
2.498% due 02/09/09 500 498<br />
Nordea Bank Finland PLC (ž)<br />
3.028% due 04/09/09 400 400<br />
Reckson Operating Partnership, LP<br />
7.750% due 03/15/09 25 24<br />
Russell Investment Company<br />
Russell Money Market Fund 17,437,000 17,437<br />
Telefonica Emisiones SAU (Ê)<br />
1.825% due 06/19/09 300 290<br />
United States Treasury Bills (ž)<br />
0.010% due 01/22/09 (ç)(§) 1,250 1,250<br />
0.030% due 02/26/09 (ç)(§) 270 270<br />
0.101% due 02/26/09 (ç)(§) 350 350<br />
0.020% due 03/26/09 (§) 250 250<br />
0.041% due 03/26/09 (§) 2,530 2,530<br />
0.046% due 03/26/09 (§) 260 260<br />
0.011% due 04/23/09 310 310<br />
0.228% due 06/11/09(§) 250 250<br />
Verizon Communications, Inc. (Ê)(Ñ)<br />
1.475% due 04/03/09 500 496<br />
Wachovia Mortgage FSB (Ê)<br />
Series BKNT<br />
2.428% due 05/08/09 1,000 987<br />
Total Short-Term Investments<br />
(cost $37,413) 36,348<br />
Repurchase Agreement - 1.3%<br />
Agreement with JPMorgan Chase Securities<br />
and JPMorgan Chase Bank (Tri-Party) of<br />
$4,300 dated December 31, 2008 at<br />
0.020% to be repurchased at $4,300 on<br />
January 2, 2009, collateralized by:<br />
$3,844 par United States Treasury Notes,<br />
valued at $3,844. 4,300 4,300<br />
Total Repurchase Agreement<br />
(cost $4,300) 4,300<br />
Other Securities - 5.1%<br />
State Street Securities Lending Quality<br />
Trust () 17,154,636 16,214<br />
Total Other Securities<br />
(cost $17,155) 16,214<br />
Total Investments - 130.6%<br />
(identified cost $452,375) 416,781<br />
Other Assets and Liabilities,<br />
Net - (30.6%) (97,672)<br />
Net Assets - 100.0% 319,109<br />
See accompanying notes which are an integral part of the financial statements.<br />
Core Bond Fund 71
Russell Investment Funds<br />
Core Bond Fund<br />
Schedule of Investments, continued — December 31, 2008<br />
Amounts in thousands (except contracts)<br />
Futures Contracts<br />
Number of<br />
Contracts<br />
Notional<br />
Amount<br />
Expiration<br />
Date<br />
Unrealized<br />
Appreciation<br />
(Depreciation)<br />
$<br />
Long Positions<br />
Euribor Futures (Germany) 5 EUR 1,222 03/09 53<br />
Euribor Futures (Germany) 5 EUR 1,225 06/09 56<br />
Euro-Bobl Futures (Germany) 61 EUR 7,089 03/09 64<br />
Eurodollar Futures (CME) 96 USD 23,746 03/09 535<br />
Eurodollar Futures (CME) 90 USD 22,246 06/09 482<br />
Eurodollar Futures (CME) 43 USD 10,615 09/09 223<br />
Eurodollar Futures (CME) 31 USD 7,640 12/09 160<br />
Eurodollar Futures (CME) 18 USD 4,431 03/10 103<br />
Eurodollar Futures (CME) 1 USD 246 06/10 6<br />
Eurodollar Futures (CME) 1 USD 245 09/10 6<br />
Long Gilt Bond (UK) 5 GBP 617 03/09 56<br />
Three Month Short Sterling Interest Rate Futures (UK) 21 GBP 2,579 03/09 184<br />
Three Month Short Sterling Interest Rate Futures (UK) 16 GBP 1,967 06/09 139<br />
Three Month Short Sterling Interest Rate Futures (UK) 1 GBP 122 12/09 6<br />
United States Treasury 2 Year Notes 33 USD 7,196 03/09 47<br />
United States Treasury 5 Year Notes 91 USD 10,834 03/09 350<br />
United States Treasury 10 Year Notes 39 USD 4,904 03/09 165<br />
United States Treasury 30 Year Bonds 38 USD 5,246 03/09 96<br />
Short Positions<br />
Eurodollar Futures (CME) 3 USD 739 12/09 (15)<br />
United States Treasury 5 Year Notes 26 USD 3,095 03/09 (94)<br />
United States Treasury 10 Year Notes 9 USD 1,132 03/09 (74)<br />
United States Treasury 30 Year Bonds 18 USD 2,485 03/09 (200)<br />
Total Unrealized Appreciation (Depreciation) on Open Futures Contracts 2,348<br />
See accompanying notes which are an integral part of the financial statements.<br />
72 Core Bond Fund
Russell Investment Funds<br />
Core Bond Fund<br />
Schedule of Investments, continued — December 31, 2008<br />
Options Written<br />
(Number of Contracts)<br />
Notional<br />
Amount<br />
Market<br />
Value<br />
$<br />
Eurodollar Futures<br />
Mar 2009 98.00 Put (7) USD 18 —<br />
Mar 2009 98.25 Put (6) USD 15 (1)<br />
Mar 2009 98.50 Put (14) USD 35 (2)<br />
Swaptions<br />
(Fund Receives/Fund Pays)<br />
USD Three Month LIBOR/USD<br />
3.950%<br />
Feb 2009 0.00 Call (1) 7,200 (613)<br />
USD Three Month LIBOR/USD<br />
4.250%<br />
Feb 2009 0.00 Call (1) 2,900 (352)<br />
USD Three Month LIBOR/USD<br />
4.600%<br />
Feb 2009 0.00 Call (1) 1,300 (187)<br />
USD 2.750%/USD Three Month<br />
LIBOR<br />
May 2009 0.00 Put (2) 2,000 (21)<br />
USD Three Month LIBOR/USD<br />
4.200%<br />
July 2009 0.00 Call (1) 1,000 (91)<br />
USD Three Month LIBOR/USD<br />
4.150%<br />
Aug 2009 0.00 Call (1) 600 (52)<br />
USD Three Month LIBOR/USD<br />
4.400%<br />
Aug 2009 0.00 Call (5) 5,500 (681)<br />
United States Treasury Notes<br />
5 Year Futures<br />
Feb 2009 118.00 Put (14) USD 14 (12)<br />
United States Treasury Notes<br />
10 Year Futures<br />
Feb 2009 124.00 Put (6) USD 6 (10)<br />
Total Liability for Options Written<br />
(premiums received $580) (2,022)<br />
See accompanying notes which are an integral part of the financial statements.<br />
Core Bond Fund 73
Russell Investment Funds<br />
Core Bond Fund<br />
Schedule of Investments, continued — December 31, 2008<br />
Foreign Currency Exchange Contracts<br />
Amount<br />
Sold<br />
Amount<br />
Bought<br />
Settlement<br />
Date<br />
Unrealized<br />
Appreciation<br />
(Depreciation)<br />
$<br />
USD 1,092 CNY 7,516 03/02/09 (1)<br />
USD 15 EUR 10 01/13/09 —<br />
USD 18 EUR 13 01/13/09 1<br />
USD 19 EUR 13 01/13/09 (1)<br />
USD 19 EUR 13 01/13/09 (1)<br />
USD 21 EUR 16 01/13/09 1<br />
USD 21 EUR 16 01/13/09 1<br />
USD 21 EUR 16 01/13/09 1<br />
USD 30 EUR 20 01/13/09 (1)<br />
USD 30 EUR 21 01/13/09 (1)<br />
USD 32 EUR 24 01/13/09 2<br />
USD 113 EUR 80 01/13/09 (1)<br />
USD 587 EUR 430 01/13/09 11<br />
USD 29 HUF 6,496 01/16/09 5<br />
USD 32 HUF 6,882 01/16/09 4<br />
USD 45 HUF 8,942 01/16/09 2<br />
USD 71 HUF 14,346 01/16/09 4<br />
USD 76 HUF 16,107 01/16/09 8<br />
USD 2 INR 86 01/16/09 —<br />
USD 18 JPY 1,698 01/08/09 1<br />
USD 22 JPY 2,051 01/08/09 1<br />
USD 22 JPY 2,113 01/08/09 1<br />
USD 44 JPY 4,150 01/08/09 2<br />
USD 40 MYR 141 02/12/09 1<br />
USD 70 MYR 251 02/12/09 2<br />
USD 130 MYR 467 02/12/09 5<br />
USD 427 PHP 20,565 02/06/09 4<br />
USD 369 SGD 565 01/06/09 23<br />
USD 200 SGD 296 01/16/09 5<br />
USD 226 SGD 335 01/16/09 6<br />
USD 250 SGD 368 01/16/09 5<br />
USD 360 SGD 528 01/16/09 7<br />
USD 369 SGD 565 01/16/09 23<br />
AUD 199 USD 129 01/22/09 (10)<br />
BRL 8 USD 3 02/03/09 —<br />
BRL 75 USD 31 02/03/09 (1)<br />
BRL 82 USD 34 02/03/09 (1)<br />
BRL 88 USD 36 02/03/09 (1)<br />
BRL 127 USD 57 02/03/09 3<br />
BRL 1,370 USD 624 02/03/09 43<br />
CNY 2,674 USD 385 03/02/09 (3)<br />
EUR 399 USD 516 01/13/09 (39)<br />
EUR 630 USD 815 01/13/09 (61)<br />
EUR 715 USD 903 01/13/09 (89)<br />
GBP 165 USD 250 01/15/09 12<br />
HUF 52,773 USD 289 01/16/09 14<br />
INR 86 USD 2 01/16/09 —<br />
JPY 10,134 USD 105 01/08/09 (7)<br />
JPY 20,227 USD 219 01/22/09 (4)<br />
MYR 14 USD 4 02/12/09 —<br />
MYR 18 USD 5 02/12/09 —<br />
MYR 24 USD 7 02/12/09 —<br />
MYR 36 USD 10 02/12/09 —<br />
Foreign Currency Exchange Contracts<br />
Amount<br />
Sold<br />
Amount<br />
Bought<br />
Settlement<br />
Date<br />
Unrealized<br />
Appreciation<br />
(Depreciation)<br />
$<br />
MYR 40 USD 11 02/12/09 —<br />
MYR 45 USD 13 02/12/09 (1)<br />
MYR 45 USD 13 02/12/09 (1)<br />
MYR 47 USD 13 02/12/09 (1)<br />
MYR 47 USD 13 02/12/09 (1)<br />
MYR 47 USD 13 02/12/09 (1)<br />
MYR 109 USD 30 02/12/09 (1)<br />
MYR 193 USD 53 02/12/09 (3)<br />
MYR 193 USD 53 02/12/09 (3)<br />
PHP 20,565 USD 396 02/06/09 (34)<br />
SEK 25 USD 3 01/20/09 —<br />
SEK 983 USD 124 01/20/09 —<br />
SGD 565 USD 369 01/06/09 (23)<br />
SGD 291 USD 194 01/16/09 (8)<br />
SGD 562 USD 370 01/16/09 (20)<br />
SGD 565 USD 370 01/16/09 (22)<br />
SGD 674 USD 442 01/16/09 (26)<br />
Total Unrealized Appreciation (Depreciation) on Open<br />
Foreign Currency Exchange Contracts (169)<br />
See accompanying notes which are an integral part of the financial statements.<br />
74 Core Bond Fund
Russell Investment Funds<br />
Core Bond Fund<br />
Schedule of Investments, continued — December 31, 2008<br />
Amounts in thousands<br />
Credit Default Swap Contracts<br />
Corporate Issues<br />
Reference<br />
Entity<br />
Counter<br />
Party<br />
Implied<br />
Credit<br />
Spread<br />
Notional<br />
Amount<br />
Fund (Pays)/<br />
Receives<br />
Fixed Rate<br />
Termination<br />
Date<br />
Arrow Electronics, Inc. Citigroupglobal Markets, Inc. 2.040% USD 135 (0.820)% 03/20/14 8<br />
Centex Corp. JP Morgan 4.250% USD 325 (4.400)% 12/20/13 1<br />
Citigroup, Inc. Barclays Bank PLC 7.300% USD 600 5.650% 03/20/13 (31)<br />
Citigroup, Inc. JP Morgan 7.300% USD 200 5.170% 03/20/13 (13)<br />
Darden Restaurants, Inc. Deutsche Bank 2.670% USD 400 (2.250)% 03/20/14 7<br />
Ford Motor Credit Co. Barclays Bank PLC 10.510% USD 1,000 6.150% 09/20/12 (120)<br />
Ford Motor Credit Co. Goldman Sachs 10.510% USD 600 5.850% 09/20/12 (77)<br />
Ford Motor Credit Co. Merrill Lynch 98.500% USD 200 5.000% 12/20/09 (115)<br />
Gaz Capital for Gazprom Barclays Bank PLC 9.970% USD 300 1.600% 12/20/12 (74)<br />
Gaz Capital for Gazprom Morgan Stanley 9.870% USD 1,000 2.480% 02/20/13 (215)<br />
Gaz Capital for Gazprom Morgan Stanley 9.870% USD 100 2.180% 02/20/13 (23)<br />
GE Capital Corp. Banque National De Paris 4.550% USD 400 1.100% 12/20/09 (13)<br />
GE Capital Corp. Citibank 3.710% USD 200 4.000% 12/20/13 3<br />
GE Capital Corp. Deutsche Bank 3.710% USD 100 4.900% 12/20/13 5<br />
General Motors Acceptance Corp. Merrill Lynch 9.740% USD 1,000 1.850% 09/20/09 (54)<br />
General Motors Corp. Citibank 81.100% USD 2,000 4.630% 12/20/12 (1,547)<br />
General Motors Corp. Deutsche Bank 140.510% USD 400 5.000% 12/20/09 (280)<br />
Hewelett-Packard Co. Citigroupglobal Markets, Inc. 0.900% USD 135 (0.720)% 03/20/14 1<br />
Home Depot, Inc. Citigroupglobal Markets, Inc. 2.570% USD 340 (3.250)% 03/20/14 (11)<br />
Lowe's Cos., Inc. Citigroupglobal Markets, Inc. 1.300% USD 340 (1.450)% 03/20/14 (3)<br />
Nordstrom, Inc. Deutsche Bank 5.560% USD 425 (2.100)% 03/20/14 56<br />
Pulte Homes, Inc. JP Morgan 3.200% USD 725 (2.550)% 12/20/13 19<br />
Pulte Homes, Inc. JP Morgan 3.160% USD 1,000 (3.870)% 03/20/14 29<br />
Republic of Panama Morgan Stanley 2.810% USD 100 0.750% 01/20/12 (6)<br />
SLM Corp. Bank of America 11.540% USD 200 4.550% 03/20/09 (3)<br />
SLM Corp. Citibank 8.610% USD 200 4.850% 03/20/13 (22)<br />
Total Market Value of Open Corporate Issue Credit Default Swap Contracts Premiums Paid (Received) - ($298) (2,478)<br />
Credit Indices<br />
Reference<br />
Entity<br />
Counter<br />
Party<br />
Notional<br />
Amount<br />
Fund (Pays)/<br />
Receives<br />
Fixed Rate<br />
Termination<br />
Date<br />
Market<br />
Value<br />
$<br />
ABX - HE Index for Sub-Prime Home Equity Sector Citibank USD 650 0.170% 05/25/46 (569)<br />
ABX - HE Index for Sub-Prime Home Equity Sector Credit Suisse First Boston USD 350 0.090% 08/25/37 (211)<br />
ABX - HE Index for Sub-Prime Home Equity Sector Credit Suisse First Boston USD 350 0.090% 08/25/37 (211)<br />
ABX - HE Index for Sub-Prime Home Equity Sector Credit Suisse First Boston USD 200 0.760% 01/25/38 (122)<br />
ABX - HE Index for Sub-Prime Home Equity Sector Credit Suisse First Boston USD 300 0.760% 01/25/38 (182)<br />
ABX - HE Index for Sub-Prime Home Equity Sector JP Morgan USD 1,300 0.090% 08/25/37 (785)<br />
ABX - HE Index for Sub-Prime Home Equity Sector JP Morgan USD 1,300 0.760% 01/25/38 (792)<br />
CMBS AAA Index Citibank USD 250 (0.350)% 02/15/51 79<br />
CMBS AAA Index Citigroupglobal Markets, Inc. USD 255 (0.350)% 10/03/51 77<br />
CMBS AAA Index Credit Suisse First Boston USD 540 (0.070)% 03/15/49 109<br />
CMBS AAA Index Credit Suisse First Boston USD 350 (0.350)% 02/17/51 105<br />
CMBS AAA Index Deutsche Bank USD 300 (0.080)% 12/13/49 90<br />
CMBS AAA Index JP Morgan USD 720 (0.080)% 12/13/49 215<br />
CMBS AAA Index JP Morgan USD 280 (0.080)% 12/13/49 84<br />
CMBS AAA Index JP Morgan USD 590 (0.350)% 02/17/51 177<br />
CMBS AAA Index JP Morgan USD 280 (0.350)% 02/17/51 84<br />
CMBS AAA Index JP Morgan USD 540 (0.100)% 10/12/52 76<br />
CMBX AJ Index Barclays Bank PLC USD 360 (0.840)% 10/12/52 124<br />
CMBX AJ Index Barclays Bank PLC USD 360 (0.840)% 10/12/52 124<br />
Dow Jones CDX Index Citibank USD 500 2.144% 06/20/12 (85)<br />
Dow Jones CDX Index Deutsche Bank USD 778 0.708% 12/20/12 4<br />
Dow Jones CDX Index Deutsche Bank USD 4,880 (1.550)% 06/20/13 110<br />
Dow Jones CDX Index Deutsche Bank USD 600 1.500% 12/20/13 (12)<br />
Dow Jones CDX Index Goldman Sachs USD 194 0.548% 12/20/17 —<br />
Dow Jones CDX Index JP Morgan USD 2,928 (1.550)% 06/20/13 64<br />
Dow Jones CDX Index JP Morgan USD 1,984 (1.550)% 06/20/13 45<br />
Dow Jones CDX Index JP Morgan USD 389 0.553% 12/20/17 1<br />
Dow Jones CDX Index Morgan Stanley USD 400 5.000% 12/20/13 (80)<br />
Dow Jones CDX Index Morgan Stanley USD 293 (0.800)% 12/20/17 15<br />
Dow Jones CDX Index Morgan Stanley USD 500 (5.000)% 06/20/13 63<br />
Total Market Value of Open Credit Index Credit Default Swap Contracts Premiums Paid (Received) - ($1,862) (1,403)<br />
Total Market Value of Open Credit Default Swap Contracts Premiums Paid (Received) - ($2,160) (3,881)<br />
Market<br />
Value<br />
$<br />
See accompanying notes which are an integral part of the financial statements.<br />
Core Bond Fund 75
Russell Investment Funds<br />
Core Bond Fund<br />
Schedule of Investments, continued — December 31, 2008<br />
Amounts in thousands<br />
Interest Rate Swaps Contracts<br />
Counter<br />
Party<br />
Notional<br />
Amount Fund Receives Fund Pays<br />
Termination<br />
Date<br />
Bank of America USD 6,500 5.473% Three Month LIBOR 06/14/11 612<br />
Bank of America USD 3,600 4.444% Three Month LIBOR 11/18/15 282<br />
Bank of America USD 2,700 3.815% Three Month LIBOR 11/25/15 133<br />
Bank of America USD 1,800 5.548% Three Month LIBOR 06/14/16 391<br />
Bank of America USD 2,200 Three Month LIBOR 4.569% 11/18/20 (300)<br />
Bank of America USD 1,600 Three Month LIBOR 3.807% 11/25/20 (115)<br />
Bank of America USD 2,200 Three Month LIBOR 3.500% 06/17/24 (171)<br />
Bank of America USD 600 Three Month LIBOR 5.000% 12/17/28 (202)<br />
Bank of America USD 1,500 5.628% Three Month LIBOR 06/16/36 825<br />
Bank of America USD 700 Three Month LIBOR 5.000% 12/17/38 (319)<br />
Barclays Bank PLC BRL 100 11.360% Brazil Interbank Deposit Rate 01/04/10 (1)<br />
Barclays Bank PLC USD 600 4.000% Three Month LIBOR 12/16/10 14<br />
Barclays Bank PLC EUR 3,170 Six Month EURIBOR 4.500% 12/17/13 (247)<br />
Barclays Bank PLC USD 7,800 3.855% Three Month LIBOR 10/27/14 525<br />
Barclays Bank PLC USD 3,960 3.340% Three Month LIBOR 11/25/14 166<br />
Barclays Bank PLC GBP 140 5.250% Six Month LIBOR 12/17/18 31<br />
Barclays Bank PLC USD 100 Three Month LIBOR 4.000% 06/17/19 (12)<br />
Barclays Bank PLC USD 144 Three Month LIBOR 4.524% 11/15/21 (35)<br />
Barclays Bank PLC USD 146 Three Month LIBOR 4.420% 11/15/21 (32)<br />
Barclays Bank PLC USD 266 Three Month LIBOR 4.540% 11/15/21 (64)<br />
Barclays Bank PLC USD 530 Three Month LIBOR 4.633% 11/15/21 (138)<br />
Barclays Bank PLC USD 2,050 Three Month LIBOR 4.015% 10/27/39 (486)<br />
Barclays Bank PLC USD 950 Three Month LIBOR 3.130% 11/25/39 (56)<br />
BNP Paribas EUR 500 Consumer Price Index (France) 2.090% 10/15/10 23<br />
BNP Paribas EUR 300 4.500% Six Month EURIBOR 03/18/14 24<br />
Citibank MXN 10,000 8.850% Mexico Interbank 28 Day Deposit Rate 11/23/10 13<br />
Citibank MXN 20,000 8.210% Mexico Interbank 28 Day Deposit Rate 12/08/10 9<br />
Citibank MXN 17,000 8.210% Mexico Interbank 28 Day Deposit Rate 12/09/10 7<br />
Citibank EUR 660 Six Month EURIBOR 4.500% 12/17/10 (29)<br />
Citibank BRL 2,500 13.226% Brazil Interbank Deposit Rate 01/03/11 —<br />
Citibank USD 1,300 2.750% Three Month LIBOR 06/18/12 30<br />
Citibank USD 1,600 Three Month LIBOR 5.000% 12/17/38 (727)<br />
Citigroupglobal Markets, Inc. USD 7,240 4.288% Three Month LIBOR 10/30/14 633<br />
Citigroupglobal Markets, Inc. USD 1,960 Three Month LIBOR 4.313% 10/30/39 (581)<br />
Credit Suisse First Boston GBP 100 5.000% Six Month LIBOR 06/15/09 1<br />
Credit Suisse First Boston USD 4,200 2.750% Three Month LIBOR 06/18/12 98<br />
Credit Suisse First Boston JPY 258,000 Six Month LIBOR 1.500% 12/17/13 (71)<br />
Credit Suisse First Boston USD 1,000 Three Month LIBOR 3.500% 06/17/24 (78)<br />
Credit Suisse First Boston USD 500 Three Month LIBOR 3.500% 06/18/29 (49)<br />
Deutsche Bank MXN 8,300 8.910% Mexico Interbank 28 Day Deposit Rate 11/18/10 11<br />
Deutsche Bank EUR 300 4.500% Six Month EURIBOR 12/17/10 13<br />
Deutsche Bank EUR 1,740 4.500% Six Month EURIBOR 12/17/10 77<br />
Deutsche Bank BRL 1,000 13.220% Brazil Interbank Deposit Rate 01/03/11 —<br />
Deutsche Bank GBP 100 5.000% Six Month LIBOR 03/18/14 12<br />
Deutsche Bank USD 4,400 3.500% Three Month LIBOR 06/17/16 289<br />
Deutsche Bank USD 300 Three Month LIBOR 3.500% 06/17/19 (22)<br />
Deutsche Bank USD 900 Three Month LIBOR 3.500% 06/17/24 (70)<br />
Deutsche Bank USD 1,000 Three Month LIBOR 3.500% 06/17/24 (78)<br />
Deutsche Bank USD 3,400 Three Month LIBOR 3.500% 06/17/24 (264)<br />
Deutsche Bank USD 200 Three Month LIBOR 3.500% 06/18/29 (19)<br />
Deutsche Bank USD 1,200 3.500% Three Month LIBOR 06/17/39 170<br />
Goldman Sachs GBP 900 5.000% Six Month LIBOR 06/15/09 12<br />
Goldman Sachs GBP 500 6.000% Six Month LIBOR 06/19/09 10<br />
Goldman Sachs GBP 100 5.250% Six Month LIBOR 03/18/14 14<br />
Market<br />
Value<br />
$<br />
See accompanying notes which are an integral part of the financial statements.<br />
76 Core Bond Fund
Russell Investment Funds<br />
Core Bond Fund<br />
Schedule of Investments, continued — December 31, 2008<br />
Amounts in thousands<br />
Interest Rate Swaps Contracts<br />
Counter<br />
Party<br />
Notional<br />
Amount Fund Receives Fund Pays<br />
Termination<br />
Date<br />
HSBC GBP 300 5.000% Six Month LIBOR 09/17/13 32<br />
JP Morgan MXN 4,500 8.950% Mexico Interbank 28 Day Deposit Rate 11/19/10 6<br />
JP Morgan MXN 9,000 8.420% Mexico Interbank 28 Day Deposit Rate 12/01/10 6<br />
JP Morgan MXN 7,000 8.380% Mexico Interbank 28 Day Deposit Rate 12/03/10 5<br />
JP Morgan EUR 1,570 Six Month EURIBOR 4.500% 12/17/10 (70)<br />
JP Morgan EUR 1,730 4.500% Six Month EURIBOR 12/17/10 77<br />
JP Morgan USD 400 Three Month LIBOR 3.250% 06/17/14 (18)<br />
JP Morgan USD 4,900 3.500% Three Month LIBOR 06/17/16 322<br />
JP Morgan AUD 90 Six Month LIBOR 7.250% 12/17/18 (15)<br />
JP Morgan USD 1,100 Three Month LIBOR 3.500% 06/17/19 (81)<br />
JP Morgan USD 200 Three Month LIBOR 3.500% 06/17/24 (16)<br />
Merrill Lynch BRL 200 12.948% Brazil Interbank Deposit Rate 01/04/10 2<br />
Merrill Lynch USD 1,500 4.000% Three Month LIBOR 06/17/11 68<br />
Merrill Lynch BRL 100 14.765% Brazil Interbank Deposit Rate 01/02/12 2<br />
Merrill Lynch BRL 700 11.980% Brazil Interbank Deposit Rate 01/02/12 (2)<br />
Merrill Lynch BRL 800 12.540% Brazil Interbank Deposit Rate 01/02/12 2<br />
Merrill Lynch GBP 100 Six Month LIBOR 4.000% 12/15/35 (9)<br />
Merrill Lynch USD 400 Three Month LIBOR 5.000% 12/17/38 (182)<br />
Morgan Stanley BRL 400 12.670% Brazil Interbank Deposit Rate 01/04/10 1<br />
Morgan Stanley USD 9,500 4.000% Three Month LIBOR 06/17/10 248<br />
Morgan Stanley USD 200 Three Month LIBOR 5.000% 12/17/28 (67)<br />
Morgan Stanley USD 300 Three Month LIBOR 5.000% 12/17/38 (137)<br />
Royal Bank of Scotland USD 2,100 4.000% Three Month LIBOR 06/17/10 55<br />
Royal Bank of Scotland USD 18,500 4.000% Three Month LIBOR 06/17/11 839<br />
Royal Bank of Scotland EUR 100 1.955% Consumer Price Index (France) 03/28/12 2<br />
Royal Bank of Scotland GBP 200 5.250% Six Month LIBOR 03/18/14 28<br />
Royal Bank of Scotland USD 100 Three Month LIBOR 4.000% 06/17/16 (9)<br />
Royal Bank of Scotland USD 200 Three Month LIBOR 5.000% 12/17/28 (67)<br />
Royal Bank of Scotland GBP 100 Six Month LIBOR 4.000% 12/15/36 (16)<br />
Royal Bank of Scotland USD 1,900 Three Month LIBOR 5.000% 12/17/38 (866)<br />
SBC Warburg BRL 400 12.410% Brazil Interbank Deposit Rate 01/04/10 1<br />
UBS AUD 300 7.500% Three Month BBSW 03/15/10 9<br />
UBS AUD 2,800 7.000% Three Month BBSW 06/15/10 72<br />
UBS AUD 1,600 7.500% Six Month LIBOR 03/15/11 84<br />
UBS BRL 800 10.575% Brazil Interbank Deposit Rate 01/02/12 (16)<br />
UBS JPY 64,000 Six Month LIBOR 1.500% 12/17/13 (20)<br />
UBS GBP 140 Six Month LIBOR 5.250% 12/17/18 (30)<br />
UBS AUD 90 7.250% Six Month BBSW 12/17/18 15<br />
Total Market Value of Open Interest Rate Swap Contracts Premiums Paid (Received) - $461 514<br />
Market<br />
Value<br />
$<br />
See accompanying notes which are an integral part of the financial statements.<br />
Core Bond Fund 77
Russell Investment Funds<br />
Core Bond Fund<br />
Presentation of Portfolio Holdings — December 31, 2008<br />
Categories<br />
%ofNet<br />
Assets<br />
Asset-Backed Securities 4.7<br />
Corporate Bonds and Notes 18.9<br />
International Debt 5.3<br />
Loan Agreements 0.4<br />
Mortgage-Backed Securities 78.1<br />
Municipal Bonds 0.6<br />
Non-US Bonds 0.4<br />
United States Government Agencies 0.3<br />
United States Government Treasuries 3.0<br />
Preferred Stocks 0.4<br />
Options Purchased 0.7<br />
Short-Term Investments 11.4<br />
Repurchase Agreement 1.3<br />
Other Securities 5.1<br />
Total Investments 130.6<br />
Other Assets and Liabilities, Net (30.6)<br />
100.0<br />
Futures Contracts 0.7<br />
Options Written (0.6)<br />
Foreign Currency Exchange Contracts (0.1)<br />
Credit Default Swap Contracts (1.2)<br />
Interest Rate Swap Contracts 0.2<br />
See accompanying notes which are an integral part of the financial statements.<br />
78 Core Bond Fund
(This page intentionally left blank)
Russell Investment Funds<br />
Real Estate Securities Fund<br />
Portfolio Management Discussion and Analysis — December 31, 2008 (Unaudited)<br />
Growth of a $10,000 Investment<br />
$40,000<br />
$35,000<br />
$30,000<br />
$25,000<br />
$20,000<br />
$15,000<br />
$10,000<br />
Real Estate Securities Fund<br />
FTSE NAREIT Equity REITs Index**<br />
$5,000<br />
*<br />
1999<br />
2000<br />
2001<br />
2002 2003 2004<br />
Yearly periods ended December 31<br />
2005<br />
2006<br />
2007<br />
2008<br />
Real Estate Securities Fund<br />
Total<br />
Return<br />
1 Year (37.76)%<br />
5 Years 1.62%§<br />
Inception* 7.23%§<br />
FTSE NAREIT Equity REITs Index **<br />
Total<br />
Return<br />
1 Year (37.73)%<br />
5 Years 0.91%§<br />
Inception* 7.22%§<br />
* The Fund commenced operations on April 30, 1999.<br />
** FTSE National Association of Real Estate Investment Trusts (NAREIT) Equity REITs Index is an index composed of all the data based on the last closing price<br />
of the month for all tax-qualified REITs listed on the New York Stock Exchange, American Stock Exchange, and the NASDAQ National Market System. The<br />
data is market value-weighted. The total-return calculation is based upon whether it is 1-month, 3-months or 12-months. Only those REITs listed for the entire<br />
period are used in the total return calculation.<br />
§ <strong>Annual</strong>ized.<br />
The performance shown in this section does not reflect any Insurance Company Separate Account or Policy Charges. Performance is historical and assumes<br />
reinvestment of all dividends and capital gains. Investment return and principal value will fluctuate so that an investor’s shares, when redeemed, may be worth more or<br />
less than when purchased. Past performance is not indicative of future results.<br />
80 Real Estate Securities Fund
Russell Investment Funds<br />
Real Estate Securities Fund<br />
Portfolio Management Discussion — December 31, 2008 (Unaudited)<br />
The Real Estate Securities Fund (the “Fund”) allocates most of<br />
its assets among multiple money managers. Russell Investment<br />
Management Company (“RIMCo”), as the Fund’s advisor, may<br />
change the allocation of the Fund’s assets among money<br />
managers at any time. An exemptive order from the Securities<br />
and Exchange Commission (SEC) permits RIMCo to engage or<br />
terminate a money manager at any time, subject to the approval<br />
by the Fund’s Board without a shareholder vote. Pursuant to the<br />
terms of the exemptive order, the Fund is required to notify its<br />
shareholders within 60 days of when a money manager begins<br />
providing services. The Fund currently has five money managers.<br />
What is the Fund’s investment objective?<br />
The Fund seeks to provide current income and long term capital<br />
growth.<br />
How did the Fund perform relative to its benchmark for<br />
the fiscal year ended December 31, 2008?<br />
For the fiscal year ended December 31, 2008, the Real Estate<br />
Securities Fund lost 37.76%. This compared to the FTSE<br />
NAREIT Equity REITs Index, which lost 37.73% during the<br />
same period. The Fund’s performance includes operating<br />
expenses, whereas Index returns are unmanaged and do not<br />
include expenses of any kind.<br />
For the year ending December 31, 2008, the Lipper ® Real<br />
Estate Funds (VIP) Average lost 40.21%. This result serves as a<br />
peer comparison and is expressed net of operating expenses.<br />
How did the market conditions described in the Market<br />
Summary report affect the Fund’s performance?<br />
The money managers positioned the Fund with a more defensive<br />
posture during the fiscal year. Over the course of the fiscal year,<br />
the managers moved to underweight positions in the industrial<br />
and lodging/resorts sectors. The industrial underweight<br />
reflected concerns about the large development pipelines<br />
maintained by the leading companies in the sector. The lodging/<br />
resorts underweight reflected concerns about a slowing<br />
economy, which is expected to curtail business and leisure<br />
travel, leading to lower occupancies and room rate growth. The<br />
Fund maintained an overweight position in the regional malls<br />
sector, as the managers were drawn to the long term lease<br />
structures and limited new supply of high quality malls. The<br />
Fund maintained underweight positions in the health care and<br />
specialty sectors based on relative valuations. While the<br />
underweight positions in the industrial and lodging/resorts<br />
sectors benefited Fund performance, the overweight to regional<br />
malls and underweight to the health care and specialty sectors<br />
detracted from performance. Overall, property sector<br />
positioning was a positive contributor to the Fund’s performance<br />
during the fiscal year.<br />
Due to the negative market returns, the Fund’s cash position of<br />
approximately 4% had a positive contribution to Fund<br />
performance during the fiscal year. The Fund’s international<br />
real estate securities holdings detracted from performance.<br />
Property stocks in Asia Pacific and Europe lagged behind U.S.<br />
REITs during this period.<br />
How did the investment strategies and techniques<br />
employed by the Fund and its money managers affect<br />
its performance?<br />
AEW Management and Advisors, L.P. pursues a value-oriented<br />
style that focuses on identifying companies that it believes are<br />
mis-priced relative to underlying real estate net asset value.<br />
AEW performed slightly ahead of the benchmark during the<br />
fiscal year. Stock selection was a positive contributor to<br />
performance, particularly in the regional malls and industrial<br />
sectors. Property sector allocation negatively contributed to<br />
performance. The primary detractors to performance were an<br />
overweight to the underperforming regional malls sector and an<br />
underweight to the outperforming health care sector.<br />
INVESCO Institutional (N.A.), Inc. maintains a broadly<br />
diversified portfolio with exposure to all major property sectors.<br />
Their investment style incorporates fundamental property<br />
market research and bottom-up quantitative securities analysis.<br />
INVESCO outperformed the benchmark during the fiscal year<br />
due to contributions from both property sector allocation and<br />
stock selection. An overweight to the outperforming health care<br />
sector and underweight to the underperforming industrial sector<br />
both had a positive contribution to performance. Stock selection<br />
was strongest in the apartments, diversified, shopping centers<br />
and regional malls sectors. This was partially offset by weak<br />
stock selection in the office sector.<br />
RREEF America L.L.C.’s style emphasizes a top-down<br />
approach to property sector weights based on an assessment of<br />
property market fundamentals. RREEF performed in line with<br />
the benchmark during the fiscal year. Sector allocation<br />
detracted from performance due primarily to an overweight to<br />
the underperforming regional malls sector. Overall stock<br />
selection had a positive contribution to performance, driven by<br />
stock selection in the regional malls, shopping centers and<br />
lodging/resorts sectors.<br />
Heitman Real Estate Securities LLC manages a concentrated<br />
portfolio with a bottom-up approach to stock selection focusing<br />
on companies that it believes have attractive valuations relative<br />
to growth prospects. Heitman outperformed the benchmark<br />
during the fiscal year, primarily as a result of effective stock<br />
selection. Stock selection was strongest in the regional malls,<br />
industrial and health care sectors. Sector allocation detracted<br />
from performance, driven primarily by an overweight to the<br />
underperforming regional malls sector.<br />
Cohen & Steers Capital Management Inc. manages a broadly<br />
diversified portfolio of global property securities. Cohen &<br />
Steers uses a bottom-up approach to portfolio construction,<br />
emphasizing the relationship between price and net asset value<br />
as the principal valuation metric. Cohen & Steers also evaluates<br />
multiple-to-growth ratios as indicators of value. While Cohen &<br />
Steers outperformed relative to their peer group of global<br />
managers, the global portfolio had a negative impact on Fund<br />
performance, due to the underperformance of international<br />
Real Estate Securities Fund 81
Russell Investment Funds<br />
Real Estate Securities Fund<br />
Portfolio Management Discussion — December 31, 2008 (Unaudited)<br />
property securities markets. Investments in Asia, particularly in<br />
Hong Kong, detracted the most from performance. However, all<br />
regions outside the U.S., including Australia, Continental<br />
Europe and the United Kingdom, underperformed relative to the<br />
U.S. Cohen & Steers’ strong stock selection was insufficient to<br />
overcome the lower returns in the international markets.<br />
The Fund’s performance shown throughout this report was<br />
based on valuations calculated in accordance with Generally<br />
Accepted Accounting Principles (GAAP) and in accordance<br />
with a newly effective accounting statement (SFAS 157),<br />
reflects the December 31, 2008 market value of the pooled<br />
investment vehicle in which the Fund invested its cash<br />
collateral received in securities lending transactions. This<br />
market value is lower than the vehicle’s amortized cost per unit.<br />
This had a negative impact on the Fund’s benchmark relative<br />
performance.<br />
Describe any changes to the Fund’s structure or the<br />
money manager line-up.<br />
There were no money manager changes during the fiscal year.<br />
During the course of the fiscal year, Heitman’s target weight<br />
was increased from 10% to 15% and the target weights for<br />
AEW and INVESCO decreased to 25% each.<br />
The views expressed in this report reflect those of the portfolio<br />
managers only through the end of the period covered by the report.<br />
These views do not necessarily represent the views of RIMCo or any<br />
other person in RIMCo or any other affiliated organization. These views<br />
are subject to change at any time based upon market conditions or<br />
other events, and RIMCo disclaims any responsibility to update the<br />
views contained herein. These views should not be relied on as<br />
investment advice and, because investment decisions for Russell<br />
Investment Funds are based on numerous factors, should not be relied<br />
on as an indication of investment decisions of any RIF Fund.<br />
Money Managers as of<br />
December 31, 2008<br />
Styles<br />
AEW Management and Advisors, L.P.<br />
Value<br />
Cohen & Steers Capital Management, Inc.<br />
Global Market-Oriented<br />
Heitman Real Estate Securities LLC<br />
Growth<br />
INVESCO Institutional (N.A.), Inc. which acts as a<br />
money manager to the Fund through its INVESCO Real<br />
Estate division<br />
Market-Oriented<br />
RREEF America L.L.C.<br />
Market-Oriented<br />
82 Real Estate Securities Fund
Russell Investment Funds<br />
Real Estate Securities Fund<br />
Shareholder Expense Example — December 31, 2008 (Unaudited)<br />
Fund Expenses<br />
The following disclosure provides important information<br />
regarding each Fund’s Expense Example, which appears<br />
on each Fund’s individual page in this <strong>Annual</strong> Report.<br />
Please refer to this information when reviewing the<br />
Expense Example for a Fund.<br />
Example<br />
As a shareholder of the Fund, you incur two types of costs: (1)<br />
transaction costs, and (2) ongoing costs, including management<br />
fees and other Fund expenses. The Example is intended to help<br />
you understand your ongoing costs (in dollars) of investing in<br />
the Fund and to compare these costs with the ongoing costs of<br />
investing in other mutual funds. The Example is based on an<br />
investment of $1,000 invested at the beginning of the period<br />
and held for the entire period indicated, which for this Fund is<br />
from July 1, 2008 to December 31, 2008.<br />
Actual Expenses<br />
The information in the table under the heading “Actual<br />
Performance” provides information about actual account values<br />
and actual expenses. You may use the information in this<br />
column, together with the amount you invested, to estimate the<br />
expenses that you paid over the period. Simply divide your<br />
account value by $1,000 (for example, an $8,600 account value<br />
divided by $1,000 = 8.6), then multiply the result by the<br />
number in the first column in the row entitled “Expenses Paid<br />
During Period” to estimate the expenses you paid on your<br />
account during this period.<br />
Hypothetical Example for Comparison Purposes<br />
The information in the table under the heading “Hypothetical<br />
Performance (5% return before expenses)” provides information<br />
about hypothetical account values and hypothetical expenses<br />
based on the Fund’s actual expense ratio and an assumed rate<br />
of return of 5% per year before expenses, which is not the<br />
Fund’s actual return. The hypothetical account values and<br />
expenses may not be used to estimate the actual ending account<br />
balance or expenses you paid for the period. You may use this<br />
information to compare the ongoing costs of investing in the<br />
Fund and other funds. To do so, compare this 5% hypothetical<br />
example with the 5% hypothetical examples that appear in the<br />
shareholder reports of other funds.<br />
Please note that the expenses shown in the table are meant to<br />
highlight your ongoing costs only and do not reflect any<br />
transactional costs. Therefore, the information under the<br />
heading “Hypothetical Performance (5% return before<br />
expenses)” is useful in comparing ongoing costs only, and will<br />
not help you determine the relative total costs of owning<br />
different funds. In addition, if these transactional costs were<br />
included, your costs would have been higher. The fee and<br />
expenses shown in this section do not reflect any Insurance<br />
Company Separate Account or Policy Charges.<br />
Actual<br />
Performance<br />
Hypothetical<br />
Performance<br />
(5% return<br />
before expenses)<br />
Beginning Account Value<br />
July 1, 2008 $ 1,000.00 $ 1,000.00<br />
Ending Account Value<br />
December 31, 2008 $ 643.40 $ 1,020.11<br />
Expenses Paid During Period* $ 4.13 $ 5.08<br />
* Expenses are equal to the Fund’s annualized expense ratio of 1.00%<br />
(representing the one-half year period annualized), multiplied by the average<br />
account value over the period, multiplied by 184/366 (to reflect the one-half<br />
year period).<br />
Real Estate Securities Fund 83
Russell Investment Funds<br />
Real Estate Securities Fund<br />
Schedule of Investments — December 31, 2008<br />
Amounts in thousands (except share amounts)<br />
Principal<br />
Amount ($)<br />
or Shares<br />
Market<br />
Value<br />
$<br />
Common Stocks - 97.9%<br />
Apartments—15.6%<br />
American Campus Communities,<br />
Inc. (ö)(Ñ) 136,809 2,802<br />
Apartment Investment & Management Co.<br />
Class A (ö)(Ñ) 111,249 1,285<br />
AvalonBay Communities, Inc. (ö)(Ñ) 223,326 13,529<br />
Boardwalk Real Estate Investment Trust (ö) 9,285 192<br />
BRE Properties, Inc. Class A (ö)(Ñ) 90,454 2,531<br />
Camden Property Trust (ö)(Ñ) 197,090 6,177<br />
China Overseas Land & Investment,<br />
Ltd. (Ñ) 156,000 213<br />
China Resources Land, Ltd. (Ñ) 58,000 72<br />
Equity Residential (ö)(Ñ) 479,334 14,294<br />
Essex Property Trust, Inc. (ö)(Ñ) 43,207 3,316<br />
Home Properties, Inc. (ö)(Ñ) 15,300 621<br />
Mid-America Apartment Communities,<br />
Inc. (ö) 27,719 1,030<br />
Post Properties, Inc. (ö)(Ñ) 53,750 887<br />
UDR, Inc. (ö)(Ñ) 20,071 277<br />
47,226<br />
Diversified—9.7%<br />
Agile Property Holdings, Ltd. (Ñ) 44,000 23<br />
Atrium European Real Estate, Ltd. (Æ) 9,248 34<br />
British Land Co. PLC (ö) 51,693 414<br />
Canadian Real Estate Investment Trust(ö) 18,317 335<br />
CapitaLand, Ltd. 107,000 235<br />
Castellum AB (Ñ) 37,595 292<br />
Dexus Property Group (ö)(Ñ) 618,174 359<br />
Gecina SA (ö) 421 29<br />
GPT Group (ö) 188,740 122<br />
Hang Lung Properties, Ltd.—ADR (Ñ) 154,000 338<br />
Henderson Land Development Co., Ltd. (Ñ) 102,336 382<br />
Hysan Development Co., Ltd. 211,470 343<br />
Kerry Properties, Ltd. 19,500 53<br />
Land Securities Group PLC (ö) 61,331 817<br />
Mirvac Group (ö) 329,079 297<br />
Mitsubishi Estate Co., Ltd. 127,000 2,094<br />
Mitsui Fudosan Co., Ltd. 65,100 1,082<br />
New World China Land, Ltd. (Æ) 86,100 26<br />
Sino Land Co. 153,000 160<br />
Sino-Ocean Land Holdings, Ltd. (Æ) 70,000 32<br />
Sponda OYJ 4,701 21<br />
Stockland (ö)(Ñ) 57,477 166<br />
Sumitomo Realty & Development Co., Ltd. 5,000 75<br />
Sun Hung Kai Properties, Ltd. 164,362 1,382<br />
Suntec Real Estate Investment Trust (Æ)(ö) 15,000 7<br />
Tokyu Land Corp. 18,000 69<br />
Unibail-Rodamco (ö) 5,947 886<br />
Vornado Realty Trust (ö)(Ñ) 287,683 17,362<br />
Washington Real Estate Investment<br />
Trust (ö)(Ñ) 74,902 2,120<br />
29,555<br />
Principal<br />
Amount ($)<br />
or Shares<br />
Market<br />
Value<br />
$<br />
Free Standing Retail—0.6%<br />
National Retail Properties, Inc. (ö)(Ñ) 65,800 1,131<br />
Realty Income Corp. (ö)(Ñ) 30,800 713<br />
1,844<br />
Health Care—14.0%<br />
Cogdell Spencer, Inc. (ö)(Ñ) 41,300 387<br />
HCP, Inc. (ö)(Ñ) 188,671 5,239<br />
Health Care REIT, Inc. (ö)(Ñ) 147,602 6,229<br />
LTC Properties, Inc. (ö) 51,650 1,047<br />
Medical Properties Trust, Inc. (ö)(Ñ) 144,604 912<br />
Nationwide Health Properties, Inc. (ö) 297,335 8,539<br />
Omega Healthcare Investors, Inc. (ö)(Ñ) 217,275 3,470<br />
Senior Housing Properties Trust (ö) 268,779 4,817<br />
Ventas, Inc. (ö)(Ñ) 352,838 11,845<br />
42,485<br />
Industrial—4.9%<br />
AMB Property Corp. (ö) 212,310 4,972<br />
DCT Industrial Trust, Inc. (ö)(Ñ) 678,599 3,434<br />
EastGroup Properties, Inc. (ö)(Ñ) 16,038 571<br />
First Potomac Realty Trust (ö) 73,500 683<br />
Goodman Group (ö) 137,561 73<br />
Prologis (ö)(Ñ) 343,711 4,774<br />
ProLogis European Properties 14,670 66<br />
Segro PLC (ö)(Ñ) 38,967 139<br />
14,712<br />
Lodging/Resorts—2.6%<br />
Hospitality Properties Trust (ö)(Ñ) 15,450 230<br />
Host Hotels & Resorts, Inc. (ö)(Ñ) 825,112 6,246<br />
LaSalle Hotel Properties (ö)(Ñ) 24,700 273<br />
Starwood Hotels & Resorts Worldwide,<br />
Inc. (Ñ)(ö) 71,691 1,283<br />
8,032<br />
Manufactured Homes—0.9%<br />
Equity Lifestyle Properties, Inc. (ö)(Ñ) 74,200 2,846<br />
Mixed Industrial/Office—2.4%<br />
Duke Realty Corp. (ö)(Ñ) 12,466 137<br />
Liberty Property Trust (ö)(Ñ) 266,524 6,085<br />
PS Business Parks, Inc. (ö) 21,454 958<br />
7,180<br />
Office—11.3%<br />
Alexandria Real Estate Equities, Inc. (ö)(Ñ) 51,282 3,094<br />
Alstria Office REIT-AG (Æ)(ö) 2,664 14<br />
BioMed Realty Trust, Inc. (ö)(Ñ) 193,948 2,273<br />
Boston Properties, Inc. (ö)(Ñ) 231,460 12,730<br />
Brandywine Realty Trust (ö) 100,412 774<br />
Brookfield Properties Corp. 223,228 1,726<br />
Corporate Office Properties Trust SBI<br />
MD (ö)(Ñ) 59,375 1,823<br />
Douglas Emmett, Inc. (ö)(Ñ) 138,221 1,805<br />
Great Portland Estates PLC (ö)(Ñ) 38,944 146<br />
84 Real Estate Securities Fund
Russell Investment Funds<br />
Real Estate Securities Fund<br />
Schedule of Investments, continued — December 31, 2008<br />
Amounts in thousands (except share amounts)<br />
Principal<br />
Amount ($)<br />
or Shares<br />
Market<br />
Value<br />
$<br />
Highwoods Properties, Inc. (ö) 18,700 512<br />
Hongkong Land Holdings, Ltd. 253,000 634<br />
HRPT Properties Trust (ö) 159,400 537<br />
ICADE (ö) 3,347 279<br />
Japan Prime Realty Investment Corp.<br />
Class A (ö) 24 57<br />
Japan Real Estate Investment Corp.<br />
Class A (ö) 18 162<br />
Kilroy Realty Corp. (ö)(Ñ) 78,300 2,620<br />
Mack-Cali Realty Corp. (ö)(Ñ) 71,781 1,759<br />
Nippon Building Fund, Inc. Class A (ö) 21 231<br />
Nomura Real Estate Office Fund, Inc.<br />
Class A (ö) 12 78<br />
NTT Urban Development Corp. (Ñ) 211 228<br />
SL Green Realty Corp. (ö)(Ñ) 100,901 2,613<br />
Societe Immobiliere de Location pour<br />
l’Industrie et le Commerce (ö) 797 74<br />
Tokyo Tatemono Co., Ltd. (Ñ) 36,000 165<br />
34,334<br />
Regional Malls—10.5%<br />
Aeon Mall Co., Ltd. (Ñ) 18,300 353<br />
CBL & Associates Properties, Inc. (ö)(Ñ) 8,630 56<br />
Macerich Co. (The) (ö)(Ñ) 167,654 3,045<br />
Simon Property Group, Inc. (ö)(Ñ) 449,687 23,892<br />
Taubman Centers, Inc. (ö)(Ñ) 120,926 3,079<br />
Westfield Group (ö)(Ñ) 164,437 1,515<br />
31,940<br />
Self Storage—8.0%<br />
Extra Space Storage, Inc. (ö)(Ñ) 296,376 3,059<br />
Public Storage (ö)(Ñ) 260,148 20,682<br />
Safestore Holdings PLC 11,321 9<br />
Sovran Self Storage, Inc. (ö) 10,900 392<br />
U-Store-It Trust (ö) 4,044 18<br />
24,160<br />
Shopping Centers—11.2%<br />
Acadia Realty Trust (ö)(Ñ) 55,841 797<br />
Citycon Oyj 12,560 30<br />
Corio NV (ö)(Ñ) 9,018 414<br />
Developers Diversified Realty Corp. (ö)(Ñ) 135,108 659<br />
Eurocommercial Properties NV (ö)(Ñ) 3,413 115<br />
Federal Realty Investment Trust (ö)(Ñ) 198,010 12,293<br />
Hammerson PLC (ö)(Ñ) 46,259 358<br />
Japan Retail Fund Investment Corp.<br />
Class A (ö) 49 212<br />
Kimco Realty Corp. (ö)(Ñ) 231,280 4,228<br />
Kite Realty Group Trust (ö) 112,000 623<br />
Klepierre—GDR (ö) 2,870 70<br />
Link REIT (The) (ö)(Ñ) 139,028 231<br />
Mercialys SA (ö) 3,854 121<br />
Primaris Retail Real Estate Investment<br />
Trust (ö) 6,720 58<br />
Principal<br />
Amount ($)<br />
or Shares<br />
Market<br />
Value<br />
$<br />
Regency Centers Corp. (ö)(Ñ) 255,319 11,923<br />
RioCan Real Estate Investment Trust (ö) 200 2<br />
Saul Centers, Inc. (ö) 8,600 340<br />
Tanger Factory Outlet Centers (ö)(Ñ) 36,400 1,369<br />
Weingarten Realty Investors (ö)(Ñ) 6,710 139<br />
33,982<br />
Specialty—6.2%<br />
Corrections Corp. of America (Æ)(Ñ) 5,900 97<br />
Digital Realty Trust, Inc. (ö)(Ñ) 274,516 9,018<br />
DuPont Fabros Technology, Inc. (ö) 129,050 267<br />
Entertainment Properties Trust (ö)(Ñ) 23,362 696<br />
Plum Creek Timber Co., Inc. (ö)(Ñ) 187,540 6,515<br />
Rayonier, Inc. (ö)(Ñ) 69,800 2,188<br />
18,781<br />
Total Common Stocks<br />
(cost $338,763) 297,077<br />
Short-Term Investments - 3.5%<br />
Russell Investment Company Money<br />
Market Fund 10,609,000 10,609<br />
Total Short-Term Investments<br />
(cost $10,609) 10,609<br />
Other Securities - 31.2%<br />
State Street Securities Lending Quality<br />
Trust () 100,064,879 94,571<br />
Total Other Securities<br />
(cost $100,065) 94,571<br />
Total Investments - 132.6%<br />
(identified cost $449,437) 402,257<br />
Other Assets and Liabilities,<br />
Net - (32.6%) (98,841)<br />
Net Assets - 100.0% 303,416<br />
See accompanying notes which are an integral part of the financial statements.<br />
Real Estate Securities Fund 85
Russell Investment Funds<br />
Real Estate Securities Fund<br />
Schedule of Investments — December 31, 2008<br />
Foreign Currency Exchange Contracts<br />
Amount<br />
Sold<br />
Amount<br />
Bought<br />
Settlement<br />
Date<br />
Unrealized<br />
Appreciation<br />
(Depreciation)<br />
$<br />
USD — AUD — 01/02/09 —<br />
USD 4 AUD 5 01/02/09 —<br />
USD — AUD — 01/05/09 —<br />
USD — AUD — 01/06/09 —<br />
USD — AUD — 01/06/09 —<br />
USD 7 AUD 10 01/06/09 —<br />
USD 2 EUR 2 01/02/09 —<br />
USD 3 EUR 2 01/02/09 —<br />
USD 5 EUR 3 01/02/09 —<br />
USD 2 EUR 2 01/05/09 —<br />
USD 6 EUR 4 01/05/09 —<br />
USD 2 EUR 1 01/06/09 —<br />
USD 1 HKD 4 01/02/09 —<br />
USD 1 HKD 7 01/02/09 —<br />
USD 5 HKD 40 01/02/09 —<br />
USD — HKD 4 01/05/09 —<br />
USD 1 HKD 11 01/05/09 —<br />
USD 2 HKD 16 01/05/09 —<br />
USD 3 HKD 24 01/05/09 —<br />
USD 7 HKD 57 01/05/09 —<br />
USD 11 HKD 84 01/05/09 —<br />
USD 5 JPY 429 01/07/09 —<br />
USD 13 JPY 1,162 01/07/09 —<br />
USD 13 JPY 1,169 01/07/09 —<br />
USD 6 SGD 8 01/05/09 —<br />
USD 2 SGD 3 01/06/09 —<br />
AUD 5 USD 3 01/02/09 —<br />
AUD 5 USD 3 01/05/09 —<br />
AUD 17 USD 12 01/06/09 —<br />
AUD 36 USD 25 01/06/09 1<br />
CAD 2 USD 2 01/02/09 —<br />
CAD 3 USD 2 01/02/09 —<br />
CAD 2 USD 2 01/05/09 —<br />
CAD 5 USD 4 01/05/09 —<br />
EUR 2 USD 2 01/02/09 —<br />
EUR 2 USD 2 01/05/09 —<br />
EUR 3 USD 3 01/05/09 —<br />
EUR 7 USD 10 01/06/09 —<br />
EUR 40 USD 56 01/06/09 —<br />
GBP 3 USD 4 01/02/09 —<br />
GBP 1 USD 1 01/06/09 —<br />
GBP 14 USD 21 01/06/09 —<br />
HKD 26 USD 3 01/02/09 —<br />
HKD 51 USD 7 01/05/09 —<br />
HKD 63 USD 8 01/05/09 —<br />
HKD 553 USD 71 01/05/09 —<br />
JPY 5,780 USD 64 01/07/09 —<br />
SEK 85 USD 11 01/05/09 —<br />
SEK 100 USD 13 01/07/09 —<br />
Total Unrealized Appreciation (Depreciation) on Open<br />
Foreign Currency Exchange Contracts 1<br />
See accompanying notes which are an integral part of the financial statements.<br />
86 Real Estate Securities Fund
Russell Investment Funds<br />
Real Estate Securities Fund<br />
Presentation of Portfolio Holdings — December 31, 2008<br />
Categories<br />
%ofNet<br />
Assets<br />
Apartments 15.6<br />
Diversified 9.7<br />
Free Standing Retail 0.6<br />
Health Care 14.0<br />
Industrial 4.9<br />
Lodging/Resorts 2.6<br />
Manufactured Homes 0.9<br />
Mixed Industrial/Office 2.4<br />
Office 11.3<br />
Regional Malls 10.5<br />
Self Storage 8.0<br />
Shopping Centers 11.2<br />
Specialty 6.2<br />
Short-Term Investments 3.5<br />
Other Securities 31.2<br />
Total Investments 132.6<br />
Other Assets and Liabilities, Net (32.6)<br />
100.0<br />
Foreign Currency Exchange Contracts —*<br />
—* Less than .05% of net assets.<br />
See accompanying notes which are an integral part of the financial statements.<br />
Real Estate Securities Fund 87
Russell Investment Funds<br />
Notes to Schedules of Investments — December 31, 2008<br />
Footnotes:<br />
(Æ) Nonincome-producing security.<br />
(ö) Real Estate Investment Trust (REIT).<br />
(§) All or a portion of the shares of this security are held as collateral in connection with futures contracts purchased (sold), options written, or swaps entered into by<br />
the Fund.<br />
(ž) Rate noted is yield-to-maturity from date of acquisition.<br />
(ç) At amortized cost, which approximates market.<br />
(Ê) Adjustable or floating rate security. Rate shown reflects rate in effect at period end.<br />
(Ï) Forward commitment.<br />
(ƒ) Perpetual floating rate security. Rate shown reflects rate in effect at period end.<br />
(μ) Bond is insured by a guarantor.<br />
(æ) Pre-refunded: These bonds are collateralized by US Treasury securities, which are held in escrow by a trustee and used to pay principal and interest in the taxexempt<br />
issue and to retire the bonds in full at the earliest refunding date. The rate noted is for descriptive purposes; effective yield may vary.<br />
(Ø) In default.<br />
(ß) Illiquid security.<br />
() The security is purchased with the cash collateral from the securities loaned.<br />
(Ñ) All or a portion of the shares of this security are on loan.<br />
(Þ) Restricted security. Security may have contractual restrictions on resale, may have been offered in a private placement transaction, and may not be registered<br />
under the Securities Act of 1933.<br />
(Å) Illiquid and restricted security.<br />
(å) Currency balances were held in connection with futures contracts purchased (sold), options written, or swaps entered into by the Fund. See Note 2.<br />
Abbreviations:<br />
144A - Represents private placement security for qualified buyers according to rule 144A of the Securities Act of 1933.<br />
ADR - American Depositary Receipt<br />
ADS - American Depositary Share<br />
BBSW - Australian Bank Bill Short Term Rate<br />
CIBOR - Copenhagen Interbank Offered Rate<br />
CME - Chicago Mercantile Exchange<br />
CMO - Collateralized Mortgage Obligation<br />
CVO - Contingent Value Obligation<br />
EURIBOR - Euro Interbank Offered Rate<br />
FDIC - Federal Deposit Insurance Company<br />
GDR - Global Depositary Receipt<br />
GDS - Global Depositary Share<br />
LIBOR - London Interbank Offered Rate<br />
NIBOR - Norwegian Interbank Offered Rate<br />
PIK - Payment in Kind<br />
REMIC - Real Estate Mortgage Investment Conduit<br />
STRIP - Separate Trading of Registered Interest and Principal of Securities<br />
TBA - To Be Announced Security<br />
Foreign Currency Abbreviations:<br />
ARS - Argentine peso HKD - Hong Kong dollar PLN - Polish zloty<br />
AUD - Australian dollar HUF - Hungarian forint RUB - Russian ruble<br />
BRL - Brazilian real IDR - Indonesian rupiah SEK - Swedish krona<br />
CAD - Canadian dollar ILS - Israeli shekel SGD - Singapore dollar<br />
CHF - Swiss franc INR - Indian rupee SKK - Slovakian koruna<br />
CLP - Chilean peso JPY - Japanese yen THB - Thai baht<br />
CNY - Chinese renminbi yuan KES - Kenyan schilling TRY - Turkish lira<br />
COP - Colombian peso KRW - South Korean won TWD - Taiwanese dollar<br />
CRC - Costa Rica colon MXN - Mexican peso USD - United States dollar<br />
CZK - Czech koruna MYR - Malaysian ringgit VEB - Venezuelan bolivar<br />
DKK - Danish krone NOK - Norweigian Krone VND - Vietnamese dong<br />
EGP - Egyptian pound NZD - New Zealand dollar ZAR - South African rand<br />
EUR - Euro<br />
PEN - Peruvian nouveau sol<br />
GBP - British pound sterling<br />
PHP - Philippine peso<br />
88 Notes to Schedules of Investments
Russell Investment Funds<br />
Statements of Assets and Liabilities — December 31, 2008<br />
Amounts in thousands<br />
Multi-Style Equity<br />
Fund<br />
Aggressive Equity<br />
Fund<br />
Non-U.S.<br />
Fund<br />
Core Bond<br />
Fund<br />
Real Estate<br />
Securities Fund<br />
Assets<br />
Investments, at identified cost ............ $ 425,636 $ 208,310 $ 331,216 $ 452,375 $ 449,437<br />
Investments, at market*** .............. 346,934 172,326 269,951 416,781 402,257<br />
Cash ............................. — 106 104 — —<br />
Cash (restricted) ..................... 3,700 1,600 7,642 2,019 —<br />
Foreign currency holdings* .............. — — 3,124 606 136<br />
Unrealized appreciation on foreign currency<br />
exchange contracts .................. — — 2,365 198 1<br />
Receivables:<br />
Dividends and interest ............ 549 195 336 2,532 2,521<br />
Dividends from affiliated money<br />
market funds ................. 17 6 18 12 11<br />
Investments sold ................ 2,064 1,048 4,239 22,465 1,972<br />
Fund shares sold ................ 25 7 10 103 77<br />
Foreign taxes recoverable .......... — — 36 — —<br />
Fund Adviser .................. — — — — —<br />
Daily variation margin on futures<br />
contracts ................... 478 387 44 498 —<br />
Prepaid expenses ..................... 5 2 4 6 4<br />
Interest rate swap contracts, at market<br />
value**** ........................ — — — 6,301 —<br />
Credit default swap contracts, at market<br />
value***** ....................... — — — 1,775 —<br />
Total assets ..................... 353,772 175,677 287,873 453,296 406,979<br />
Liabilities<br />
Payables:<br />
Due to Custodian or Broker ........ — — — 1,000 —<br />
Investments purchased ........... 1,822 1,256 4,386 99,942 3,150<br />
Fund shares redeemed ............ 73 143 184 42 54<br />
Accrued fees to affiliates .......... 188 65 177 146 204<br />
Other accrued expenses ........... 58 50 114 68 90<br />
Daily variation margin on futures<br />
contracts ................... — — 101 288 —<br />
Other payable .................. — — — 1,714 —<br />
Unrealized depreciation on foreign currency<br />
exchange contracts .................. — — 761 367 —<br />
Options written, at market value** ......... — — — 2,022 —<br />
Payable upon return of securities loaned ..... 53,420 51,075 26,400 17,155 100,065<br />
Interest rate swap contracts, at market<br />
value**** ........................ — — — 5,787 —<br />
Credit default swap contracts, at market<br />
value***** ....................... — — — 5,656 —<br />
Total liabilities .................. 55,561 52,589 32,123 134,187 103,563<br />
Net Assets ...................... $ 298,211 $ 123,088 $ 255,750 $ 319,109 $ 303,416<br />
See accompanying notes which are an integral part of the financial statements.<br />
Statements of Assets and Liabilities 89
Russell Investment Funds<br />
Statements of Assets and Liabilities, continued — December 31, 2008<br />
Multi-Style Equity<br />
Fund<br />
Aggressive Equity<br />
Fund<br />
Non-U.S.<br />
Fund<br />
Core Bond<br />
Fund<br />
Real Estate<br />
Securities Fund<br />
Net Assets Consist of:<br />
Undistributed (overdistributed) net investment<br />
income .......................... $ 1,690 $ — $ 1,726 $ 2,838 $ 4,013<br />
Accumulated net realized gain (loss) ........ (85,181) (57,214) (84,838) 521 (81,468)<br />
Unrealized appreciation (depreciation) on:<br />
Investments ................... (78,702) (35,984) (61,265) (35,594) (47,180)<br />
Futures contracts ............... 454 643 513 2,348 —<br />
Options written ................. — — — (1,442) —<br />
Credit default swap contracts ....... — — — (1,721) —<br />
Interest rate swap contracts ........ — — — 53 —<br />
Foreign currency-related<br />
transactions ................. — — 1,511 (186) (4)<br />
Shares of beneficial interest ............. 331 171 342 342 326<br />
Additional paid-in capital ............... 459,619 215,472 397,761 351,950 427,729<br />
Net Assets ...................... $ 298,211 $ 123,088 $ 255,750 $ 319,109 $ 303,416<br />
Net Asset Value, offering and<br />
redemption price per share:<br />
Net asset value per share****** ........ $ 9.00 $ 7.18 $ 7.48 $ 9.33 $ 9.30<br />
Net assets ...................... $ 298,210,893 $ 123,087,924 $ 255,749,546 $ 319,108,827 $ 303,416,057<br />
Shares outstanding ($.01 par value) ..... 33,132,830 17,135,790 34,170,535 34,187,141 32,641,688<br />
Amounts in thousands<br />
* Foreign currency holdings - cost $ — $ — $ 3,199 $ 618 $ 138<br />
** Premiums received on options written $ — $ — $ — $ 580 $ —<br />
*** Securities on loan included in<br />
investments $ 53,455 $ 51,291 $ 25,168 $ 16,586 $ 101,844<br />
**** Interest rate swap contracts -<br />
premiums paid (received) $ — $ — $ — $ 461 $ —<br />
***** Credit default swap contracts -<br />
premiums paid (received) $ — $ — $ — $ (2,160) $ —<br />
****** Net asset value per share equals net<br />
assets divided by shares of beneficial<br />
interest outstanding.<br />
See accompanying notes which are an integral part of the financial statements.<br />
90 Statements of Assets and Liabilities
Russell Investment Funds<br />
Statements of Operations — For the Fiscal Year Ended December 31, 2008<br />
Amounts in thousands<br />
Multi-Style Equity<br />
Fund<br />
Aggressive Equity<br />
Fund<br />
Non-U.S.<br />
Fund<br />
Core Bond<br />
Fund<br />
Real Estate<br />
Securities Fund<br />
Investment Income<br />
Dividends ..................... $ 8,002 $ 2,495 $ 10,612 $ 111 $ 14,749<br />
Dividends from affiliated money market<br />
funds ...................... 632 210 802 529 435<br />
Interest ....................... 19 13 27 18,249 —<br />
Securities lending income .......... 940 761 703 222 994<br />
Less foreign taxes withheld ......... — — (1,003) — —<br />
Total investment income ................ 9,593 3,479 11,141 19,111 16,178<br />
Expenses<br />
Advisory fees ................... 2,954 1,653 3,166 1,946 3,515<br />
Administrative fees .............. 202 92 176 177 220<br />
Custodian fees .................. 292 338 784 490 327<br />
Transfer agent fees ............... 18 8 15 16 19<br />
Professional fees ................ 72 45 68 72 71<br />
Trustees’ fees .................. 8 4 7 7 9<br />
Printing fees ................... 10 6 7 4 9<br />
Miscellaneous .................. 31 17 38 26 38<br />
Expenses before reductions ......... 3,587 2,163 4,261 2,738 4,208<br />
Expense reductions .............. (68) (235) (215) (261) —<br />
Net expenses ........................ 3,519 1,928 4,046 2,477 4,208<br />
Net investment income (loss) ............. 6,074 1,551 7,095 16,634 11,970<br />
Net Realized and Unrealized Gain (Loss)<br />
Net realized gain (loss) on:<br />
Investments .................... (67,847) (50,759) (63,112) 2,785 (72,517)<br />
Futures contracts ................ (13,376) (4,414) (19,413) 7,184 —<br />
Options written ................. — — (845) (2,146) —<br />
Credit default swap contracts ........ — — — 66 —<br />
Index swap contracts ............. — — (81) (282) —<br />
Interest rate swap contracts ......... — — — 431 —<br />
Foreign currency-related<br />
transactions .................. — — (4,186) 435 (54)<br />
Net realized gain (loss) ................. (81,223) (55,173) (87,637) 8,473 (72,571)<br />
Net change in unrealized appreciation<br />
(depreciation) on:<br />
Investments .................... (125,852) (46,331) (108,497) (37,544) (115,572)<br />
Futures contracts ................ 752 673 888 (245) —<br />
Options written ................. — — 2 (710) —<br />
Credit default swap contracts ........ — — — (998) —<br />
Index swap contracts ............. — — 5 (51) —<br />
Interest rate swap contracts ......... — — — (569) —<br />
Foreign currency-related<br />
transactions .................. — — 1,213 (396) (6)<br />
Net change in unrealized appreciation<br />
(depreciation) ...................... (125,100) (45,658) (106,389) (40,513) (115,578)<br />
Net realized and unrealized gain (loss) ....... (206,323) (100,831) (194,026) (32,040) (188,149)<br />
Net Increase (Decrease) in Net Assets<br />
from Operations ................ $ (200,249) $ (99,280) $ (186,931) $ (15,406) $ (176,179)<br />
See accompanying notes which are an integral part of the financial statements.<br />
Statements of Operations 91
Russell Investment Funds<br />
Statements of Changes in Net Assets — For the Fiscal Years Ended December 31,<br />
Multi-Style Equity<br />
Fund<br />
Aggressive Equity<br />
Fund<br />
Amounts in thousands 2008 2007 2008 2007<br />
Increase (Decrease) in Net Assets<br />
Operations<br />
Net investment income (loss) ........................ $ 6,074 $ 4,740 $ 1,551 $ 925<br />
Net realized gain (loss) ............................ (81,223) 42,430 (55,173) 19,170<br />
Net change in unrealized appreciation (depreciation) ....... (125,100) (3,082) (45,658) (12,030)<br />
Net increase (decrease) in net assets from operations ............. (200,249) 44,088 (99,280) 8,065<br />
Distributions<br />
From net investment income ........................ (5,806) (4,459) (1,578) (866)<br />
From net realized gain ............................ (3,972) (19,120) (44) (29,590)<br />
Net decrease in net assets from distributions .................. (9,778) (23,579) (1,622) (30,456)<br />
Share Transactions<br />
Net increase (decrease) in net assets from share transactions .. 28,316 41,906 (4,937) 27,672<br />
Total Net Increase (Decrease) in Net Assets ............ (181,711) 62,415 (105,839) 5,281<br />
Net Assets<br />
Beginning of period .............................. 479,922 417,507 228,927 223,646<br />
End of period .................................. $ 298,211 $ 479,922 $ 123,088 $ 228,927<br />
Undistributed (overdistributed) net investment income included in net<br />
assets ........................................... $ 1,690 $ 1,423 $ — $ —<br />
See accompanying notes which are an integral part of the financial statements.<br />
92 Statements of Changes in Net Assets
Non-U.S.<br />
Fund<br />
Core Bond<br />
Fund<br />
Real Estate<br />
Securities Fund<br />
2008 2007 2008 2007 2008 2007<br />
$ 7,095 $ 6,991 $ 16,634 $ 15,000 $ 11,970 $ 10,443<br />
(87,637) 47,882 8,473 3,830 (72,571) 51,349<br />
(106,389) (16,201) (40,513) 3,043 (115,578) (159,351)<br />
(186,931) 38,672 (15,406) 21,873 (176,179) (97,559)<br />
— (10,855) (14,176) (16,240) (8,443) (13,544)<br />
(3,345) (75,619) (6,979) — — (65,161)<br />
(3,345) (86,474) (21,155) (16,240) (8,443) (78,705)<br />
14,340 109,604 9,603 74,651 (771) 39,596<br />
(175,936) 61,802 (26,958) 80,284 (185,393) (136,668)<br />
431,686 369,884 346,067 265,783 488,809 625,477<br />
$ 255,750 $ 431,686 $ 319,109 $ 346,067 $ 303,416 $ 488,809<br />
$ 1,726 $ (1,232) $ 2,838 $ 14 $ 4,013 $ (62)<br />
See accompanying notes which are an integral part of the financial statements.<br />
Statements of Changes in Net Assets 93
Russell Investment Funds<br />
Financial Highlights — For the Fiscal Years Ended<br />
For a Share Outstanding Throughout Each Period.<br />
$<br />
Net Asset Value,<br />
Beginning of<br />
Period<br />
Multi-Style Equity Fund<br />
$<br />
Net<br />
Investment<br />
Income (Loss)(a)<br />
$<br />
Net Realized<br />
and Unrealized<br />
Gain (Loss)<br />
$<br />
Total Income<br />
(Loss) from<br />
Operations<br />
$<br />
Distributions<br />
from Net<br />
Investment Income<br />
$<br />
Distributions<br />
from Net<br />
Realized Gain<br />
$<br />
Total<br />
Distributions<br />
December 31, 2008 15.65 .19 (6.52) (6.33) (.19) (.13) (.32)<br />
December 31, 2007 14.93 .16 1.37 1.53 (.16) (.65) (.81)<br />
December 31, 2006 13.37 .14 1.55 1.69 (.13) — (.13)<br />
December 31, 2005 12.60 .12 .79 .91 (.14) — (.14)<br />
December 31, 2004 11.56 .11 1.02 1.13 (.09) — (.09)<br />
Aggressive Equity Fund<br />
December 31, 2008 12.99 .09 (5.81) (5.72) (.09) —(c) (.09)<br />
December 31, 2007 14.45 .06 .40 .46 (.05) (1.87) (1.92)<br />
December 31, 2006 14.40 .03 2.10 2.13 (.03) (2.05) (2.08)<br />
December 31, 2005 14.90 .03 .90 .93 (.03) (1.40) (1.43)<br />
December 31, 2004 13.47 .02 1.95 1.97 (.02) (.52) (.54)<br />
Non-U.S. Fund<br />
December 31, 2008 13.20 .21 (5.83) (5.62) — (.10) (.10)<br />
December 31, 2007 15.01 .25 1.14 1.39 (.38) (2.82) (3.20)<br />
December 31, 2006 12.68 .23 2.75 2.98 (.35) (.30) (.65)<br />
December 31, 2005 11.33 .16 1.38 1.54 (.19) — (.19)<br />
December 31, 2004 9.76 .11 1.66 1.77 (.20) — (.20)<br />
Core Bond Fund<br />
December 31, 2008 10.32 .47 (.86) (.39) (.39) (.21) (.60)<br />
December 31, 2007 10.14 .51 .20 .71 (.53) — (.53)<br />
December 31, 2006 10.23 .45 (.08) .37 (.46) — (.46)<br />
December 31, 2005 10.50 .38 (.17) .21 (.37) (.11) (.48)<br />
December 31, 2004 10.47 .24 .24 .48 (.26) (.19) (.45)<br />
Real Estate Securities Fund<br />
December 31, 2008 15.22 .38 (6.03) (5.65) (.27) — (.27)<br />
December 31, 2007 21.34 .35 (3.68) (3.33) (.47) (2.32) (2.79)<br />
December 31, 2006 17.28 .37 5.72 6.09 (.39) (1.64) (2.03)<br />
December 31, 2005 17.09 .32 1.82 2.14 (.37) (1.58) (1.95)<br />
December 31, 2004 13.71 .36 4.33 4.69 (.36) (.95) (1.31)<br />
See accompanying notes which are an integral part of the financial statements.<br />
94 Financial Highlights
$<br />
Net Asset Value,<br />
End of<br />
Period<br />
%<br />
Total<br />
Return<br />
$<br />
Net Assets,<br />
End of Period<br />
(000)<br />
%<br />
Ratio of Expenses<br />
to Average<br />
Net Assets,<br />
Net(b)<br />
%<br />
Ratio of Expenses<br />
to Average<br />
Net Assets,<br />
Gross<br />
%<br />
Ratio of Net<br />
Investment Income<br />
to Average<br />
Net Assets(b)<br />
%<br />
Portfolio<br />
Turnover Rate<br />
9.00 (41.15) 298,211 .87 .89 1.50 135<br />
15.65 10.36 479,922 .87 .87 1.04 136<br />
14.93 12.75 417,507 .87 .87 1.03 128<br />
13.37 7.27 349,659 .83 .87 .94 130<br />
12.60 9.81 332,759 .87 .88 .96 123<br />
7.18 (44.16) 123,088 1.05 1.18 .84 161<br />
12.99 3.42 228,927 1.05 1.13 .39 180<br />
14.45 14.79 223,646 1.05 1.12 .16 184<br />
14.40 6.36 204,292 .99 1.13 .21 130<br />
14.90 14.73 195,583 1.05 1.17 .17 150<br />
7.48 (42.79) 255,750 1.15 1.21 2.01 123<br />
13.20 10.12 431,686 1.15 1.18 1.70 106<br />
15.01 23.64 369,884 1.15 1.21 1.64 111<br />
12.68 13.69 302,261 1.12 1.26 1.41 88<br />
11.33 18.30 258,766 1.15 1.28 1.11 73<br />
9.33 (3.87) 319,109 .70 .77 4.70 164<br />
10.32 7.24 346,067 .70 .78 5.04 965<br />
10.14 3.72 265,783 .70 .73 4.40 453<br />
10.23 2.01 216,774 .70 .72 3.70 193<br />
10.50 4.66 175,851 .70 .73 2.41 216<br />
9.30 (37.76) 303,416 .96 .96 2.72 71<br />
15.22 (15.86) 488,809 .92 .92 1.75 77<br />
21.34 35.84 625,477 .90 .91 1.86 53<br />
17.28 12.96 443,092 .91 .91 1.86 64<br />
17.09 34.88 379,733 .92 .92 2.43 47<br />
See accompanying notes which are an integral part of the financial statements.<br />
Financial Highlights 95
Russell Investment Funds<br />
Notes to Financial Highlights — December 31, 2008<br />
(a)<br />
(b)<br />
(c)<br />
Average month-end shares outstanding were used for this calculation.<br />
May reflect amounts waived and/or reimbursed by RIMCo and/or RFSC custody credit arrangements.<br />
Less than $.01 per share.<br />
See accompanying notes which are an integral part of the financial statements.<br />
96 Notes to Financial Highlights
Russell Investment Funds<br />
Notes to Financial Statements — December 31, 2008<br />
1. Organization<br />
Russell Investment Funds (the “Investment Company” or “RIF”) is a series investment company with nine different investment<br />
portfolios referred to as Funds. These financial statements report on five of these Funds (each a “Fund” and collectively the<br />
“Funds”). The Investment Company provides the investment base for one or more variable insurance products issued by one or<br />
more insurance companies. These Funds are offered at net asset value to qualified insurance company separate accounts offering<br />
variable insurance products. The Investment Company is registered under the Investment Company Act of 1940, as amended, as<br />
an open-end management investment company. It is organized and operates as a Massachusetts business trust under an amended<br />
and restated master trust agreement dated October 1, 2008. The Investment Company’s master trust agreement permits the Board<br />
of Trustees (the “Board”) to issue an unlimited number of shares of beneficial interest.<br />
Russell Investment Company (“RIMCo”) is the Funds’ adviser and Russell Fund Services Company (“RFSC”), a wholly-owned<br />
subsidiary of RIMCo, is the Funds’ administrator and transfer agent.<br />
2. Significant Accounting Policies<br />
The Funds’ financial statements are prepared in accordance with accounting principles generally accepted in the United States of<br />
America (“GAAP”) which require the use of management estimates and assumptions at the date of the financial statements.<br />
Actual results could differ from those estimates. The following is a summary of the significant accounting policies consistently<br />
followed by each Fund in the preparation of its financial statements.<br />
Security Valuation<br />
The Funds value portfolio securities according to Board-approved securities valuation procedures and pricing services which<br />
include market value procedures, fair value procedures and a description of the pricing services used by the Funds. Debt<br />
obligation securities maturing within 60 days of the time of purchase are priced using the amortized cost method of valuation,<br />
unless the Board determines that amortized cost does not represent market value of short-term debt obligations. The Board has<br />
delegated the responsibility for administration of the securities valuation procedures to RFSC.<br />
Ordinarily, the Funds value each portfolio security based on market quotations provided by pricing services or alternative pricing<br />
services or dealers (when permitted by the market value procedures). Generally, Fund securities are valued at the close of the<br />
market on which they are traded as follows:<br />
• U.S. listed equities, equity and fixed income options and Rights/Warrants: Last sale price; last bid price if no last sale price.<br />
• U.S. over-the-counter equities: Official closing price; last bid price if no closing price.<br />
• Listed ADRs/GDRs: Last sale price; last bid price if no last sale price.<br />
• Municipal bonds, U.S. bonds, Eurobonds/foreign bonds: Evaluated bid price; broker quote if no evaluated bid price.<br />
• Futures: Settlement price.<br />
• Bank loans and forwards: Mean between bid and asking price.<br />
• Investments in other mutual funds are valued at their net asset value per share, calculated at 4 p.m. Eastern time or as of the<br />
close of the New York Stock Exchange, whichever is earlier;<br />
• The value of swap agreements is equal to the Funds’ obligation (or rights) under swap contracts which will generally be equal to<br />
the net amounts to be paid or received under the contracts based upon the relative values of the positions held by each party to<br />
the contracts.<br />
• Equity securities traded on a national foreign securities exchange or a foreign over the counter market are valued on the basis<br />
of the official closing price, or lacking the official closing price, at the last sale price of the primary exchange on which the<br />
security is traded.<br />
If market quotations are not readily available for a security or if subsequent events suggest that a market quotation is not reliable,<br />
the Funds will use the security’s fair value, as determined in accordance with the fair value procedures. The effect of fair value<br />
pricing is that securities may not be priced on the basis of quotations from the primary market in which they are traded, but rather<br />
may be priced by another method that the Board believes reflects fair value. The fair value procedures may involve subjective<br />
judgments as to the fair value of securities. The use of fair value pricing by a Fund may cause the net asset value of its shares to<br />
differ significantly from the net asset value that would be calculated using normal pricing methods. Fair value pricing could also<br />
cause discrepancies between the daily movement of the value of Fund shares and the daily movement of the benchmark index if<br />
the index is valued using another pricing method.<br />
This policy is intended to assure that the Funds’ net asset values fairly reflect security values as of the time of pricing. Events or<br />
circumstances affecting the values of Fund securities that occur between the closing of the principal markets on which they trade<br />
Notes to Financial Statements 97
Russell Investment Funds<br />
Notes to Financial Statements, continued — December 31, 2008<br />
and the time the net asset value of Fund shares is determined may be reflected in the calculation of net asset values for each<br />
applicable Fund when the Funds deem that the particular event or circumstance would materially affect such Fund’s net asset<br />
value. Funds that invest primarily in frequently traded exchange-listed securities will use fair value pricing in limited<br />
circumstances since reliable market quotations will often be readily available. Funds that invest in foreign securities are likely to<br />
use fair value pricing more often since significant events may occur between the close of foreign markets and the time of pricing<br />
which would trigger fair value pricing of the foreign securities. Funds that invest in low-rated debt securities are also likely to use<br />
fair value pricing more often since the markets in which such securities are traded are generally thinner, more limited and less<br />
active than those for higher rated securities. Examples of events that could trigger fair value pricing of one or more securities are:<br />
a material market movement of the U.S. securities market (defined in the fair value procedures as the movement by a single major<br />
U.S. Index greater than a certain percentage) or other significant event; foreign market holidays if on a daily basis, Fund exposure<br />
exceeds 20% in aggregate (all closed markets combined); a company development; a natural disaster; or an armed conflict.<br />
Because foreign securities can trade on non-business days, the net asset value of a Fund’s portfolio that includes foreign<br />
securities may change on days when shareholders will not be able to purchase or redeem fund shares.<br />
The Funds adopted Financial Accounting Standards Board (“FASB”) Statement of Financial Accounting Standards No. 157, Fair<br />
Value Measurements (“SFAS 157”), effective January 1, 2008. In accordance with SFAS 157, fair value is defined as the price<br />
that the Funds would receive upon selling an investment in a timely transaction to an independent buyer in the principal or most<br />
advantageous market of the investment. SFAS 157 established a three-tier hierarchy to maximize the use of observable market<br />
data and minimize the use of unobservable inputs and to establish classification of fair value measurements for disclosure<br />
purposes. Inputs refer broadly to the assumptions that market participants would use in pricing the asset, including assumptions<br />
about risk, for example, the risk inherent in a particular valuation technique used to measure fair value including a pricing model<br />
and/or risk inherent in the inputs to the valuation technique. Inputs may be observable or unobservable. Observable inputs are<br />
inputs that reflect the assumptions market participants would use in pricing the asset or liability developed based on market data<br />
obtained from sources independent of the reporting entity. Unobservable inputs are inputs that reflect the reporting entity’s own<br />
assumptions about the assumptions market participants would use in pricing the asset or liability developed based on the best<br />
information available in the circumstances.<br />
The three-tier hierarchy of inputs is summarized in the three broad levels listed below.<br />
• Level 1 — quoted prices in active markets for identical investments<br />
• Level 2 — other significant observable inputs (including quoted prices for similar investments, interest rates, prepayment<br />
speeds, credit risk, etc.)<br />
• Level 3 — significant unobservable inputs (including the Fund’s own assumptions in determining the fair value of investments)<br />
Inputs used in valuing the Funds’ investments for the period ended December 31, 2008 were as follows:<br />
Multi-Style Equity Fund Aggressive Equity Fund Non-U.S. Fund Core Bond Fund Real Estate Securities Fund<br />
Investments in<br />
Securities<br />
Other<br />
Financial<br />
Instruments*<br />
Investments in<br />
Securities<br />
Other<br />
Financial<br />
Instruments*<br />
Investments in<br />
Securities<br />
Other<br />
Financial<br />
Instruments*<br />
Investments in<br />
Securities<br />
Other<br />
Financial<br />
Instruments*<br />
Investments in<br />
Securities<br />
Other<br />
Financial<br />
Instruments*<br />
Level 1 $296,447,366 $453,685 $123,627,485 $ — $ 35,318,532 $ 517,979 $ 18,660,205 $ 2,323,435 $307,683,502 $1,186<br />
Level 2 50,487,111 — 48,270,567 — 234,621,187 1,596,563 394,433,028 (3,834,515) 94,573,469 —<br />
Level 3 — — 427,560 643,365 11,611 — 3,687,314 — — —<br />
$346,934,477 $453,685 $172,325,612 $643,365 $269,951,330 $2,114,542 $416,780,547 $(1,511,080) $402,256,971 $1,186<br />
* Other financial instruments not reflected in the Schedule of Investments, such as futures, forwards and swap contracts, which are valued at the unrealized<br />
appreciation/depreciation on the instruments.<br />
A reconciliation of investments in which significant unobservable inputs (Level 3) were used in determining a value for the period<br />
ending December 31, 2008 were as follows:<br />
Multi-Style<br />
Equity Fund<br />
Aggressive<br />
Equity Fund<br />
Non-U.S.<br />
Fund<br />
Core Bond<br />
Fund<br />
Balance as of 01/01/08 $ 429 $ 469,884 $ — $ 3,137,866<br />
Accrued discounts/(premiums) — — — 8,834<br />
Realized gain/(loss) — (14,639) (54,802) 246,309<br />
Net change in unrealized appreciation/(depreciation) from investments still held as<br />
of 12/31/08 (429) 601,041 26,303 (1,492,869)<br />
Net purchases (sales) — 14,639 40,110 2,734,716<br />
Net transfers in and/or out of Level 3 — — — (947,542)<br />
Balance as of 12/31/08 $ — $ 1,070,925 $ 11,611 $ 3,687,314<br />
98 Notes to Financial Statements
Russell Investment Funds<br />
Notes to Financial Statements, continued — December 31, 2008<br />
In March 2008, the Financial Accounting Standards Board (“FASB”) issued Statement of Financial Accounting Standards<br />
No. 161, “Disclosures about Derivative Instruments and Hedging Activities” (“SFAS 161”). SFAS 161 is effective for fiscal years<br />
or interim periods beginning after November 15, 2008. SFAS 161 requires enhanced disclosures about the Funds’ derivative and<br />
hedging activities. Management is currently evaluating the impact the adoption of SFAS 161 will have on the Funds’ financial<br />
statements disclosures.<br />
Investment Transactions<br />
Investment transactions are recorded on a trade date basis. Realized gains and losses from securities transactions, if any, are<br />
recorded on the basis of specific identified cost incurred by each money manager within a particular Fund.<br />
Investment Income<br />
Dividend income is recorded net of applicable withholding taxes on the ex-dividend date, except that certain dividends from<br />
foreign securities are recorded as soon thereafter as the Funds are informed of the ex-dividend date. Interest income is recorded<br />
daily on the accrual basis. The Core Bond Fund classifies gains and losses realized on prepayments received on mortgage-backed<br />
securities as part of interest income. All premiums and discounts, including original issue discounts, are amortized/accreted<br />
using the interest method.<br />
Federal Income Taxes<br />
Since the Investment Company is a Massachusetts business trust, each Fund is a separate corporate taxpayer and determines its<br />
net investment income and capital gains (or losses) and the amounts to be distributed to each Fund’s shareholders without regard<br />
to the income and capital gains (or losses) of the other Funds.<br />
It is each Fund’s intention to qualify as a regulated investment company and distribute all of its taxable income and capital gains.<br />
Therefore, no federal income tax provision is required for the Funds.<br />
In accordance with the provisions set forth in the FASB issued Interpretation No. 48, “Accounting for Uncertainty in Income<br />
Taxes, an Interpretation of FASB Statement 109” (“FIN 48”), management has reviewed the Funds’ tax positions for all open tax<br />
years, and concluded that adoption had no effect on the Funds’ financial position or results of operations. At December 31, 2008,<br />
the Funds have recorded no liabilities for net unrecognized tax benefits relating to uncertain income tax positions they have taken<br />
or expect to take in future tax returns.<br />
Each Fund files a U. S. tax return. While the statute of limitations remains open to examine the Funds’ U.S. tax returns filed for<br />
the fiscal years ending December 31, 2005 through December 31, 2007, no examinations are in progress or anticipated at this<br />
time. The Funds are not aware of any tax positions for which it is reasonably possible that the total amounts of unrecognized tax<br />
benefits will significantly change in the next twelve months.<br />
Dividends and Distributions to Shareholders<br />
For all Funds, income and capital gain distributions, if any, are recorded on the ex-dividend date. Income distributions are<br />
generally declared and paid quarterly, except for the Non-U.S. Fund, which generally declares and pays income distributions<br />
annually. Capital gain distributions are generally declared and paid annually. An additional distribution may be paid by the<br />
Funds to avoid imposition of federal income and excise tax on any remaining undistributed capital gains and net investment<br />
income.<br />
The timing and characterization of certain income and capital gain distributions are determined in accordance with federal tax<br />
regulations which may differ from GAAP. As a result, net investment income and net realized gain (or loss) from investment and<br />
foreign currency-related transactions for a reporting period may differ significantly from distributions during such period. The<br />
differences between tax regulations and GAAP relate primarily to investments in options, futures, forward contracts, swap<br />
contracts, passive foreign investment companies, foreign-denominated investments, mortgage-backed securities, certain securities<br />
sold at a loss and capital loss carryforwards.<br />
Expenses<br />
The Funds will pay their own expenses other than those expressly assumed by RIMCo or RFSC. Most expenses can be directly<br />
attributed to the individual Funds. Expenses which cannot be directly attributed to a specific Fund are allocated among all Funds<br />
principally based on their relative net assets.<br />
Notes to Financial Statements 99
Russell Investment Funds<br />
Notes to Financial Statements, continued — December 31, 2008<br />
Foreign Currency Translations<br />
The books and records of the Funds are maintained in U.S. dollars. Foreign currency amounts and transactions of the Funds are<br />
translated into U.S. dollars on the following basis:<br />
(a) Market value of investment securities, other assets and liabilities at the closing rate of exchange on the valuation date.<br />
(b) Purchases and sales of investment securities and income at the closing rate of exchange prevailing on the respective trade<br />
dates of such transactions.<br />
Net realized gains or losses from foreign currency-related transactions arise from: sales and maturities of short-term securities;<br />
sales of foreign currencies; currency gains or losses realized between the trade and settlement dates on securities transactions; the<br />
difference between the amounts of dividends, interest, and foreign withholding taxes recorded on the Non-U.S. Fund’s books and<br />
the U.S. dollar equivalent of the amounts actually received or paid. Net unrealized gains or losses from foreign currency-related<br />
transactions arise from changes in the value of assets and liabilities, other than investments in securities, at year-end, as a result<br />
of changes in the exchange rates.<br />
The Funds do not isolate that portion of the results of operations of the Funds that arises as a result of changes in exchange rates<br />
from that portion that arises from changes in market prices of investments during the year. Such fluctuations are included with the<br />
net realized and unrealized gain or loss from investments. However, for federal income tax purposes the Funds do isolate the<br />
effects of changes in foreign exchange rates from the fluctuations arising from changes in market prices for realized gain (or loss)<br />
on debt obligations.<br />
Capital Gains Taxes<br />
The Non-U.S. Fund may be subject to capital gains taxes and repatriation taxes imposed by certain countries in which it invests.<br />
The Non-U.S. Fund may record a deferred tax liability in respect of unrealized appreciation on foreign securities for potential<br />
capital gains and repatriation taxes at December 31, 2008. The accrual for capital gains and repatriation taxes is included in net<br />
unrealized appreciation (depreciation) on investments in the Statements of Assets and Liabilities for the Fund. The amounts<br />
related to capital gains taxes are included in net realized gain (loss) on investments in the Statements of Operations for the Fund.<br />
The Non-U.S. Fund had no deferred tax liability but incurred $3,749 in capital gains taxes for the period ended December 31,<br />
2008.<br />
Derivatives<br />
To the extent permitted by the investment objectives, restrictions and policies set forth in the Funds’ Prospectus and Statement of<br />
Additional Information, the Funds may participate in various derivative-based transactions. Derivative securities are instruments<br />
or agreements whose value is derived from an underlying security or index. They include options, futures, swaps, forwards,<br />
structured notes and stripped securities. These instruments offer unique characteristics and risks that assist the Funds in meeting<br />
its investment strategies.<br />
The Funds typically use derivatives in three ways: exposing cash reserves to markets, hedging and return enhancement. The<br />
Funds, other than the Real Estate Securities Fund, may pursue their strategy to be fully invested by exposing cash reserves to the<br />
performance of appropriate markets by purchasing securities and/or derivatives. This is intended to cause the Funds to perform as<br />
though their cash reserves were actually invested in those markets. Hedging is also used by some Funds to limit or control risks,<br />
such as adverse movements in exchange rates and interest rates. Return enhancement can be accomplished through the use of<br />
derivatives in a Fund. By purchasing certain instruments, Funds may more effectively achieve the desired portfolio<br />
characteristics that assist them in meeting their investment objectives. Depending on how the derivatives are structured and<br />
utilized, the risks associated with them may vary widely. These risks are generally categorized as market risk, liquidity risk and<br />
counterparty or credit risk.<br />
Foreign Currency Exchange Contracts<br />
In connection with investment transactions consistent with the Funds’ investment objective and strategies, certain Funds may<br />
enter into foreign currency exchange spot contracts and forward foreign currency exchange contracts (“contracts”). From time to<br />
time the Funds may enter into contracts to hedge certain foreign currency-denominated assets. Contracts are recorded at market<br />
value. Certain risks may arise upon entering into these contracts from the potential inability of counterparties to meet the terms of<br />
their contracts and are generally limited to the amount of unrealized gain on the contracts, if any, that are recognized in the<br />
Statements of Assets and Liabilities. Realized gains or losses arising from such transactions are included in net realized gain (or<br />
loss) from foreign currency-related transactions.<br />
100 Notes to Financial Statements
Russell Investment Funds<br />
Notes to Financial Statements, continued — December 31, 2008<br />
Forward Commitments<br />
Certain Funds may contract to purchase securities for a fixed price at a future date beyond customary settlement time consistent<br />
with a Fund’s ability to manage its investment portfolio and meet redemption requests. The price of the underlying securities and<br />
the date when the securities will be delivered and paid for are fixed at the time the transaction is negotiated. The Funds may<br />
dispose of a forward commitment transaction prior to settlement if it is appropriate to do so and realize short-term gains (or losses)<br />
upon such sale. When effecting such transactions, cash or liquid high-grade debt obligations of the Fund in a dollar amount<br />
sufficient to make payment for the portfolio securities to be purchased will be segregated on the Fund’s records at the trade date<br />
and maintained until the transaction is settled. A forward commitment transaction involves a risk of loss if the value of the<br />
security to be purchased declines prior to the settlement date or the other party to the transaction fails to complete the<br />
transaction.<br />
Loan Agreements<br />
The Core Bond Fund may invest in direct debt instruments which are interests in amounts owed by corporate, governmental, or<br />
other borrowers to lenders or lending syndicates. A Fund’s investments in loans may be in the form of participations in loans or<br />
assignments of all or a portion of loans from third parties. A loan is often administered by a bank or other financial institution (the<br />
“lender”) that acts as agent for all holders. The agent administers the terms of the loan, as specified in the loan agreement. When<br />
investing in a loan participation, a Fund has the right to receive payments of principal, interest and any fees to which it is entitled<br />
only from the lender selling the loan agreement and only upon receipt by the lender of payments from the borrower. A Fund<br />
generally has no right to enforce compliance with the terms of the loan agreement with the borrower. As a result, a Fund may be<br />
subject to the credit risk of both the borrower and the lender that is selling the loan agreement. When a Fund purchases<br />
assignments from lenders it acquires direct rights against the borrower on the loan. For the period ended December 31, 2008,<br />
there were no unfunded loan commitments in the Core Bond Fund.<br />
Options<br />
The Funds may purchase and sell (write) call and put options on securities and securities indices, provided such options are<br />
traded on a national securities exchange or in an over-the-counter market. The Funds may also purchase and sell call and put<br />
options on foreign currencies. The domestic equity Funds may utilize options to equitize liquidity reserve balances.<br />
When a Fund writes a covered call or a put option, an amount equal to the premium received by the Fund is included in the<br />
Fund’s Statement of Assets and Liabilities as an asset and as an equivalent liability. The amount of the liability is subsequently<br />
marked-to-market to reflect the current market value of the option written. The Fund receives a premium on the sale of a call<br />
option but gives up the opportunity to profit from any increase in stock value above the exercise price of the option, and when the<br />
Fund writes a put option it is exposed to a decline in the price of the underlying security.<br />
Whether an option which the Fund has written expires on its stipulated expiration date or the Fund enters into a closing purchase<br />
transaction, the Fund realizes a gain (or loss, if the cost of a closing purchase transaction exceeds the premium received when the<br />
option was sold) without regard to any unrealized gain or loss on the underlying security, and the liability related to such option is<br />
extinguished. If a call option which the Fund has written is exercised, the Fund realizes a capital gain or loss from the sale of the<br />
underlying security, and the proceeds from such sale are increased by the premium originally received. When a put option which<br />
a Fund has written is exercised, the amount of the premium originally received will reduce the cost of the security which a Fund<br />
purchases upon exercise of the option. Realized gains (losses) on purchased options are included in net realized gain (loss) from<br />
investments on the Statements of Operations.<br />
The Funds’ use of written options involves, to varying degrees, elements of market risk in excess of the amount recognized in the<br />
Statement of Assets and Liabilities. The face or contract amounts of these instruments reflect the extent of the Funds’ exposure to<br />
market risk. The risks may be caused by an imperfect correlation between movements in the price of the instrument and the price<br />
of the underlying securities and interest rates.<br />
A Fund may enter into a swaption (swap option). In a swaption, in exchange for an option, the buyer gains the right but not the<br />
obligation to enter into a specified swap agreement with the issuer on a specified future date. The writer of the contract receives<br />
the premium and bears the risk of unfavorable changes in the preset rate on the underlying interest rate swap. Unrealized gains/<br />
losses on swaptions are reflected in investment assets and investment liabilities in the Fund’s Statement of Assets and Liabilities.<br />
Futures Contracts<br />
The Funds may invest in futures contracts (i.e., interest rate, foreign currency and index futures contracts) to a limited extent. The<br />
face or contract amounts of these instruments reflect the extent of the Funds’ exposure to off balance sheet risk. The primary risks<br />
associated with the use of futures contracts are an imperfect correlation between the change in market value of the securities held<br />
by the Fund and the prices of futures contracts and the possibility of an illiquid market. Upon entering into a futures contract, the<br />
Notes to Financial Statements 101
Russell Investment Funds<br />
Notes to Financial Statements, continued — December 31, 2008<br />
Funds are required to deposit with a broker an amount, termed the initial margin, which typically represents 5% of the purchase<br />
price indicated in the futures contract. Payments to and from the broker, known as variation margin, are required to be made on a<br />
daily basis as the price of the futures contract fluctuates. Changes in initial settlement value are accounted for as unrealized<br />
appreciation (depreciation) until the contracts are terminated, at which time realized gains and losses are recognized. As of<br />
December 31, 2008, included in the Statement of Assets and Liabilities, the Funds had a cash collateral balances in connection<br />
with futures contracts purchased (sold) as follows:<br />
Cash Collateral<br />
Multi-Style Equity Fund $ 3,700,000<br />
Aggressive Equity Fund 1,600,000<br />
Non-U.S. Fund 7,642,092<br />
Core Bond Fund 1,088,659<br />
Swap Agreements<br />
The Funds may enter into swap agreements, on either an asset-based or liability-based basis, depending on whether they are<br />
hedging their assets or their liabilities, and will usually enter into swaps on a net basis, i.e., the two payment streams are netted<br />
out, with the Funds receiving or paying, as the case may be, only the net amount of the two payments. When a Fund engages in a<br />
swap, it exchanges its obligations to pay or rights to receive payments for the obligations or rights to receive payments of another<br />
party (i.e., an exchange of floating rate payments for fixed rate payments).<br />
Certain Funds may enter into several different types of agreements including interest rate, credit default and currency swaps. The<br />
Funds may enter into index swap agreements as an additional hedging strategy for cash reserves held by those Funds or to effect<br />
investment transactions consistent with those objectives and strategies. Interest rate swaps are a counterparty agreement, can be<br />
customized to meet each party’s needs, and involve the exchange of a fixed payment per period for a payment that is not fixed.<br />
Currency swaps are an agreement where two parties exchange specified amounts of different currencies which are followed by a<br />
series of interest payments that are exchanged based on the principal cash flow. At maturity the principal amounts are exchanged<br />
back. Credit default swaps are a counterparty agreement which allows the transfer of third party credit risk (the possibility that an<br />
issuer will default on their obligation by failing to pay principal or interest in a timely manner) from one party to another. The<br />
lender faces the credit risk from a third party and the counterparty in the swap agrees to insure this risk in exchange for regular<br />
periodic payments.<br />
The Funds expect to enter into these transactions primarily to preserve a return or spread on a particular investment or portion of<br />
their portfolios or to protect against any increase in the price of securities they anticipate purchasing at a later date. The net<br />
amount of the excess, if any, of the Funds’ obligations over their entitlements with respect to each swap will be accrued on a daily<br />
basis and an amount of cash or liquid high-grade debt securities having an aggregate net asset value at least equal to the accrued<br />
excess will be segregated. To the extent that the Funds enter into swaps on other than a net basis, the amount maintained in a<br />
segregated account will be the full amount of the Funds’ obligations, if any, with respect to such interest rate swaps, accrued on a<br />
daily basis. The Funds will not enter into any swaps unless the unsecured senior debt or the claims-paying ability of the other<br />
party thereto is rated in the highest rating category of at least one nationally recognized rating organization at the time of entering<br />
into such transaction. If there is a default by the other party to such a transaction, the Funds will have contractual remedies<br />
pursuant to the agreement related to the transaction. The swap market has grown substantially in recent years with a large number<br />
of banks and investment banking firms acting both as principals and as agents utilizing standardized swap documentation. As a<br />
result, the swap market has become more liquid.<br />
A Fund may not receive the expected amount under a swap agreement if the other party to the agreement defaults or becomes<br />
bankrupt. The market for swap agreements is largely unregulated. The Funds will only enter into swap agreements with<br />
counterparties that would be eligible for consideration as repurchase agreement counterparties under the Funds’ repurchase<br />
agreement guidelines.<br />
As of December 31, 2008, included in the Statement of Assets and Liabilities, the Core Bond Fund had a cash collateral balance<br />
of $1,079,064 in connection with swaps contracts purchased (sold).<br />
Credit Default Swaps<br />
FASB issued FASB Staff Position (“FSP”) No. 133-1 and 45-4 “Disclosures about Credit Derivatives and Certain Guarantees”<br />
which requires enhanced disclosure about the Funds’ credit derivatives. Management adopted FSP No. 133-1 and 45-4 on<br />
12/31/2008.<br />
The Core Bond Fund may enter into credit default swaps. A credit default swap can refer to corporate issues, asset-backed<br />
securities or an index of assets, each known as the reference entity or underlying asset. The Fund may act as either the buyer or<br />
the seller of a credit default swap. In an unhedged credit default swap, the Fund enters into a credit default swap without owning<br />
102 Notes to Financial Statements
Russell Investment Funds<br />
Notes to Financial Statements, continued — December 31, 2008<br />
the underlying asset or debt issued by the reference entity. Credit default swaps allow the Fund to acquire or reduce credit<br />
exposure to a particular issuer, asset or basket of assets.<br />
As the seller in a credit default swap, the Fund would be required to pay the par or other agreed-upon value (or otherwise perform<br />
according to the swap contract) of a reference debt obligation to the counterparty in the event of a default (or other specified credit<br />
event); the counterparty would be required to surrender the reference debt obligation In return, the Fund would receive from the<br />
counterparty a periodic stream of payments over the term of the contract provided that no credit event has occurred. If no credit<br />
event occurs, the Fund would keep the stream of payments and would have no payment obligations.<br />
The Fund may also purchase credit default swap contracts in order to offset the risk of default of debt securities held in its<br />
portfolio, in which case the Fund would function as the counterparty referenced in the preceding paragraph.<br />
Credit default swap agreements on corporate issues involve one party making a stream of payments to another party in exchange<br />
for the right to receive a specified return in the event of a default or other credit event. If a credit event occurs and cash<br />
settlement is not elected, a variety of other deliverable obligations may be delivered in lieu of the specific referenced obligation.<br />
The ability to deliver other obligations may result in a cheapest-to-deliver option (the buyer of protection’s right to choose the<br />
deliverable obligation with the lowest value following a credit event). A Fund may use credit default swaps on corporate issues to<br />
provide a measure of protection against defaults of the issuers (i.e., to reduce risk where a Fund owns or has exposure to the<br />
referenced obligation) or to take an active long or short position with respect to the likelihood (as measured by the credit default<br />
swap’s spread) of a particular issuer’s default.<br />
Credit default swap agreements on asset-backed securities involve one party making a stream of payments to another party in<br />
exchange for the right to receive a specified return in the event of a default or other credit event. Unlike credit default swaps on<br />
corporate issues or sovereign issues of an emerging country, deliverable obligations in most instances would be limited to the<br />
specific referenced obligation as performance for asset-backed securities can vary across deals. Prepayments, principal<br />
paydowns, and other write-down or loss events on the underlying mortgage loans will reduce the outstanding principal balance of<br />
the referenced obligation. These reductions may be temporary or permanent as defined under the terms of the swap agreement<br />
and the notional amount for the swap agreement generally will be adjusted by corresponding amounts. A Fund may use credit<br />
default swaps on asset-backed securities to provide a measure of protection against defaults (or other defined credit events) of the<br />
referenced obligation or to take an active long or short position with respect to the likelihood of a particular referenced<br />
obligation’s default (or other defined credit events).<br />
Credit default swap agreements on credit indices involve one party making a stream of payments to another party in exchange for<br />
the right to receive a specified return in the event of a write-down, principal shortfall, interest shortfall or default of all or part of<br />
the referenced entities comprising the credit index. A credit index is of a basket of credit instruments or exposures designed to be<br />
representative of some part of the credit market as a whole. These indices are made up of reference credits that are judged by a<br />
poll of dealers to be the most liquid entities in the credit default swap market based on the sector of the index. Components of the<br />
indices may include, but are not limited to, investment grade securities, high yield securities, asset backed securities, emerging<br />
markets, and/or various credit ratings within each sector. Credit indices are traded using credit default swaps with standardized<br />
terms including a fixed spread and standard maturity dates. An index credit default swap references all the names in the index,<br />
and if there is a default, the credit event is settled based on that name’s weight in the index. The composition of the indices<br />
changes periodically, usually every six months, and for most indices, each name has an equal weight in the index. Traders may<br />
use credit-default swaps on indices to speculate on changes in credit quality.<br />
Implied credit spreads, represented in absolute terms, utilized in determining the market value of credit default swap agreements<br />
on corporate issues as of period end are disclosed in the Schedules of Investments and generally serve as an indicator of the<br />
current status of the payment/performance risk and represent the likelihood or risk of default (or other defined credit event) for<br />
the credit derivative. The implied credit spread of a particular referenced entity reflects the cost of entering into a credit default<br />
swap and may include upfront payments required to be made to enter into the agreement. For credit default swap agreements on<br />
asset-backed securities and credit indices, the quoted market prices and resulting values serve as the indicator of the current<br />
status of the payment/performance risk. Wider credit spreads and increasing market values, in absolute terms when compared to<br />
the notional amount of the swap, generally represent a deterioration of the referenced entity’s credit soundness and a greater<br />
likelihood or risk of default or other credit event occurring as defined under the terms of the agreement. The maximum potential<br />
amount of future payments (undiscounted) that a Fund as a seller of protection could be required to make under a credit default<br />
swap agreement would be an amount equal to the notional amount of the agreement. Notional amounts of all credit default swap<br />
agreements outstanding as of December 31, 2008 for which a Fund is the seller of protection are disclosed in the Schedules of<br />
Investments. These potential amounts would be partially offset by any recovery values of the respective referenced obligations,<br />
upfront payments received upon entering into the agreement, or net amounts received from the settlement of buy protection credit<br />
default swap agreements entered into by a Fund for the same referenced entity or entities.<br />
Credit default swaps could result in losses if the Fund does not correctly evaluate the creditworthiness of the company or<br />
companies on which the credit default swap is based. The Fund will generally incur a greater degree of risk when it sells a credit<br />
Notes to Financial Statements 103
Russell Investment Funds<br />
Notes to Financial Statements, continued — December 31, 2008<br />
default swap than when its purchases a credit default swap. As a buyer of credit default swap, the Fund may lose its investment<br />
and recover nothing should a credit event fail to occur and the swap is held to its termination date. As seller of a credit default<br />
swap, if a credit event were to occur, the value of any deliverable obligation received by the Fund, coupled with the upfront or<br />
periodic payments previously received, may be less than what it pays to the buyer, resulting in a loss of value to the Fund.<br />
If the creditworthiness of the Fund’s swap counterparty declines, the risk that the counterparty may not perform could increase,<br />
potentially resulting in a loss to the Fund. To limit the counterparty risk involved in swap agreements, the Funds will only enter<br />
into swap agreements with counterparties that meet certain standards of creditworthiness. Although there can be no assurance<br />
that the Fund will be able to do so, the Fund may be able to reduce or eliminate its exposure under a swap agreement either by<br />
assignment or other disposition, or by entering into an offsetting swap agreement with the same party or another creditworthy<br />
party. The Fund may have limited ability to eliminate its exposure under a credit default swap if the credit of the reference entity<br />
or underlying asset has declined.<br />
Swap agreements generally are entered into by “eligible participants” and in compliance with certain other criteria necessary to<br />
render them excluded from regulation under the Commodity Exchange Act (“CEA”) and, therefore not subject to regulation as<br />
futures or commodity option transactions under the CEA.<br />
Interest Rate Swaps<br />
The use of interest rate swaps is a highly specialized activity which involves investment techniques and risks different from those<br />
associated with ordinary portfolio securities transactions. If a money manager using this technique is incorrect in its forecast of<br />
market values, interest rates and other applicable factors, the investment performance of a Fund would diminish compared to<br />
what it would have been if this investment technique were not used.<br />
Interest rate swaps do not involve the delivery of securities or other underlying assets or principal. Accordingly, the risk of loss<br />
with respect to interest rate swaps is limited to the net amount of interest payments that the Funds are contractually obligated to<br />
make. If the other party to an interest rate swap defaults, the Funds’ risk of loss consists of the net amount of interest payments<br />
that the Funds are contractually entitled to receive. Since interest rate swaps are individually negotiated, the Funds expect to<br />
achieve an acceptable degree of correlation between their rights to receive interest on their portfolio securities and their rights<br />
and obligations to receive and pay interest pursuant to interest rate swaps.<br />
Index Swaps<br />
Certain Funds may enter into index swap agreements as an additional hedging strategy for cash reserves held by those Funds or to<br />
effect investment transactions consistent with these Funds’ investment objectives and strategies. Swap agreements are two party<br />
contracts entered into primarily by institutional investors for periods ranging from a few weeks to more than one year. In a<br />
standard transaction, the two parties agree to exchange the returns (or differentials in rates of return) earned or realized on<br />
particular investments or instruments. The returns to be exchanged between the parties are calculated with respect to a “notional<br />
amount” (i.e. a specified dollar amount that is hypothetically invested in a “basket” of securities representing a particular index).<br />
Investments in Emerging Markets<br />
Investing in emerging markets may involve special risks and considerations not typically associated with investing in the United<br />
States markets. These risks include revaluation of currencies, high rates of inflation, repatriation, restrictions on income and<br />
capital, and future adverse political and economic developments. Moreover, securities issued in these markets may be less liquid,<br />
subject to government ownership controls, delayed settlements, and their prices may be more volatile than those of comparable<br />
securities in the United States.<br />
Repurchase Agreements<br />
The Core Bond Fund may enter into repurchase agreements. A repurchase agreement is an agreement under which the Fund<br />
acquires a fixed income security from a commercial bank, broker or dealer and simultaneously agrees to resell such security to<br />
the seller at an agreed upon price and date (normally the next business day). The resale price reflects an agreed upon interest rate<br />
effective for the period the security is held by the Fund and is unrelated to the interest rate on the security. The securities<br />
acquired by the Fund constitute collateral for the repurchase obligation. In these transactions, the securities acquired by the<br />
104 Notes to Financial Statements
Russell Investment Funds<br />
Notes to Financial Statements, continued — December 31, 2008<br />
Fund (including accrued interest earned thereon) must have a total value in excess of the value of the repurchase agreement and<br />
must be held by the custodian bank until repurchased. In addition, RIMCo will monitor the Fund’s repurchase agreement<br />
transactions generally and will evaluate the credit worthiness of any bank, broker or dealer party to a repurchase agreement with<br />
the Fund. A Fund will not invest more than 15% (10% in the case of the Russell Money Market Fund) of its net assets (taken at<br />
current market value) in repurchase agreements maturing in more than seven days.<br />
Mortgage-Related and Other Asset-Backed Securities<br />
The Core Bond Fund may invest in mortgage or other asset-backed securities. These securities may include mortgage passthrough<br />
securities, collateralized mortgage obligations (“CMOs”), commercial mortgage-backed securities, mortgage dollar rolls,<br />
CMO residuals, stripped mortgage-backed securities (“SMBSs”) and other securities that directly or indirectly represent a<br />
participation in, or are secured by a payable from, mortgage loans on real property. The value of a Fund’s mortgage-backed<br />
securities (“MBS”) may be affected by, among other things, changes or perceived changes in interest rates, factors concerning the<br />
interests in and structure of the issuer or the originator of the mortgage, or the quality of the underlying assets. The quality and<br />
value of the underlying assets may decline, or default. This has become an increasing risk for collateral related to sub-prime, Alt-<br />
A and non-conforming mortgage loans, especially in a declining residential real estate market. In addition, regulatory or tax<br />
changes may adversely affect the mortgage securities markets as a whole.<br />
MBS often have stated maturities of up to thirty years when they are issued, depending upon the length of the mortgages<br />
underlying the securities. In practice however, unscheduled or early payments of principal and interest on the underlying<br />
mortgages may make the securities’ effective maturity shorter than this, and the prevailing interest rates may be higher or lower<br />
than the current yield of a Fund’s portfolio at the time the Fund receives the payments for reinvestment.<br />
Rising or high interest rates may result in slower than expected principal payments which may tend to extend the duration of<br />
MBS, making them more volatile and more sensitive to changes in interest rates. This is known as extension risk.<br />
MBS may have less potential for capital appreciation than comparable fixed income securities due to the likelihood of increased<br />
prepayments of mortgages resulting from foreclosures or declining interest rates. These foreclosed or refinanced mortgages are<br />
paid off at face value (par) or less, causing a loss, particularly for any investor who may have purchased the security at a premium<br />
or a price above par. In such an environment, this risk limits the potential price appreciation of these securities.<br />
Through its investments in MBS, including those that are issued by private issuers, the Fund has exposure to subprime loans, Alt-<br />
A loans and non-conforming loans as well as to the mortgage and credit markets generally. Private issuers include commercial<br />
banks, savings associations, mortgage companies, investment banking firms, finance companies and special purpose finance<br />
entities (called special purpose vehicles or SPVs) and other entities that acquire and package mortgage loans for resale as MBS.<br />
These privately issued non-governmental MBS may offer higher yields than those issue by government entities, but also may be<br />
subject to greater price changes than governmental issues. Subprime loans refer to loans made to borrowers with weakened credit<br />
histories or with a lower capacity to make timely payments on their loans. Alt-A loans refers to loans extended to borrowers who<br />
have incomplete documentation of income, assets, or other variables that are important to the credit underwriting processes. Nonconforming<br />
mortgages are loans that do not meet the standards that allow purchase by government-sponsored enterprises. MBS<br />
with exposure to subprime loans, Alt-A loans or non-conforming loans have had in many cases higher default rates than those<br />
loans that meet government underwriting requirements. The risk of non-payment is greater for MBS that are backed by mortgage<br />
pools that contain subprime, Alt-A and non-conforming loans, but a level of risk exists for all loans.<br />
Unlike MBS issued or guaranteed by the U.S. government or a government sponsored entity (e.g., Fannie Mae (the Federal<br />
National Mortgage Association) and Freddie Mac (the Federal Home Loan Mortgage Corporation)), MBS issued by private issuers<br />
do not have a government or government-sponsored entity guarantee, but may have credit enhancements provided by external<br />
entities such as banks or financial institutions or achieved through the structuring of the transaction itself. Examples of such<br />
credit support arising out of the structure of the transaction include the issue of senior and subordinated securities (e.g., the<br />
issuance of securities by an SPV in multiple classes or “tranches,” with one or more classes being senior to other subordinated<br />
classes as to the payment of principal and interest, with the result that defaults on the underlying mortgage loans are borne first<br />
by the holders of the subordinated class); creation of “reserve funds” (in which case cash or investments, sometimes funded from<br />
a portion of the payments on the underlying mortgage loans, are held in reserve against future losses); and “overcollateralization”<br />
(in which case the scheduled payments on, or the principal amount of, the underlying mortgage loans exceeds that required to<br />
make payment on the securities and pay any servicing or other fees). However, there can be no guarantee that credit<br />
enhancements, if any, will be sufficient to prevent losses in the event of defaults on the underlying mortgages loans. In addition,<br />
MBS that are issued by private issuers are not subject to the underwriting requirements for the underlying mortgage that are<br />
applicable to those MBS that have a government or government-sponsored entity guarantee. As a result, the mortgage loans<br />
underlying private MBS may, and frequently do, have less favorable collateral, credit risk or other underwriting characteristics<br />
than government or government-sponsored MBS and have wider variances in a number of terms including interest rate, term, size,<br />
purpose and borrower characteristics. Privately issued pools more frequently include second mortgages, high loan-to-value<br />
mortgages and manufactured housing loans. The coupon rates and maturities of the underlying mortgage loans in a private-label<br />
MBS pool may vary to a greater extent than those included in a government guaranteed pool, and the pool may include subprime<br />
mortgage loans.<br />
Notes to Financial Statements 105
Russell Investment Funds<br />
Notes to Financial Statements, continued — December 31, 2008<br />
Privately issued MBS are not traded on an exchange and there may be a limited market for the securities, especially when there is<br />
a perceived weakness in the mortgage and real estate market sectors. Without an active trading market, MBS held in a Fund’s<br />
portfolio may be particularly difficult to value because of the complexities involved in assessing the value of the underlying<br />
mortgage loans.<br />
Asset-backed securities may include MBS, loans, receivables or other assets. The value of the Fund’s asset-backed securities may<br />
be affected by, among other things, actual or perceived changes in interest rates, factors concerning the interests in and structure<br />
of the issuer or the originator of the receivables, the market’s assessment of the quality of underlying assets or actual or perceived<br />
changes in the credit worthiness of the individual borrowers, the originator, the servicing agent or the financial institution<br />
providing the credit support.<br />
Payment of principal and interest may be largely dependent upon the cash flows generated by the assets backing the securities.<br />
Rising or high interest rates tend to extend the duration of asset-backed securities, making them more volatile and more sensitive<br />
to changes in interest rates. The underlying assets are sometimes subject to prepayments which can shorten the security’s<br />
weighted average life and may lower its return. Defaults on loans underlying asset-backed securities have become an increasing<br />
risk for asset-backed securities that are secured by home-equity loans related to sub-prime, Alt-A or non-conforming mortgage<br />
loans, especially in a declining residential real estate market.<br />
Asset-backed securities (other than MBS) present certain risks that are not presented by MBS. Primarily, these securities may not<br />
have the benefit of any security interest in the related assets. Credit card receivables are generally unsecured and the debtors are<br />
entitled to the protection of a number of state and federal consumer credit laws, many of which give such debtors the right to set<br />
off certain amounts owed on the credit cards, thereby reducing the balance due. There is the possibility that recoveries on<br />
repossessed collateral may not, in some cases, be available to support payments on these securities. Asset-backed securities are<br />
often backed by a pool of assets representing the obligations of a number of different parties. To lessen the effect of failures by<br />
obligors on underlying assets to make payments, the securities may contain elements of credit support which fall into two<br />
categories: (i) liquidity protection, and (ii) protection against losses resulting from ultimate default by an obligor on the underlying<br />
assets. Liquidity protection refers to the provision of advances, generally by the entity administering the pool of assets, to ensure<br />
that the receipt of payments on the underlying pool occurs in a timely fashion. Protection against losses results from payment of<br />
the insurance obligations on at least a portion of the assets in the pool. This protection may be provided through guarantees,<br />
policies or letters of credit obtained by the issuer or sponsor from third parties, through various means of structuring the<br />
transaction or through a combination of such approaches. The Fund will not pay any additional or separate fees for credit support.<br />
The degree of credit support provided for each issue is generally based on historical information respecting the level of credit risk<br />
associated with the underlying assets. Delinquency or loss in excess of that anticipated or failure of the credit support could<br />
adversely affect the return on an investment in such a security. The availability of asset-backed securities may be affected by<br />
legislative or regulatory developments. It is possible that such developments may require the Fund to dispose of any then existing<br />
holdings of such securities.<br />
Inflation-Indexed Bonds<br />
The Core Bond Fund may invest in inflation-indexed bonds. Inflation-indexed bonds are fixed-income securities whose principal<br />
value is periodically adjusted to the rate of inflation. The interest rate on these bonds is generally fixed at issuance at a rate lower<br />
than typical bonds. Over the life of an inflation-indexed bond, however, interest will be paid based on a principal value, which is<br />
adjusted for inflation. Any increase in the principal amount of an inflation-indexed bond will be included as interest income in<br />
the Statement of Operations, even though investors do not receive their principal until maturity.<br />
Guarantees<br />
In the normal course of business the Funds enter into contracts that contain a variety of representations which provide general<br />
indemnifications. The Funds’ maximum exposure under these arrangements is unknown as this would involve future claims that<br />
may be made against the Funds that have not yet occurred. However, the Funds expect the risk of loss to be remote.<br />
Market and Credit Risk<br />
In the normal course of business the Funds trade financial instruments and enter into financial transactions where risk of<br />
potential loss exists due to changes in the market (market risk) or failure of the other party to a transaction to perform (credit<br />
risk). Similar to credit risk, the Funds may be exposed to counterparty risk or risk that an institution or other entity with which the<br />
Funds have unsettled or open transactions will default. The potential loss could exceed the value of the assets recorded in the<br />
financial statements (The “Assets”). Assets which potentially expose the Funds to credit risk consist principally of cash due from<br />
counterparties and investments. The extent of the Funds’ exposure to credit and counterparty risks in respect to the Assets<br />
approximates their carrying value as recorded in the Funds’ Statements of Assets and Liabilities.<br />
On September 15, 2008, Lehman Brothers Holdings Inc. filed for protection under Chapter 11 of the United States Bankruptcy<br />
Code. On September 19, 2008, a proceeding under the Securities Investor Protection Act (SIPA) was commenced with respect to<br />
106 Notes to Financial Statements
Russell Investment Funds<br />
Notes to Financial Statements, continued — December 31, 2008<br />
Lehman Brothers Inc., a broker-dealer. A trustee appointed under SIPA is administering the bankruptcy estate of Lehman<br />
Brothers Inc. Lehman Brothers International (Europe) was placed in administration under the UK Insolvency Act on<br />
September 15, 2008. Lehman Brothers Special Financing Inc., among other Lehman subsidiaries, filed for protection under<br />
Chapter 11 of the United States Bankruptcy Code on October 3, 2008. In connection with these filings, the Lehman Brothers<br />
group of companies (collectively “Lehman Brothers”) will be reorganized and/or liquidated in an orderly fashion, subject to court<br />
approval. Each Lehman Brothers entity is a separate legal entity that is subject to its own bankruptcy proceeding.<br />
The Core Bond Fund and Non-U.S. Fund had direct holdings swap agreements, and securities and derivatives transactions<br />
outstanding with Lehman Brothers entities as issuers or counterparties at the time the relevant Lehman Brothers entities filed for<br />
protection or were placed in administration. The direct holdings associated with Lehman Brothers have been written down to their<br />
estimated recoverable values. Unrealized gain on foreign exchange swaps or other derivatives transactions have been written down<br />
to zero, while anticipated losses for such transactions associated with Lehman Brothers have been incorporated as components of<br />
other liabilities on the Statement of Assets and Liabilities and net changes in realized gain (loss) or unrealized appreciation<br />
(depreciation) on the Statements of Operations.<br />
RIMCo or the Funds’ Money Managers have delivered notices of default and early termination to the relevant Lehman Brothers<br />
entities where required. For transactions with Lehman Brothers counterparties, RIMCo or the Funds’ Money Managers have<br />
terminated trades, obtained quotations from brokers for replacement trades and, where deemed appropriate, re-opened positions<br />
with new counterparties.<br />
3. Investment Transactions<br />
Securities<br />
During the period ended December 31, 2008, purchases and sales of investment securities (excluding U.S. Government and<br />
Agency obligations, short-term investments, options, futures and repurchase agreements) were as follows:<br />
Funds Purchases Sales<br />
Multi-Style Equity $ 519,431,909 $ 518,036,985<br />
Aggressive Equity 284,590,920 298,045,354<br />
Non-U.S. 395,527,830 394,931,403<br />
Core Bond 120,967,058 85,094,531<br />
Real Estate Securities 320,166,984 305,568,466<br />
Purchases and sales of U.S. Government and Agency obligations (excluding short-term investments, options, futures and<br />
repurchase agreements) were as follows:<br />
Fund Purchases Sales<br />
Core Bond $ 529,232,775 $ 524,212,269<br />
Written Options Contracts<br />
Transactions in written options contracts for the period ended December 31, 2008 were as follows:<br />
Number of<br />
Contracts<br />
Non-U.S. Fund<br />
Premiums<br />
Received<br />
Number of<br />
Contracts<br />
Core Bond Fund<br />
Premiums<br />
Received<br />
Outstanding December 31, 2007 22 $ 95,180 44 $ 322,282<br />
Opened 720 3,404,891 574 1,377,260<br />
Closed (742) (3,500,071) (524) (869,829)<br />
Expired — — (35) (249,728)<br />
Outstanding December 31, 2008 — $ — 59 $ 579,985<br />
Securities Lending<br />
The Investment Company has a securities lending program whereby each Fund can loan securities with a value up to 33 1 ⁄3% of<br />
each Fund’s total assets. The Fund receives cash (U.S. currency), U.S. Government or U.S. Government agency obligations as<br />
collateral against the loaned securities. To the extent that a loan is collateralized by cash, such collateral is invested by the<br />
securities lending agent, State Street Corporation (“State Street”), in short-term instruments, money market mutual funds and<br />
other short-term investments that meet certain quality and diversification requirements. Cash collateral invested in money market<br />
funds is included in the Schedule of Investments. The collateral received is recorded on a lending Fund’s statement of assets and<br />
liabilities along with the related obligation to return the collateral.<br />
Income generated from the investment of cash collateral, less negotiated rebate fees paid to participating brokers and transaction<br />
costs, is divided between the Fund and State Street and is recorded as income for the Fund. To the extent that a loan is secured by<br />
Notes to Financial Statements 107
Russell Investment Funds<br />
Notes to Financial Statements, continued — December 31, 2008<br />
non-cash collateral, brokers pay the Fund negotiated lenders’ fees, which are divided between the Fund and State Street and are<br />
recorded as securities lending income for the Fund. All collateral received will be in an amount at least equal to 102% (for loans<br />
of U.S. securities) or 105% (for Non-U.S. securities) of the market value of the loaned securities at the inception of each loan. The<br />
market value of the loaned securities is determined at the close of business of the Funds and any additional required collateral is<br />
delivered to the Fund the next day. Should the borrower of the securities fail financially, there is a risk of delay in recovery of the<br />
securities or loss of rights in the collateral. Consequently, loans are made only to borrowers which are deemed to be of good<br />
financial standing.<br />
The Funds that participate in securities lending have cash collateral invested in the State Street Securities Lending Quality Trust<br />
Fund (“SLQT”). The short-term portfolio instruments held by SLQT are valued on the basis of amortized cost. Issuances and<br />
redemptions of interests in SLQT are made on each business day (“valuation date”). Currently, interests in SLQT are purchased<br />
and redeemed at a constant net asset value of $1.00 per unit for daily operational liquidity purposes, although redemptions for<br />
certain other purposes may be in-kind. In the event that a significant disparity develops between the net asset value based on<br />
amortized cost and the market based net asset value of SLQT, the Trustee of SLQT may determine that continued redemption at a<br />
constant $1.00 net asset value would create inequitable results for the SLQT’s interest holders. In these circumstances, the<br />
Trustee of SLQT, in its sole discretion and acting on behalf of the SLQT interest holders, may direct that interests be redeemed at<br />
the market-based net asset value until such time as the disparity between the market-based and the constant net asset value per<br />
unit is deemed to be insignificant.<br />
At December 31, 2008, the SLQT Fund was transacting at its amortized cost value of $1.00 per unit for daily operational liquidity<br />
purposes. In accordance with GAAP and SFAS 157, the Funds’ financial statements reflect the current market value of SLQT as<br />
of December 31, 2008. The SLQT’s market value per unit is lower than its amortized cost value per unit. Effective February 10,<br />
2009, the Funds began valuing the units of SLQT for purposes of the Funds’ daily valuation calculation at the unit’s market value<br />
rather than the unit’s amortized cost value.<br />
As of December 31, 2008, the non-cash collateral received for the securities on loan in the following funds was:<br />
Funds<br />
Non-Cash<br />
Collateral Value<br />
Non-Cash Collateral Holding<br />
Multi-Style Equity $ 182,684 Pool of US Government Securities and Corporate Bonds<br />
Aggressive Equity 362,923 Pool of US Government Securities and Corporate Bonds<br />
Non-U.S. 70,792 Pool of US Government Securities and Corporate Bonds<br />
Custodian<br />
The Funds have entered into arrangements with their Custodian whereby custody credits realized as a result of uninvested cash<br />
balances are used to reduce a portion of the Funds’ expenses. During the period ended December 31, 2008, the Funds’ custodian<br />
fees were reduced by the following amounts under these arrangements which are included in expense reductions on the<br />
Statements of Operations:<br />
Funds<br />
Custody Credit<br />
Amount<br />
Multi-Style Equity $ 5,505<br />
Aggressive Equity 3,298<br />
Non-U.S. 5,950<br />
Core Bond 8,505<br />
Real Estate Securities 465<br />
Brokerage Commissions<br />
The Funds effect certain transactions through various brokers as part of Russell’s commission recapture program as administered<br />
by BNY ConvergeFX Group — Execution Solutions LLC (“BNY”) is a registered broker and is not an affiliate of the Funds or<br />
RIMCo. Trades placed through BNY and its correspondents are used to generate commission rebates to the Funds on whose<br />
behalf the trades were made. For purposes of trading to generate commission rebates to the Funds, the Funds’ money managers<br />
are requested to and RIMCo may, with respect to transactions it places, effect transactions with or through BNY and its<br />
correspondents or other brokers only to the extent that the Funds will receive competitive execution, price and commissions. In<br />
addition, RIMCo recommends targets for the amount of trading that money managers allocate through BNY based upon asset<br />
class, investment style and other factors.<br />
BNY may also rebate to the Funds a portion of commissions earned on certain trading by the Funds through BNY and their<br />
correspondents in the form of commission recapture. Commission recapture is paid solely to those Funds generating the<br />
applicable trades. Commission recapture is generated on the instructions of the Soft Dollar Committee once RIMCo’s research<br />
budget has been met, as determined annually in the Soft Dollar Committee budgeting process.<br />
Effective January 1, 2008, transactions effected through BNY are used solely to generate commission rebate to the Funds and no<br />
longer to obtain research services.<br />
108 Notes to Financial Statements
Russell Investment Funds<br />
Notes to Financial Statements, continued — December 31, 2008<br />
Additionally, the Fund paid brokerage commissions to non-affiliated brokers who provided brokerage and research services to<br />
the Adviser.<br />
4. Related Party Transactions, Fees and Expenses<br />
Adviser and Administrator<br />
RIMCo is the Funds’ investment adviser and RFSC is the Funds’ administrator. RFSC is a wholly-owned subsidiary of RIMCo.<br />
RIMCo is a wholly-owned subsidiary of Frank Russell Company (a subsidiary of The <strong>Northwestern</strong> <strong>Mutual</strong> Life Insurance<br />
Company). Frank Russell Company provides ongoing money manager research and trade placement services to RIF and RIMCo.<br />
The Investment Company Funds are permitted to invest their cash reserves (i.e., cash awaiting investment or cash held to meet<br />
redemption requests or to pay expenses) in the RIC Russell Money Market Fund. As of December 31, 2008, $91,920,000<br />
represents Investment Company Funds in the RIC Russell Money Market Fund. RIC is a registered investment company that<br />
employs the same investment adviser as the Investment Company.<br />
The advisory and administrative fees are based upon the average daily net assets of each Fund at the rates specified in the table<br />
below, are payable monthly and total $13,234,201 and $866,655 respectively, for the period ended December 31, 2008.<br />
<strong>Annual</strong> Rate<br />
Funds Advisor Administrator<br />
Multi-Style Equity 0.73% 0.05%<br />
Aggressive Equity 0.90 0.05<br />
Non-U.S. Equity 0.90 0.05<br />
Core Bond 0.55 0.05<br />
Real Estate Securities 0.80 0.05<br />
RIMCo agreed to certain waivers of its advisory fees as follows:<br />
Multi-Style Equity Fund — RIMCo contractually agreed to waive, at least until April 29, 2009, a portion of its 0.73% advisory<br />
fee, up to the full amount of that fee, equal to the amount by which the Fund’s total direct Fund-level operating expenses exceed<br />
0.87% of the Fund’s average daily net assets on an annual basis and then to reimburse the Fund for all remaining expenses, after<br />
fee waivers, that exceed 0.87% of the average daily net assets on an annual basis. Direct Fund-level expenses do not include<br />
expenses of other investment companies in which the Fund invests which are borne indirectly by the Fund. The total amount of<br />
the waiver for the period ended December 31, 2008 was $62,146. There were no reimbursements during the period.<br />
Aggressive Equity Fund — RIMCo contractually agreed to waive, at least until April 29, 2009, a portion of its 0.90% advisory<br />
fee, up to the full amount of that fee, equal to the amount by which the Fund’s total direct Fund-level operating expenses exceed<br />
1.05% of the Fund’s average daily net assets on an annual basis and to then reimburse the Fund for all remaining expenses, after<br />
fee waivers, that exceed 1.05% of the average daily net assets on an annual basis. Direct Fund-level expenses do not include<br />
expenses of other investment companies in which the Fund invests which are borne indirectly by the Fund. The total amount of<br />
the waiver for the period ended December 31, 2008 was $231,505. There were no reimbursements during the period.<br />
Non-U.S. Fund — RIMCo contractually agreed to waive, at least until April 29, 2009, a portion of its 0.90% advisory fee, up to<br />
the full amount of that fee, equal to amount by which the Fund’s total direct Fund-level operating expenses exceed 1.15% of the<br />
Fund’s average daily net assets on an annual basis and to then reimburse the Fund for all remaining expenses, after fee waivers,<br />
that exceed 1.15% of the average daily net assets on an annual basis. Direct Fund-level expenses do not include expenses of<br />
other investment companies in which the Fund invests which are borne indirectly by the Fund. The total amount of the waiver for<br />
the period ended December 31, 2008 was $209,156. There were no reimbursements during the period.<br />
Core Bond Fund — RIMCo contractually agreed to waive, at least until April 29, 2009, a portion of its 0.55% advisory fee, up to<br />
the full amount of that fee, equal to the amount by which the Fund’s total direct Fund-level operating expenses exceed 0.70% of<br />
the Fund’s average daily net assets on an annual basis and to then reimburse the Fund for all remaining expenses, after fee<br />
waivers, that exceed 0.70% of the average daily net assets on an annual basis. Direct Fund-level expenses do not include<br />
expenses of other investment companies in which the Fund invests which are borne indirectly by the Fund. The total amount of<br />
the waiver for the period ended December 31, 2008 was $252,045. There were no reimbursements during the period.<br />
Real Estate Securities Fund — RIMCo contractually agreed to waive, at least until April 29, 2009, a portion of its 0.80%<br />
advisory fee, up to the full amount of that fee, equal to the amount by which the Fund’s total direct Fund-level operating expenses<br />
exceed 1.10% of the Fund’s average daily net assets on an annual basis and then to reimburse the Fund for all remaining<br />
expenses, after fee waivers, that exceed 1.10% of the average daily net assets on an annual basis. Direct Fund-level expenses do<br />
not include expenses of other investment companies in which the Fund invests which are borne indirectly by the Fund. There<br />
were no amounts waived or reimbursed during the period.<br />
RIMCo do not have the ability to recover amounts waived or reimbursed from previous periods.<br />
Notes to Financial Statements 109
Russell Investment Funds<br />
Notes to Financial Statements, continued — December 31, 2008<br />
Transfer and Dividend Disbursing Agent<br />
RFSC serves as Transfer and Dividend Disbursing Agent for the Investment Company. For this service, RIMCo and RFSC are<br />
paid a fee for transfer agency and dividend disbursing services provided to the Funds. RIMCo and RFSC retain a portion of this<br />
fee for their services provided to the Funds and pay the balance to unaffiliated agents who assist in providing these services. Total<br />
transfer agency fees paid by the Funds presented herein for the period ended December 31, 2008 were $76,266.<br />
Accrued Fees Payable to Affiliates<br />
Accrued fees payable to affiliates as of December 31, 2008 were as follows:<br />
Multi-Style Equity<br />
Fund<br />
Aggressive Equity<br />
Fund<br />
Non-U.S.<br />
Fund<br />
Core Bond<br />
Fund<br />
Real Estate<br />
Securities Fund<br />
Advisory Fees $ 173,754 $ 58,607 $ 164,264 $ 130,236 $ 188,841<br />
Administrative Fees 12,174 4,967 10,313 13,399 11,803<br />
Transfer agent Fees 1,075 447 904 1,138 1,068<br />
Trustee Fees 1,461 736 1,205 1,057 2,050<br />
$ 188,464 $ 64,757 $ 176,686 $ 145,830 $ 203,762<br />
Distributor<br />
On June 2, 2008, Russell Fund Distributors, Inc., a wholly-owned subsidiary of RIMCo, changed its name to Russell Financial<br />
Services, Inc. (the “Distributor’). The Distributor serves as distributor for RIF, pursuant to the Distribution Agreement with the<br />
Investment Company. The Distributor receives no compensation from the Investment Company for its services.<br />
Affiliated Brokerage Commissions<br />
The Funds will effect certain transactions through Russell Implementation Services Inc. (“RIS”) and its global network of<br />
unaffiliated correspondent brokers. RIS is a registered broker and investment adviser and an affiliate of RIMCo. Trades placed<br />
through RIS and its correspondents are made (i) to manage trading associated with changes in managers, rebalancing across<br />
existing managers, cash flows and other portfolio transitions or (ii) to execute portfolio securities transactions for each Fund’s<br />
assets that RIMCo determines not to allocate to money managers and for each Fund’s cash reserves.<br />
Board of Trustees<br />
The Russell Fund Complex consists of RIC, which has 38 Funds, and RIF, which has nine Funds. Each of the Trustees is a<br />
Trustee of both RIC and RIF. During the period, the Russell Fund Complex paid each of its independent Trustees a retainer of<br />
$60,000 per year, $6,500 for each regular quarterly meeting attended in person, $2,500 for each special meeting attended in<br />
person, and $2,500 for each Audit Committee meeting, Nominating and Governance Committee meeting, Investment Committee<br />
meeting or any other committee meeting established and approved by the Board that is attended in person. Each Trustee receives<br />
a $1,000 fee for attending the quarterly and special meetings and a $500 fee for attending the committee meeting by phone<br />
instead of receiving the full fee had the member attended in person. Trustees’ out of pocket expenses are also paid by the Russell<br />
Fund Complex. The Audit Committee Chair and Investment Committee Chair are each paid a fee of $12,000 per year and the<br />
Nominating and Governance Committee Chair is paid a fee of $6,000 per year. The chairman of the Board receives additional<br />
annual compensation of $52,000.<br />
5. Federal Income Taxes<br />
At December 31, 2008, the following Funds had net tax basis capital loss carryforwards which may be applied against any<br />
realized net taxable gains in each succeeding year or until their respective expiration dates, whichever occurs first. Available<br />
capital loss carryforwards and expiration dates are as follows:<br />
Funds 12/31/16 Totals<br />
Multi-Style Equity $ 47,156,528 $ 47,156,528<br />
Aggressive Equity 35,188,160 35,188,160<br />
Non-U.S. 51,015,389 51,015,389<br />
Real Estate 26,296,790 26,296,790<br />
110 Notes to Financial Statements
Russell Investment Funds<br />
Notes to Financial Statements, continued — December 31, 2008<br />
At December 31, 2008, the cost of investments, net unrealized appreciation (depreciation), undistributed ordinary income and<br />
undistributed long-term capital gains for income tax purposes were as follows:<br />
Multi-Style Equity<br />
Fund<br />
Aggressive Equity<br />
Fund<br />
Non-U.S.<br />
Fund<br />
Core Bond<br />
Fund<br />
Real Estate<br />
Securities Fund<br />
Cost of Investments for Tax Purposes $ 439,265,952 $ 212,648,127 $ 341,459,535 $ 452,500,958 $ 487,921,333<br />
Unrealized Appreciation $ 14,217,717 $ 5,963,920 $ 10,861,747 $ 17,775,512 $ 53,131,098<br />
Unrealized Depreciation (106,549,192) (46,286,435) (82,369,953) (53,495,923) (138,795,460)<br />
Net Tax Unrealized Appreciation (Depreciation) $ (92,331,475) $ (40,322,515) $ (71,508,206) $ (35,720,411) $ (85,664,362)<br />
Undistributed Ordinary Income $ 1,690,300 $ — $ 3,432,328 $ 3,174,296 $ 4,032,989<br />
Undistributed Long-Term Gains (Capital Loss<br />
Carryforward) $ (47,156,528) $ (35,188,160) $ (51,015,389) $ 348,882 $ (26,296,790)<br />
Tax Composition of Distributions:<br />
Ordinary Income $ 5,807,059 $ 1,580,838 $ 1,321 $ 18,795,290 $ 8,442,892<br />
Long-Term Capital Gains $ 3,971,718 $ 41,420 $ 3,343,645 $ 2,360,093 $ —<br />
Post October Loss Deferrals $ 23,941,457 $ 17,044,024 $ 23,686,099 $ — $ 16,705,163<br />
6. Fund Share Transactions (amounts in thousands)<br />
Share transactions for the periods ended December 31, 2008 and December 31, 2007 were as follows:<br />
Shares<br />
Dollars<br />
Multi-Style Equity Fund<br />
2008 2007 2008 2007<br />
Proceeds from shares sold 4,217 3,423 $ 50,056 $ 54,038<br />
Proceeds from reinvestment of distributions 720 1,528 9,779 23,579<br />
Payments for shares redeemed (2,477) (2,246) (31,519) (35,711)<br />
Total net increase (decrease) 2,460 2,705 $ 28,316 $ 41,906<br />
Aggressive Equity Fund<br />
Proceeds from shares sold 1,687 1,325 $ 16,796 $ 19,061<br />
Proceeds from reinvestment of distributions 176 2,315 1,622 30,456<br />
Payments for shares redeemed (2,345) (1,505) (23,355) (21,845)<br />
Total net increase (decrease) (482) 2,135 $ (4,937) $ 27,672<br />
Non-U.S. Fund<br />
Proceeds from shares sold 4,132 3,562 $ 41,756 $ 52,185<br />
Proceeds from reinvestment of distributions 286 6,481 3,345 86,474<br />
Payments for shares redeemed (2,955) (1,975) (30,761) (29,055)<br />
Total net increase (decrease) 1,463 8,068 $ 14,340 $ 109,604<br />
Core Bond Fund<br />
Proceeds from shares sold 6,353 8,092 $ 64,412 $ 82,694<br />
Proceeds from reinvestment of distributions 2,179 1,601 21,155 16,240<br />
Payments for shares redeemed (7,885) (2,377) (75,964) (24,283)<br />
Total net increase (decrease) 647 7,316 $ 9,603 $ 74,651<br />
Real Estate Securities Fund<br />
Proceeds from shares sold 3,828 2,871 $ 46,717 $ 60,833<br />
Proceeds from reinvestment of distributions 585 4,945 8,443 78,706<br />
Payments for shares redeemed (3,880) (5,015) (55,931) (99,943)<br />
Total net increase (decrease) 533 2,801 $ (771) $ 39,596<br />
7. Interfund Lending Program<br />
The Investment Company Funds have received permission from the Securities and Exchange Commission to participate in a joint<br />
lending and borrowing facility (the “Credit Facility”). Portfolios of the Funds may borrow money from each other for temporary<br />
purposes. All such borrowing and lending will be subject to a participating Fund’s fundamental investment limitations. Typically,<br />
Funds will borrow from the RIC Russell Money Market Fund. The RIC Russell Money Market Fund will lend through the program<br />
Notes to Financial Statements 111
Russell Investment Funds<br />
Notes to Financial Statements, continued — December 31, 2008<br />
only when the returns are higher than those available from an investment in repurchase agreements or short-term reserves and the<br />
portfolio manager determines it is in the best interest of the RIC Russell Money Market Fund. The Investment Company Funds<br />
will borrow through the program only when the costs are equal to or lower than the cost of bank loans. Interfund loans and<br />
borrowings normally extend overnight, but can have a maximum duration of seven days. Loans may be called on one business<br />
day’s notice. A participating fund may have to borrow from a bank at a higher interest rate if an interfund loan is called or not<br />
renewed. Any delay in repayment to the RIC Russell Money Market Fund could result in a lost investment opportunity or<br />
additional borrowing costs. For the period ended December 31, 2008, the Funds presented herein did not borrow through the<br />
interfund lending program.<br />
8. Record Ownership<br />
As of December 31, 2008, the following table includes shareholders of record with greater than 10% of the total outstanding<br />
shares of each respective Fund. The <strong>Northwestern</strong> <strong>Mutual</strong> Life Insurance Company separate accounts were the largest<br />
shareholder in each Fund.<br />
# of Shareholders %<br />
Multi-Style Equity Fund 2 83.0<br />
Aggressive Equity Fund 2 83.5<br />
Non-U.S. Fund 2 86.6<br />
Core Bond Fund 2 79.0<br />
Real Estate Securities Fund 2 90.0<br />
9. Restricted Securities<br />
Restricted securities are subject to contractual limitations on resale, are often issued in private placement transactions, and are<br />
not registered under the Securities Act of 1933 (the “Act”). The most common types of restricted securities are those sold under<br />
Rule 144A of the Act and commercial paper sold under Section 4(2) of the Act.<br />
A Fund may invest a portion of its net assets not to exceed 15% in securities that are illiquid. Illiquid securities are securities<br />
that may not be readily marketable, and that cannot be sold within seven days in the ordinary course of business at the<br />
approximate amount at which the Fund has valued the securities. Restricted securities are generally considered to be illiquid.<br />
112 Notes to Financial Statements
Russell Investment Funds<br />
Notes to Financial Statements, continued — December 31, 2008<br />
The following table lists restricted securities held by a Fund that are illiquid. The following table does not include (1) securities<br />
deemed liquid by RIMCo or a money manager pursuant to Board approved policies and procedures or (2) illiquid securities that<br />
are not restricted securities as designated on the Fund’s Schedule of Investments.<br />
Fund - % of Net Assets<br />
Securities<br />
Acquisition<br />
Date<br />
Principal<br />
Amount ($)<br />
or Shares<br />
Cost per<br />
Unit<br />
$<br />
Cost<br />
(000)<br />
$<br />
Market Value<br />
(000)<br />
$<br />
Aggressive Equity Fund - 0.2%<br />
Monterey Gourmet Foods, Inc. 03/10/08 125,695 2.84 357 133<br />
Retractable Technologies, Inc. 03/10/08 72,750 1.52 110 62<br />
195<br />
Non-U.S. Fund - 0.4%<br />
East Japan Railway Co. 11/18/08 52 7,885.95 410 415<br />
Mizuho Financial Group, Inc. 02/28/08 168 2,598.19 436 501<br />
916<br />
Core Bond Fund - 1.2%<br />
Adam Aircraft Industries 02/13/08 55,855 99.05 55 5<br />
Americo Life, Inc. 12/12/06 75,000 102.07 77 71<br />
Ballyrock CDO, Ltd. 02/13/08 1,000,000 80.04 800 764<br />
Black Diamond CLO, Ltd. 09/11/08 1,000,000 83.02 830 700<br />
BNP Paribas Capital Trust 06/01/06 450,000 112.14 505 276<br />
Bombardier, Inc. 11/10/06 EUR 125,000 128.47 161 104<br />
Callidus Debt Partners Fund, Ltd. 09/26/08 973,409 77.81 757 779<br />
Catlin Insurance Co., Ltd. 01/11/07 100,000 100.00 100 40<br />
CIT Mortgage Loan Trust 10/05/07 327,778 100.00 328 267<br />
CIT Mortgage Loan Trust 10/05/07 130,000 100.00 130 49<br />
CIT Mortgage Loan Trust 10/05/07 180,000 100.00 180 61<br />
DG Funding Trust 11/04/03 49 10,537.12 516 491<br />
Freddie Mac REMICS 07/09/06 125,232 101.94 128 113<br />
Freddie Mac REMICS 06/28/07 126,022 0.17 — —<br />
Freddie Mac REMICS 07/17/07 60,120 109.13 66 69<br />
Symetra Financial Corp. 06/26/06 150,000 98.47 148 123<br />
Washington <strong>Mutual</strong> Mortgage Pass Through Certificates 04/01/05 196,509 100.00 197 24<br />
3,936<br />
Illiquid securities and restricted securities may be priced by the Funds using fair value procedures approved by the Board of<br />
Trustees.<br />
Notes to Financial Statements 113
Report of Independent Registered Public Accounting Firm<br />
To the Board of Trustees and Shareholders<br />
of Russell Investment Funds:<br />
In our opinion, the accompanying statements of assets and liabilities, including the schedules of investments, and the<br />
related statements of operations and of changes in net assets and the financial highlights present fairly, in all material<br />
respects, the financial position of Multi-Style Equity Fund, Aggressive Equity Fund, Non-U.S. Fund, Real Estate<br />
Securities Fund, and Core Bond Fund (five of the portfolios constituting the Russell Investment Funds, hereafter referred<br />
to as the “Funds”) at December 31, 2008, the results of each of their operations for the year then ended, the changes in<br />
each of their net assets for each of the two years in the period then ended and the financial highlights for each of the<br />
periods indicated, in conformity with accounting principles generally accepted in the United States of America. These<br />
financial statements and financial highlights (hereafter referred to as “financial statements”) are the responsibility of the<br />
Funds’ management; our responsibility is to express an opinion on these financial statements based on our audits. We<br />
conducted our audits of these financial statements in accordance with the standards of the Public Company Accounting<br />
Oversight Board (United States). Those standards require that we plan and perform the audits to obtain reasonable<br />
assurance about whether the financial statements are free of material misstatement. An audit includes examining, on a<br />
test basis, evidence supporting the amounts and disclosures in the financial statements, assessing the accounting<br />
principles used and significant estimates made by management, and evaluating the overall financial statement<br />
presentation. We believe that our audits, which included confirmation of securities at December 31, 2008 by<br />
correspondence with the custodian, brokers and transfer agent, provide a reasonable basis for our opinion.<br />
Seattle, Washington<br />
February 12, 2009<br />
114 Report of Independent Registered Public Accounting Firm
Russell Investment Funds<br />
Tax Information — December 31, 2008 (Unaudited)<br />
For the tax year ended December 31, 2008, the Funds hereby designate 100% or the maximum amount allowable, of its net taxable<br />
income as qualified dividends taxed at individual net capital gain rates.<br />
The Form 1099 you receive in January 2009 will show the tax status of all distributions paid to your account in calendar year 2008.<br />
The Funds designate dividends distributed during the fiscal year as qualifying for the dividends received deduction for corporate<br />
shareholders as follows:<br />
Multi-Style Equity 100.0%<br />
Aggressive Equity 100.0%<br />
Non-U.S. 0.0%<br />
Real Estate Securities 4.1%<br />
Core Bond 0.0%<br />
Pursuant to Section 852 of the Internal Revenue Code, the Funds designate the following amounts as long-term capital gain<br />
dividends for their taxable year ended December 31, 2008:<br />
Long-Term<br />
Capital Gains<br />
Multi-Style Equity $ 3,971,718<br />
Aggressive Equity 41,420<br />
Non-U.S. 3,343,645<br />
Real Estate Securities 0<br />
Core Bond 2,360,093<br />
Please consult a tax adviser for any questions about federal or state income tax laws.<br />
The Non-U.S Fund paid foreign taxes of $1,007,175 and recognized $9,878,146 of foreign source income during the taxable year<br />
ended December 31, 2008. Pursuant to Section 853 of the Internal Revenue Code, the Fund designates $.0295 per share of foreign<br />
taxes paid and $.2891 of gross income per share earned from foreign sources in the taxable year ended December 31, 2008.<br />
Tax Information 115
Russell Investment Funds<br />
Basis for Approval of Investment Advisory Contracts (Unaudited)<br />
Approval of Investment Advisory Agreement<br />
The Board of Trustees, including all of the Independent Trustees, last considered and approved the continuation of the advisory<br />
agreement with RIMCo (the “RIMCo Agreement”) and the portfolio management contract with each Money Manager of the Funds<br />
(collectively, the “portfolio management contracts”) at a meeting held on April 22, 2008. During the course of a year, the Trustees<br />
receive a wide variety of materials regarding the investment performance of the Funds, sales and redemptions of the Funds’ shares,<br />
and the management of the Funds by RIMCo. In preparation for the annual review, the Independent Trustees, with the advice and<br />
assistance of their independent counsel, also requested and the Board considered (1) information and reports prepared by RIMCo<br />
relating to the services provided by RIMCo (and its affiliates) to the Funds; and (2) information (the “Third-Party Information”)<br />
received from an independent, nationally recognized provider of investment company information comparing the performance of each<br />
of the Funds and their respective operating expenses over various periods of time with other peer funds (“Comparable Funds”) not<br />
managed by RIMCo, believed by the provider to be generally comparable in investment objectives and size to the Funds; The<br />
foregoing information requested by the Trustees or provided by RIMCo is collectively called the “Agreement Renewal Information.”<br />
The Trustees’ evaluations also reflected the knowledge and familiarity gained as Board members of the Funds and other funds in the<br />
same complex with respect to services provided by RIMCo, RIMCo’s affiliates and each Money Manager. The Trustees received a<br />
memorandum from counsel to the Funds discussing the legal standards for their consideration of the continuations of the RIMCo<br />
Agreement and the portfolio management contracts and the Independent Trustees separately received a memorandum regarding their<br />
responsibilities from their independent counsel.<br />
On April 21, 2008, the Independent Trustees met to review the Agreement Renewal Information in a private session with their<br />
independent counsel at which no representatives of RIMCo or the Funds’ management were present. At the April 22 meeting of the<br />
Board of Trustees, the Board, including the Independent Trustees, reviewed the proposed continuance of the RIMCo Agreement and<br />
the portfolio management contracts with management, counsel to the Funds and independent counsel to the Independent Trustees.<br />
Presentations made by RIMCo to the Board as part of this review encompassed the Funds and all other RIMCo-managed funds for<br />
which the Board has supervisory responsibility. Following this review, but prior to voting, the Independent Trustees again met in a<br />
private session with their independent counsel to evaluate additional information and analyses received from RIMCo and<br />
management at the Board meeting. The discussion below reflects all of these reviews.<br />
In evaluating the portfolio management contracts, the Board considered that the Funds, in employing a manager-of-managers method<br />
of investment, operate in a manner that is distinctly different from most other investment companies. In the case of most other<br />
investment companies, an advisory fee is paid by the investment company to its adviser which, in turn, employs and compensates<br />
individual portfolio managers to make specific securities selections consistent with the adviser’s style and investment philosophy.<br />
RIMCo has engaged multiple unaffiliated Money Managers for all Funds.<br />
The Board considered that RIMCo (rather than any Money Manager) is responsible under the RIMCo Agreement for determining,<br />
implementing and maintaining the investment program for each Fund. Assets of each Fund generally have been allocated among the<br />
multiple Money Managers selected by RIMCo, subject to Board approval, for that Fund. RIMCo manages directly a portion of certain<br />
Funds’ assets employing a “select holdings strategy,” as described below, and directly manages the investment of each Fund’s cash<br />
reserves. RIMCo also may manage directly any portion of each Fund’s assets that RIMCo determines not to allocate to the Money<br />
Managers and portions of a Fund during transitions between Money Managers. In all cases, assets are managed directly by RIMCo<br />
pursuant to authority provided by the RIMCo Agreement.<br />
RIMCo is responsible for selecting, subject to Board approval, Money Managers for each Fund and for actively managing allocations<br />
and reallocations of assets among the Money Managers. RIMCo’s goal is to construct and manage diversified portfolios in a risk<br />
aware manner. Each Money Manager for a Fund in effect performs the function of an individual portfolio manager who is responsible<br />
for selecting portfolio securities for the portion of the Fund assigned to it by RIMCo (each, a “segment”) in accordance with the<br />
Fund’s applicable investment objective, policies and restrictions, any constraints placed by RIMCo upon their selection of portfolio<br />
securities and the Money Manager’s specified role in a Fund. RIMCo is responsible for communicating performance expectations to<br />
each Money Manager; supervising compliance by each Money Manager with each Fund’s investment objective and policies;<br />
authorizing Money Managers to engage in certain investment strategies for a Fund; and recommending annually to the Board whether<br />
portfolio management contracts should be renewed, modified or terminated. In addition to its annual recommendation as to the<br />
renewal, modification or termination of portfolio management contracts, RIMCo is responsible for recommending to the Board<br />
additions of new Money Managers or replacements of existing Money Managers at any time when, based on RIMCo’s research and<br />
ongoing review and analysis, such actions are appropriate. RIMCo may impose specific investment constraints from time to time for<br />
each Money Manager intended to capitalize on the strengths of that Money Manager or to coordinate the investment activities of<br />
Money Managers for the Fund in a complementary manner. Therefore, RIMCo’s selection of Money Managers is made not only on the<br />
basis of performance considerations but anticipated compatibility with other Money Managers in the same Fund. In light of the<br />
foregoing, the overall performance of each Fund over appropriate periods reflects, in great part, the performance of RIMCo in<br />
designing the Fund’s investment program, structuring the Fund, selecting an effective Money Manager with a particular investment<br />
style or sub-style for a segment that is complementary to the styles of the Money Managers of other Fund segments, and allocating<br />
assets among the Money Managers in a manner designed to achieve the objectives of the Fund.<br />
116 Basis for Approval of Investment Advisory Contracts
Russell Investment Company<br />
Basis for Approval of Investment Advisory Contracts, continued (Unaudited)<br />
The Board considered that the prospectuses for the Funds and other public disclosures emphasize to investors RIMCo’s role as the<br />
principal investment manager for each Fund, rather than the investment selection role of the Funds’ Money Managers, and describe<br />
the manner in which the Funds operate so that investors may take that information into account when deciding to purchase shares of<br />
any such Fund.<br />
The Board also considered the demands and complexity of managing the Funds pursuant to the manager-of-managers structure, the<br />
special expertise of RIMCo with respect to the manager-of-managers structure of the Funds and the likelihood that, at the current<br />
expense ratio of each Fund, there would be no acceptable alternative investment managers to replace RIMCo on comparable terms<br />
given the need to continue the manager-of-managers strategy of such Fund selected by shareholders in purchasing their shares.<br />
In addition to these general factors relating to the manager-of-managers structure of the Funds, the Trustees considered, with respect<br />
to each Fund, various specific factors in evaluating renewal of the RIMCo Agreement, including the following:<br />
1. The nature, scope and quality of the services provided to the Fund by RIMCo;<br />
2. The advisory fee paid by the Fund to RIMCo and the fact that it encompasses all investment advisory fees paid by the Fund,<br />
including the fees for any Money Managers of such Fund;<br />
3. Information provided by RIMCo as to other fees and benefits received by RIMCo or its affiliates from the Fund, including any<br />
administrative, transfer agent, cash management and securities lending fees, soft dollar arrangements and commissions in<br />
connection with portfolio securities transactions;<br />
4. Information provided by RIMCo as to expenses incurred by the Fund; and<br />
5. Information provided by RIMCo as to the profits that RIMCo derives from its mutual fund operations generally and from the<br />
Fund.<br />
As noted above, RIMCo, pursuant to the terms of the RIMCo Agreement, directly managed a portion—up to 10%—of the assets of<br />
the Multi-Style Equity Fund (the “Participating Fund”) during the past year utilizing a select holdings strategy, the actual allocation<br />
being determined by the Participating Fund’s RIMCo portfolio manager. The select holdings strategy utilized by RIMCo in managing<br />
such assets for the Participating Fund is designed to increase the Participating Fund’s exposure to stocks that are viewed as<br />
attractive by multiple Money Managers of the Participating Fund. The Board reviewed the results of the select holdings strategy in<br />
respect of the Participating Fund since implementation, taking into account that the strategy has been utilized for a limited period of<br />
time. The Trustees considered that RIMCo is not required to pay investment advisory fees to a Money Manager with respect to assets<br />
for which the select holdings strategy is utilized and that the profits derived by RIMCo generally and from the Participating Fund<br />
consequently may increase incrementally. The Board, however, also considered RIMCo’s advice that it pays certain Money Managers<br />
additional fees for providing information and other services in connection with the select holdings strategy and incurs additional<br />
costs in carrying out the select holdings strategy, the limited amount of assets that are managed directly by RIMCo pursuant to the<br />
select holdings strategy, and the fact that the aggregate investment advisory fees paid by the Participating Fund are not increased as<br />
a result of the select holdings strategy.<br />
In evaluating the reasonableness of the Funds’ investment advisory fees in light of Fund performance, the Board considered that<br />
RIMCo, in the Agreement Renewal Information and at past meetings, noted differences between the investment strategies of certain<br />
Funds and their respective Comparable Funds in pursuing their investment objectives, including Fund strategies which seek to<br />
achieve a lower tracking error (i.e., the difference, whether positive or negative, between the return of a fund and its benchmark) and<br />
resulting lower return volatility than Comparable Funds. According to RIMCo, these strategies may be expected to result, and for<br />
certain Funds during the periods covered by the Third-Party Information did result, in lower performance than that of some of their<br />
respective Comparable Funds. According to RIMCo, the strategies pursued by the Funds, among other things, are intended to result<br />
in less volatile, more moderate returns relative to each Fund’s performance benchmark rather than more volatile, more extreme<br />
returns that its Comparable Funds may experience over time.<br />
The Board considered for each Fund whether economies of scale have been realized and whether the fees for such Fund<br />
appropriately reflect or should be revised to reflect any such economies. The Board determined that, after giving effect to any<br />
applicable fee or expense caps, waivers and/or reimbursements, the investment advisory fees for each Fund appropriately reflect any<br />
economies of scale realized by that Fund, based upon such factors as the variability of Money Manager investment advisory fees and<br />
other factors associated with the manager-of-managers structure employed by the Funds. The Trustees considered that fees payable<br />
to RIMCo by institutional clients with investment objectives similar to those of the Funds and other funds under the Board’s<br />
supervision are lower, and may, in some cases by substantially lower that the rates paid by funds supervised by the Board, including<br />
the Funds. The Trustees considered the differences in the scope of services it provides to institutional clients and the Funds. In<br />
response to the Trustees’ inquiries, RIMCO has previously noted, among other things, that institutional clients have fewer<br />
administrative needs than the Funds. RIMCo noted that since the Funds must constantly issue and redeem their shares, they are<br />
more difficult to manage than institutional accounts, where assets are relatively stable. Accordingly, the Trustees did not regard<br />
these fee differences as relevant to their deliberations.<br />
Basis for Approval of Investment Advisory Contracts 117
Russell Investment Company<br />
Basis for Approval of Investment Advisory Contracts, continued (Unaudited)<br />
On the basis of the Agreement Renewal Information, and other information previously received by the Board from RIMCo during the<br />
course of the current year or prior years or presented at the April 22 Board meeting by RIMCo, the Board, in respect of each Fund,<br />
found, after giving effect to any applicable waivers and/or reimbursements, (1) the advisory fee charged by RIMCo to be reasonable<br />
in light of the nature, scope and quality of the services provided to the Funds; (2) the relative expense ratio of the Fund was<br />
comparable to those of its Comparable Funds; (3) RIMCo’s methodology of allocating expenses of operating funds in the complex was<br />
reasonable; and (4) RIMCo’s profitability with respect to the Fund was not excessive in light of the nature, scope and quality of the<br />
services provided by RIMCo.<br />
The Board further concluded that, under the circumstances, the performance of each of the Funds supported continuation of the<br />
RIMCo Agreement except that the Board concluded that, as discussed below, performance of the Non-U.S. Fund did not support a<br />
determination against continuation of the RIMCo Agreement in respect of that Fund. The Board, in assessing the Funds’<br />
performance, focused upon each Fund’s performance for the 1-, 3- and 5-year periods as most relevant.<br />
With respect to the RIF Non-U.S. Fund, the Third-Party Information showed that the Fund’s performance was ranked in the fourth<br />
quintile for the 1- and 3-year periods ended December 31, 2007 and in the third quintile for the 5- and 10-year periods ended such<br />
date. RIMCo noted that the quantitative investment strategy employed by one Money Manager for the Fund, like quantitative<br />
strategies generally, had been adversely affected by market conditions in the past year and that another Money Manager performed<br />
below expectations in a market environment that should have been more favorable for it and was subsequently replaced by a higher<br />
confidence manager. RIMCo noted further that the relatively small size of the RIF Non-U.S. Fund has constrained the number of<br />
Money Managers that may be employed to manage its portfolio, limiting its exposure to multiple, different investment strategies.<br />
Lastly, RIMCo noted that the Comparable Funds for the RIF Non-U.S. Fund have had greater emerging markets exposure and that<br />
the Fund tends to invest in larger cap stocks than the Comparable Funds, a tendency which has put it at a disadvantage in periods<br />
when emerging markets stocks and smaller cap stocks were the best performers.<br />
In evaluating performance, the Board considered each Fund’s absolute performance and its performance relative to appropriate<br />
benchmarks and indices and its Comparable Funds. In assessing performance, the Board also considered RIMCo’s investment<br />
strategy of managing the Funds in a risk aware manner.<br />
After considering the foregoing and other relevant factors, the Board concluded that continuation of the RIMCo Agreement on its<br />
current terms and conditions would be in the best interests of the Funds and their respective shareholders and voted to approve the<br />
continuation of the Agreement.<br />
At the April 22 Board meeting, with respect to the evaluation of the terms of portfolio management contracts with Money Managers,<br />
the Board received and considered information from RIMCo reporting, among other things, for each Money Manager, the Money<br />
Manager’s performance over various periods; RIMCo’s assessment of the performance of each Money Manager; any significant<br />
business relationships between the Money Manager and RIMCo or Russell Financial Services, Inc., the Funds’ underwriter; and<br />
RIMCo’s recommendation to retain the Money Manager at the current fee rate, to retain the Money Manager at a reduced fee rate or<br />
to terminate the Money Manager. RIMCo recommended that each Money Manager be retained at its current fee rate. RIMCo has<br />
advised the Board that it does not regard Money Manager profitability as relevant to its evaluation of the portfolio management<br />
contracts with Money Managers because the willingness of Money Managers to serve in such capacity depends upon arm’s-length<br />
negotiations with RIMCo; RIMCo is aware of the fees charged by Money Managers to other clients; and RIMCo believes that the fees<br />
agreed upon with Money Managers are reasonable in light of the anticipated quality of investment advisory services to be rendered.<br />
The Board accepted RIMCo’s explanation in light of the Board’s findings as to the reasonableness of the aggregate investment<br />
advisory fees paid by each Fund and the fact that each Money Manager’s fee is paid by RIMCo.<br />
Based substantially upon RIMCo’s recommendations, together with the information received from RIMCo in support of its<br />
recommendations at the April 22 meeting, the Board concluded that the fees paid to the Money Managers of each Fund are<br />
reasonable in light of the quality of the investment advisory services provided and that continuation of the portfolio management<br />
contract with each Money Manager of each Fund would be in the best interests of the Fund and its shareholders.<br />
In their deliberations, the Trustees did not identify any particular information as to the RIMCo Agreement or, other than RIMCo’s<br />
recommendation, the portfolio management contract with any Money Manager that was all-important or controlling and each Trustee<br />
attributed different weights to the various factors considered. The Trustees evaluated all information available to them on a<br />
Fund-by-Fund basis and their determinations were made in respect of each Fund.<br />
Subsequently, the Board of Trustees received a proposal from RIMCo at a meeting held on October 10, 2008, to effect a money<br />
manager change for the Multi-Style Equity Fund resulting from a change of control of one of the Fund’s Money Managers. In the case<br />
the proposed change, the Trustees approved the terms of the proposed portfolio management contract based substantially upon<br />
RIMCo’s recommendation to hire the Money Manager at the proposed fee rate; any significant business relationships between the<br />
Money Manager and RIMCo or Russell Financial Services, Inc. the Fund’s underwriter; RIMCo’s explanation as to the lack of<br />
relevance of profitability to the evaluation of portfolio management contracts with money managers because the willingness of Money<br />
Managers to serve in such capacity depends upon arm’s-length negotiations with RIMCo; RIMCo’s awareness of the fees charged by<br />
118 Basis for Approval of Investment Advisory Contracts
Russell Investment Company<br />
Basis for Approval of Investment Advisory Contracts, continued (Unaudited)<br />
the Money Manager to other clients; and RIMCo’s belief that the proposed investment advisory fees would be reasonable in light of<br />
the anticipated quality of investment advisory services to be rendered. The Trustees also considered their findings at their April 22,<br />
2008 meeting as to the reasonableness of the aggregate investment advisory fees paid by the Fund, and the fact that the aggregate<br />
investment advisory fees paid by the Fund would not increase as a result of the implementation of the proposed money manager<br />
change because the money managers’ investment advisory fee is paid by RIMCo.<br />
Basis for Approval of Investment Advisory Contracts 119
Russell Investment Funds<br />
Shareholder Requests for Additional Information — December 31, 2008 (Unaudited)<br />
A complete unaudited schedule of investments is made available generally no later than 60 days after the end of the first and third<br />
quarters of each year. These reports are available (i) free of charge, upon request, by calling the Funds at (800) 787-7354, (ii) on the<br />
Securities and Exchange Commission’s website at www.sec.gov, and (iii) at the Securities and Exchange Commission’s public<br />
reference room.<br />
The Board has delegated to RIMCo, as RIF’s investment adviser, the primary responsibility for monitoring, evaluating and voting<br />
proxies solicited by or with respect to issuers of securities in which assets of the Funds may be invested. RIMCo has established a<br />
proxy voting committee (“Committee”) and has adopted written proxy voting policies and procedures (“P&P”) and proxy voting<br />
guidelines (“Guidelines”). The Funds maintain a Portfolio Holdings Disclosure Policy that governs the timing and circumstances of<br />
disclosure to shareholders and third parties of information regarding the portfolio investments held by the Funds. A description of<br />
the P&P, Guidelines, Portfolio Holdings Disclosure Policy and additional information about Fund Trustees are contained in the<br />
Funds’ Statement of Additional Information (“SAI”). The SAI is available (i) free of charge, upon request, by calling the Funds at<br />
(800) 787-7354, and (ii) on the Securities and Exchange Commission’s website at www.sec.gov.<br />
If possible, depending on contract owner registration and address information, and unless you have otherwise opted out, only one<br />
copy of the RIF prospectus and each annual and semi-annual report will be sent to contract owners at the same address. If you would<br />
like to receive a separate copy of these documents, please contact your Insurance Company. If you currently receive multiple copies<br />
of the prospectus, annual report and semi-annual report and would like to request to receive a single copy of these documents in the<br />
future, please call your Insurance Company.<br />
Some Insurance Companies may offer electronic delivery of the Funds’ prospectus and annual and semiannual reports. Please<br />
contact your Insurance Company for further details.<br />
120 Shareholder Requests for Additional Information
Russell Investment Funds<br />
Disclosure of Information about Fund Trustees and Officers — December 31, 2008<br />
(Unaudited)<br />
The following tables provide information for each officer and trustee of the Russell Fund Complex. The Russell Fund Complex<br />
consists of Russell Investment Company (“RIC”), which has 38 funds, and Russell Investment Funds (“RIF”), which has 9 funds.<br />
Each of the trustees is a trustee of both RIC and RIF. The first table provides information for the interested trustee. The second table<br />
provides information for the independent trustees. The third table provides information for the trustees emeritus. The fourth table<br />
provides information for the officers.<br />
Name,<br />
Age,<br />
Address<br />
INTERESTED TRUSTEES<br />
#Greg J. Stark<br />
Born May 3, 1968<br />
909 A Street<br />
Tacoma, Washington<br />
98402-1616<br />
Position(s) Held<br />
with Fund and<br />
Length of<br />
Time Served<br />
President and Chief<br />
Executive Officer<br />
since 2004<br />
Trustee since 2007<br />
INDEPENDENT TRUSTEES<br />
Thaddas L. Alston Trustee since 2006<br />
Born April 7, 1945<br />
909 A Street<br />
Tacoma, Washington<br />
98402-1616<br />
Term<br />
of<br />
Office*<br />
Appointed until<br />
successor is<br />
duly elected and<br />
qualified<br />
Until successor<br />
is chosen and<br />
qualified by<br />
Trustees<br />
Appointed until<br />
successor is<br />
duly elected and<br />
qualified<br />
Principal Occupation(s)<br />
During the<br />
Past 5 Years<br />
• President and CEO RIC and RIF<br />
• Chairman of the Board, President and<br />
CEO, RIMCo<br />
• Chairman of the Board, President and<br />
CEO, Russell Fund Services<br />
Company (“RFSC”)<br />
• Chairman of the Board, President and<br />
CEO, Russell Financial Services, Inc.<br />
• Chairman of the Board and President,<br />
Russell Insurance Agency, Inc.<br />
(insurance agency (“RIA”))<br />
• Until 2004, Managing Director, of<br />
Individual Investor Services, FRC<br />
• 2000 to 2004 Managing Director,<br />
Sales and Client Service, RIMCo<br />
• Senior Vice President, Larco<br />
Investments, Ltd. (real estate firm)<br />
No. of<br />
Portfolios<br />
in Russell<br />
Fund<br />
Complex<br />
Overseen<br />
by Trustee<br />
47 None<br />
47 None<br />
Other Directorships<br />
Held by Trustee<br />
Kristianne Blake,<br />
Born January 22, 1954<br />
909 A Street Tacoma,<br />
Washington 98402-1616<br />
Trustee since 2000<br />
Chairman since 2005<br />
Appointed until<br />
successor is<br />
duly elected and<br />
qualified<br />
<strong>Annual</strong><br />
• Director and Chairman of the Audit<br />
Committee, Avista Corp.<br />
• Trustee and Chairman of the<br />
Operations Committee, Principal<br />
Investors Funds and Principal<br />
Variable Contracts Funds<br />
• Regent, University of Washington<br />
• President, Kristianne Gates Blake,<br />
P.S. (accounting services)<br />
• February 2002 to June 2005,<br />
Chairman of the Audit Committee,<br />
RIC and RIF Trustee and Chairman<br />
of the Operations and Distribution<br />
Committee, WM Group of Funds,<br />
1999–2006<br />
47 • Director, Avista<br />
Corp; (electric<br />
utilities)<br />
• Trustee, Principal<br />
Investors Funds<br />
(investment<br />
company);<br />
• Trustee,<br />
Principal<br />
Variable<br />
Contracts Funds<br />
(investment<br />
company)<br />
Daniel P. Connealy<br />
Born June 6, 1946<br />
909 A Street<br />
Tacoma, Washington<br />
98402-1616<br />
Trustee since 2003<br />
Chairman of Audit<br />
Committee since<br />
2005<br />
Appointed until<br />
successor is<br />
duly elected and<br />
qualified<br />
Appointed until<br />
successor is<br />
duly elected and<br />
qualified<br />
• June 2004 to present, Senior Vice<br />
President and Chief Financial<br />
Officer, Waddell & Reed Financial,<br />
Inc.<br />
• 2001–2003, Vice President and Chief<br />
Financial Officer, Janus Capital<br />
Group Inc.<br />
47 None<br />
# Mr. Stark is also an officer and/or director of one or more affiliates of RIC and RIF and is therefore an Interested Trustee.<br />
Disclosure of Information about Fund Trustees and Officers 121
Russell Investment Funds<br />
Disclosure of Information about Fund Trustees and Officers, continued — December 31, 2008<br />
(Unaudited)<br />
Name,<br />
Age,<br />
Address<br />
Position(s) Held<br />
With Fund and<br />
Length of<br />
Time Served<br />
Term<br />
of<br />
Office*<br />
Principal Occupation(s)<br />
During the<br />
Past 5 Years<br />
No. of<br />
Portfolios<br />
in Russell<br />
Fund<br />
Complex<br />
Overseen<br />
by Trustee<br />
Other<br />
Directorships Held<br />
by Trustee<br />
INDEPENDENT TRUSTEES (continued)<br />
Jonathan Fine<br />
Born July 8, 1954<br />
909 A Street<br />
Tacoma, Washington<br />
98402-1616<br />
Trustee<br />
since 2004<br />
Appointed until<br />
successor is<br />
duly elected and<br />
qualified<br />
• President and Chief Executive<br />
Officer, United Way of King County,<br />
WA<br />
47 None<br />
Raymond P. Tennison, Jr.<br />
Born December 21, 1955<br />
909 A Street<br />
Tacoma, Washington<br />
98402-1616<br />
Trustee<br />
since 2000<br />
Chairman of the<br />
Nominating and<br />
Governance<br />
Committee since<br />
2007<br />
Appointed until<br />
successor is<br />
duly elected and<br />
qualified.<br />
Appointed until<br />
successor is<br />
duly elected and<br />
qualified<br />
• President, Simpson Investment<br />
Company and several additional<br />
subsidiary companies, including<br />
Simpson Timber Company, Simpson<br />
Paper Company and Simpson Tacoma<br />
Kraft Company<br />
47 None<br />
Jack R. Thompson,<br />
Born March 21, 1949<br />
909 A Street<br />
Tacoma, Washington<br />
98402-1616<br />
Trustee since 2005<br />
Appointed until<br />
successor is<br />
duly elected and<br />
qualified<br />
• September 2003 to present,<br />
Independent Board Chair and<br />
Chairman of the Audit Committee,<br />
Sparx Asia Funds<br />
• September 2007 to present, Director,<br />
Board Chairman, and Audit<br />
Committee Chairman, LifeVantage<br />
Corporation (health products<br />
company)<br />
• May 1999 to May 2003, President,<br />
Chief Executive Officer and Director,<br />
Berger Financial Group, LLC<br />
• May 1999 to May 2003, President<br />
and Trustee, Berger Funds<br />
47 • Director, Sparx<br />
Asia Funds<br />
(investment<br />
company)<br />
• Director, Board<br />
Chairman, and<br />
Audit<br />
Committee<br />
Chairman,<br />
LifeVantage<br />
Corporation<br />
(health products<br />
company)<br />
Julie W. Weston,<br />
Born October 2, 1943<br />
909 A Street<br />
Tacoma, Washington<br />
98402-1616<br />
Trustee<br />
since 2002<br />
Chairperson of the<br />
Investment<br />
Committee since<br />
2006<br />
Appointed until<br />
successor is<br />
duly elected and<br />
qualified<br />
Appointed until<br />
successor is<br />
duly elected and<br />
qualified<br />
• Retired 47 None<br />
* Each Trustee is subject to mandatory retirement at age 72.<br />
122 Disclosure of Information about Fund Trustees and Officers
Russell Investment Funds<br />
Disclosure of Information about Fund Trustees and Officers, continued — December 31, 2008<br />
(Unaudited)<br />
Name,<br />
Age,<br />
Address<br />
Position(s) Held<br />
with Fund and<br />
Length of<br />
Time Served<br />
Term<br />
of<br />
Office<br />
Principal Occupation(s)<br />
During the<br />
Past 5 Years<br />
No. of<br />
Portfolios<br />
in Russell<br />
Fund<br />
Complex<br />
Overseen<br />
by Trustee<br />
Other<br />
Directorships Held<br />
by Trustee<br />
TRUSTEES EMERITUS<br />
*George F. Russell, Jr.,<br />
Born July 3, 1932<br />
909 A Street<br />
Tacoma, Washington<br />
98402-1616<br />
Trustee Emeritus and<br />
Chairman Emeritus<br />
since 1999<br />
Until resignation<br />
or removal<br />
• Director Emeritus, Frank Russell<br />
Company (investment consultant to<br />
institutional investors (“FRC”)); and<br />
RIMCo<br />
• Chairman Emeritus, RIC and RIF;<br />
Russell Implementation Services<br />
Inc. (broker-dealer and investment<br />
adviser (“RIS”)); Russell 20-20<br />
Association (non-profit corporation);<br />
and Russell Trust Company (nondepository<br />
trust company (“RTC”))<br />
• Chairman, Sunshine Management<br />
Services, LLC (investment adviser)<br />
47 None<br />
Paul E. Anderson,<br />
Born October 15, 1931<br />
909 A Street<br />
Tacoma, Washington<br />
98402-1616<br />
Trustee Emeritus<br />
since 2007<br />
Five year term<br />
• President, Anderson Management<br />
Group LLC (private investments<br />
consulting)<br />
• February 2002 to June 2005, Lead<br />
Trustee, RIC and RIF<br />
• Trustee of RIC and RIF until 2006<br />
• Chairman of the Nominating and<br />
Governance Committee 2006<br />
47 None<br />
William E. Baxter,<br />
Born June 8, 1925<br />
Trustee Emeritus<br />
since 2004<br />
Five year term • Retired since 1986<br />
• Trustee of RIC and RIF until 2004<br />
47 None<br />
909 A Street<br />
Tacoma, Washington<br />
98402-1616<br />
Lee C. Gingrich,<br />
Born October 6, 1930<br />
909 A Street<br />
Tacoma, Washington<br />
98402-1616<br />
Trustee Emeritus<br />
since 2006<br />
Five year term • Retired since 1995<br />
• Trustee of RIC and RIF until 2005<br />
• Chairman of the Nominating and<br />
Governance Committee 2001–2005<br />
47 None<br />
Eleanor W. Palmer,<br />
Born May 5, 1926<br />
Trustee Emeritus<br />
since 2004<br />
Five year term • Retired since 1981<br />
• Trustee of RIC and RIF until 2004<br />
47 None<br />
909 A Street<br />
Tacoma, Washington<br />
98402-1616<br />
* Mr. Russell is also a director emeritus of one or more affiliates of RIC and RIF.<br />
Disclosure of Information about Fund Trustees and Officers 123
Russell Investment Funds<br />
Disclosure of Information about Fund Trustees and Officers, continued — December 31, 2008<br />
(Unaudited)<br />
Name,<br />
Age,<br />
Address<br />
Position(s) Held<br />
with Fund and<br />
Length of<br />
Time Served<br />
Term<br />
of<br />
Office<br />
Principal Occupation(s)<br />
During the<br />
Past 5 Years<br />
OFFICERS<br />
Cheryl Wichers<br />
Born December 16, 1966<br />
909 A Street<br />
Tacoma, Washington<br />
98402-1616<br />
Chief Compliance<br />
Officer since 2005<br />
Until removed<br />
by Independent<br />
Trustees<br />
• Chief Compliance Officer, RIC<br />
• Chief Compliance Officer, RIF<br />
• Chief Compliance Officer, RIMCo<br />
• Chief Compliance Officer, RFSC<br />
• April 2002–May 2005, Manager, Global Regulatory Policy<br />
Greg J. Stark,<br />
Born May 3, 1968<br />
909 A Street<br />
Tacoma, Washington<br />
98402-1616<br />
President and Chief<br />
Executive Officer<br />
since 2004<br />
Until successor<br />
is chosen and<br />
qualified by<br />
Trustees<br />
• President and CEO, RIC and RIF<br />
• Chairman of the Board, President and CEO, RIMCo<br />
• Chairman of the Board, President and CEO, Russell Financial<br />
Services, Inc.<br />
• Chairman of the Board, President and CEO, RFSC<br />
• Chairman of the Board and President, Russell Insurance Agency,<br />
Inc. (insurance agency (“RIA”))<br />
• Until 2004, Managing Director of Individual Investor Services, FRC<br />
• 2000 to 2004, Managing Director, Sales and Client Service, RIMCo<br />
Mark E. Swanson,<br />
Born November 26, 1963<br />
909 A Street Tacoma,<br />
Washington 98402-1616<br />
Treasurer and Chief<br />
Accounting Officer<br />
since 1998<br />
Until successor<br />
is chosen and<br />
qualified by<br />
Trustees<br />
• Treasurer, Chief Accounting Officer and CFO, RIC and RIF<br />
• Director, Funds Administration, RIMCo, RFSC, RTC and Russell<br />
Financial Services, Inc.<br />
• Treasurer and Principal Accounting Officer, SSgA Funds<br />
Peter Gunning,<br />
Born February 22, 1967<br />
Chief Investment<br />
Officer since 2008<br />
Until removed<br />
by Trustees<br />
• Chief Investment Officer, RIC, RIF<br />
• 1996 to 2008 Chief Investment Officer, Russell, Asia Pacific<br />
909 A Street<br />
Tacoma, Washington<br />
98402-1616<br />
Gregory J. Lyons,<br />
Born August 24, 1960<br />
909 A Street<br />
Tacoma, Washington<br />
98402-1616<br />
Secretary since 2007<br />
Until successor<br />
is chosen and<br />
qualified by<br />
Trustees<br />
• Associate General Counsel and Assistant Secretary FRC and RIA<br />
• Director and Secretary, RIMCo, RFSC and Russell Financial<br />
Services, Inc.<br />
• Secretary and Chief Legal Counsel, RIC and RIF<br />
124 Disclosure of Information about Fund Trustees and Officers
Russell Investment Funds<br />
909 A Street, Tacoma, Washington 98402<br />
(800) 787-7354<br />
Interested Trustees<br />
Greg J. Stark<br />
Independent Trustees<br />
Thaddas L. Alston<br />
Kristianne Blake<br />
Daniel P. Connealy<br />
Jonathan Fine<br />
Raymond P. Tennison, Jr.<br />
Jack R. Thompson<br />
Julie W. Weston<br />
Trustees Emeritus<br />
George F. Russell, Jr.<br />
Paul E. Anderson<br />
William E. Baxter<br />
Lee C. Gingrich<br />
Eleanor W. Palmer<br />
Officers<br />
Greg J. Stark, President and Chief Executive Officer<br />
Cheryl Wichers, Chief Compliance Officer<br />
Peter Gunning, Chief Investment Officer<br />
Mark E. Swanson, Treasurer and Chief Accounting Officer<br />
Gregory J. Lyons, Secretary<br />
Adviser<br />
Russell Investment Management Company<br />
909 A Street<br />
Tacoma, WA 98402<br />
Administrator and Transfer and Dividend Disbursing<br />
Agent<br />
Russell Fund Services Company<br />
909 A Street<br />
Tacoma, WA 98402<br />
Custodian<br />
State Street Bank and Trust Company<br />
Josiah Quincy Building<br />
200 Newport Avenue<br />
North Quincy, MA 02171<br />
Office of Shareholder Inquiries<br />
909 A Street<br />
Tacoma, WA 98402<br />
(800) 787-7354<br />
Legal Counsel<br />
Dechert LLP<br />
200 Clarendon Street, 27th Floor<br />
Boston, MA 02116-5021<br />
Distributor<br />
Russell Financial Services, Inc.<br />
909 A Street<br />
Tacoma, WA 98402<br />
Independent Registered Public Accounting Firm<br />
PricewaterhouseCoopers LLP<br />
1420 5 th Avenue<br />
Suite 1900<br />
Seattle, WA 98101<br />
Money Managers as of December 31, 2008<br />
Multi-Style Equity Fund<br />
Arnhold and S. Bleichroeder Advisers, LLC, New York, NY<br />
Columbus Circle Investors, Stamford, CT<br />
DePrince, Race & Zollo, Inc., Winter Park, FL<br />
Institutional Capital LLC, Chicago, IL<br />
Jacobs Levy Equity Management, Inc., Florham Park, NJ<br />
Montag & Caldwell, Inc., Atlanta, GA<br />
Suffolk Capital Management, LLC, New York, NY<br />
Turner Investment Partners, Inc., Berwyn, PA<br />
Aggressive Equity Fund<br />
ClariVest Asset Management LLC, San Diego, CA<br />
DePrince, Race & Zollo, Inc., Winter Park, FL<br />
Gould Investment Partners LLC, Berwyn, PA<br />
Jacobs Levy Equity Management, Inc., Florham Park, NJ<br />
PanAgora Asset Management, Inc., Boston, MA<br />
Ranger Investment Management, L.P., Dallas, TX<br />
Signia Capital Management, LLC, Spokane, WA<br />
Tygh Capital Management, Inc., Portland, OR<br />
Non-U.S. Fund<br />
Altrinsic Global Advisors, LLC, Stamford, CT<br />
AQR Capital Management, LLC, Greenwich, CT<br />
MFS Institutional Advisors, Inc., Boston, MA<br />
Wellington Management Company, LLP, Boston, MA<br />
Real Estate Securities Fund<br />
AEW Management and Advisors, L.P., Boston, MA<br />
Cohen & Steers Capital Management, Inc., New York, NY<br />
Heitman Real Estate Securities LLC, Chicago, IL<br />
INVESCO Institutional (N.A.), Inc. which acts as a money<br />
manager to the Fund through its INVESCO Real Estate division,<br />
Dallas, TX<br />
RREEF America L.L.C., Chicago, IL<br />
Core Bond Fund<br />
Goldman Sachs Asset Management, L.P., New York, NY<br />
Metropolitan West Asset Management, LLC, Los Angeles, CA<br />
Pacific Investment Management Company LLC, Newport Beach, CA<br />
This report is prepared from the books and records of the Funds and is submitted for the general information of shareholders and is not<br />
authorized for distribution to prospective investors unless accompanied or preceded by an effective Prospectus. Nothing herein contained<br />
is to be considered an offer of sale or a solicitation of an offer to buy shares of Russell Investment Funds. Such offering is made only by<br />
Prospectus, which includes details as to offering price and other material information.<br />
Adviser, Money Managers and Service Providers 125
Russell Investment Funds 909 A Street 800-787-7354<br />
Tacoma, Washington 98402 Fax: 253-591-3495<br />
www.russell.com<br />
Cert no. SCS-COC-0063<br />
36-08-023
2008 ANNUAL REPORT<br />
Russell<br />
Investment Funds<br />
LifePoints ® Funds Variable Target Portfolio Series<br />
DECEMBER 31, 2008<br />
FUND<br />
Moderate Strategy Fund<br />
Balanced Strategy Fund<br />
Growth Strategy Fund<br />
Equity Growth Strategy Fund
Russell Investment Funds<br />
Russell Investment Funds is a<br />
series investment company with<br />
nine different investment portfolios<br />
referred to as Funds. These<br />
financial statements report on four<br />
of these Funds.
Russell Investment Funds<br />
LifePoints ® Funds<br />
Variable Target Portfolio Series<br />
<strong>Annual</strong> Report<br />
December 31, 2008<br />
Table of Contents<br />
Page<br />
To Our Shareholders .................................................... 3<br />
Market Summary ....................................................... 4<br />
Moderate Strategy Fund ................................................ 10<br />
Balanced Strategy Fund ................................................ 16<br />
Growth Strategy Fund ................................................... 22<br />
Equity Growth Strategy Fund ........................................... 28<br />
Statements of Assets and Liabilities ..................................... 33<br />
Statements of Operations ............................................... 34<br />
Statements of Changes in Net Assets .................................... 36<br />
Financial Highlights .................................................... 38<br />
Notes to Financial Highlights ........................................... 40<br />
Notes to Financial Statements ........................................... 41<br />
Report of Independent Registered Public Accounting Firm .............. 48<br />
Tax Information ........................................................ 49<br />
Basis for Approval of Investment Advisory Contracts .................... 50<br />
Shareholder Requests for Additional Information ........................ 54<br />
Disclosure of Information about Fund Trustees and Officers ............. 55<br />
Adviser, Money Managers and Service Providers ........................ 59
Russell Investment Funds - LifePoints ® Funds Variable Target Portfolio Series<br />
Copyright© Russell Investments 2009. All rights reserved.<br />
Russell Investments is a Washington, USA corporation, which operates through subsidiaries worldwide and is a<br />
subsidiary of The <strong>Northwestern</strong> <strong>Mutual</strong> Life Insurance Company.<br />
Fund objectives, risks, charges and expenses should be carefully considered before<br />
investing. A prospectus containing this and other important information must precede<br />
or accompany this material. Please read the prospectus carefully before investing.<br />
Securities products and services offered through Russell Financial Services, Inc. (effective June 2,<br />
2008, the name changed from Russell Fund Distributors, Inc.), member FINRA, part of Russell<br />
Investments.<br />
Indices and benchmarks are unmanaged and cannot be invested in directly. Returns represent past performance,<br />
are not a guarantee of future performance, and are not indicative of any specific investment. Index return<br />
information is provided by vendors and although deemed reliable, is not guaranteed by Russell Investments or its<br />
affiliates.<br />
Russell Investments is the owner of the trademarks, service marks, and copyrights related to its respective indexes.<br />
Performance quoted represents past performance and does not guarantee future results. The investment return and<br />
principal value of an investment will fluctuate so that shares, when redeemed, may be worth more or less than their<br />
original cost. Current performance may be lower or higher than the performance data quoted.
To Our Shareholders<br />
We are pleased to provide you with the Russell Investment Funds 2008 <strong>Annual</strong> Report. It includes portfolio<br />
management discussions and fund-specific details that will give you an in-depth understanding of fund performance for<br />
the fiscal year ended December 31, 2008.<br />
It would be an understatement to say that 2008 has been a difficult year and the market crisis of the past couple of<br />
months has defied all predictions. Virtually no sector of the financial industry or the economy has been spared.<br />
All of us at Russell want you to know that we are sensitive to investor concerns. While market events have impacted the<br />
performance of the funds, we believe that investors are well-served by remaining focused on long-term disciplined<br />
investing in well-diversified, asset allocated portfolios.<br />
The Russell Investments team has years of experience in managing people’s money through various market cycles,<br />
trends and turnarounds. As always, we are monitoring our investment managers closely to ensure their adherence to their<br />
long-term strategies despite the recent disruptions.<br />
As we all collectively weather this storm, we believe now is the perfect time for you to talk with your financial advisor to<br />
ensure that your portfolio remains aligned with your long term goals.<br />
Each and every day we strive to improve financial security for people. We will not waiver in that commitment and<br />
sincerely appreciate your continued support.<br />
Best regards,<br />
Greg Stark<br />
Chief Executive Officer, Chairman and President<br />
Russell Investment Management Company<br />
To Our Shareholders 3
Russell Investment Funds<br />
Market Summary as of December 31, 2008 (Unaudited)<br />
U.S. Equity Markets<br />
For the fiscal year ending December 31, 2008, U.S. equity markets were remarkably weak, with the broad market<br />
Russell 3000 ® Index posting a 37.3% drop amid the worst financial crisis in almost a century. Major bankruptcies, the<br />
freezing of credit markets, and the widespread global recession fears which ensued — particularly during the third<br />
quarter and first half of the fourth quarter — drove investors to sell riskier assets as fear and panic pervaded the market.<br />
The economic crisis stemmed from issues in the financial sector. The U.S. housing market stood at the center of the<br />
financial sector’s problems. The housing slowdown that began in the summer of 2006 and continued in 2007 intensified<br />
throughout this fiscal year and led to rising loan default rates and home foreclosures which, in turn, led to further<br />
housing weakness. As home prices dropped and default rates increased, the value of derivative instruments, such as<br />
mortgage-backed securities, whose values were based on these mortgages, plummeted. This forced banks to take massive<br />
write-downs of book values as required by mark-to-market accounting. With the lack of certainty about the real book<br />
value of assets on the balance sheets of banks, banks have been unable and/or hesitant to lend funds to other banks.<br />
Despite aggressive interest rate cuts by the Federal Reserve Board (the “Federal Reserve”), which took the Federal<br />
Funds rate from 5.25% (in third quarter 2007) to a range between 0% and 0.25% (at fiscal year end), mortgage and other<br />
lending rates did not come down as quickly as banks used the wider lending spread to offset their substantial writedowns<br />
on book values. Over the last month and a half of the year, however, these rates did start to drop sharply. In<br />
addition to higher interest rates, banks having stricter lending standards had a profound impact on the availability of<br />
affordable credit for potential homebuyers, small businesses, and other borrowers.<br />
Due to write-downs, dwindling capital bases and a crisis of confidence in their businesses, several large banks, brokers,<br />
mortgage companies and insurance companies filed for bankruptcy, were seized by the federal government and resold, or<br />
were bailed out by the government during the fiscal year, with the most notable ones being Countrywide Financial, Bear<br />
Stearns, IndyMac Bancorp, Lehman Brothers, Federal National Mortgage Association (Fannie Mae), Federal Home Loan<br />
Mortgage Corporation (Freddie Mac), American International Group (AIG), Washington <strong>Mutual</strong> and Wachovia. Amid<br />
concerns of additional bankruptcies and uncertainty surrounding which institutions may be bailed out by the<br />
government, the fear-driven environment has persisted. In addition, there have been a number of problems at hedge<br />
funds, leading to massive deleveraging, or forced selling of assets, in order to meet client redemptions. This forced<br />
selling of assets has put severe downward pressure on many securities, particularly the highly-liquid larger cap U.S.<br />
stocks, regardless of those securities’ fundamentals.<br />
After more than four years of strong growth, corporate profits had dipped fairly sharply by the end of 2008, especially in<br />
the financial services sector. The growth rate of gross domestic product also fell, although it stayed marginally positive<br />
until the third quarter report which showed a contraction of 0.5%, the worst since the 2001 recession. There was<br />
significant deterioration since then, as fourth quarter GDP estimates are -4.2% on average. A significant reduction in<br />
consumer spending had the most substantial negative impact on the GDP number, as consumers became fearful due to<br />
rising unemployment levels, declining home values and increased difficulty in getting loans. The Consumer Confidence<br />
Index released by the Conference Board decreased to 38 in October — the lowest value in the history of the Index<br />
(started in February 1967). It increased slightly in November, before dropping back to the all-time low of 38 in<br />
December. The first half of the year also featured the negative impact of higher energy prices on consumer spending. Oil<br />
prices reached $147/barrel in mid-July before dropping sharply to below $40/barrel in December.<br />
Although the domestic economy slowed during the fiscal year, some segments of the U.S. equity market were helped in<br />
the first half of the year by strong exports to faster-growing, developing, non-U.S. economies. With approximately 40% of<br />
U.S. corporations’ revenues derived from international customers, the declining U.S. dollar in the first half of 2008<br />
provided increased demand for U.S. products abroad. During the second half of the year, however, the U.S. dollar rallied<br />
and the global economy slowed considerably. After being rewarded in the first half of 2008, exposure to companies tied<br />
to the global economy underwent a strong reversal that began in July 2008 and has been swift and dramatic. Higher<br />
valuation cyclical (more linked to the economic cycle) companies and those with more debt on their balance sheets were<br />
among the most negatively impacted over the course of the year. Companies that have high forecasted growth rates have<br />
also been hit hard as investors have become less confident that these growth rates can be sustained going forward.<br />
4 Market Summary
Russell Investment Funds<br />
In the wake of these powerful macroeconomic forces, the fiscal year presented a very difficult active management<br />
environment which was marked by three distinct themes: 1) largely indiscriminate selling of U.S. stocks by panic-driven,<br />
risk-averse investors concerned first about a U.S. recession and then about a global recession, 2) intense selling of<br />
financial stocks for a majority of the period, and 3) the strength of global companies for roughly the first half of the fiscal<br />
year as multinational companies with exposure to developing markets outpaced domestically-driven companies and<br />
commodity-related companies (especially energy) outperformed the general market by a wide margin.<br />
The weakening of the global economy over the last half of the year caused oil prices to fall from their record highs and<br />
led the other energy sector to sell off sharply. Over the course of the year, the worst performing sectors in the Russell<br />
3000 ® Index were other energy -53.6%, financial services -51.1%, the other sector (which is dominated by GE and<br />
contains other large conglomerates, (-50.9%), and materials & processing -47.3%. Meanwhile, the best performing<br />
sectors in the Russell 3000 ® Index were those that are considered to be more defensive. The slower-growing, less<br />
economically-sensitive consumer staples sector was the best relative performer -17.7%, followed by integrated oils<br />
-21.7%, health care -22.4%, and utilities -29%.<br />
Weakness was experienced across investment styles as well as the capitalization spectrum. While both the growth and<br />
value investment styles were down substantially, value outperformed growth in the small cap segment (Russell 2000 ®<br />
Value -28.9%, Russell 2000 ® Growth -38.5%) and to a lesser degree in the large cap segment (Russell 1000 ® Value<br />
-36.9%, Russell 1000 ® Growth -38.4%). In general, small cap stocks outperformed large caps (-33.8% and -37.6% for<br />
the Russell 2000 ® Index and Russell 1000 ® Index, respectively). Midcap and microcap stocks underperformed by the<br />
widest margins with the Russell Midcap ® Index down 41.5%, and the Russell Microcap ® Index down 39.8%.<br />
During 2008, the market environment was largely hostile for active management as investors sold stocks regardless of<br />
fundamentals, the basic determinants of a stock’s value. Small cap fund managers had the most difficult time relative to<br />
their benchmark. Growth managers across the capitalization spectrum also struggled as the shift away from higher growth<br />
stocks came quickly and sharply. Core, or market-oriented, managers struggled less than style-focused managers in<br />
fiscal year 2008. The Lipper ® Small Cap Core Funds Average trailed the Russell 2000 ® Index by 2.7%, the Lipper ®<br />
Small Cap Growth Funds Average underperformed the Russell 2000 ® Growth Index by 3.6% and the Lipper ® Small Cap<br />
Value Funds Average underperformed the Russell 2000 ® Value Index by 4.9%. The Lipper ® Large Cap Core Funds<br />
Average outperformed the Russell 1000 ® Index by 0.1%, the Lipper ® Large Cap Growth Funds Average<br />
underperformed the Russell 1000 ® Growth Index by 1.8% and the Lipper ® Large Cap Value Funds Average<br />
underperformed the Russell 1000 ® Value Index by 0.6%.<br />
Real Estate Securities Market<br />
For the fiscal year ending December 31, 2008, U.S. real estate investment trusts (REITs) generated a 37.7% loss, as<br />
measured by the FTSE NAREIT Equity Index (Index). During this period, REITs performed slightly better than the<br />
broader equity market, which finished down 37.3% as measured by the Russell 3000 Index. The negative REIT<br />
performance was accompanied by an unprecedented amount of volatility during the period. Not only were monthly<br />
returns erratic, demonstrated by the worst and best monthly returns in the history of the Index occurring in October<br />
-31.7% and December 16.4%, respectively, but the largest percentage gain and loss achieved in a single day also both<br />
occurred during the year.<br />
Following the sharp decline in the commercial mortgage-backed securities market and escalating problems in the credit<br />
market, investors began 2008 more risk averse. As recessionary fears began to emerge, the Federal Reserve became<br />
active in an attempt to stave off concerns of a recession by cutting rates aggressively, twice in January alone, and<br />
injecting liquidity into the financial markets through a variety of initiatives. First and second quarter REIT earnings held<br />
up well, although many companies took the opportunity to revise 2009 estimates downwards.<br />
By September 2008, consumer spending had slowed, the unemployment rate was climbing and both corporate and<br />
consumer credit markets remained tight. The collapse of Lehman Brothers Holdings Inc. on September 15 sparked panic<br />
within the financial markets and REITs were heavily sold off over the ensuing weeks. Mirroring the broader equity<br />
market, REITs traded down sharply through October and most of November. A marked change in investor sentiment<br />
occurred in December as investors became less defensive and REITs staged a modest recovery as the year closed.<br />
An overriding theme during the year was the elevated correlation between REITs and the financial services sector of the<br />
broader equity market. This is due to the fact that most broad equity indexes include REITs in the financial services<br />
sector. This weighed heavily on REIT performance during the period, as many general equity investors avoided financial<br />
services stocks and other investors took short positions in individual stocks and exchange traded funds in the financial<br />
Market Summary 5
Russell Investment Funds<br />
services sector. This was also a contributing factor to the exceptionally high volatility observed in the REIT market<br />
during the fiscal year.<br />
Another key trend during the year was a flight towards quality REIT names, with the market especially rewarding<br />
companies that have made a concerted effort to mitigate risk. Companies with the lowest leverage levels, limited near<br />
term refinancing needs and limited development pipelines held up the best. Neither dividend yield nor market<br />
capitalization appeared to be contributing factors to differences in individual company performance.<br />
During the year, returns were disappointing across all property sectors. The poorest performing sectors were industrial<br />
and regional malls. Leverage ratios for the industrial and regional malls companies tend to be higher than the overall<br />
REIT universe, which has negatively impacted those stocks. In addition, meaningful development pipelines in the<br />
leading industrial companies have put added pressure on earnings forecasts due to weaker leasing market conditions.<br />
Two of the better performing property sectors were self storage and health care. Due to the stable nature of the cash flows<br />
embedded in many health care leases, investors sought out this defensive sector given the slowing economy. The self<br />
storage sector is generally driven by the performance of one company that dominates the sector, Public Storage, which<br />
was one of the few stocks to post a positive return for the year. Public Storage held up well due to its strong balance<br />
sheet, including minimal leverage and high levels of cash.<br />
The U.S. REIT market outperformed relative to the international real estate securities market by a wide margin during<br />
the fiscal year. The largest price correction occurred in the Asia Pacific region, with smaller corrections taking place in<br />
Continental Europe and the United Kingdom. While the effects of the global economic slowdown and credit crisis have<br />
spread to the other regions, the U.S. REIT market has fared relatively better, mirroring trends in the broader global<br />
equity markets.<br />
Non-U.S. Developed Equity Markets<br />
Non-U.S. developed stocks fell 43.38% as measured by the MSCI EAFE ® Index for the fiscal year ended December 31,<br />
2008. Appreciation of the U.S. dollar relative to foreign currencies, mainly as a result of the flight to safety in the second<br />
half of the fiscal year ended, exacerbated already weak non-U.S. equity returns. In local currencies, the MSCI EAFE ®<br />
Index fell 40.27% over the 12-month period.<br />
The market struggled under increasing concern over the health of the global financial system. While these concerns<br />
affected markets for nearly the full 12 months, most of the decline in equity values came in September and October<br />
2008, as several prominent financial companies in the U.S. and Europe encountered financial distress. In nearly all<br />
cases, government “bailouts” were necessary for these companies to avoid bankruptcy.<br />
The additional impact of already declining global economic growth increasingly weighed on markets during the period.<br />
Expectations for global economic growth were revised downwards throughout the year. The latter part of the fiscal year<br />
experienced contraction in economic output in Europe and Asia. Output growth of 5% in 2007 slowed sharply for 2008<br />
with abbreviated expectations for growth in developed economies in 2009.<br />
The change in market conditions was evident in a marked increase in market volatility as investors’ complacency<br />
towards risk was quickly replaced by acute risk aversion. Stocks with prices most directly tied to high, long-term growth<br />
prospects suffered some of the steepest declines, as investors doubted the ability of these companies to post strong<br />
growth in a decelerating economic environment. However, due to the sharp declines of financials, the largest sector of<br />
the value index, value lagged growth by 1.39% in the period (the MCSI EAFE Growth Index lost 42.70% and the MSCI<br />
EAFE Value Index lost 44.09%).<br />
Market sectors most leveraged to global economic growth or in the nexus of the financial sector meltdown were the most<br />
severely impacted, though no areas of the market were immune. Financials ended the 12-month period down 55.21% (as<br />
measured by the MSCI EAFE Index financials sector grouping). The strong gains of materials early in the period were<br />
quickly reversed. The sector ended the period down nearly 53.02% as measured by the MSCI EAFE materials sector<br />
grouping. Energy stocks also fell sharply as the price of a barrel of oil fell from a high of more than $145 to below $36.<br />
However, the sector’s one-year stock price decline of 38.18% (as measured by the MSCI EAFE energy sector) was better<br />
than all but the traditionally defensive sectors. Among the defensive sectors of the market, health care, led by<br />
pharmaceutical stocks, held up best with a decline of 18.95% as measured by the MSCI EAFE health care sector.<br />
Utilities and consumer staples, down 28.16% and 31.33% as measured by the MSCI EAFE utilities and MSCI EAFE<br />
consumer staples sector groupings, respectively, were the next best performers. Sector groupings are based on the Global<br />
Industry Classification Standard definitions.<br />
6 Market Summary
Russell Investment Funds<br />
Regional results were generally tied to sensitivity to global economic conditions. The MSCI Pacific ex-Japan ® Index<br />
declined the most, down 50.50%. MSCI Europe ex-United Kingdom ® Index fell 45.54%, while the MSCI United<br />
Kingdom ® Index fell 48.34%. In all three regions, currency impact had a pronounced impact on returns with the regions<br />
down 42.17%, 43.24%, and 28.48%, respectively, in local currencies. MSCI Japan ® Index fell 42.56% in yen, but had<br />
one of the few currencies that managed to appreciate versus the U.S. dollar and fell only 29.21% in U.S. Dollars.<br />
Emerging Markets<br />
During 2008, the MSCI Emerging Markets Index (“Index”) declined 53.18%, the biggest calendar year decline in the<br />
history of the asset class with large return dispersions across sectors and countries. The turmoil in the world’s financial<br />
system meant increasing risk aversion, growing macro risks and heightened levels of volatility and dispersion across<br />
countries, sectors and currencies. Emerging Markets in general may be better positioned and more resilient to a<br />
downturn than developed economies, however, as the crisis changed from financial to economic, emerging markets faced<br />
massive asset de-leveraging and indiscriminate selling as investors adopted a zero tolerance to risk. Price momentum<br />
(i.e. stocks exhibiting trending relative price appreciation) benefited from the continued rally of commodity-related<br />
sectors through the latter part of 2007 and well into 2008 but this reversed as global equity markets began falling<br />
sharply. The faltering global economy and the steep pull-back in commodity prices affected cyclical areas of the market<br />
including industrials, materials and energy sectors while defensive sectors such as healthcare, consumer staples and<br />
utilities were relative safe havens during the period. From a country perspective, smaller markets in general held up<br />
relatively better than the larger markets. In addition to the weak equity returns, most emerging markets currencies<br />
depreciated against the U.S. Dollar with some, such as the South African Rand, Korean Won, Turkish Lira and Brazilian<br />
Real, losing in excess of 30% over the course of the year as investors fled to quality and more liquid currencies.<br />
In terms of regions, Latin America was the top performer, down 51.28% (as measured by the MSCI EM Latin America<br />
Index), supported by the relative outperformance from Mexico and the smaller Latin countries. The Asia region (-52.77%<br />
as measured by the MSCI EM Asia Index) finished behind Latin America but ahead of the broader market. The Europe,<br />
Middle East and Africa region (-55.60% as measured by the MSCI EM Europe, Middle East and Africa Index)<br />
underperformed the broader market due in large part to the significant underperformance from Russia. The BRIC (Brazil,<br />
Russia, India and China) economies, with the exception of China, underperformed the broader Index. China held up<br />
reasonably well over the period due to favorable monetary and fiscal policies during the latter half of the year in an effort<br />
to shore up its slowing economy. Other notable relative underperformers included Pakistan (-74.05% as measured by the<br />
MSCI Pakistan Index) and Turkey (-62.10% as measured by the MSCI Turkey Index).<br />
U.S. Fixed Income Markets<br />
The Barclays Capital U.S. Aggregate Bond Index, a broad measure of U.S. investment grade fixed income securities,<br />
returned 5.24% for the year ended December 31, 2008. Similar to the prior year, the index and its major sectors trailed<br />
equivalent-duration U.S. Treasuries, as the subprime mortgage crisis that started in the summer of 2007 deepened and<br />
developed into a severe liquidity crisis, the size and scope of which had not been seen since the U.S. Great Depression of<br />
the 1930s. During 2008, investors moved their capital away from riskier investments to the safest possible investments<br />
(i.e., U.S. Treasuries), continuing the “flight to quality” trend started in the prior period.<br />
Throughout 2008, in an effort to deal with credit market illiquidity and a slowing economy, the Federal Reserve lowered<br />
the target Federal Funds rate eight times, including two non-scheduled “surprise” cuts of 0.75% in January and 0.50%<br />
in October. The target rate started the year at 4.25% and ended at a 0.00% to 0.25% range after the eighth rate cut on<br />
December 16, 2008.<br />
The downward shift in the yield curve started in 2007 and continued in earnest in 2008, with the curve “steepening”<br />
significantly below the 10-year mark; i.e., yields on shorter-maturity Treasuries declined by a greater degree than longermaturity<br />
Treasuries, resulting in a steeper, upward sloping curve. The change was driven by the Federal Reserve’s<br />
lowering of rates (affecting the short end) and investors’ increasing demand for safe haven U.S. Treasuries (driving down<br />
longer-maturity yields). In 2008, yields on 2-year Treasuries declined by 2.28% to 0.76% while 10-year Treasuries<br />
declined by 1.81% to 2.21%.<br />
The subprime mortgage crisis and deflating housing market were still major issues throughout the year. Home price<br />
depreciation continued to accelerate. By the end of October, the average U.S. national home price as tracked by the<br />
S&P/Case-Shiller Composite 20 Index, had declined 18% from the end of 2007, reaching a level that was down 23%<br />
from its July 2006 peak. Subprime mortgage foreclosures increased from 8.65% at the end of December 2007 to 12.55%<br />
at the end of September 2008, the most recent available data from the Mortgage Bankers Association. Total foreclosures<br />
increased from 2.04% to 2.97% during the same period. Writedowns on the values of mortgages had a large negative<br />
Market Summary 7
Russell Investment Funds<br />
impact on bank balance sheets. During the year, writedowns at financial institutions world-wide amounted to<br />
approximately $930.3 billion, bringing total writedowns since the start of the subprime crisis to approximately $997.4<br />
billion.<br />
During the early months of 2008 the market continued its downward trend, which was capped in mid-March by Bear<br />
Stearns receiving emergency funding from the Federal Reserve and JPMorgan Chase as a three-day run on the bank<br />
depleted its cash reserves. Two days later JPMorgan Chase acquired Bear Stearns for seven percent of its market value<br />
in a sale brokered by the Federal Reserve and the U.S. Department of the Treasury (U.S. Treasury). Investors took this as<br />
a sign that the U.S. government would stand behind financial institutions and credit markets rallied for the next few<br />
months.<br />
During the first part of the year, the U.S. government had become increasingly concerned that the credit crisis would<br />
significantly slow the U.S. economy — particularly the spending of consumers, who account for approximately two-thirds<br />
of GDP. In April, the U.S. Internal Revenue Service started distributing tax rebates as part of a $168 billion economic<br />
stimulus plan.<br />
However, markets continued to weaken as illiquidity reached extreme levels and the financial crisis became global in<br />
scope. In July, IndyMac Bancorp, the then-second-biggest independent U.S. mortgage lender, was seized by federal<br />
regulators after a run by depositors depleted its cash. In August, Commerzbank AG agreed to buy Allianz SE’s Dresdner<br />
Bank for 9.8 billion euros in Germany’s biggest banking takeover in three years.<br />
September started with the U.S. government seizing control of Fannie Mae and Freddie Mac, the largest U.S. mortgagefinance<br />
companies. In the middle of the month, the U.S. government did not arrange a deal or otherwise bail out Lehman<br />
Brothers, and the 158-year old firm filed the largest bankruptcy in U.S. history. This was followed by the bankruptcy of<br />
119-year old Washington <strong>Mutual</strong>. AIG accepted an $85 billion loan from the Federal Reserve to avert what would have<br />
been the worst financial collapse in history, with the U.S. government taking a substantial ownership stake in AIG.<br />
In the same month, the investment banking business model fundamentally changed, with Goldman Sachs and Morgan<br />
Stanley receiving approval to become deposit-taking commercial banks regulated by the Federal Reserve, as tight credit<br />
markets forced Wall Street’s two remaining independent investment banks to widen their sources of funding. Similar<br />
events occurred in Europe and throughout the world, with large financial institutions either merging or with governments<br />
providing support in return for equity stakes.<br />
September finally ended with the U.S. Treasury proposing the Financial Market Rescue Bill, including the Troubled<br />
Asset Relief Program (TARP), which authorized the U.S. Treasury to spend up to $700 billion to buy mortgages and<br />
other distressed assets. The House initially rejected the bill, but subsequently passed it. The bill was signed into law in<br />
early October.<br />
The events of September contributed to the extreme market illiquidity in October, evidenced by spikes in overnight and<br />
three-month LIBOR (the rates at which banks lend to one another). The Federal Reserve took significant steps to<br />
improve liquidity in the short duration markets, which included the creation of the Commercial Paper Funding Facility<br />
(CPFF) and the Money Market Investor Funding Facility (MMIFF).<br />
In November, the U.S. Treasury gave additional support to AIG by announcing the purchase of $40 billion in new<br />
preferred stock. The U.S. Treasury then guaranteed $306 billion in residential and commercial mortgage-backed<br />
securities of Citi ® in exchange for $7 billion in preferred stock. In addition, the U.S. Treasury purchased another $20<br />
billion in preferred stocks from Citi. Shortly thereafter, the Government Sponsored Enterprise (GSE) Debt and Mortgage-<br />
Backed Security Purchase Program was announced stating that the Federal Reserve will buy $100 billion in Fannie Mae,<br />
Freddie Mac and the Federal Home Loan Bank debentures and $500 billion in agency mortgage-backed securities.<br />
Simultaneously, the Term Asset-Backed Securities Loan Facility (TALF) was announced by the U.S. Treasury offering to<br />
provide $200 billion in three-year loans to U.S. companies who can provide high quality AAA-rated auto loans, student<br />
loans, credit card loans or small business loans as collateral.<br />
This trend continued in December as Congress agreed to provide $13.4 billion in short term loans to General Motors and<br />
$4 billion to Chrysler in an effort to aid the suffering auto industry.<br />
December ended on an up note with a majority of fixed income sectors outperforming equivalent-duration Treasuries.<br />
Most notably, the commercial mortgage-backed securities sector (CMBS) returned 16.98% (15.14% above equivalentduration<br />
Treasuries) during the month. The year ended with the Barclays Capital U.S. Aggregate Bond Index returning<br />
5.24%, underperforming by 7.10% U.S. Treasuries.<br />
8 Market Summary
(This page intentionally left blank)
Russell Investment Funds<br />
Moderate Strategy Fund<br />
Portfolio Management Discussion and Analysis — December 31, 2008 (Unaudited)<br />
Growth of a $10,000 Investment<br />
$12,000<br />
$11,000<br />
Moderate Strategy Fund<br />
Russell 1000® Index***<br />
Barclays Capital U.S. Aggregate Bond Index**<br />
$10,000<br />
$9,000<br />
$8,000<br />
$7,000<br />
$6,000<br />
Inception* 2007 2008<br />
Yearly periods ended December 31<br />
Moderate Strategy Fund<br />
Total<br />
Return<br />
1 Year (20.39)%<br />
Inception* (10.92)%§<br />
Barclays Capital U.S. Aggregate Bond Index **<br />
Total<br />
Return<br />
1 Year 5.24%<br />
Inception * 6.05%§<br />
Russell 1000 ® Index***<br />
Total<br />
Return<br />
1 Year (37.60)%<br />
Inception * (24.45)%§<br />
* The Fund commenced operation on April 30, 2007.<br />
** On October 31, 2008, Barclays Capital, which acquired the Lehman family of indexes in September 2008, announced that it would be re-branding<br />
Lehman indexes under the Barclays Capital name; the underlying index structures are to remain unchanged. As a result, the Lehman Brothers Aggregate<br />
Bond Index has been renamed the Barclays Capital U.S. Aggregate Bond Index.<br />
Barclays Capital U.S. Aggregate Bond Index is composed of securities from Barclays Capital U.S. Government/Corporate Bond Index, Mortgage-Backed<br />
Securities Index, and the Asset-Backed Securities Index. Total return comprises price appreciation/depreciation and income as a percentage of the<br />
original investment. Indexes are rebalanced monthly by market capitalization.<br />
*** Russell 1000 ® Index includes the 1,000 largest companies in the Russell 3000 ® Index. The Russell 1000 ® Index represents the universe of stocks from<br />
which most active money managers typically select. The Russell 1000 ® Index return reflects adjustments from income dividends and capital gain<br />
distributions reinvested as of the ex-dividend dates.<br />
§ <strong>Annual</strong>ized.<br />
The performance shown in this section does not reflect any Insurance Company Separate Account or Policy Charges. Performance is historical and assumes<br />
reinvestment of all dividends and capital gains. Investment return and principal value will fluctuate so that an investor’s shares, when redeemed, may be worth<br />
more or less than when purchased. Past performance is not indicative of future results.<br />
10 Moderate Strategy Fund
Russell Investment Funds<br />
Moderate Strategy Fund<br />
Portfolio Management Discussion and Analysis — December 31, 2008 (Unaudited)<br />
The Fund is a fund of funds that invests in other Russell<br />
Investment Funds and Russell Investment Company mutual<br />
funds (the “Underlying Funds”). The Underlying Funds allocate<br />
most of their assets among multiple money managers. Russell<br />
Investment Management Company (“RIMCo”), as the<br />
Underlying Funds' advisor, may change the allocation of the<br />
Underlying Funds' assets among money managers at any time.<br />
An exemptive order from the Securities and Exchange<br />
Commission (SEC) permits RIMCo to engage or terminate a<br />
money manager in an Underlying Fund at any time, subject to<br />
the approval by the Underlying Fund’s Board without a<br />
shareholder vote.<br />
What is the Fund’s investment objective?<br />
The Moderate Strategy Fund (“Fund”) seeks to provide high<br />
current income and moderate long term capital appreciation.<br />
How did the Fund perform relative to its benchmark for<br />
the fiscal year ended December 31, 2008?<br />
For the fiscal year ended December 31, 2008, the Moderate<br />
Strategy Fund lost 20.39%. This compared to the Barclays<br />
Capital U.S. Aggregate Bond Index, which gained 5.24% during<br />
the same period. The Fund’s performance includes operating<br />
expenses, whereas the Index returns are unmanaged and do not<br />
include expenses of any kind. The Fund was negatively<br />
impacted by its allocation to all equity Underlying Funds and<br />
the fixed income Underlying Fund’s overweight to non-Treasury<br />
sectors.<br />
For the year ended December 31, 2008, the Moderate Strategy<br />
Lipper Composite – lost 20.53%. This result serves as a peer<br />
comparison and is expressed net of operating expenses.<br />
Each Underlying Fund has a benchmark reflective of its<br />
respective asset class. These benchmarks may be different than<br />
the Fund’s benchmark. The Fund’s benchmark represents the<br />
largest asset class of the Underlying Funds in which it invests.<br />
How did the market conditions described in the Market<br />
Summary report affect the Fund’s performance?<br />
The Fund is a fund of funds and its performance is based on the<br />
performance of the Underlying Funds in which it invests. The<br />
Fund’s performance was negatively impacted by the financial<br />
crisis that affected virtually all asset classes during the fiscal<br />
year. The Fund’s benchmark relative performance was<br />
negatively impacted by the fixed income Underlying Fund’s<br />
overweight to non-treasury sectors.<br />
The largest impact on the Fund’s underperformance relative to<br />
its benchmark was from its exposure to large cap U.S. equities<br />
and non-U.S. developed market equities. The performance of<br />
the equity Underlying Funds (approximately 40% of the Fund)<br />
detracted from returns relative to the Fund’s all-fixed income<br />
benchmark, the Barclays Capital U.S. Aggregate Bond Index.<br />
The extreme volatility of the financial markets during the fiscal<br />
period created a headwind for most active managers. In this<br />
challenging environment, all underlying equity asset class<br />
funds lagged their respective benchmarks but one; yet, four of<br />
eight Underlying Funds outperformed their peers within their<br />
asset classes as measured by their respective Lipper ®<br />
Averages. The Barclays Capital U.S. Aggregate Bond Index, the<br />
benchmark for the RIF Core Bond Underlying Fund, was the<br />
only Underlying Fund benchmark with a positive absolute<br />
return. The returns of this index benefited from the inclusion of<br />
Treasuries. The RIF Core Bond Underlying Fund held a<br />
significant underweight to Treasuries relative to the benchmark.<br />
In absolute terms, bonds as measured by the Barclays Capital<br />
U.S. Aggregate Bond Index performed better than equities.<br />
How did the investment strategies and techniques<br />
employed by the Fund and its money managers of the<br />
Underlying Funds affect the Fund’s performance?<br />
At the Fund level, all Underlying Funds contributed negatively<br />
to the Fund’s returns relative to the Barclays Capital U.S.<br />
Aggregate Bond Index. The RIF Core Bond Underlying Fund,<br />
however, detracted less from the Fund’s benchmark-relative<br />
performance than the equity Underlying Funds.<br />
By far, the largest affect on the fixed income Underlying Fund’s<br />
underperformance relative to its benchmark was from the<br />
re-pricing of risk (i.e., the market demanding increased<br />
compensation for assuming a given level of risk), the<br />
fundamental concern regarding the consumer’s ability to make<br />
mortgage payments, and the negative impact that market and<br />
credit issues had on virtually all non-Treasury segments of the<br />
fixed income markets. This Underlying Fund had a material<br />
overweight to mortgage-backed securities. This contributed<br />
significantly to this Underlying Fund’s benchmark-relative<br />
underperformance. The decrease in interest rates across the<br />
yield curve had little impact on that Underlying Fund’s<br />
performance as its money managers implemented offsetting<br />
duration strategies. Yet, as the Federal Reserve decreased the<br />
federal funds target rate, short-term yields declined relative to<br />
intermediate- and long-term yields resulting in a yield curve<br />
“steepening.” Several of the Underlying Fund’s money<br />
managers anticipated the change and varied the maturities of<br />
their securities accordingly, positioning their portfolios to<br />
benefit from these changes.<br />
The U.S. equity Underlying Funds maintained an overall<br />
preference for companies with above-average growth rates and<br />
attractive valuations. This positioning was not rewarded in 2008<br />
where investors were driven by fear, looking for relative safety<br />
and selling stocks regardless of fundamentals. U.S. large cap<br />
managers in the Underlying Fund using quantitative investment<br />
strategies added to returns by shorting several of the financial<br />
stocks that underperformed in the fiscal period. Yet, this was<br />
offset by managers employing growth and momentum strategies,<br />
which underperformed in this environment.<br />
Managers in the small cap U.S. equity Underlying Fund<br />
negatively impacted the Fund by underweighting the financials<br />
sector and overweighting the other energy sector. Small cap<br />
financials rebounded from their lows as the Federal Reserve<br />
and Treasury offered wide ranging forms of financial support.<br />
The prices of other energy stocks fell as the price of oil fell.<br />
Moderate Strategy Fund 11
Russell Investment Funds<br />
Moderate Strategy Fund<br />
Portfolio Management Discussion and Analysis — December 31, 2008 (Unaudited)<br />
Managers in non-U.S. developed markets Underlying Fund<br />
performed better than managers in global equity and emerging<br />
markets Underlying Funds. Yet the Fund’s higher allocation to<br />
the Non-U.S. developed markets Underlying Fund resulted in<br />
larger negative impact on the Fund’s benchmark relative<br />
performance. This Underlying Fund’s multi-style discipline<br />
provided some risk control during the fiscal period given the<br />
extreme variability in investment style and market leadership.<br />
More defensive strategies helped moderate the negative impact<br />
of strategies more focused on deteriorating economic conditions.<br />
In emerging markets, the returns of emerging markets<br />
Underlying Fund declined along with the returns of the asset<br />
class, which experienced its biggest calendar year decline in<br />
the history of the asset class. The asset class endured massive<br />
asset deleveraging and extreme levels of market volatility.<br />
Commodity-related sectors suffered most as the global economic<br />
slowdown cut demand.<br />
The real estate Underlying Fund focused primarily on the larger<br />
and more liquid REITs during the fiscal year. With the<br />
exceptional volatility experienced during the period due to the<br />
global economic crisis and cash outflows, this positioning hurt<br />
Fund performance. The Underlying Fund’s exposure to non-U.S.<br />
REITs, though beneficial in the last quarter of the fiscal period,<br />
negatively impacted returns for the year.<br />
The Funds’ performance shown throughout this report was<br />
based on the Underlying Funds’ valuations calculated in<br />
accordance with Generally Accepted Accounting Principles<br />
(GAAP) and in accordance with a newly effective accounting<br />
statement (SFAS 157), reflects the December 31, 2008 market<br />
value of the pooled investment vehicle in which the Underlying<br />
Funds invested their cash collateral received in securities<br />
lending transactions. The market value was lower than the<br />
vehicle’s amortized cost per unit. This had a negative impact on<br />
the Fund’s benchmark relative performance.<br />
Describe any changes to the Fund’s structure or<br />
allocation to the Underlying Funds.<br />
In September, 2008, certain of the Underlying Funds in which<br />
the Fund invested (the “Former Underlying Funds”) changed as<br />
set forth below as the result of the reorganization (the<br />
“Reorganizations”) of the Former Underlying Funds into other<br />
Russell Investment Company Funds (the “New Underlying<br />
Funds”).<br />
Former Underlying Fund<br />
Quantitative Equity Fund<br />
New Underlying Fund<br />
Russell U.S. Quantitative<br />
Equity Fund<br />
The New Underlying Fund has the same investment objective,<br />
principal investment strategies, investment policies and<br />
principal risks as the Former Underlying Fund which it<br />
replaced and the allocation of the Fund’s assets to the New<br />
Underlying Fund is the same as it was to the Former Underlying<br />
Fund.<br />
The views expressed in this report reflect those of the<br />
portfolio managers only through the end of the period<br />
covered by the report. These views do not necessarily<br />
represent the views of RIMCo, or any other person in<br />
RIMCo or any other affiliated organization. These views<br />
are subject to change at any time based upon market<br />
conditions or other events, and RIMCo disclaims any<br />
responsibility to update the views contained herein.<br />
These views should not be relied on as investment<br />
advice and, because investment decisions for a Russell<br />
Investment Fund (RIF) or Russell Investment Company<br />
(RIC) Fund are based on numerous factors, should not<br />
be relied on as an indication of investment decisions of<br />
any RIF or RIC Fund.<br />
12 Moderate Strategy Fund
Russell Investment Funds<br />
Moderate Strategy Fund<br />
Shareholder Expense Example — December 31, 2008 (Unaudited)<br />
Fund Expenses<br />
The following disclosure provides important information<br />
regarding each Fund’s Expense Example, which appears<br />
on each Fund’s individual page in this <strong>Annual</strong> Report.<br />
Please refer to this information when reviewing the<br />
Expense Example for a Fund.<br />
Example<br />
As a shareholder of the Fund, you incur two types of costs:<br />
(1) transaction costs, and (2) ongoing costs, including<br />
management fees and other Fund expenses. The Example is<br />
intended to help you understand your ongoing costs (in dollars)<br />
of investing in the Fund and to compare these costs with the<br />
ongoing costs of investing in other mutual funds. The Example<br />
is based on an investment of $1,000 invested at the beginning<br />
of the period and held for the entire period indicated, which for<br />
this Fund is from July 1, 2008 to December 31, 2008.<br />
Actual Expenses<br />
The information in the table under the heading “Actual<br />
Performance” provides information about actual account values<br />
and actual expenses. You may use the information in this<br />
column, together with the amount you invested, to estimate the<br />
expenses that you paid over the period. Simply divide your<br />
account value by $1,000 (for example, an $8,600 account value<br />
divided by $1,000 = 8.6), then multiply the result by the<br />
number in the first column in the row entitled “Expenses Paid<br />
During Period” to estimate the expenses you paid on your<br />
account during this period.<br />
Hypothetical Example for Comparison Purposes<br />
The information in the table under the heading “Hypothetical<br />
Performance (5% return before expenses)” provides information<br />
about hypothetical account values and hypothetical expenses<br />
based on the Fund’s actual expense ratio and an assumed rate<br />
of return of 5% per year before expenses, which is not the<br />
Fund’s actual return. The hypothetical account values and<br />
expenses may not be used to estimate the actual ending account<br />
balance or expenses you paid for the period. You may use this<br />
information to compare the ongoing costs of investing in the<br />
Fund and other funds. To do so, compare this 5% hypothetical<br />
example with the 5% hypothetical examples that appear in the<br />
shareholder reports of other funds.<br />
Please note that the expenses shown in the table are meant to<br />
highlight your ongoing costs only and do not reflect any<br />
transactional costs. Therefore, the information under the<br />
heading “Hypothetical Performance (5% return before<br />
expenses)” is useful in comparing ongoing costs only, and will<br />
not help you determine the relative total costs of owning<br />
different funds. In addition, if these transactional costs were<br />
included, your costs would have been higher. The fee and<br />
expenses shown in this section do not reflect any Insurance<br />
Company Separate Account or Policy Charges.<br />
Actual<br />
Performance<br />
Hypothetical<br />
Performance<br />
(5% return<br />
before expenses)<br />
Beginning Account Value<br />
July 1, 2008 $ 1,000.00 $ 1,000.00<br />
Ending Account Value<br />
December 31, 2008 $ 834.70 $ 1,024.58<br />
Expenses Paid During<br />
Period* $ 0.51 $ 0.56<br />
* Expenses are equal to the Fund’s annualized expense ratio of 0.11%<br />
(representing the one-half year period annualized), multiplied by the average<br />
account value over the period, multiplied by 184/366 (to reflect the one-half<br />
year period). Reflects amounts waived and/or reimbursed. Without the waiver<br />
and/or reimbursement, expenses would have been higher.<br />
Moderate Strategy Fund 13
Russell Investment Funds<br />
Moderate Strategy Fund<br />
Schedule of Investments — December 31, 2008<br />
Amounts in thousands (except share amounts)<br />
Investments -100.1%<br />
Other Russell Investment Funds<br />
(“RIF”) and Russell Investment<br />
Company (“RIC”) Series <strong>Mutual</strong><br />
Funds<br />
Shares<br />
Market<br />
Value<br />
$<br />
Bonds - 60.2%<br />
RIF Core Bond Fund 1,244,532 11,616<br />
Domestic Equities - 26.0%<br />
RIF Aggressive Equity Fund 79,710 572<br />
RIF Multi-Style Equity Fund 213,609 1,923<br />
RIF Real Estate Securities Fund 62,369 580<br />
RIC Russell U.S. Quantitative Equity Fund 91,374 1,942<br />
5,017<br />
International Equities - 13.9%<br />
RIF Non-U.S. Fund 230,326 1,724<br />
RIC Russell Emerging Markets Fund 38,863 383<br />
RIC Russell Global Equity Fund 100,888 579<br />
2,686<br />
Total Investments - 100.1%<br />
(identified cost $23,496) 19,319<br />
Other Assets and Liabilities,<br />
Net - (0.1%) (11)<br />
Net Assets - 100.0% 19,308<br />
See accompanying notes which are an integral part of the financial statements.<br />
14 Moderate Strategy Fund
(This page intentionally left blank)
Russell Investment Funds<br />
Balanced Strategy Fund<br />
Portfolio Management Discussion and Analysis — December 31, 2008 (Unaudited)<br />
Growth of a $10,000 Investment<br />
$12,000<br />
$11,000<br />
$10,000<br />
$9,000<br />
$8,000<br />
$7,000<br />
$6,000<br />
Balanced Strategy Fund<br />
Russell 1000® Index***<br />
MSCI EAFE® Index Net (USD)****<br />
Barclays Capital U.S. Aggregate Bond Index**<br />
$5,000<br />
Inception* 2007 2008<br />
Yearly periods ended December 31<br />
Balanced Strategy Fund<br />
Total<br />
Return<br />
1 Year (27.70)%<br />
Inception* (16.30)%§<br />
Russell 1000 ® Index***<br />
Total<br />
Return<br />
1 Year (37.60)%<br />
Inception* (24.45)%§<br />
Barclays Capital U.S. Aggregate Bond Index**<br />
Total<br />
Return<br />
1 Year 5.24%<br />
Inception* 6.05%§<br />
MSCI EAFE ® Index Net (USD)****<br />
Total<br />
Return<br />
1 Year (43.38)%<br />
Inception* (27.88)%§<br />
* The Fund commenced operation on April 30, 2007.<br />
** On October 31, 2008, Barclays Capital, which acquired the Lehman family of indexes in September 2008, announced that it would be re-branding Lehman<br />
indexes under the Barclays Capital name; the underlying index structures are to remain unchanged. As a result, the Lehman Brothers Aggregate Bond Index has<br />
been renamed the Barclays Capital U.S. Aggregate Bond Index.<br />
Barclays Capital U.S. Aggregate Bond Index is composed of securities from Barclays Capital U.S. Government/Corporate Bond Index, Mortgage-Backed<br />
Securities Index, and the Asset-Backed Securities Index. Total return comprises price appreciation/depreciation and income as a percentage of the original<br />
investment. Indexes are rebalanced monthly by market capitalization.<br />
*** Russell 1000 ® Index includes the 1,000 largest companies in the Russell 3000 ® Index. The Russell 1000 ® Index represents the universe of stocks from which<br />
most active money managers typically select. The Russell 1000 ® Index return reflects adjustments from income dividends and capital gain distributions<br />
reinvested as of the ex-dividend dates.<br />
**** Morgan Stanley Capital International Europe, Australia, Far East (MSCI EAFE) Index is an index composed of an arithmetic, market value-weighted average of<br />
the performance of approximately 1,600 securities listed on the stock exchange of the countries of Europe, Australia, and the Far East. The index is calculated<br />
on a total-return basis, which included reinvestment of gross dividends before deduction of withholding taxes.<br />
§ <strong>Annual</strong>ized.<br />
The performance shown in this section does not reflect any Insurance Company Separate Account or Policy Charges. Performance is historical and assumes<br />
reinvestment of all dividends and capital gains. Investment return and principal value will fluctuate so that an investor’s shares, when redeemed, may be worth more or<br />
less than when purchased. Past performance is not indicative of future results.<br />
16 Balanced Strategy Fund
Russell Investment Funds<br />
Balanced Strategy Fund<br />
Portfolio Management Discussion and Analysis — December 31, 2008 (Unaudited)<br />
Averages. The Barclays Capital U.S. Aggregate Bond Index, the<br />
The Fund is a fund of funds that invests in other Russell<br />
asset classes as measured by their respective Lipper ® exceptional volatility experienced during the period due to the<br />
Investment Funds and Russell Investment Company mutual<br />
funds (the “Underlying Funds”). The Underlying Funds allocate<br />
most of their assets among multiple money managers. Russell<br />
benchmark for the RIF Core Bond Underlying Fund, was the<br />
only Underlying Fund benchmark with a positive return. The<br />
returns of this index benefited from the inclusion of Treasuries.<br />
Investment Management Company (“RIMCo”), as the The RIF Core Bond Underlying Fund held a significant<br />
Underlying Funds' advisor, may change the allocation of the<br />
Underlying Funds' assets among money managers at any time.<br />
underweight to Treasuries relative to the benchmark. In<br />
absolute terms, bonds as measured by the Barclays Capital U.S.<br />
An exemptive order from the Securities and Exchange Aggregate Bond Index performed better than equities.<br />
Commission (SEC) permits RIMCo to engage or terminate a How did the investment strategies and techniques<br />
money manager in an Underlying Fund at any time, subject to employed by the Fund and its money managers of the<br />
the approval by the Underlying Fund’s Board without a Underlying Funds affect the Fund’s performance?<br />
shareholder vote.<br />
At the Fund level, all Underlying Funds contributed negatively<br />
What is the Fund’s investment objective?<br />
The Balanced Strategy Fund (“Fund”) seeks to provide above<br />
average capital appreciation and a moderate level of current<br />
income.<br />
to the Fund’s returns relative to the Barclays Capital U.S.<br />
Aggregate Bond Index. The RIF Core Bond, however, detracted<br />
less from the Fund’s benchmark-relative performance than the<br />
equity Underlying Funds.<br />
How did the Fund perform relative to its benchmark for<br />
The U.S. equity Underlying Funds maintained an overall<br />
the fiscal year ended December 31, 2008?<br />
preference for companies with above-average growth rates and<br />
For the fiscal year ended December 31, 2008, the Balanced<br />
attractive valuations. This positioning was not rewarded in 2008<br />
Strategy Fund lost 27.70%. This compared to the Barclays<br />
where investors were driven by fear, looking for relative safety<br />
Capital U.S. Aggregate Bond Index, which gained 5.24% during<br />
and selling stocks regardless of fundamentals. U.S. large cap<br />
the same period. The Fund’s performance includes operating<br />
managers in the Underlying Fund using quantitative investment<br />
expenses, whereas the Index returns are unmanaged and do not<br />
strategies added to returns by shorting several of the financial<br />
include expenses of any kind. The Fund was negatively<br />
stocks that underperformed in the fiscal period. Yet, this was<br />
impacted by its allocation to all equity Underlying Funds and<br />
offset by managers employing growth and momentum strategies,<br />
the fixed income Underlying Fund’s overweight to non-Treasury<br />
which underperformed in this environment.<br />
sectors.<br />
Managers in the small cap U.S. equity Underlying Fund<br />
For the year ended December 31, 2008, the Balanced Strategy<br />
negatively impacted the Fund by underweighting the financials<br />
Lipper Composite lost 27.65%. This result serves as a peer<br />
sector and overweighting the other energy sector. Small cap<br />
comparison and is expressed net of operating expenses.<br />
financials rebounded from their lows as the Federal Reserve<br />
Each Underlying Fund has a benchmark reflective of its and Treasury offered wide ranging forms of financial support.<br />
respective asset class. These benchmarks may be different than The prices of other energy stocks fell as the price of oil fell.<br />
the Fund’s benchmark. The Fund’s benchmark represents the<br />
Managers in the non-U.S. developed market Underlying Fund<br />
largest asset class of the Underlying Funds in which it invests.<br />
performed better than managers in global equity and emerging<br />
How did the market conditions described in the Market markets Underlying Funds. Yet the Fund’s higher allocation to<br />
Summary report affect the Fund’s performance?<br />
the Non-U.S. developed markets Underlying Fund resulted in a<br />
The Fund is a fund of funds and its performance is based on the larger negative impact on the Fund’s benchmark relative<br />
performance of the Underlying Funds in which it invests. The performance. This Underlying Fund’s multi-style discipline<br />
Fund’s performance was negatively impacted by the financial provided some risk control during the fiscal period given the<br />
crisis that affected virtually all asset classes during the fiscal extreme variability in investment style and market leadership.<br />
year. The largest impact on the Fund’s underperformance More defensive strategies helped moderate the negative impact<br />
relative to its benchmark was from its exposure to large cap U.S. of strategies more focused on deteriorating economic conditions.<br />
equities and non-U.S. developed market equities. The<br />
performance of the equity Underlying Funds (approximately In emerging markets, the returns of emerging markets<br />
60% of the Fund) detracted from returns relative to the Fund’s Underlying Fund declined along with the returns of the asset<br />
all-fixed income benchmark the Barclays Capital U.S. class, which experienced its biggest calendar year decline in<br />
Aggregate Bond Index.<br />
the history of the asset class. The asset class endured massive<br />
asset deleveraging and extreme levels of market volatility.<br />
The extreme volatility of the financial markets during the fiscal Commodity-related sectors suffered most as the global economic<br />
period created a headwind for most active managers. In this slowdown cut demand.<br />
challenging environment, all but one underlying equity asset<br />
class funds lagged their respective benchmarks; yet, four of<br />
eight Underlying Funds outperformed their peers within their<br />
The real estate Underlying Fund focused primarily on the larger<br />
and more liquid REITs during the fiscal year. With the<br />
Balanced Strategy Fund 17
Russell Investment Funds<br />
Balanced Strategy Fund<br />
Portfolio Management Discussion and Analysis — December 31, 2008 (Unaudited)<br />
global economic crisis and cash outflows, this positioning hurt<br />
Fund performance. The Underlying Fund’s exposure to non-U.S.<br />
REITs, though beneficial in the last quarter of the fiscal period,<br />
negatively impacted returns for the year.<br />
By far, the largest affect on the fixed income Underlying Fund’s<br />
underperformance relative to its benchmark was from the<br />
re-pricing of risk (i.e., the market demanding increased<br />
compensation for assuming a given level of risk), the<br />
fundamental concern regarding the consumer’s ability to make<br />
mortgage payments, and the negative impact that market and<br />
credit issues had on virtually all non-Treasury segments of the<br />
fixed income markets. This Underlying Fund had a material<br />
overweight to mortgage-backed securities. This contributed<br />
significantly to this Underlying Fund’s benchmark-relative<br />
underperformance. The decrease in interest rates across the<br />
yield curve had little impact on that Underlying Fund’s<br />
performance as its money managers implemented offsetting<br />
duration strategies. Yet, as the Federal Reserve decreased the<br />
federal funds target rate, short-term yields declined relative to<br />
intermediate- and long-term yields resulting in a yield curve<br />
“steepening.” Several of the Underlying Fund’s money<br />
managers anticipated the change and varied the maturities of<br />
their securities accordingly, positioning their portfolios to<br />
benefit from these changes<br />
The Funds’ performance shown throughout this report was<br />
based on the Underlying Funds’ valuations calculated in<br />
accordance with Generally Accepted Accounting Principles<br />
(GAAP) and in accordance with a newly effective accounting<br />
statement (SFAS 157), reflects the December 31, 2008 market<br />
value of the pooled investment vehicle in which the Underlying<br />
Funds invested their cash collateral received in securities<br />
lending transactions. The market value was lower than the<br />
vehicle’s amortized cost per unit. This had a negative impact on<br />
the Fund’s benchmark relative performance.<br />
Describe any changes to the Fund’s structure or<br />
allocation to the Underlying Funds.<br />
In September, 2008, certain of the Underlying Funds in which<br />
the Fund invested (the “Former Underlying Funds”) changed as<br />
set forth below as the result of the reorganization (the<br />
“Reorganizations”) of the Former Underlying Funds into other<br />
Russell Investment Company Funds (the “New Underlying<br />
Funds”).<br />
Former Underlying Fund<br />
Quantitative Equity Fund<br />
New Underlying Fund<br />
Russell U.S. Quantitative<br />
Equity Fund<br />
The New Underlying Fund has the same investment objective,<br />
principal investment strategies, investment policies and<br />
principal risks as the Former Underlying Fund which it<br />
replaced and the allocation of the Fund’s assets to the New<br />
Underlying Fund is the same as it was to the Former Underlying<br />
Fund.<br />
The views expressed in this report reflect those of the<br />
portfolio managers only through the end of the period<br />
covered by the report. These views do not necessarily<br />
represent the views of RIMCo, or any other person in<br />
RIMCo or any other affiliated organization. These views<br />
are subject to change at any time based upon market<br />
conditions or other events, and RIMCo disclaims any<br />
responsibility to update the views contained herein.<br />
These views should not be relied on as investment<br />
advice and, because investment decisions for a Russell<br />
Investment Fund (RIF) or Russell Investment Company<br />
(RIC) Fund are based on numerous factors, should not<br />
be relied on as an indication of investment decisions of<br />
any RIF or RIC Fund.<br />
18 Balanced Strategy Fund
Russell Investment Funds<br />
Balanced Strategy Fund<br />
Shareholder Expense Example — December 31, 2008 (Unaudited)<br />
Fund Expenses<br />
The following disclosure provides important information<br />
regarding each Fund’s Expense Example, which appears<br />
on each Fund’s individual page in this <strong>Annual</strong> Report.<br />
Please refer to this information when reviewing the<br />
Expense Example for a Fund.<br />
Example<br />
As a shareholder of the Fund, you incur two types of costs:<br />
(1) transaction costs, and (2) ongoing costs, including<br />
management fees and other Fund expenses. The Example is<br />
intended to help you understand your ongoing costs (in dollars)<br />
of investing in the Fund and to compare these costs with the<br />
ongoing costs of investing in other mutual funds. The Example<br />
is based on an investment of $1,000 invested at the beginning<br />
of the period and held for the entire period indicated, which for<br />
this Fund is from July 1, 2008 to December 31, 2008.<br />
Actual Expenses<br />
The information in the table under the heading “Actual<br />
Performance” provides information about actual account values<br />
and actual expenses. You may use the information in this<br />
column, together with the amount you invested, to estimate the<br />
expenses that you paid over the period. Simply divide your<br />
account value by $1,000 (for example, an $8,600 account value<br />
divided by $1,000 = 8.6), then multiply the result by the<br />
number in the first column in the row entitled “Expenses Paid<br />
During Period” to estimate the expenses you paid on your<br />
account during this period.<br />
Hypothetical Example for Comparison Purposes<br />
The information in the table under the heading “Hypothetical<br />
Performance (5% return before expenses)” provides information<br />
about hypothetical account values and hypothetical expenses<br />
based on the Fund’s actual expense ratio and an assumed rate<br />
of return of 5% per year before expenses, which is not the<br />
Fund’s actual return. The hypothetical account values and<br />
expenses may not be used to estimate the actual ending account<br />
balance or expenses you paid for the period. You may use this<br />
information to compare the ongoing costs of investing in the<br />
Fund and other funds. To do so, compare this 5% hypothetical<br />
example with the 5% hypothetical examples that appear in the<br />
shareholder reports of other funds.<br />
Please note that the expenses shown in the table are meant to<br />
highlight your ongoing costs only and do not reflect any<br />
transactional costs. Therefore, the information under the<br />
heading “Hypothetical Performance (5% return before<br />
expenses)” is useful in comparing ongoing costs only, and will<br />
not help you determine the relative total costs of owning<br />
different funds. In addition, if these transactional costs were<br />
included, your costs would have been higher. The fee and<br />
expenses shown in this section do not reflect any Insurance<br />
Company Separate Account or Policy Charges.<br />
Actual<br />
Performance<br />
Hypothetical<br />
Performance<br />
(5% return<br />
before expenses)<br />
Beginning Account Value<br />
July 1, 2008 $ 1,000.00 $ 1,000.00<br />
Ending Account Value<br />
December 31, 2008 $ 773.77 $ 1,024.73<br />
Expenses Paid During<br />
Period* $ 0.36 $ 0.41<br />
* Expenses are equal to the Fund’s annualized expense ratio of 0.08%<br />
(representing the one-half year period annualized), multiplied by the average<br />
account value over the period, multiplied by 184/366 (to reflect the one-half<br />
year period). Reflects amounts waived and/or reimbursed. Without the waiver<br />
and/or reimbursement, expenses would have been higher.<br />
Balanced Strategy Fund 19
Russell Investment Funds<br />
Balanced Strategy Fund<br />
Schedule of Investments — December 31, 2008<br />
Amounts in thousands (except share amounts)<br />
Investments - 100.0%<br />
Other Russell Investment Funds<br />
(“RIF”) and Russell Investment<br />
Company (“RIC”) Series <strong>Mutual</strong><br />
Funds<br />
Shares<br />
Market<br />
Value<br />
$<br />
Bonds - 39.3%<br />
RIF Core Bond Fund 2,535,119 23,663<br />
Domestic Equities - 39.6%<br />
RIF Aggressive Equity Fund 337,912 2,427<br />
RIF Multi-Style Equity Fund 1,007,644 9,069<br />
RIF Real Estate Securities Fund 337,627 3,138<br />
RIC Russell U.S. Quantitative Equity Fund 431,619 9,172<br />
23,806<br />
International Equities - 21.1%<br />
RIF Non-U.S. Fund 1,131,869 8,472<br />
RIC Russell Emerging Markets Fund 183,498 1,808<br />
RIC Russell Global Equity Fund 422,530 2,425<br />
12,705<br />
Total Investments - 100.0%<br />
(identified cost $81,252) 60,174<br />
Other Assets and Liabilities,<br />
Net - (0.0%) (16)<br />
Net Assets - 100.0% 60,158<br />
See accompanying notes which are an integral part of the financial statements.<br />
20 Balanced Strategy Fund
(This page intentionally left blank)
Russell Investment Funds<br />
Growth Strategy Fund<br />
Portfolio Management Discussion and Analysis — December 31, 2008 (Unaudited)<br />
Growth of a $10,000 Investment<br />
$12,000<br />
$11,000<br />
$10,000<br />
$9,000<br />
$8,000<br />
$7,000<br />
$6,000<br />
Growth Strategy Fund<br />
Russell 1000® Index**<br />
MSCI EAFE® Index Net (USD)***<br />
Barclays Capital U.S. Aggregate Bond Index****<br />
$5,000<br />
Inception* 2007 2008<br />
Yearly periods ended December 31<br />
Growth Strategy Fund<br />
Total<br />
Return<br />
1 Year (34.73)%<br />
Inception* (21.55)%§<br />
MSCI EAFE ® Index Net (USD)***<br />
Total<br />
Return<br />
1 Year (43.38)%<br />
Inception* (27.88)%§<br />
Russell 1000 ® Index**<br />
Total<br />
Return<br />
1 Year (37.60)%<br />
Inception* (24.45)%§<br />
Barclays Capital U.S. Aggregate Bond Index****<br />
Total<br />
Return<br />
1 Year 5.24%<br />
Inception* 6.05%§<br />
* The Fund commenced operation on April 30, 2007.<br />
** Russell 1000 ® Index includes the 1,000 largest companies in the Russell 3000 ® Index. The Russell 1000 ® Index represents the universe of stocks from which<br />
most active money managers typically select. The Russell 1000 ® Index return reflects adjustments from income dividends and capital gain distributions<br />
reinvested as of the ex-dividend dates.<br />
*** Morgan Stanley Capital International Europe, Australia, Far East (MSCI EAFE) Index is an index composed of an arithmetic, market value-weighted average of<br />
the performance of approximately 1,600 securities listed on the stock exchange of the countries of Europe, Australia, and the Far East. The index is calculated<br />
on a total-return basis, which included reinvestment of gross dividends before deduction of withholding taxes.<br />
**** On October 31, 2008, Barclays Capital, which acquired the Lehman family of indexes in September 2008, announced that it would be re-branding Lehman<br />
indexes under the Barclays Capital name; the underlying index structures are to remain unchanged. As a result, the Lehman Brothers Aggregate Bond Index has<br />
been renamed the Barclays Capital U.S. Aggregate Bond Index.<br />
Barclays Capital U.S. Aggregate Bond Index is composed of securities from Barclays Capital U.S. Government/Corporate Bond Index, Mortgage-Backed<br />
Securities Index, and the Asset-Backed Securities Index. Total return comprises price appreciation/depreciation and income as a percentage of the original<br />
investment. Indexes are rebalanced monthly by market capitalization.<br />
§ <strong>Annual</strong>ized.<br />
The performance shown in this section does not reflect any Insurance Company Separate Account or Policy Charges. Performance is historical and assumes<br />
reinvestment of all dividends and capital gains. Investment return and principal value will fluctuate so that an investor’s shares, when redeemed, may be worth more or<br />
less than when purchased. Past performance is not indicative of future results.<br />
22 Growth Strategy Fund
Russell Investment Funds<br />
Growth Strategy Fund<br />
Portfolio Management Discussion and Analysis — December 31, 2008 (Unaudited)<br />
The Fund is a fund of funds that invests in other Russell<br />
Investment Funds and Russell Investment Company mutual<br />
funds (the “Underlying Funds”). The Underlying Funds allocate<br />
most of their assets among multiple money managers. Russell<br />
Investment Management Company (“RIMCo”), as the<br />
Underlying Funds' advisor, may change the allocation of the<br />
Underlying Funds' assets among money managers at any time.<br />
An exemptive order from the Securities and Exchange<br />
Commission (SEC) permits RIMCo to engage or terminate a<br />
money manager in an Underlying Fund at any time, subject to<br />
the approval by the Underlying Fund’s Board without a<br />
shareholder vote.<br />
What is the Fund’s investment objective?<br />
The Growth Strategy Fund (“Fund”) seeks to provide high long<br />
term capital appreciation with low current income.<br />
How did the Fund perform relative to its benchmark for<br />
the fiscal year ended December 31, 2008?<br />
For the fiscal year ended December 31, 2008, the Growth<br />
Strategy Fund lost 34.73%. This compared to the Russell<br />
1000 ® Index, which lost 37.60% during the same period. The<br />
Fund’s performance includes operating expenses, whereas the<br />
Index returns are unmanaged and do not include expenses of<br />
any kind. The Fund’s performance was negatively impacted<br />
mostly by its allocation to all equities. This was partly offset by<br />
the Fund’s allocation to fixed income.<br />
For the year ended December 31, 2008, the Growth Strategy<br />
Lipper Composite lost 34.19%. This result serves as a peer<br />
comparison and is expressed net of operating expenses.<br />
Each Underlying Fund has a benchmark reflective of its<br />
respective asset class. These benchmarks may be different than<br />
the Fund’s benchmark. The Fund’s benchmark represents the<br />
largest asset class of the Underlying Funds in which it invests.<br />
How did the market conditions described in the Market<br />
Summary report affect the Fund’s performance?<br />
The Fund is a fund of funds and its performance is based on the<br />
performance of the Underlying Funds in which it invests. The<br />
Fund’s performance was negatively impacted by the financial<br />
crisis that affected virtually all asset classes during the fiscal<br />
year. The largest positive contribution to the Fund’s<br />
performance relative to its all-equity benchmark was from its<br />
exposure to fixed income through its investment in the RIF Core<br />
Bond Underlying Fund. The performance of the equity<br />
Underlying Funds (approximately 80% of the Fund) detracted<br />
from returns relative to the Fund’s benchmark, the Russell<br />
1000 ® Index.<br />
The extreme volatility of the financial markets during the fiscal<br />
period created a headwind for most active managers. In this<br />
challenging environment, all but one underlying equity asset<br />
class funds lagged their respective benchmarks; yet, four of<br />
eight Underlying Funds outperformed their peers within their<br />
asset classes as measured by their respective Lipper ®<br />
Averages. The Barclays Capital U.S. Aggregate Bond Index, the<br />
benchmark for the RIF Core Bond Underlying Fund, was the<br />
only Underlying Fund benchmark with a positive absolute<br />
return. The returns of this index benefited from the inclusion of<br />
Treasuries. The RIF Core Bond Underlying Fund held a<br />
significant underweight to Treasuries relative to the benchmark.<br />
In absolute terms, bonds as measured by the Barclays Capital<br />
U.S. Aggregate Bond Index performed better than equities.<br />
How did the investment strategies and techniques<br />
employed by the Fund and its money managers of the<br />
Underlying Funds affect the Fund’s performance?<br />
At the Fund level, exposure to the RIF Multi-Style Equity, RIF<br />
Non-U.S. and Russell U.S. Quantitative Equity Underlying<br />
Funds dampened returns relative to the Russell 1000 ® Index.<br />
The RIF Core Bond Underlying Fund contributed positively to<br />
the Fund’s benchmark-relative performance.<br />
The U.S. equity Underlying Funds maintained an overall<br />
preference for companies with above-average growth rates and<br />
attractive valuations. This positioning was not rewarded in 2008<br />
where investors were driven by fear, looking for relative safety<br />
and selling stocks regardless of fundamentals. U.S. large cap<br />
managers in the Underlying Fund using quantitative investment<br />
strategies added to returns by shorting several of the financial<br />
stocks that underperformed in the fiscal period. Yet, this was<br />
offset by managers employing growth and momentum strategies,<br />
which underperformed in this environment.<br />
Managers in the small cap U.S. equity Underlying Fund<br />
negatively impacted the Fund by underweighting the financials<br />
sector and overweighting the other energy sector. Small cap<br />
financials rebounded from their lows as the Federal Reserve<br />
and Treasury offered wide ranging forms of financial support.<br />
The prices of other energy stocks fell as the price of oil fell.<br />
Managers in the non-U.S. developed markets Underlying Fund<br />
performed better than managers in global equity and emerging<br />
markets Underlying Funds. Yet the Fund’s higher allocation to<br />
the Non-U.S. developed markets Underlying Fund resulted in a<br />
larger negative impact on the Fund’s benchmark relative<br />
performance. This Underlying Fund’s multi-style discipline<br />
provided some risk control during the fiscal period given the<br />
extreme variability in investment style and market leadership.<br />
More defensive strategies helped moderate the negative impact<br />
of strategies more focused on deteriorating economic conditions.<br />
In emerging markets, the returns of emerging markets<br />
Underlying Fund declined along with the returns of the asset<br />
class, which experienced its biggest calendar year decline in<br />
the history of the asset class. The asset class endured massive<br />
asset deleveraging and extreme levels of market volatility.<br />
Commodity-related sectors suffered most as the global economic<br />
slowdown cut demand.<br />
The real estate Underlying Fund focused primarily on the larger<br />
and more liquid REITs during the fiscal year. With the<br />
exceptional volatility experienced during the period due to the<br />
Growth Strategy Fund 23
Russell Investment Funds<br />
Growth Strategy Fund<br />
Portfolio Management Discussion and Analysis — December 31, 2008 (Unaudited)<br />
global economic crisis and cash outflows, this positioning hurt<br />
Fund performance. The Underlying Fund’s exposure to non-U.S.<br />
REITs added to the Fund excess weighted performance relative<br />
to the benchmark for the year.<br />
While the fixed income Underlying Fund contributed positively<br />
to the Fund’s benchmark relative performance, this Underlying<br />
Fund underperformed its benchmark. By far, the largest affect<br />
on the Underlying Fund’s underperformance relative to its<br />
benchmark was from the re-pricing of risk (i.e., the market<br />
demanding increased compensation for assuming a given level<br />
of risk), the fundamental concern regarding the consumer’s<br />
ability to make mortgage payments, and the negative impact<br />
that market and credit issues had on virtually all non-Treasury<br />
segments of the fixed income markets. This Underlying Fund<br />
had a material overweight to mortgage-backed securities. This<br />
contributed significantly to this Underlying Fund’s benchmarkrelative<br />
underperformance. The decrease in interest rates across<br />
the yield curve had little impact on that Underlying Fund’s<br />
performance as its money managers implemented offsetting<br />
duration strategies. Yet, as the Federal Reserve decreased the<br />
federal funds target rate, short-term yields declined relative to<br />
intermediate- and long-term yields resulting in a yield curve<br />
“steepening.” Several of the Underlying Fund’s money<br />
managers anticipated the change and varied the maturities of<br />
their securities accordingly, positioning their portfolios to<br />
benefit from these changes.<br />
The Funds’ performance shown throughout this report was<br />
based on the Underlying Funds’ valuations calculated in<br />
accordance with Generally Accepted Accounting Principles<br />
(GAAP) and in accordance with a newly effective accounting<br />
statement (SFAS 157), reflects the December 31, 2008 market<br />
value of the pooled investment vehicle in which the Underlying<br />
Funds invested their cash collateral received in securities<br />
lending transactions. The market value was lower than the<br />
vehicle’s amortized cost per unit. This had a negative impact on<br />
the Fund’s benchmark relative performance.<br />
Describe any changes to the Fund’s structure or<br />
allocation to the Underlying Funds.<br />
In September, 2008, certain of the Underlying Funds in which<br />
the Fund invested (the “Former Underlying Funds”) changed as<br />
set forth below as the result of the reorganization (the<br />
“Reorganizations”) of the Former Underlying Funds into other<br />
Russell Investment Company Funds (the “New Underlying<br />
Funds”).<br />
Former Underlying Fund<br />
Quantitative Equity Fund<br />
New Underlying Fund<br />
Russell U.S. Quantitative<br />
Equity Fund<br />
The New Underlying Fund has the same investment objective,<br />
principal investment strategies, investment policies and<br />
principal risks as the Former Underlying Fund which it<br />
replaced and the allocation of the Fund’s assets to the New<br />
Underlying Fund is the same as it was to the Former Underlying<br />
Fund.<br />
The views expressed in this report reflect those of the<br />
portfolio managers only through the end of the period<br />
covered by the report. These views do not necessarily<br />
represent the views of RIMCo, or any other person in<br />
RIMCo or any other affiliated organization. These views<br />
are subject to change at any time based upon market<br />
conditions or other events, and RIMCo disclaims any<br />
responsibility to update the views contained herein.<br />
These views should not be relied on as investment<br />
advice and, because investment decisions for a Russell<br />
Investment Fund (RIF) or Russell Investment Company<br />
(RIC) Fund are based on numerous factors, should not<br />
be relied on as an indication of investment decisions of<br />
any RIF or RIC Fund.<br />
24 Growth Strategy Fund
Russell Investment Funds<br />
Growth Strategy Fund<br />
Shareholder Expense Example — December 31, 2008 (Unaudited)<br />
Fund Expenses<br />
The following disclosure provides important information<br />
regarding each Fund’s Expense Example, which appears<br />
on each Fund’s individual page in this <strong>Annual</strong> Report.<br />
Please refer to this information when reviewing the<br />
Expense Example for a Fund.<br />
Example<br />
As a shareholder of the Fund, you incur two types of costs:<br />
(1) transaction costs, and (2) ongoing costs, including<br />
management fees and other Fund expenses. The Example is<br />
intended to help you understand your ongoing costs (in dollars)<br />
of investing in the Fund and to compare these costs with the<br />
ongoing costs of investing in other mutual funds. The Example<br />
is based on an investment of $1,000 invested at the beginning<br />
of the period and held for the entire period indicated, which for<br />
this Fund is from July 1, 2008 to December 31, 2008.<br />
Actual Expenses<br />
The information in the table under the heading “Actual<br />
Performance” provides information about actual account values<br />
and actual expenses. You may use the information in this<br />
column, together with the amount you invested, to estimate the<br />
expenses that you paid over the period. Simply divide your<br />
account value by $1,000 (for example, an $8,600 account value<br />
divided by $1,000 = 8.6), then multiply the result by the<br />
number in the first column in the row entitled “Expenses Paid<br />
During Period” to estimate the expenses you paid on your<br />
account during this period.<br />
Please note that the expenses shown in the table are meant to<br />
highlight your ongoing costs only and do not reflect any<br />
transactional costs. Therefore, the information under the<br />
heading “Hypothetical Performance (5% return before<br />
expenses)” is useful in comparing ongoing costs only, and will<br />
not help you determine the relative total costs of owning<br />
different funds. In addition, if these transactional costs were<br />
included, your costs would have been higher. The fee and<br />
expenses shown in this section do not reflect any Insurance<br />
Company Separate Account or Policy Charges.<br />
Actual<br />
Performance<br />
Hypothetical<br />
Performance<br />
(5% return<br />
before expenses)<br />
Beginning Account Value<br />
July 1, 2008 $ 1,000.00 $ 1,000.00<br />
Ending Account Value<br />
December 31, 2008 $ 714.01 $ 1,024.94<br />
Expenses Paid During Period* $ 0.17 $ 0.20<br />
* Expenses are equal to the Fund’s annualized expense ratio of 0.04%<br />
(representing the one-half year period annualized), multiplied by the average<br />
account value over the period, multiplied by 184/366 (to reflect the one-half<br />
year period). Reflects amounts waived and/or reimbursed. Without the waiver<br />
and/or reimbursement, expenses would have been higher.<br />
Hypothetical Example for Comparison Purposes<br />
The information in the table under the heading “Hypothetical<br />
Performance (5% return before expenses)” provides information<br />
about hypothetical account values and hypothetical expenses<br />
based on the Fund’s actual expense ratio and an assumed rate<br />
of return of 5% per year before expenses, which is not the<br />
Fund’s actual return. The hypothetical account values and<br />
expenses may not be used to estimate the actual ending account<br />
balance or expenses you paid for the period. You may use this<br />
information to compare the ongoing costs of investing in the<br />
Fund and other funds. To do so, compare this 5% hypothetical<br />
example with the 5% hypothetical examples that appear in the<br />
shareholder reports of other funds.<br />
Growth Strategy Fund 25
Russell Investment Funds<br />
Growth Strategy Fund<br />
Schedule of Investments — December 31, 2008<br />
Amounts in thousands (except share amounts)<br />
Investments - 100.0%<br />
Other Russell Investment Funds<br />
(“RIF”) and Russell Investment<br />
Company (“RIC”) Series <strong>Mutual</strong><br />
Funds<br />
Shares<br />
Market<br />
Value<br />
$<br />
Bonds - 20.3%<br />
RIF Core Bond Fund 755,265 7,050<br />
Domestic Equities - 52.9%<br />
RIF Aggressive Equity Fund 288,062 2,069<br />
RIF Multi-Style Equity Fund 796,729 7,171<br />
RIF Real Estate Securities Fund 237,447 2,207<br />
RIC Russell U.S. Quantitative Equity Fund 325,489 6,917<br />
18,364<br />
International Equities - 26.8%<br />
RIF Non-U.S. Fund 785,740 5,881<br />
RIC Russell Emerging Markets Fund 140,727 1,386<br />
RIC Russell Global Equity Fund 360,983 2,072<br />
9,339<br />
Total Investments - 100.0%<br />
(identified cost $52,231) 34,753<br />
Other Assets and Liabilities,<br />
Net - (0.0%) (11)<br />
Net Assets - 100.0% 34,742<br />
See accompanying notes which are an integral part of the financial statements.<br />
26 Growth Strategy Fund
(This page intentionally left blank)
Russell Investment Funds<br />
Equity Growth Strategy Fund<br />
Portfolio Management Discussion — December 31, 2008 (Unaudited)<br />
Growth of a $10,000 Investment<br />
$11,000<br />
Equity Growth Strategy Fund<br />
Russell 1000® Index**<br />
MSCI EAFE Index Net (USD)***<br />
$10,000<br />
$9,000<br />
$8,000<br />
$7,000<br />
$6,000<br />
$5,000<br />
Inception* 2007 2008<br />
Yearly periods ended December 31<br />
Equity Growth Strategy Fund<br />
Total<br />
Return<br />
1 Year (41.18)%<br />
Inception * (26.66)%§<br />
MSCI EAFE ® Index Net (USD) ***<br />
Total<br />
Return<br />
1 Year (43.38)%<br />
Inception * (27.88)%§<br />
Russell 1000 ® Index **<br />
Total<br />
Return<br />
1 Year (37.60)%<br />
Inception * (24.45)%§<br />
* The Fund commenced operation on April 30, 2007.<br />
** Russell 1000 ® Index includes the 1,000 largest companies in the Russell 3000 ® Index. The Russell 1000 ® Index represents the universe of stocks from which<br />
most active money managers typically select. The Russell 1000 ® Index return reflects adjustments from income dividends and capital gain distributions<br />
reinvested as of the ex-dividend dates.<br />
*** Morgan Stanley Capital International Europe, Australia, Far East (MSCI EAFE) Index is an index composed of an arithmetic, market value-weighted average of<br />
the performance of approximately 1,600 securities listed on the stock exchange of the countries of Europe, Australia, and the Far East. The index is calculated<br />
on a total-return basis, which included reinvestment of gross dividends before deduction of withholding taxes.<br />
§ <strong>Annual</strong>ized.<br />
The performance shown in this section does not reflect any Insurance Company Separate Account or Policy Charges. Performance is historical and assumes<br />
reinvestment of all dividends and capital gains. Investment return and principal value will fluctuate so that an investor’s shares, when redeemed, may be worth more or<br />
less than when purchased. Past performance is not indicative of future results.<br />
28 Equity Growth Strategy Fund
Russell Investment Funds<br />
Equity Growth Strategy Fund<br />
Portfolio Management Discussion and Analysis — December 31, 2008 (Unaudited)<br />
The Fund is a fund of funds that invests in other Russell<br />
Investment Funds and Russell Investment Company mutual<br />
funds (the “Underlying Funds”). The Underlying Funds allocate<br />
most of their assets among multiple money managers. Russell<br />
Investment Management Company (“RIMCo”), as the<br />
Underlying Funds' advisor, may change the allocation of the<br />
Underlying Funds' assets among money managers at any time.<br />
An exemptive order from the Securities and Exchange<br />
Commission (SEC) permits RIMCo to engage or terminate a<br />
money manager in an Underlying Fund at any time, subject to<br />
the approval by the Underlying Fund’s Board without a<br />
shareholder vote.<br />
What is the Fund’s investment objective?<br />
The Equity Growth Strategy Fund (“Fund”) seeks to provide<br />
high long term capital appreciation.<br />
How did the Fund perform relative to its benchmark for<br />
the fiscal year ended December 31, 2008?<br />
For the fiscal year ended December 31, 2008, the Equity<br />
Growth Strategy Fund lost 41.18%. This compared to the<br />
Russell 1000 ® Index, which lost 37.60% during the same<br />
period. The Fund’s performance includes operating expenses,<br />
whereas the Index returns are unmanaged and do not include<br />
expenses of any kind. The Fund’s performance was negatively<br />
impacted mostly by its allocation to the large cap and non-U.S<br />
equity asset classes, which are not included in the Fund’s<br />
benchmark.<br />
For the year ended December 31, 2008, the Equity Growth<br />
Strategy Lipper Composite – lost 39.68%. This result serves as<br />
a peer comparison and is expressed net of operating expenses.<br />
Each Underlying Fund has a benchmark reflective of its<br />
respective asset class. These benchmarks may be different than<br />
the Fund’s benchmark. The Fund’s benchmark represents the<br />
largest asset class of the Underlying Funds in which it invests.<br />
How did the market conditions described in the Market<br />
Summary report affect the Fund’s performance?<br />
The Fund is a fund of funds and its performance is based on the<br />
performance of the Underlying Funds in which it invests. The<br />
Fund’s performance was negatively impacted by the financial<br />
crisis that affected virtually all asset classes during the fiscal<br />
year. The largest impact on the Fund’s weighted excess return<br />
relative to the Russell 1000 ® Index was negative from its<br />
exposure to the RIF Multi-Style Equity, RIF Non-U.S., RIF<br />
Emerging Markets, Russell Global Equity and the RIF<br />
Aggressive Equity Underlying Funds.<br />
The extreme volatility of the financial markets during the fiscal<br />
period created a headwind for most active managers. In this<br />
challenging environment, all but one underlying equity asset<br />
class funds lagged their respective benchmarks; yet three of<br />
seven Underlying Funds outperformed their peers within their<br />
asset classes as measured by their respective Lipper ®<br />
Averages.<br />
How did the investment strategies and techniques<br />
employed by the Fund and its money managers of the<br />
Underlying Funds affect the Fund’s performance?<br />
The U.S. equity Underlying Funds maintained an overall<br />
preference for companies with above-average growth rates and<br />
attractive valuations. This positioning was not rewarded in 2008<br />
where investors were driven by fear, looking for relative safety<br />
and selling stocks regardless of fundamentals. U.S. large cap<br />
managers in the Underlying Fund using quantitative investment<br />
strategies added to returns by shorting several of the financial<br />
stocks that underperformed in the fiscal period. Yet, this was<br />
offset by managers employing growth and momentum strategies,<br />
which underperformed in this environment.<br />
Managers in the small cap U.S. equity Underlying Fund<br />
negatively impacted the Fund by underweighting the financials<br />
sector and overweighting the other energy sector. Small cap<br />
financials rebounded from their lows as the Federal Reserve<br />
and Treasury offered wide ranging forms of financial support.<br />
The prices of other energy stocks fell as the price of oil fell.<br />
Managers in the non-U.S. developed markets Underlying Fund<br />
performed better than managers in global equity and emerging<br />
markets Underlying Funds. Yet the Fund’s higher allocation to<br />
the Non-U.S. developed markets Underlying Fund resulted in a<br />
larger negative impact on the Fund’s benchmark relative<br />
performance. This Underlying Fund’s multi-style discipline<br />
provided some risk control during the fiscal period given the<br />
extreme variability in investment style and market leadership.<br />
More defensive strategies helped moderate the negative impact<br />
of strategies more focused on deteriorating economic conditions.<br />
In emerging markets, the returns of the emerging markets<br />
Underlying Fund declined along with the returns of the asset<br />
class, which experienced its biggest calendar year decline in<br />
the history of the asset class. The asset class endured massive<br />
asset deleveraging and extreme levels of market volatility.<br />
Commodity-related sectors suffered most as the global economic<br />
slowdown cut demand.<br />
The real estate Underlying Fund focused primarily on the larger<br />
and more liquid REITs during the fiscal year. With the<br />
exceptional volatility experienced during the period due to the<br />
global economic crisis and cash outflows, this positioning hurt<br />
Fund performance. The Underlying Fund’s exposure to non-U.S.<br />
REITs added to the Fund excess weighted performance relative<br />
to the benchmark for the year.<br />
The Funds’ performance shown throughout this report was<br />
based on the Underlying Funds’ valuations calculated in<br />
accordance with Generally Accepted Accounting Principles<br />
(GAAP) and in accordance with a newly effective accounting<br />
statement (SFAS 157), reflects the December 31, 2008 market<br />
value of the pooled investment vehicle in which the Underlying<br />
Funds invested their cash collateral received in securities<br />
lending transactions. The market value was lower than the<br />
Equity Growth Strategy Fund 29
Russell Investment Funds<br />
Equity Growth Strategy Fund<br />
Portfolio Management Discussion and Analysis — December 31, 2008 (Unaudited)<br />
vehicle’s amortized cost per unit. This had a negative impact on<br />
the Fund’s benchmark relative performance.<br />
Describe any changes to the Fund’s structure or<br />
allocation to the Underlying Funds.<br />
In September, 2008, certain of the Underlying Funds in which<br />
the Fund invested (the “Former Underlying Funds”) changed as<br />
set forth below as the result of the reorganization (the<br />
“Reorganizations”) of the Former Underlying Funds into other<br />
Russell Investment Company Funds (the “New Underlying<br />
Funds”).<br />
Former Underlying Fund<br />
Quantitative Equity Fund<br />
New Underlying Fund<br />
Russell U.S. Quantitative<br />
Equity Fund<br />
The New Underlying Fund has the same investment objective,<br />
principal investment strategies, investment policies and<br />
principal risks as the Former Underlying Fund which it<br />
replaced and the allocation of the Fund’s assets to the New<br />
Underlying Fund is the same as it was to the Former Underlying<br />
Fund.<br />
The views expressed in this report reflect those of the<br />
portfolio managers only through the end of the period<br />
covered by the report. These views do not necessarily<br />
represent the views of RIMCo, or any other person in<br />
RIMCo or any other affiliated organization. These views<br />
are subject to change at any time based upon market<br />
conditions or other events, and RIMCo disclaims any<br />
responsibility to update the views contained herein.<br />
These views should not be relied on as investment<br />
advice and, because investment decisions for a Russell<br />
Investment Fund (RIF) or Russell Investment Company<br />
(RIC) Fund are based on numerous factors, should not<br />
be relied on as an indication of investment decisions of<br />
any RIF or RIC Fund.<br />
30 Equity Growth Strategy Fund
Russell Investment Funds<br />
Equity Growth Strategy Fund<br />
Shareholder Expense Example — December 31, 2008 (Unaudited)<br />
Fund Expenses<br />
The following disclosure provides important information<br />
regarding each Fund’s Expense Example, which appears<br />
on each Fund’s individual page in this <strong>Annual</strong> Report.<br />
Please refer to this information when reviewing the<br />
Expense Example for a Fund.<br />
Example<br />
As a shareholder of the Fund, you incur two types of costs:<br />
(1) transaction costs, and (2) ongoing costs, including<br />
management fees and other Fund expenses. The Example is<br />
intended to help you understand your ongoing costs (in dollars)<br />
of investing in the Fund and to compare these costs with the<br />
ongoing costs of investing in other mutual funds. The Example<br />
is based on an investment of $1,000 invested at the beginning<br />
of the period and held for the entire period indicated, which for<br />
this Fund is from July 1, 2008 to December 31, 2008.<br />
Actual Expenses<br />
The information in the table under the heading “Actual<br />
Performance” provides information about actual account values<br />
and actual expenses. You may use the information in this<br />
column, together with the amount you invested, to estimate the<br />
expenses that you paid over the period. Simply divide your<br />
account value by $1,000 (for example, an $8,600 account value<br />
divided by $1,000 = 8.6), then multiply the result by the<br />
number in the first column in the row entitled “Expenses Paid<br />
During Period” to estimate the expenses you paid on your<br />
account during this period.<br />
Hypothetical Example for Comparison Purposes<br />
The information in the table under the heading “Hypothetical<br />
Performance (5% return before expenses)” provides information<br />
about hypothetical account values and hypothetical expenses<br />
based on the Fund’s actual expense ratio and an assumed rate<br />
of return of 5% per year before expenses, which is not the<br />
Fund’s actual return. The hypothetical account values and<br />
expenses may not be used to estimate the actual ending account<br />
balance or expenses you paid for the period. You may use this<br />
information to compare the ongoing costs of investing in the<br />
Fund and other funds. To do so, compare this 5% hypothetical<br />
example with the 5% hypothetical examples that appear in the<br />
shareholder reports of other funds.<br />
Please note that the expenses shown in the table are meant to<br />
highlight your ongoing costs only and do not reflect any<br />
transactional costs. Therefore, the information under the<br />
heading “Hypothetical Performance (5% return before<br />
expenses)” is useful in comparing ongoing costs only, and will<br />
not help you determine the relative total costs of owning<br />
different funds. In addition, if these transactional costs were<br />
included, your costs would have been higher. The fee and<br />
expenses shown in this section do not reflect any Insurance<br />
Company Separate Account or Policy Charges.<br />
Actual<br />
Performance<br />
Hypothetical<br />
Performance<br />
(5% return<br />
before expenses)<br />
Beginning Account Value<br />
July 1, 2008 $ 1,000.00 $ 1,000.00<br />
Ending Account Value<br />
December 31, 2008 $ 657.02 $ 1,024.94<br />
Expenses Paid During<br />
Period* $ 0.17 $ 0.20<br />
* Expenses are equal to the Fund’s annualized expense ratio of 0.04%<br />
(representing the one-half year period annualized), multiplied by the average<br />
account value over the period, multiplied by 184/366 (to reflect the one-half<br />
year period). Reflects amounts waived and/or reimbursed. Without the waiver<br />
and/or reimbursement, expenses would have been higher.<br />
Equity Growth Strategy Fund 31
Russell Investment Funds<br />
Equity Growth Strategy Fund<br />
Schedule of Investments — December 31, 2008<br />
Amounts in thousands (except share amounts)<br />
Investments - 100.1%<br />
Other Russell Investment Funds<br />
(“RIF”) and Russell Investment<br />
Company (“RIC”) Series <strong>Mutual</strong><br />
Funds<br />
Shares<br />
Market<br />
Value<br />
$<br />
Domestic Equities - 65.3%<br />
RIF Aggressive Equity Fund 122,594 881<br />
RIF Multi-Style Equity Fund 363,495 3,272<br />
RIF Real Estate Securities Fund 97,129 903<br />
RIC Russell U.S. Quantitative Equity Fund 149,420 3,175<br />
8,231<br />
International Equities - 34.8%<br />
RIF Non-U.S. Fund 385,493 2,885<br />
RIC Russell Emerging Markets Fund 63,499 625<br />
RIC Russell Global Equity Fund 153,703 882<br />
4,392<br />
Total Investments - 100.1%<br />
(identified cost $20,009) 12,623<br />
Other Assets and Liabilities,<br />
Net - (0.1%) (10)<br />
Net Assets - 100.0% 12,613<br />
See accompanying notes which are an integral part of the financial statements.<br />
32 Equity Growth Strategy Fund
Russell Investment Funds<br />
LifePoints ® Funds Variable Target Portfolio Series<br />
Statements of Assets and Liabilities — December 31, 2008<br />
Amounts in thousands<br />
Moderate Strategy<br />
Fund<br />
Balanced Strategy<br />
Fund<br />
Growth Strategy<br />
Fund<br />
Equity Growth<br />
Strategy Fund<br />
Assets<br />
Investments, at identified cost ............................ $ 23,496 $ 81,252 $ 52,231 $ 20,009<br />
Investments, at market ................................. 19,319 60,174 34,753 12,623<br />
Receivables:<br />
Investments sold ................................ 65 — — —<br />
Fund shares sold ................................ 6 42 8 6<br />
From Transfer Agent ............................. — — 2 1<br />
Prepaid expenses ..................................... — 1 — —<br />
Total assets ................................... 19,390 60,217 34,763 12,630<br />
Liabilities<br />
Payables:<br />
Investments purchased ............................ — 42 9 5<br />
Fund shares redeemed ............................ 71 — — —<br />
Accrued fees to affiliates ........................... 1 5 2 1<br />
Other accrued expenses ........................... 10 12 10 11<br />
Total liabilities ................................. 82 59 21 17<br />
Net Assets ..................................... $ 19,308 $ 60,158 $ 34,742 $ 12,613<br />
Net Assets Consist of:<br />
Undistributed (overdistributed) net investment income ............ $ 172 $ 80 $ 8 $ 32<br />
Accumulated net realized gain (loss) ........................ (901) (1,155) (481) (1,063)<br />
Unrealized appreciation (depreciation) on investments ............ (4,177) (21,078) (17,478) (7,386)<br />
Shares of beneficial interest .............................. 25 88 57 23<br />
Additional paid-in capital ............................... 24,189 82,223 52,636 21,007<br />
Net Assets ..................................... $ 19,308 $ 60,158 $ 34,742 $ 12,613<br />
Net Asset Value, offering and redemption price per share:<br />
Net asset value per share* ............................. $ 7.67 $ 6.80 $ 6.11 $ 5.42<br />
Net assets ....................................... $ 19,308,456 $ 60,158,172 $ 34,742,243 $ 12,612,657<br />
Shares outstanding ($.01 par value) ..................... 2,515,767 8,846,816 5,685,013 2,328,684<br />
* Net asset value per share equals net assets divided by shares of beneficial interest outstanding.<br />
See accompanying notes which are an integral part of the financial statements.<br />
Statements of Assets and Liabilities 33
Russell Investment Funds<br />
LifePoints ® Funds Variable Target Portfolio Series<br />
Statements of Operations — For the Fiscal Year Ended December 31, 2008<br />
Amounts in thousands<br />
Moderate Strategy<br />
Fund<br />
Balanced Strategy<br />
Fund<br />
Growth Strategy<br />
Fund<br />
Equity Growth<br />
Strategy Fund<br />
Investment Income<br />
Income distributions from Underlying Funds ............. $ 674 $ 1,568 $ 669 $ 128<br />
Expenses<br />
Advisory fees ................................... 35 111 71 28<br />
Administrative fees .............................. 9 28 18 7<br />
Custodian fees .................................. 15 19 17 14<br />
Transfer agent fees ............................... 1 2 2 1<br />
Professional fees ................................ 21 23 22 21<br />
Trustees’ fees .................................. — 1 1 —<br />
Offering fees ................................... 5 5 5 5<br />
Miscellaneous .................................. 5 5 4 6<br />
Expenses before reductions ......................... 91 194 140 82<br />
Expense reductions .............................. (72) (150) (126) (76)<br />
Net expenses ........................................ 19 44 14 6<br />
Net investment income (loss) ............................. 655 1,524 655 122<br />
Net Realized and Unrealized Gain (Loss)<br />
Net realized gain (loss) on:<br />
Investments .................................... (990) (1,448) (675) (1,102)<br />
Capital gain distributions from Underlying Funds .......... 121 330 214 87<br />
Net realized gain (loss) ................................. (869) (1,118) (461) (1,015)<br />
Net change in unrealized appreciation (depreciation) on investments .. (4,012) (19,597) (15,965) (6,201)<br />
Net realized and unrealized gain (loss) ....................... (4,881) (20,715) (16,426) (7,216)<br />
Net Increase (Decrease) in Net Assets from Operations .. $ (4,226) $ (19,191) $ (15,771) $ (7,094)<br />
See accompanying notes which are an integral part of the financial statements.<br />
34 Statements of Operations
(This page intentionally left blank)
Russell Investment Funds<br />
LifePoints ® Funds Variable Target Portfolio Series<br />
Statements of Changes in Net Assets — For the Fiscal Years Ended December 31,<br />
Moderate Strategy<br />
Fund<br />
Amounts in thousands 2008 2007*<br />
Increase (Decrease) in Net Assets<br />
Operations<br />
Net investment income (loss) ......................................................... $ 655 $ 194<br />
Net realized gain (loss) ............................................................. (869) 142<br />
Net change in unrealized appreciation (depreciation) ......................................... (4,012) (165)<br />
Net increase (decrease) in net assets from operations .............................................. (4,226) 171<br />
Distributions<br />
From net investment income .......................................................... (482) (207)<br />
From net realized gain .............................................................. (160) (2)<br />
Net decrease in net assets from distributions .................................................... (642) (209)<br />
Share Transactions<br />
Net increase (decrease) in net assets from share transactions ................................... 15,522 8,692<br />
Total Net Increase (Decrease) in Net Assets ........................................... 10,654 8,654<br />
Net Assets<br />
Beginning of period ................................................................ 8,654 —<br />
End of period .................................................................... $ 19,308 $ 8,654<br />
Undistributed (overdistributed) net investment income included in net assets ............................. $ 172 $ —<br />
* For the period April 30, 2007 (commencement of operations) to December 31, 2007.<br />
See accompanying notes which are an integral part of the financial statements.<br />
36 Statements of Changes in Net Assets
Balanced Strategy<br />
Fund<br />
Growth Strategy<br />
Fund<br />
Equity Growth Strategy<br />
Fund<br />
2008 2007* 2008 2007* 2008 2007*<br />
$ 1,524 $ 889 $ 655 $ 638 $ 122 $ 347<br />
(1,118) 1,114 (461) 1,101 (1,015) 709<br />
(19,597) (1,481) (15,965) (1,513) (6,201) (1,185)<br />
(19,191) 522 (15,771) 226 (7,094) (129)<br />
(1,462) (901) (647) (651) (89) (358)<br />
(1,120) (2) (1,109) — (748) —<br />
(2,582) (903) (1,756) (651) (837) (358)<br />
46,234 36,078 24,879 27,815 7,538 13,493<br />
24,461 35,697 7,352 27,390 (393) 13,006<br />
35,697 — 27,390 — 13,006 —<br />
$ 60,158 $ 35,697 $ 34,742 $ 27,390 $ 12,613 $ 13,006<br />
$ 80 $ — $ 8 $ — $ 32 $ —<br />
See accompanying notes which are an integral part of the financial statements.<br />
Statements of Changes in Net Assets 37
Russell Investment Funds<br />
LifePoints ® Funds Variable Target Portfolio Series<br />
Financial Highlights<br />
For a Share Outstanding Throughout the Period.<br />
Moderate Strategy Fund<br />
$<br />
Net Asset Value,<br />
Beginning of<br />
Period<br />
$<br />
Net<br />
Investment<br />
Income (Loss)(a)(b)<br />
$<br />
Net Realized<br />
and Unrealized<br />
Gain (Loss)<br />
$<br />
Total Income<br />
(Loss) from<br />
Operations<br />
$<br />
Distributions<br />
from Net<br />
Investment Income<br />
$<br />
Distributions<br />
from Net<br />
Realized Gain<br />
December 31, 2008 9.99 .33 (2.32) (1.99) (.23) (.10)<br />
December 31, 2007* 10.00 .46 (.11) .35 (.36) —(g)<br />
Balanced Strategy Fund<br />
December 31, 2008 9.93 .23 (2.88) (2.65) (.21) (.27)<br />
December 31, 2007* 10.00 .47 (.20) .27 (.34) —(g)<br />
Growth Strategy Fund<br />
December 31, 2008 9.90 .15 (3.46) (3.31) (.14) (.34)<br />
December 31, 2007* 10.00 .45 (.24) .21 (.31) —<br />
Equity Growth Strategy Fund<br />
December 31, 2008 9.83 .07 (3.92) (3.85) (.05) (.51)<br />
December 31, 2007* 10.00 .50 (.38) .12 (.29) —<br />
See accompanying notes which are an integral part of the financial statements.<br />
38 Financial Highlights
$<br />
Total<br />
Distributions<br />
$<br />
Net Asset Value,<br />
End of<br />
Period<br />
%<br />
Total<br />
Return(c)<br />
$<br />
Net Assets,<br />
End of Period<br />
(000)<br />
%<br />
Ratio of Expenses<br />
to Average<br />
Net Assets,<br />
Net(d)(e)(f)<br />
%<br />
Ratio of Expenses<br />
to Average<br />
Net Assets,<br />
Gross(d)(e)<br />
%<br />
Ratio of Net<br />
Investment Income<br />
to Average<br />
Net Assets(c)(f)<br />
%<br />
Portfolio<br />
Turnover Rate(c)<br />
(.33) 7.67 (20.39) 19,308 .11 .53 3.77 39<br />
(.36) 9.99 3.54 8,654 .11 2.01 5.37 24<br />
(.48) 6.80 (27.70) 60,158 .08 .35 2.75 16<br />
(.34) 9.93 2.73 35,697 .08 .74 5.37 11<br />
(.48) 6.11 (34.73) 34,742 .04 .40 1.85 10<br />
(.31) 9.90 2.13 27,390 .04 .84 5.05 3<br />
(.56) 5.42 (41.18) 12,613 .04 .58 0.87 24<br />
(.29) 9.83 1.25 13,006 .04 1.36 5.59 6<br />
See accompanying notes which are an integral part of the financial statements.<br />
Financial Highlights 39
Russell Investment Funds<br />
LifePoints ® Funds Variable Target Portfolio Series<br />
Notes to Financial Highlights — December 31, 2008<br />
* For the period April 30, 2007 (commencement of operations) to December 31, 2007.<br />
(a) Average month-end shares outstanding were used for this calculation.<br />
(b) Recognition of net investment income by the Fund is affected by the timing of the declaration of dividends by the Underlying Funds in which the Fund invests.<br />
(c) Periods less than one year are not annualized.<br />
(d) The ratios for periods less than one year are annualized.<br />
(e) The calculation includes only those expenses charged directly to the Fund and does not include expenses charged to the Underlying Funds in which the Fund<br />
invests.<br />
(f) May reflect amounts waived and reimbursed by RIMCo and RFSC.<br />
(g) Less than $.01 per share.<br />
See accompanying notes which are an integral part of the financial statements.<br />
40 Notes to Financial Highlights
Russell Investment Funds<br />
LifePoints ® Funds Variable Target Portfolio Series<br />
Notes to Financial Statements — December 31, 2008<br />
1. Organization<br />
Russell Investment Funds (the “Investment Company” or “RIF”) is a series investment company with nine different investment<br />
portfolios referred to as Funds. These financial statements report on four of these Funds (each a “Fund” and collectively the<br />
“Funds”). The Investment Company provides the investment base for one or more variable insurance products issued by one or<br />
more insurance companies. These Funds are offered at net asset value to qualified insurance company separate accounts offering<br />
variable insurance products. The Investment Company is registered under the Investment Company Act of 1940, as amended, as<br />
an open-end management investment company. It is organized and operates as a Massachusetts business trust under an amended<br />
and restated master trust agreement dated October 1, 2008. The Investment Company’s master trust agreement permits the Board<br />
of Trustees (the “Board”) to issue an unlimited number of shares of beneficial interest.<br />
Russell Investment Management Company (“RIMCo”) is the Funds’ adviser and Russell Fund Services Company (“RFSC”), a<br />
wholly-owned subsidiary of RIMCo, is the Funds’ administrator and transfer agent.<br />
The Funds seek to achieve their objective by investing in a combination of Russell Investment Company (“RIC”) funds and other<br />
of the Investment Company’s funds (the “Underlying Funds”) as set forth in the table below. RIMCo may modify the target asset<br />
allocation for any Fund and/or the Underlying Funds in which the Funds invest. From time to time, each Fund may adjust its<br />
investments within the ranges below based on RIMCo’s outlook for the economy, financial markets generally and relative market<br />
valuation of the asset classes represented by each Underlying Fund. Additionally, each Fund may deviate from the ranges when,<br />
in RIMCo’s opinion, it is necessary to do so to pursue the Fund’s investment objective. In the future, the Funds may also invest in<br />
other funds which are not currently Underlying Funds.<br />
Asset Class/Underlying Funds<br />
Moderate<br />
Strategy Fund<br />
Asset Allocation Targets as of April 30, 2008<br />
Balanced<br />
Strategy Fund<br />
Growth<br />
Strategy Fund<br />
Equity Growth<br />
Strategy Fund<br />
Bonds<br />
RIF Core Bond Fund 55-65% 35-45% 15-25% 0%<br />
Domestic Equities<br />
RIF Aggressive Equity Fund 0-8 0-9 1-11 2-12<br />
RIF Multi-Style Equity Fund 5-15 10-20 16-26 21-31<br />
RIF Real Estate Securities Fund 0-8 0-10 1-11 2-12<br />
RIC Russell U.S. Quantitative Equity Fund 5-15 10-20 15-25 20-30<br />
International Equities<br />
RIF Non-U.S. Fund 14-24 9-19 12-22 18-28<br />
RIC Russell Emerging Markets Fund 0-7 0-8 0-9 0-10<br />
RIC Russell Global Equity Fund 0-8 0-9 1-11 2-12<br />
2. Significant Accounting Policies<br />
The Funds’ financial statements are prepared in accordance with accounting principles generally accepted in the United States of<br />
America (“GAAP”) which require the use of management estimates and assumptions at the date of the financial statements.<br />
Actual results could differ from those estimates. The following is a summary of the significant accounting policies consistently<br />
followed by each Fund in the preparation of its financial statements.<br />
Security Valuation<br />
The Funds value their portfolio securities, the shares of the Underlying Funds, at the current net asset value per share of each<br />
Underlying Fund.<br />
The Underlying Funds value portfolio securities according to Board-approved securities valuation procedures and pricing<br />
services which include market value procedures, fair value procedures and a description of the pricing services used by the<br />
Underlying Funds. Money market fund securities are priced using the amortized cost method of valuation, as are debt obligation<br />
securities maturing within 60 days at the time of purchase, unless the Board determines that amortized cost does not represent<br />
market value of short-term debt obligations. The Board has delegated the responsibility for administration of the securities<br />
valuation procedures to RFSC.<br />
Ordinarily, the Underlying Funds value each portfolio security based on market quotations provided by pricing services or<br />
alternative pricing services or dealers (when permitted by the market value procedures). Generally, Underlying Fund securities<br />
are valued at the close of the market on which they are traded as follows:<br />
• U.S. listed equities, equity and fixed income options and Rights/Warrants: Last sale price; last bid price if no last sale price.<br />
Notes to Financial Statements 41
Russell Investment Funds<br />
LifePoints ® Funds Variable Target Portfolio Series<br />
Notes to Financial Statements, continued — December 31, 2008<br />
• U.S. over-the-counter equities: Official closing price; last bid price if no closing price.<br />
• Listed ADRs/GDRs: Last sale price; last bid price if no last sale price.<br />
• Municipal bonds, U.S. bonds, Eurobonds/foreign bonds: Evaluated bid price; broker quote if no evaluated bid price;.<br />
• Futures: Settlement price;<br />
• Bank loans and Forwards: mean between bid and asking price.<br />
• Investments in other mutual funds are valued at their net asset value per share, calculated at 4 p.m. Eastern time or as of the<br />
close of the New York Stock Exchange, whichever is earlier;<br />
• The value of swap agreements is equal to the Funds’ obligation (or rights) under swap contracts which will generally be equal to<br />
the net amounts to be paid or received under the contracts based upon the relative values of the positions held by each party to<br />
the contracts.<br />
• Equity securities traded on a national foreign securities exchange or a foreign over the counter market are valued on the basis<br />
of the official closing price, or lacking the official closing price, at the last sale price of the primary exchange on which the<br />
security is traded.<br />
If market quotations are not readily available for a security or if subsequent events suggest that a market quotation is not reliable,<br />
the Underlying Funds will use the security’s fair value, as determined in accordance with the fair value procedures. The effect of<br />
fair value pricing is that securities may not be priced on the basis of quotations from the primary market on which they are traded,<br />
but rather may be priced by another method that the Board believes reflects fair value. The fair value procedures may involve<br />
subjective judgments as to the fair value of securities. The use of fair value pricing by an Underlying Fund may cause the net<br />
asset value of its shares to differ significantly from the net asset value that would be calculated using normal pricing methods.<br />
Fair value pricing could also cause discrepancies between the daily movement of the value of Underlying Fund shares and daily<br />
movement of the benchmark index if the index is valued using another pricing method.<br />
This policy is intended to assure that the Underlying Funds’ net asset values fairly reflect security values as of the time of pricing.<br />
Events or circumstances affecting the values of Underlying Fund securities that occur between the closing of the principal<br />
markets on which they trade and the time the net asset value of Underlying Fund shares is determined may be reflected in the<br />
calculation of net asset values for each applicable Underlying Fund (and each Fund which invests in such Underlying Fund)<br />
when the Underlying Funds deem that the particular event or circumstance would materially affect such Underlying Fund’s net<br />
asset value. Underlying Funds that invest primarily in frequently traded exchange-listed securities will use fair value pricing in<br />
limited circumstances since reliable market quotations will often be readily available. Underlying Funds that invest in foreign<br />
securities are likely to use fair value pricing more often since significant events may occur between the close of foreign markets<br />
and the time of pricing which would trigger fair value pricing of the foreign securities. Underlying Funds that invest in low-rated<br />
debt securities are also likely to use fair value pricing more often since the markets in which such securities are traded are<br />
generally thinner, more limited and less active than those for higher rated securities. Examples of events that could trigger fair<br />
value pricing of one or more securities are: a material market movement of the US securities market (defined in the fair value<br />
procedures as the movement by a single major US Index greater than a certain percentage) or other significant event; foreign<br />
market holidays if on a daily basis, Fund exposure exceeds 20% in aggregate (all closed markets combined); a company<br />
development; a natural disaster; or an armed conflict.<br />
Because foreign securities can trade on non-business days, the net asset value of a Fund’s portfolio that includes an Underlying<br />
Fund which invests in foreign securities may change on days when shareholders will not be able to purchase or redeem fund<br />
shares.<br />
The Funds adopted Financial Accounting Standards Board (“FASB”) Statement of Financial Accounting Standards No. 157, Fair<br />
Value Measurements (“SFAS 157”), effective January 1, 2008. In accordance with SFAS 157, fair value is defined as the price<br />
that the Funds would receive upon selling an investment in a timely transaction to an independent buyer in the principal or most<br />
advantageous market of the investment. SFAS 157 established a three-tier hierarchy to maximize the use of observable market<br />
data and minimize the use of unobservable inputs and to establish classification of fair value measurements for disclosure<br />
purposes. Inputs refer broadly to the assumptions that market participants would use in pricing the asset, including assumptions<br />
about risk, for example, the risk inherent in a particular valuation technique used to measure fair value including a pricing model<br />
and/or risk inherent in the inputs to the valuation technique. Inputs may be observable or unobservable. Observable inputs are<br />
inputs that reflect the assumptions market participants would use in pricing the asset or liability developed based on market data<br />
obtained from sources independent of the reporting entity. Unobservable inputs are inputs that reflect the reporting entity’s own<br />
assumptions about the assumptions market participants would use in pricing the asset or liability developed based on the best<br />
information available in the circumstances.<br />
42 Notes to Financial Statements
Russell Investment Funds<br />
LifePoints ® Funds Variable Target Portfolio Series<br />
Notes to Financial Statements, continued — December 31, 2008<br />
The three-tier hierarchy of inputs is summarized in the three broad levels listed below.<br />
• Level 1 — quoted prices in active markets for identical investments<br />
• Level 2 — other significant observable inputs (including quoted prices for similar investments, interest rates, prepayment<br />
speeds, credit risk, etc.)<br />
• Level 3 — significant unobservable inputs (including the Fund’s own assumptions in determining the fair value of<br />
investments)<br />
Inputs used in valuing the Funds’ investments for the period ended December 31, 2008, were as follows:<br />
Moderate<br />
Strategy Fund<br />
Investments in<br />
Securities<br />
Balanced<br />
Strategy Fund<br />
Investments in<br />
Securities<br />
Growth<br />
Strategy Fund<br />
Investments in<br />
Securities<br />
Equity Growth<br />
Strategy Fund<br />
Investments in<br />
Securities<br />
Level 1 $ — $ — $ — $ —<br />
Level 2 19,319,025 60,174,298 34,752,751 12,623,205<br />
Level 3 — — — —<br />
As of December 31, 2008, there were no Level 3 securities held by the Funds.<br />
$ 19,319,025 $ 60,174,298 $ 34,752,751 $ 12,623,205<br />
Investment Transactions<br />
Investment transactions are recorded on a trade date basis. Realized gains and losses from securities transactions, if any, are<br />
recorded on the basis of specific identified cost.<br />
Investment Income<br />
Distributions of income and capital gains from the Underlying Funds are recorded on the ex-dividend date.<br />
Federal Income Taxes<br />
Since the Investment Company is a Massachusetts business trust, each Fund is a separate corporate taxpayer and determines its<br />
net investment income and capital gains (or losses) and the amounts to be distributed to each Fund’s shareholders without regard<br />
to the income and capital gains (or losses) of the other Funds.<br />
It is each Fund’s intention to qualify as a regulated investment company and distribute all of its taxable income and capital gains.<br />
Therefore, no federal income tax provision is required for the Funds.<br />
In accordance with provisions set forth in the FASB issued Interpretation No. 48, “Accounting for Uncertainty in Income Taxes,<br />
an Interpretation of FASB Statement No. 109” (“FIN 48”), adopted by the Funds on January 1, 2007, management has reviewed<br />
the Funds’ tax positions for all open tax years, and concluded that adoption had no effect on the Funds’ financial position or<br />
results of operations. At December 31, 2008, the Funds have recorded no liabilities for net unrecognized tax benefits relating to<br />
uncertain income tax positions they have taken or expect to take in future tax returns.<br />
Each Fund files a U. S. tax return. While the statute of limitations remains open to examine the Funds’ U.S. tax returns filed for<br />
the fiscal years ending December 31, 2005, through December 31, 2007, no examinations are in progress or anticipated at this<br />
time. The Funds are not aware of any tax positions for which it is reasonably possible that the total amounts of unrecognized tax<br />
benefits will significantly change in the next twelve months.<br />
Dividends and Distributions to Shareholders<br />
Income dividends and capital gain distributions, if any, are recorded on the ex-dividend date. Income dividends are generally<br />
declared and paid quarterly. Capital gain distributions are generally declared and paid annually. An additional distribution may<br />
be paid by the Funds to avoid imposition of federal income and excise tax on any remaining undistributed capital gains and net<br />
investment income.<br />
The timing and characterization of certain income and capital gain distributions are determined in accordance with federal tax<br />
regulations which may differ from GAAP. As a result, net investment income and net realized gain (or loss) from investment<br />
transactions for a reporting period may differ significantly from distributions during such period. The differences between tax<br />
regulations and GAAP relate primarily to investments in the Underlying Funds sold at a loss, wash sale deferrals and capital loss<br />
Notes to Financial Statements 43
Russell Investment Funds<br />
LifePoints ® Funds Variable Target Portfolio Series<br />
Notes to Financial Statements, continued — December 31, 2008<br />
carryforwards. Accordingly, the Funds may periodically make reclassifications among certain of their capital accounts without<br />
impacting their net asset value.<br />
Expenses<br />
Expenses included in the accompanying financial statements reflect the expenses of each Fund and do not include those<br />
expenses incurred by the Underlying Funds. Because the Underlying Funds have varied expense and fee levels and the Funds<br />
may own different proportions of the Underlying Funds at different times, the amount of the fees and expenses incurred indirectly<br />
by the Funds will vary. Most expenses can be directly attributed to the individual Funds. Expenses which cannot be directly<br />
attributed to a specific Fund are allocated among all Funds principally based on their relative net assets.<br />
Guarantees<br />
In the normal course of business the Funds enter into contracts that contain a variety of representations which provide general<br />
indemnifications. The Funds’ maximum exposure under these arrangements is unknown as this would involve future claims that<br />
may be made against the Funds that have not yet occurred. However, the Funds expect the risk of loss to be remote.<br />
3. Investment Transactions<br />
Securities<br />
During the period ended December 31, 2008, purchases and sales of the Underlying Funds (excluding short-term investments)<br />
were as follows:<br />
Funds Purchases Sales<br />
Moderate Strategy $ 22,507,185 $ 6,839,969<br />
Balanced Strategy 54,479,438 8,963,036<br />
Growth Strategy 27,506,639 3,505,289<br />
Equity Growth Strategy 10,289,401 3,369,110<br />
4. Related Party Transactions, Fees and Expenses<br />
Adviser and Administrator<br />
RIMCo is the Funds’ investment adviser and RFSC is the Funds’ administrator. RFSC is a wholly-owned subsidiary of RIMCo.<br />
RIMCo is a wholly-owned subsidiary of Frank Russell Company (a subsidiary of The <strong>Northwestern</strong> <strong>Mutual</strong> Life Insurance<br />
Company). Frank Russell Company provides ongoing money manager research and trade placement services to RIC and RIMCo.<br />
RIMCo has contractually agreed to waive, at least through April 29, 2009, its 0.20% advisory fee for each Fund. RIMCo and<br />
RFSC have contractually agreed to waive and/or reimburse, at least through April 29, 2009, each Fund for other direct Fund-level<br />
expenses to the extent that direct Fund-level expenses exceed 0.11%, 0.08%, 0.04% and 0.04% of the average daily net assets of<br />
the Moderate Strategy, Balanced Strategy, Growth Strategy and Equity Growth Strategy Funds, respectively, on an annual basis.<br />
Direct Fund-level expenses for the Funds do not include the expenses of other investment companies in which the Fund invests<br />
which are borne indirectly by the Fund. These arrangements may not be terminated during the relevant period except at the<br />
Board’s discretion.<br />
The Administrative fee of 0.05% is based upon the average daily net assets of each Fund.<br />
For the period ended December 31, 2008, the fees waived and reimbursed by RIMCo and RFSC amounted to:<br />
Funds RIMCo RFSC Total<br />
Moderate Strategy $ 34,738 $ 37,363 $ 72,101<br />
Balanced Strategy 110,766 39,259 150,025<br />
Growth Strategy 70,744 55,262 126,006<br />
Equity Growth Strategy 28,041 47,590 75,631<br />
RIMCo and RFSC do not have the ability to recover amounts waived or reimbursed from previous periods.<br />
Transfer and Dividend Disbursing Agent<br />
RFSC is the Transfer and Dividend Disbursing Agent for the Investment Company. For this service, RFSC is paid a fee for<br />
transfer agency and dividend disbursing services provided to the Funds. RFSC retains a portion of this fee for its services<br />
provided to the Funds and pays the balance to unaffiliated agents who assisted in providing these services.<br />
44 Notes to Financial Statements
Russell Investment Funds<br />
LifePoints ® Funds Variable Target Portfolio Series<br />
Notes to Financial Statements, continued — December 31, 2008<br />
Accrued Fees Payable to Affiliates<br />
Accrued fees payable to affiliates for the period ended December 31, 2008, were as follows:<br />
Moderate Strategy<br />
Fund<br />
Balanced<br />
Strategy Fund<br />
Growth Strategy<br />
Fund<br />
Equity Growth<br />
Strategy Fund<br />
Administration Fees $ 785 $ 4,705 $ 1,399 $ 494<br />
Transfer Agent Fees 69 214 124 44<br />
Trustee Fees 20 113 134 59<br />
$ 874 $ 5,032 $ 1,657 $ 597<br />
Distributor<br />
On June 2, 2008, Russell Fund Distributors, Inc., a wholly-owned subsidiary of RIMCo, changed its name to Russell Financial<br />
Services, Inc. (“Distributor”). The Distributor serves as distributor for RIF, pursuant to the Distribution Agreement with the<br />
Investment Company. The Distributor receives no compensation from the Investment Company for its services.<br />
Board of Trustees<br />
The Russell Fund Complex consists of RIC, which has 38 Funds, and RIF, which has nine Funds. Each of the Trustees is a<br />
Trustee of both RIC and RIF. During the period, the Russell Fund Complex paid each of its independent Trustees a retainer of<br />
$60,000 per year, $6,500 for each regular quarterly meeting attended in person, $2,500 for each special meeting attended in<br />
person, and $2,500 for each Audit Committee meeting, Nominating and Governance Committee meeting, Investment Committee<br />
meeting or any other committee meeting established and approved by the Board that is attended in person. Each Trustee receives<br />
a $1,000 fee for attending the quarterly and special meetings and a $500 fee for attending the committee meeting by phone<br />
instead of receiving the full fee had the member attended in person. Trustees’ out of pocket expenses are also paid by the Russell<br />
Fund Complex. The Audit Committee Chair and Investment Committee Chair are each paid a fee of $12,000 per year and the<br />
Nominating and Governance Committee Chair is paid a fee of $6,000 per year. The chairman of the Board receives additional<br />
annual compensation of $52,000.<br />
Transactions With Affiliated Companies<br />
An affiliated company is a company in which a Fund has ownership of at least 5% of the voting securities or under common<br />
control. Transactions during the period ended December 31, 2008, with Underlying Funds which are an affiliated company or<br />
under common control are as follows:<br />
Affiliate<br />
Market<br />
Value<br />
Purchases<br />
Cost<br />
Sales<br />
Cost<br />
Realized Gain<br />
(Loss)<br />
Income<br />
Distributions<br />
Capital Gains<br />
Distributions<br />
Moderate Strategy Fund<br />
RIF Core Bond Fund $ 11,616,680 $ 12,045,579 $ 4,650,835 $ (283,992) $ 605,092 $ 75,808<br />
RIF Aggressive Equity Fund 572,565 794,728 250,889 (65,586) 5,503 102<br />
RIF Multi-Style Equity Fund 1,922,578 2,597,647 724,308 (127,238) 24,657 14,651<br />
RIC Russell U.S. Quantitative Equity Fund 1,941,688 449,330 162,091 (61,456) 11,977 —<br />
RIF Real Estate Securities Fund 579,739 869,806 404,619 (92,663) 10,253 —<br />
RIC Russell Emerging Markets Fund 382,802 605,880 171,290 (47,356) — 18,228<br />
RIC Russell Global Equity Fund 579,098 798,632 207,118 (36,795) 9,201 —<br />
RIF Non-U.S. Fund 1,723,875 2,276,651 630,329 (158,774) — 12,557<br />
RIC Quantitative Equity Fund (1) — 2,068,932 628,900 (116,550) 7,312<br />
$ 19,319,025 $ 22,507,185 $ 7,830,379 $ (990,410) $ 673,995 $ 121,346<br />
Balanced Strategy Fund<br />
RIF Core Bond Fund $ 23,663,254 $ 17,824,158 $ 6,424,844 $ (480,454) $ 1,252,067 $ 141,698<br />
RIF Aggressive Equity Fund 2,427,255 2,453,632 225,239 (51,919) 22,766 333<br />
RIF Multi-Style Equity Fund 9,069,268 8,898,053 714,019 (113,565) 110,869 53,562<br />
RIC Russell U.S. Quantitative Equity Fund 9,171,902 1,716,415 129,494 (61,804) 54,900 —<br />
RIF Real Estate Securities Fund 3,138,362 3,447,419 1,128,447 (318,787) 54,603 —<br />
RIC Russell Emerging Markets Fund 1,807,454 2,286,358 156,160 (52,488) — 86,370<br />
RIC Russell Global Equity Fund 2,425,322 2,494,605 155,153 (21,707) 37,741 —<br />
RIF Non-U.S. Fund 8,471,481 8,563,152 731,474 (197,105) — 47,603<br />
RIC Quantitative Equity Fund (1) — 6,795,646 745,714 (149,679) 34,877<br />
$ 60,174,298 $ 54,479,438 $ 10,410,544 $ (1,447,508) $ 1,567,823 $ 329,566<br />
Notes to Financial Statements 45
Russell Investment Funds<br />
LifePoints ® Funds Variable Target Portfolio Series<br />
Notes to Financial Statements, continued — December 31, 2008<br />
Affiliate<br />
Market<br />
Value<br />
Purchases<br />
Cost<br />
Sales<br />
Cost<br />
Realized Gain<br />
(Loss)<br />
Income<br />
Distributions<br />
Capital Gains<br />
Distributions<br />
Growth Strategy Fund<br />
RIF Core Bond Fund $ 7,049,778 $ 4,288,231 $ 2,087,711 $ (166,477) $ 397,423 $ 46,107<br />
RIF Aggressive Equity Fund 2,069,177 1,742,315 101,844 (22,719) 21,059 377<br />
RIF Multi-Style Equity Fund 7,170,930 5,916,805 456,660 (74,873) 102,571 56,648<br />
RIC Russell U.S. Quantitative Equity Fund 6,916,638 887,839 95,505 (47,164) 42,950 —<br />
RIF Real Estate Securities Fund 2,207,150 1,812,228 419,571 (121,596) 41,786 —<br />
RIC Russell Emerging Markets Fund 1,386,160 1,586,734 119,980 (36,724) — 66,347<br />
RIC Russell Global Equity Fund 2,072,044 1,828,431 105,741 (11,290) 32,870 —<br />
RIF Non-U.S. Fund 5,880,874 5,080,230 406,274 (113,410) — 44,109<br />
RIC Quantitative Equity Fund (1) — 4,363,826 386,473 (80,217) 30,180<br />
$ 34,752,751 $ 27,506,639 $ 4,179,759 $ (674,470) $ 668,839 $ 213,588<br />
Equity Growth Strategy Fund<br />
RIF Aggressive Equity Fund $ 880,602 $ 713,306 $ 281,798 $ (66,220) $ 9,247 $ 194<br />
RIF Multi-Style Equity Fund 3,271,627 2,624,719 1,043,658 (198,054) 51,215 30,967<br />
RIC Russell U.S. Quantitative Equity Fund 3,175,181 568,631 184,893 (77,051) 19,265 —<br />
RIF Real Estate Securities Fund 902,850 928,295 743,554 (204,398) 18,909 —<br />
RIC Russell Emerging Markets Fund 625,469 666,124 211,439 (67,862) — 29,500<br />
RIC Russell Global Equity Fund 882,254 714,480 224,435 (40,902) 13,700 —<br />
RIF Non-U.S. Fund 2,885,222 2,302,751 901,903 (264,119) — 26,476<br />
RIC Quantitative Equity Fund (1) — 1,771,095 879,244 (183,208) 15,351<br />
$ 12,623,205 $ 10,289,401 $ 4,470,924 $ (1,101,814) $ 127,687 $ 87,137<br />
(1) Quantitative Equity Fund merged into Russell U.S. Quantitative Equity Fund as of September 22, 2008.<br />
5. Federal Income Taxes<br />
At December 31, 2008, the following Fund had net tax basis capital loss carryforwards which may be applied against any net<br />
realized taxable gains in each succeeding year or until their respective expiration dates, whichever occurs first. Available capital<br />
loss carryforwards and expiration dates are as follows:<br />
Funds 12/31/2016 Totals<br />
Equity Growth Strategy $ 134,219 $ 134,219<br />
At December 31, 2008, the cost of investments, net unrealized appreciation (depreciation), undistributed ordinary income and<br />
undistributed long-term capital gains for income tax purposes were as follows:<br />
Moderate<br />
Strategy Fund<br />
Balanced<br />
Strategy Fund<br />
Growth<br />
Strategy Fund<br />
Equity Growth<br />
Strategy Fund<br />
Cost of Investments for Tax Purposes $ 24,524,329 $ 82,502,736 $ 52,768,220 $ 20,937,830<br />
Unrealized Appreciation $ — $ — $ — $ —<br />
Unrealized Depreciation (5,205,304) (22,328,438) (18,015,469) (8,314,625)<br />
Net Tax Unrealized Appreciation (Depreciation) $ (5,205,304) $ (22,328,438) $ (18,015,469) $ (8,314,625)<br />
Undistributed Ordinary Income $ 237,035 $ 79,930 $ 7,955 $ 31,779<br />
Undistributed Long-Term Gains (Capital Loss Carryforward) $ 62,862 $ 96,500 $ 56,058 $ (134,219)<br />
Tax Composition of Distributions:<br />
Ordinary Income $ 482,474 $ 1,443,808 $ 646,736 $ 95,429<br />
Long-Term Capital Gains $ 159,653 $ 1,138,562 $ 1,108,503 $ 741,432<br />
6. Fund Share Transactions (amounts in thousands)<br />
Share transactions for the periods ended December 31, 2008 and December 31, 2007 were as follows:<br />
Shares<br />
Dollars<br />
2008 2007* 2008 2007*<br />
Moderate Strategy Fund<br />
Proceeds from shares sold 2,261 950 $ 21,043 $ 9,530<br />
Proceeds from reinvestment of distributions 71 22 642 209<br />
Payments for shares redeemed (682) (106) (6,163) (1,047)<br />
Total net increase (decrease) 1,650 866 $ 15,522 $ 8,692<br />
46 Notes to Financial Statements
Russell Investment Funds<br />
LifePoints ® Funds Variable Target Portfolio Series<br />
Notes to Financial Statements, continued — December 31, 2008<br />
6. Fund Share Transactions (amounts in thousands) (continued)<br />
Shares<br />
Dollars<br />
2008 2007* 2008 2007*<br />
Balanced Strategy Fund<br />
Proceeds from shares sold 5,802 3,701 $ 50,702 $ 37,178<br />
Proceeds from reinvestment of distributions 306 91 2,582 903<br />
Payments for shares redeemed (856) (197) (7,050) (2,003)<br />
Total net increase (decrease) 5,252 3,595 $ 46,234 $ 36,078<br />
Shares<br />
Dollars<br />
2008 2007* 2008 2007*<br />
Growth Strategy Fund<br />
Proceeds from shares sold 3,050 2,762 $ 25,915 $ 27,787<br />
Proceeds from reinvestment of distributions 212 66 1,755 651<br />
Payments for shares redeemed (344) (61) (2,791) (623)<br />
Total net increase (decrease) 2,918 2,767 $ 24,879 $ 27,815<br />
Shares<br />
Dollars<br />
2008 2007* 2008 2007*<br />
Equity Growth Strategy Fund<br />
Proceeds from shares sold 1,334 1,332 $ 10,149 $ 13,593<br />
Proceeds from reinvestment of distributions 100 37 837 358<br />
Payments for shares redeemed (428) (46) (3,448) (458)<br />
Total net increase (decrease) 1,006 1,323 $ 7,538 $ 13,493<br />
* For the period April 30, 2007 (commencement of operations) to December 31, 2007.<br />
7. Interfund Lending Program<br />
The Investment Company Funds have received permission from the Securities and Exchange Commission to participate in a joint<br />
lending and borrowing facility (the “Credit Facility”). Portfolios of the Funds may borrow money from each other for temporary<br />
purposes. All such borrowing and lending will be subject to a participating Fund’s fundamental investment limitations. Typically,<br />
Funds will borrow from the RIC Russell Money Market Fund. The RIC Russell Money Market Fund will lend through the program<br />
only when the returns are higher than those available from an investment in repurchase agreements or short-term reserves and the<br />
portfolio manager determines it is in the best interest of the RIC Russell Money Market Fund. The Investment Company Funds<br />
will borrow through the program only when the costs are equal to or lower than the cost of bank loans. Interfund loans and<br />
borrowings normally extend overnight, but can have a maximum duration of seven days. Loans may be called on one business<br />
day’s notice. A participating fund may have to borrow from a bank at a higher interest rate if an interfund loan is called or not<br />
renewed. Any delay in repayment to the RIC Russell Money Market Fund could result in a lost investment opportunity or<br />
additional borrowing costs. For the period ended December 31, 2008, the Funds presented herein did not borrow through the<br />
interfund lending program.<br />
8. Record Ownership<br />
As of December 31, 2008, the following table includes shareholders of record with greater than 10% of the total outstanding<br />
shares of each respective Fund. The <strong>Northwestern</strong> <strong>Mutual</strong> Life Insurance Company accounts were the largest shareholders in<br />
each Fund.<br />
Funds # of Shareholders %<br />
Moderate Strategy 1 97.7<br />
Balanced Strategy 1 97.2<br />
Growth Strategy 1 98.3<br />
Equity Growth Strategy 1 97.9<br />
Notes to Financial Statements 47
Report of Independent Registered Public Accounting Firm<br />
To the Board of Trustees and Shareholders<br />
of Russell Investment Funds:<br />
In our opinion, the accompanying statements of assets and liabilities, including the schedules of investments, and the<br />
related statements of operations and of changes in net assets and the financial highlights present fairly, in all material<br />
respects, the financial position of Moderate Strategy Fund, Balanced Strategy Fund, Growth Strategy Fund, and Equity<br />
Growth Strategy Fund (four of the portfolios constituting the Russell Investment Funds, hereafter referred to as the<br />
“Funds”) at December 31, 2008, the results of each of their operations for the year then ended, and the changes in each<br />
of their net assets and the financial highlights for the periods indicated, in conformity with accounting principles<br />
generally accepted in the United States of America. These financial statements and financial highlights (hereafter<br />
referred to as “financial statements”) are the responsibility of the Funds’ management; our responsibility is to express an<br />
opinion on these financial statements based on our audits. We conducted our audits of these financial statements in<br />
accordance with the standards of the Public Company Accounting Oversight Board (United States). Those standards<br />
require that we plan and perform the audits to obtain reasonable assurance about whether the financial statements are<br />
free of material misstatement. An audit includes examining, on a test basis, evidence supporting the amounts and<br />
disclosures in the financial statements, assessing the accounting principles used and significant estimates made by<br />
management, and evaluating the overall financial statement presentation. We believe that our audits, which included<br />
confirmation of securities at December 31, 2008 by correspondence with the transfer agent, provide a reasonable basis<br />
for our opinion.<br />
Seattle, Washington<br />
February 12, 2009<br />
48 Report of Independent Registered Public Accounting Firm
Russell Investment Funds<br />
Tax Information — December 31, 2008 (Unaudited)<br />
For the tax year ended December 31, 2008, the Funds hereby designate 100% or the maximum amount allowable, of its net taxable<br />
income as qualified dividends taxed at individual net capital gain rates.<br />
The Form 1099 you receive in January 2009 will show the tax status of all distributions paid to your account in calendar year 2008.<br />
The Funds designate dividends distributed during the fiscal year as qualifying for the dividends received deduction for corporate<br />
shareholders as follows:<br />
Moderate Strategy 12.0%<br />
Balanced Strategy 17.6%<br />
Growth Strategy 35.0%<br />
Equity Growth Strategy 100.0%<br />
Pursuant to Section 852 of the Internal Revenue Code, the Funds designate the following amounts as long-term capital gain<br />
dividends for their taxable year ended December 31, 2008:<br />
Long-Term<br />
Capital Gains<br />
Moderate Strategy 159,653<br />
Balanced Strategy 1,138,562<br />
Growth Strategy 1,108,503<br />
Equity Growth Strategy 741,432<br />
Please consult a tax adviser for any questions about federal or state income tax laws.<br />
Tax Information 49
Russell Investment Funds<br />
LifePoints® Funds Variable Target Portfolio Series<br />
Basis for Approval of Investment Advisory Contracts (Unaudited)<br />
Approval of Investment Advisory Agreement<br />
The Board of Trustees, including all of the Independent Trustees, last considered and approved the continuation of the advisory<br />
agreement with RIMCo (the “RIMCo Agreement”) and the portfolio management contract (collectively, the “portfolio management<br />
contracts”) with each Money Manager of the funds in which the Funds invest (the “Underlying Funds”) at a meeting held on<br />
April 22, 2008. During the course of a year, the Trustees receive a wide variety of materials regarding the investment performance of<br />
the Funds, sales and redemptions of the Funds’ and Underlying Funds’ shares, and the management of the Funds and the Underlying<br />
Funds by RIMCo. In preparation for the annual review, the Independent Trustees, with the advice and assistance of their<br />
independent counsel, also requested and the Board considered (1) information and reports prepared by RIMCo relating to the<br />
services provided by RIMCo (and its affiliates) to the Funds and the Underlying Funds; and (2) information (the “Third-Party<br />
Information”) received from an independent, nationally recognized provider of investment company information comparing the<br />
performance of each of the Funds and the Underlying Funds and their respective operating expenses over various periods of time<br />
with other peer funds (“Comparable Funds”) not managed by RIMCo believed by the provider to be generally comparable in<br />
investment objectives and size to the Funds and the Underlying Funds. The foregoing information requested by the Trustees or<br />
provided by RIMCo is collectively called the “Agreement Renewal Information.” The Trustees’ evaluations also reflected the<br />
knowledge and familiarity gained as Board members of the Funds and other funds in the same complex with respect to services<br />
provided by RIMCo, RIMCo’s affiliates and each Money Manager. The Trustees received a memorandum from counsel to the Funds<br />
discussing the legal standards for their consideration of the continuations of the RIMCo Agreement and the portfolio management<br />
contracts and the Independent Trustees separately received a memorandum regarding their responsibilities from their independent<br />
counsel.<br />
On April 21, 2008, the Independent Trustees met to review the Agreement Renewal Information in a private session with their<br />
independent counsel at which no representatives of RIMCo or management were present. At the April 22 meeting of the Board of<br />
Trustees, the Board, including the Independent Trustees, reviewed the proposed continuance of the RIMCo Agreement and the<br />
portfolio management contracts with management and independent counsel to the Independent Trustees. Presentations made by<br />
RIMCo to the Board as part of this review encompassed the Funds and all other RIMCo-managed funds for which the Board has<br />
supervisory responsibility. Following this review, but prior to voting, the Independent Trustees again met in a private session with<br />
their independent counsel to evaluate additional information and analyses received from RIMCo and management at the Board<br />
meeting. The discussion below reflects all of these reviews.<br />
In evaluating the portfolio management contracts, the Board considered that the Underlying Funds, in employing a<br />
manager-of-managers method of investment, operate in a manner that is distinctly different from most other investment companies.<br />
In the case of most other investment companies, an advisory fee is paid by the investment company to its adviser which in turn<br />
employs and compensates individual portfolio managers to make specific securities selections consistent with the adviser’s style and<br />
investment philosophy. RIMCo has engaged multiple unaffiliated Money Managers for all Underlying Funds.<br />
The Board considered that RIMCo (rather than any Money Manager) is responsible under the RIMCo Agreement for allocating assets<br />
of each Fund among its Underlying Funds and for determining, implementing and maintaining the investment program for each<br />
Underlying Fund. The assets of each Fund are invested in different combinations of the Underlying Funds pursuant to target asset<br />
allocations set by RIMCo. RIMCo may modify the target asset allocation for any Fund and/or the Underlying Funds in which the<br />
Funds invest. Assets of each Underlying Fund generally have been allocated among the multiple Money Managers selected by<br />
RIMCo, subject to Board approval, for that Underlying Fund. RIMCo manages directly a portion of certain Underlying Funds’ assets<br />
employing a “select holdings strategy,” as described below, and directly manages the investment of each Underlying Fund’s cash<br />
reserves. RIMCo also may manage directly any portion of each Underlying Fund’s assets that RIMCo determines not to allocate to<br />
the Money Managers and portions of an Underlying Fund during transitions between Money Managers. In all cases, assets are<br />
managed directly by RIMCo pursuant to authority granted by the RIMCo Agreement.<br />
RIMCo is responsible for selecting, subject to Board approval, Money Managers for each Underlying Fund and for actively managing<br />
allocations and reallocations of its assets among the Money Managers. RIMCo’s goal is to construct and manage diversified portfolios<br />
in a risk aware manner. Each Money Manager for an Underlying Fund in effect performs the function of an individual portfolio<br />
manager who is responsible for selecting portfolio securities for the portion of the Underlying Fund assigned to it by RIMCo (each, a<br />
“segment”) in accordance with the Fund’s applicable investment objective, policies and restrictions, any constraints placed by<br />
RIMCo upon their selection of portfolio securities and the Money Manager’s specified role in an Underlying Fund. RIMCo is<br />
responsible for communicating performance expectations to each Money Manager; supervising compliance by each Money Manager<br />
with each Underlying Fund’s investment objective and policies; authorizing Money Managers to engage in certain investment<br />
strategies for an Underlying Fund; and recommending annually to the Board whether portfolio management contracts should be<br />
renewed, modified or terminated. In addition to its annual recommendation as to the renewal, modification or termination of portfolio<br />
management contracts, RIMCo is responsible for recommending to the Board additions of new Money Managers or replacements of<br />
existing Money Managers at any time when, based on RIMCo’s research and ongoing review and analysis, such actions are<br />
50 Basis for Approval of Investment Advisory Contracts
Russell Investment Funds<br />
LifePoints® Funds Variable Target Portfolio Series<br />
Basis for Approval of Investment Advisory Contracts, continued (Unaudited)<br />
appropriate. RIMCo may impose specific investment constraints from time to time for each Money Manager intended to capitalize on<br />
the strengths of that Money Manager or to coordinate the investment activities of Money Managers for an Underlying Fund in a<br />
complementary manner. Therefore, the performance of individual Money Managers for an Underlying Fund may reflect the roles<br />
assigned to them by RIMCo in the Underlying Funds’ investment activities and any constraints placed by RIMCo upon their<br />
selection of portfolio securities. In light of the foregoing, the overall performance of each Underlying Fund over appropriate periods<br />
reflects, in great part, the performance of RIMCo in designing the Underlying Fund’s investment program, structuring an Underlying<br />
Fund, selecting an effective Money Manager with a particular investment style or sub-style for a segment that is complementary to<br />
the styles of the Money Managers of other Underlying Fund segments, and allocating assets among the Money Managers in a manner<br />
designed to achieve the objectives of the Underlying Fund.<br />
The Board considered that the prospectuses for the Funds and the Underlying Funds and other public disclosures emphasize to<br />
investors RIMCo’s role as the principal investment manager for each Underlying Fund, rather than the investment selection role of<br />
the Underlying Funds’ Money Managers, and describe the manner in which the Funds or Underlying Funds operate so that investors<br />
may take that information into account when deciding to purchase shares of any Fund.<br />
The Board also considered the demands and complexity of managing the Underlying Funds pursuant to the manager-or-managers<br />
structure, the special expertise of RIMCo with respect to the manager-of-managers structure of the Underlying Funds and the<br />
likelihood that, at the current expense ratio of each Underlying Fund, there would be no acceptable alternative investment managers<br />
to replace RIMCo on comparable terms given the need to continue the manager-of-managers strategy of each Underlying Fund<br />
selected by shareholders in purchasing their shares of a Fund or Underlying Fund.<br />
In addition to these general factors relating to the manager-of-managers structure of the Underlying Funds, the Trustees considered,<br />
with respect to each Fund and Underlying Fund, various specific factors in evaluating renewal of the RIMCo Agreement, including<br />
the following:<br />
1. The nature, scope and quality of the services provided to the Fund and the Underlying Fund by RIMCo;<br />
2. The advisory fee paid by the Fund or the Underlying Fund to RIMCo and the fact that it encompasses all investment advisory<br />
fees paid by the Fund or Underlying Fund, including the fees for any Money Managers of such Underlying Fund;<br />
3. Information provided by RIMCo as to other fees and benefits received by RIMCo or its affiliates from the Fund or Underlying<br />
Fund, including any administrative, transfer agent, cash management and securities lending fees, soft dollar arrangements and<br />
commissions in connection with portfolio securities transactions;<br />
4. Information provided by RIMCo as to expenses incurred by the Fund or the Underlying Fund; and<br />
5. Information provided by RIMCo as to the profits that RIMCo derives from its mutual fund operations generally and from the<br />
Fund or Underlying Fund.<br />
As noted above, RIMCo pursuant to the terms of the RIMCo Agreement directly managed a portion—up to 10%—of the assets of the<br />
RIF Multi-Style Equity Fund and the Russell Investment Company (“RIC”) Quantitative Equity Fund (each a “Participating<br />
Underlying Fund”) during the past year utilizing a select holdings strategy, the actual allocation being determined by each<br />
Participating Underlying Fund’s RIMCo portfolio manager. The select holdings strategy utilized by RIMCo in managing such assets<br />
for a Participating Underlying Fund is designed to increase the Participating Underlying Fund’s exposure to stocks that are viewed<br />
as attractive by multiple Money Managers of that Participating Underlying Fund. The Board reviewed the results of the select<br />
holdings strategy in respect of each Participating Underlying Fund since implementation taking into account that the strategy has<br />
been utilized for a limited period of time. With respect to each Participating Underlying Fund, the Trustees considered that RIMCo<br />
is not required to pay investment advisory fees to a Money Manager with respect to assets for which the select holdings strategy is<br />
utilized and that the profits derived by RIMCo generally and from the Participating Underlying Fund consequently may increase<br />
incrementally. The Board, however, also considered RIMCo’s advice that it pays certain Money Managers additional fees for<br />
providing information and other services in connection with the select holdings strategy and incurs additional costs in carrying out<br />
the select holdings strategy, the limited amount of assets that are managed directly by RIMCo pursuant to the select holdings<br />
strategy, and the fact that the aggregate investment advisory fees paid by the Participating Underlying Fund are not increased as a<br />
result of the select holdings strategy.<br />
In evaluating the reasonableness of the Funds’ and Underlying Funds’ investment advisory fees in light of Fund and Underlying<br />
Fund performance, the Board considered that RIMCo, in the Agreement Renewal Information and at past meetings, noted differences<br />
between the investment strategies of certain Underlying Funds and their respective Comparable Funds in pursuing their investment<br />
objectives, including Fund strategies which seek to achieve a lower tracking error (i.e., the difference, whether positive or negative,<br />
Basis for Approval of Investment Advisory Contracts 51
Russell Investment Funds<br />
LifePoints® Funds Variable Target Portfolio Series<br />
Basis for Approval of Investment Advisory Contracts, continued (Unaudited)<br />
between the return of a fund and its benchmark) and resulting lower return volatility than Comparable Funds. According to RIMCo,<br />
these strategies may be expected to result, and for certain Underlying Funds during the periods covered by the Third-Party<br />
Information did result, in lower performance of the Funds than that of some of their respective Comparable Funds. According to<br />
RIMCo, the strategies pursued by the Underlying Funds, among other things, are intended to result in less volatile, more moderate<br />
returns relative to each Fund’s performance benchmark rather than more volatile, more extreme returns that its Comparable Funds<br />
may experience over time.<br />
The Board considered for each Fund and Underlying Fund whether economies of scale have been realized and whether the fees for<br />
such Fund or Underlying Fund appropriately reflect or should be revised to reflect any such economies. The Board determined that,<br />
after giving effect to any applicable fee or expense caps, waivers or reimbursements, the investment advisory fees for each Fund or<br />
Underlying Fund appropriately reflect any economies of scale realized by such Fund, based upon such factors as the variability of<br />
Money Manager investment advisory fees and other factors associated with the manager-of-managers structure employed by the<br />
Underlying Funds. The Trustees considered that fees payable to RIMCo by institutional clients with investment objectives similar to<br />
those of the Funds and other funds under the Board’s supervision, including the Underlying Funds are lower, and may, in some<br />
cases, be substantially lower, than the rates paid by funds supervised by the Board, including the Funds. The Trustees considered<br />
the differences in the scope of services it provides to institutional clients and the funds under its supervision, including the<br />
Underlying Funds. In response to the Trustees’ inquiries, RIMCo has previously noted, among other things, that institutional clients<br />
have fewer administrative needs than the Funds. RIMCo has in the past noted that since the Funds must constantly issue and redeem<br />
their shares, they are more difficult to manage than institutional accounts, where assets are relatively stable. Accordingly, the<br />
Trustees did not regard these fee differences as relevant to their deliberations.<br />
On the basis of the Agreement Renewal Information, and other information previously received by the Board from RIMCo during the<br />
course of the current year or prior years or presented at the April 22 Board meeting by RIMCo, the Board, in respect of each Fund<br />
and Underlying Fund, found, after giving effect to waivers and/or reimbursements and considering differences in the composition<br />
and investment strategies of their respective Comparable Funds (1) the advisory fee charged by RIMCo to be reasonable in light of<br />
the nature, scope and quality of the services provided to the Funds or Underlying Funds; (2) the relative expense ratio of each Fund<br />
and Underlying Fund was comparable to those of its Comparable Funds; (3) RIMCo’s methodology of allocating expenses of<br />
operating funds in the complex was reasonable; and (4) RIMCo’s profitability with respect to the Fund and each Underlying Fund<br />
was not excessive in light of the nature, scope and quality of the services provided by RIMCo.<br />
The Board further concluded that, under the circumstances, the performance of each of the Funds supported continuation of the<br />
RIMCo Agreement. In evaluating performance, the Board considered each Fund’s and Underlying Fund’s absolute performance and<br />
its performance relative to appropriate benchmarks and indices and its Comparable Funds. In assessing performance, the Board also<br />
considered RIMCo’s investment strategy of managing the Underlying Funds in a risk aware manner.<br />
After considering the foregoing and other relevant factors, the Board concluded that continuation of the RIMCo Agreement on its<br />
current terms and conditions would be in the best interests of the Funds and their respective shareholders and voted to approve the<br />
continuation of the Agreement.<br />
At the April 22 Board meeting, with respect to the evaluation of the terms of portfolio management contracts with Money Managers<br />
for the Underlying Funds, the Board received and considered information from RIMCo reporting, among other things, for each Money<br />
Manager, the Money Manager’s performance over various periods; RIMCo’s assessment of the performance of the Money Manager;<br />
any significant business relationships between the Money Manager and RIMCo or Russell Financial Services, Inc., the Funds’ and<br />
Underlying Funds’ underwriter; and RIMCo’s recommendation to retain the Money Manager at the current fee rate, to retain the<br />
Money Manager at a reduced fee rate or to terminate the Money Manager. RIMCo recommended that each Money Manager be<br />
retained at its current fee rate. RIMCo has advised the Board that it does not regard Money Manager profitability as relevant to its<br />
evaluation of the portfolio management contracts with Money Managers because the willingness of Money Managers to serve in such<br />
capacity depends upon arm’s-length negotiations with RIMCo; RIMCo is aware of the fees charged by Money Managers to other<br />
clients; and RIMCo believes that the fees agreed upon with Money Managers are reasonable in light of the anticipated quality of<br />
investment advisory services to be rendered. The Board accepted RIMCo’s explanation in light of the Board’s findings as to the<br />
reasonableness of the aggregate investment advisory fees paid by each Fund and Underlying Fund and the fact that each Money<br />
Manager’s fee is paid by RIMCo.<br />
Based substantially upon RIMCo’s recommendations together with the information received from RIMCo in support of its<br />
recommendations at the April 22 meeting, the Board concluded that the fees paid to the Money Managers of each Underlying Fund<br />
are reasonable in light of the quality of the investment advisory services provided and that continuation of the portfolio management<br />
contract with each Money Manager of each Underlying Fund would be in the best interests of the Fund and its shareholders.<br />
52 Basis for Approval of Investment Advisory Contracts
Russell Investment Funds<br />
LifePoints® Funds Variable Target Portfolio Series<br />
Basis for Approval of Investment Advisory Contracts, continued (Unaudited)<br />
In their deliberations, the Trustees did not identify any particular information as to the RIMCo Agreement or, other than RIMCo’s<br />
recommendation, the portfolio management contract with any Money Manager for an Underlying Fund that was all-important or<br />
controlling and each Trustee attributed different weights to the various factors considered. The Trustees evaluated all information<br />
available to them on a Fund-by-Fund basis and their determinations were made in respect of each Fund and Underlying Fund.<br />
Subsequently, the Board of Trustees received the following proposals from RIMCo: (1) at a meeting held on May 20, 2008, to effect a<br />
money manager change for the Russell Global Equity Fund; (2) at a meeting held on August 26, 2008, to effect a money manager<br />
change for the Russell U.S. Quantitative Equity Fund; and (3) at a meeting held on October 10, 2008, to effect a money manager<br />
change for the Multi-Style Equity Fund resulting from a change of control of one of the Fund’s Money Managers. In the case of each<br />
such proposed change, the Trustees approved the terms of the proposed portfolio management contract based substantially upon<br />
RIMCo’s recommendation to hire the Money Manager at the proposed fee rate; any significant business relationships between the<br />
Money Manager and RIMCo or Russell Financial Services, Inc. the Fund’s underwriter; RIMCo’s explanation as to the lack of<br />
relevance of profitability to the evaluation of portfolio management contracts with money managers because the willingness of Money<br />
Managers to serve in such capacity depends upon arm’s-length negotiations with RIMCo; RIMCo’s awareness of the fees charged by<br />
the Money Manager to other clients; and RIMCo’s belief that the proposed investment advisory fees would be reasonable in light of<br />
the anticipated quality of investment advisory services to be rendered. The Trustees also considered their findings at their April 22,<br />
2008 meeting as to the reasonableness of the aggregate investment advisory fees paid by the Fund, and the fact that the aggregate<br />
investment advisory fees paid by the Fund would not increase as a result of the implementation of the proposed money manager<br />
change because the money managers’ investment advisory fee is paid by RIMCo.<br />
Basis for Approval of Investment Advisory Contracts 53
Russell Investment Funds<br />
LifePoints ® Funds Variable Target Portfolio Series<br />
Shareholder Requests for Additional Information — December 31, 2008 (Unaudited)<br />
A complete unaudited schedule of investments is made available generally no later than 60 days after the end of the first and third<br />
quarters of each year. These reports are available (i) free of charge, upon request, by calling the Funds at (800) 787-7354, (ii) on the<br />
Securities and Exchange Commission’s website at www.sec.gov, and (iii) at the Securities and Exchange Commission’s public<br />
reference room.<br />
The Board has delegated to RIMCo, as RIF’s investment adviser, the primary responsibility for monitoring, evaluating and voting<br />
proxies solicited by or with respect to issuers of securities in which assets of the Funds may be invested. RIMCo has established a<br />
proxy voting committee (“Committee”) and has adopted written proxy voting policies and procedures (“P&P”) and proxy voting<br />
guidelines (“Guidelines”). The Funds maintain a Portfolio Holdings Disclosure Policy that governs the timing and circumstances of<br />
disclosure to shareholders and third parties of information regarding the portfolio investments held by the Funds. A description of<br />
the P&P, Guidelines, Portfolio Holdings Disclosure Policy and additional information about Fund Trustees are contained in the<br />
Funds’ Statement of Additional Information (“SAI”). The SAI is available (i) free of charge, upon request, by calling the Funds at<br />
(800) 787-7354, and (ii) on the Securities and Exchange Commission’s website at www.sec.gov.<br />
Financial Statements of the Underlying Funds can be obtained at no charge by calling the Funds at (800) 787-7354.<br />
If possible, depending on contract owner registration and address information, and unless you have otherwise opted out, only one<br />
copy of the RIF prospectus and each annual and semi-annual report will be sent to contract owners at the same address. If you would<br />
like to receive a separate copy of these documents, please contact your Insurance Company. If you currently receive multiple copies<br />
of the prospectus, annual report and semi-annual report and would like to request to receive a single copy of these documents in the<br />
future, please call your Insurance Company.<br />
Some Insurance Companies may offer electronic delivery of the Funds’ prospectus and annual and semiannual reports. Please<br />
contact your Insurance Company for further details.<br />
54 Shareholder Requests for Additional Information
Russell Investment Funds<br />
LifePoints ® Funds Variable Target Portfolio Series<br />
Disclosure of Information about Fund Trustees and Officers — December 31, 2008<br />
(Unaudited)<br />
The following tables provide information for each officer and trustee of the Russell Fund Complex. The Russell Fund Complex<br />
consists of Russell Investment Company (“RIC”), which has 38 funds, and Russell Investment Funds (“RIF”), which has 9 funds.<br />
Each of the trustees is a trustee of both RIC and RIF. The first table provides information for the interested trustee. The second table<br />
provides information for the independent trustees. The third table provides information for the trustees emeritus. The fourth table<br />
provides information for the officers.<br />
Name,<br />
Age,<br />
Address<br />
Position(s) Held<br />
with Fund and<br />
Length of<br />
Time Served<br />
Term<br />
of<br />
Office*<br />
Principal Occupation(s)<br />
During the<br />
Past 5 Years<br />
No. of<br />
Portfolios<br />
in Russell<br />
Fund<br />
Complex<br />
Overseen<br />
by Trustee<br />
Other<br />
Directorships Held<br />
by Trustee<br />
INTERESTED TRUSTEES<br />
#Greg J. Stark<br />
Born May 3, 1968<br />
909 A Street<br />
Tacoma, Washington<br />
98402-1616<br />
President and Chief<br />
Executive Officer<br />
since 2004<br />
Trustee since 2007<br />
Appointed until<br />
successor is duly<br />
elected and<br />
qualified<br />
Until successor<br />
is chosen and<br />
qualified by<br />
Trustees<br />
• President and CEO RIC and RIF<br />
• Chairman of the Board, President<br />
and CEO, RIMCo<br />
• Chairman of the Board, President<br />
and CEO, Russell Fund Services<br />
Company (“RFSC”)<br />
• Chairman of the Board, President<br />
and CEO, Russell Financial<br />
Services, Inc.<br />
• Chairman of the Board and<br />
President, Russell Insurance<br />
Agency, Inc. (insurance agency<br />
(“RIA”))<br />
• Until 2004, Managing Director, of<br />
Individual Investor Services, FRC<br />
• 2000 to 2004 Managing Director,<br />
Sales and Client Service, RIMCo<br />
47 None<br />
909 A Street<br />
Tacoma, Washington<br />
98402-1616<br />
INDEPENDENT TRUSTEES<br />
Thaddas L. Alston Trustee since 2006<br />
Born April 7, 1945<br />
Appointed until<br />
successor is duly<br />
elected and<br />
qualified<br />
• Senior Vice President, Larco<br />
Investments, Ltd. (real estate firm)<br />
47 None<br />
Kristianne Blake,<br />
Born January 22, 1954<br />
909 A Street Tacoma,<br />
Washington 98402-1616<br />
Trustee since 2000<br />
Chairman since 2005<br />
Appointed until<br />
successor is duly<br />
elected and<br />
qualified<br />
<strong>Annual</strong><br />
• Director and Chairman of the Audit<br />
Committee, Avista Corp.<br />
• Trustee and Chairman of the<br />
Operations Committee, Principal<br />
Investors Funds and Principal<br />
Variable Contracts Funds<br />
• Regent, University of Washington<br />
• President, Kristianne Gates Blake,<br />
P.S. (accounting services)<br />
• February 2002 to June 2005,<br />
Chairman of the Audit Committee,<br />
RIC and RIF Trustee and Chairman<br />
of the Operations and Distribution<br />
Committee, WM Group of Funds,<br />
1999–2006<br />
47 • Director,<br />
Avista Corp;<br />
(electric<br />
utilities)<br />
• Trustee,<br />
Principal<br />
Investors<br />
Funds<br />
(investment<br />
company);<br />
• Trustee,<br />
Principal<br />
Variable<br />
Contracts<br />
Funds<br />
(investment<br />
company)<br />
# Mr. Stark is also an officer and/or director of one or more affiliates of RIC and RIF and is therefore an Interested Trustee.<br />
Disclosure of Information about Fund Trustees and Officers 55
Russell Investment Funds<br />
LifePoints ® Funds Variable Target Portfolio Series<br />
Disclosure of Information about Fund Trustees and Officers, continued —<br />
December 31, 2008 (Unaudited)<br />
Name,<br />
Age,<br />
Address<br />
Position(s) Held<br />
With Fund and<br />
Length of<br />
Time Served<br />
Term<br />
of<br />
Office*<br />
Principal Occupation(s)<br />
During the<br />
Past 5 Years<br />
No. of<br />
Portfolios<br />
in Russell<br />
Fund<br />
Complex<br />
Overseen<br />
by Trustee<br />
Other<br />
Directorships Held<br />
by Trustee<br />
INDEPENDENT TRUSTEES (continued)<br />
Daniel P. Connealy<br />
Born June 6, 1946<br />
909 A Street<br />
Tacoma, Washington<br />
98402-1616<br />
Trustee since 2003<br />
Chairman of Audit<br />
Committee since<br />
2005<br />
Appointed until<br />
successor is duly<br />
elected and<br />
qualified<br />
Appointed until<br />
successor is duly<br />
elected and<br />
qualified<br />
• June 2004 to present, Senior Vice<br />
President and Chief Financial Officer,<br />
Waddell & Reed Financial, Inc.<br />
• 2001–2003, Vice President and Chief<br />
Financial Officer, Janus Capital<br />
Group Inc.<br />
47 None<br />
Jonathan Fine<br />
Born July 8, 1954<br />
909 A Street<br />
Tacoma, Washington<br />
98402-1616<br />
Trustee<br />
since 2004<br />
Appointed until<br />
successor is duly<br />
elected and<br />
qualified<br />
• President and Chief Executive<br />
Officer, United Way of King County,<br />
WA<br />
47 None<br />
Raymond P. Tennison, Jr.<br />
Born December 21, 1955<br />
909 A Street<br />
Tacoma, Washington<br />
98402-1616<br />
Trustee<br />
since 2000<br />
Chairman of the<br />
Nominating and<br />
Governance<br />
Committee since<br />
2007<br />
Appointed until<br />
successor is duly<br />
elected and<br />
qualified.<br />
Appointed until<br />
successor is duly<br />
elected and<br />
qualified<br />
• President, Simpson Investment<br />
Company and several additional<br />
subsidiary companies, including<br />
Simpson Timber Company, Simpson<br />
Paper Company and Simpson Tacoma<br />
Kraft Company<br />
47 None<br />
Jack R. Thompson,<br />
Born March 21, 1949<br />
909 A Street<br />
Tacoma, Washington<br />
98402-1616<br />
Trustee since 2005<br />
Appointed until<br />
successor is duly<br />
elected and<br />
qualified<br />
• September 2003 to present,<br />
Independent Board Chair and<br />
Chairman of the Audit Committee,<br />
Sparx Asia Funds<br />
• September 2007 to present, Director,<br />
Board Chairman, and Audit<br />
Committee Chairman, LifeVantage<br />
Corporation (health products<br />
company)<br />
• May 1999 to May 2003, President,<br />
Chief Executive Officer and Director,<br />
Berger Financial Group, LLC<br />
• May 1999 to May 2003, President and<br />
Trustee, Berger Funds<br />
47 • Director, Sparx<br />
Asia Funds<br />
(investment<br />
company)<br />
• Director, Board<br />
Chairman, and<br />
Audit<br />
Committee<br />
Chairman,<br />
LifeVantage<br />
Corporation<br />
(health<br />
products<br />
company)<br />
Julie W. Weston,<br />
Born October 2, 1943<br />
909 A Street<br />
Tacoma, Washington<br />
98402-1616<br />
Trustee<br />
since 2002<br />
Chairperson of the<br />
Investment<br />
Committee since<br />
2006<br />
Appointed until<br />
successor is duly<br />
elected and<br />
qualified<br />
Appointed until<br />
successor is duly<br />
elected and<br />
qualified<br />
• Retired 47 None<br />
* Each Trustee is subject to mandatory retirement at age 72.<br />
56 Disclosure of Information about Fund Trustees and Officers
Russell Investment Funds<br />
LifePoints ® Funds Variable Target Portfolio Series<br />
Disclosure of Information about Fund Trustees and Officers, continued —<br />
December 31, 2008 (Unaudited)<br />
Name,<br />
Age,<br />
Address<br />
Position(s) Held<br />
with Fund and<br />
Length of<br />
Time Served<br />
Term<br />
of<br />
Office<br />
Principal Occupation(s)<br />
During the<br />
Past 5 Years<br />
No. of<br />
Portfolios<br />
in Russell<br />
Fund<br />
Complex<br />
Overseen<br />
by Trustee<br />
Other<br />
Directorships Held<br />
by Trustee<br />
TRUSTEES EMERITUS<br />
*George F. Russell, Jr.,<br />
Born July 3, 1932<br />
909 A Street<br />
Tacoma, Washington<br />
98402-1616<br />
Trustee Emeritus and<br />
Chairman Emeritus<br />
since 1999<br />
Until resignation<br />
or removal<br />
• Director Emeritus, Frank Russell<br />
Company (investment consultant to<br />
institutional investors (“FRC”)); and<br />
RIMCo<br />
• Chairman Emeritus, RIC and RIF;<br />
Russell Implementation Services<br />
Inc. (broker-dealer and investment<br />
adviser (“RIS”)); Russell 20-20<br />
Association (non-profit corporation);<br />
and Russell Trust Company (nondepository<br />
trust company (“RTC”))<br />
• Chairman, Sunshine Management<br />
Services, LLC (investment adviser)<br />
47 None<br />
Paul E. Anderson,<br />
Born October 15, 1931<br />
909 A Street<br />
Tacoma, Washington<br />
98402-1616<br />
Trustee Emeritus<br />
since 2007<br />
Five year term<br />
• President, Anderson Management<br />
Group LLC (private investments<br />
consulting)<br />
• February 2002 to June 2005, Lead<br />
Trustee, RIC and RIF<br />
• Trustee of RIC and RIF until 2006<br />
• Chairman of the Nominating and<br />
Governance Committee 2006<br />
47 None<br />
William E. Baxter,<br />
Born June 8, 1925<br />
Trustee Emeritus<br />
since 2004<br />
Five year term • Retired since 1986<br />
• Trustee of RIC and RIF until 2004<br />
47 None<br />
909 A Street<br />
Tacoma, Washington<br />
98402-1616<br />
Lee C. Gingrich,<br />
Born October 6, 1930<br />
909 A Street<br />
Tacoma, Washington<br />
98402-1616<br />
Trustee Emeritus<br />
since 2006<br />
Five year term • Retired since 1995<br />
• Trustee of RIC and RIF until 2005<br />
• Chairman of the Nominating and<br />
Governance Committee 2001–2005<br />
47 None<br />
Eleanor W. Palmer,<br />
Born May 5, 1926<br />
Trustee Emeritus<br />
since 2004<br />
Five year term • Retired since 1981<br />
• Trustee of RIC and RIF until 2004<br />
47 None<br />
909 A Street<br />
Tacoma, Washington<br />
98402-1616<br />
* Mr. Russell is also a director emeritus of one or more affiliates of RIC and RIF.<br />
Disclosure of Information about Fund Trustees and Officers 57
Russell Investment Funds<br />
LifePoints ® Funds Variable Target Portfolio Series<br />
Disclosure of Information about Fund Trustees and Officers, continued —<br />
December 31, 2008 (Unaudited)<br />
Name,<br />
Age,<br />
Address<br />
Position(s) Held<br />
with Fund and<br />
Length of<br />
Time Served<br />
Term<br />
of<br />
Office<br />
Principal Occupation(s)<br />
During the<br />
Past 5 Years<br />
OFFICERS<br />
Cheryl Wichers<br />
Born December 16, 1966<br />
909 A Street<br />
Tacoma, Washington<br />
98402-1616<br />
Chief Compliance<br />
Officer since 2005<br />
Until removed<br />
by Independent<br />
Trustees<br />
• Chief Compliance Officer, RIC<br />
• Chief Compliance Officer, RIF<br />
• Chief Compliance Officer, RIMCo<br />
• Chief Compliance Officer, RFSC<br />
• April 2002–May 2005, Manager, Global Regulatory Policy<br />
Greg J. Stark,<br />
Born May 3, 1968<br />
909 A Street<br />
Tacoma, Washington<br />
98402-1616<br />
President and Chief<br />
Executive Officer<br />
since 2004<br />
Until successor<br />
is chosen and<br />
qualified by<br />
Trustees<br />
• President and CEO, RIC and RIF<br />
• Chairman of the Board, President and CEO, RIMCo<br />
• Chairman of the Board, President and CEO, Russell Financial<br />
Services, Inc.<br />
• Chairman of the Board, President and CEO, RFSC<br />
• Chairman of the Board and President, Russell Insurance Agency,<br />
Inc. (insurance agency (“RIA”))<br />
• Until 2004, Managing Director of Individual Investor Services, FRC<br />
• 2000 to 2004, Managing Director, Sales and Client Service, RIMCo<br />
Mark E. Swanson,<br />
Born November 26, 1963<br />
909 A Street Tacoma,<br />
Washington 98402-1616<br />
Treasurer and Chief<br />
Accounting Officer<br />
since 1998<br />
Until successor<br />
is chosen and<br />
qualified by<br />
Trustees<br />
• Treasurer, Chief Accounting Officer and CFO, RIC and RIF<br />
• Director, Funds Administration, RIMCo, RFSC, RTC and Russell<br />
Financial Services, Inc.<br />
• Treasurer and Principal Accounting Officer, SSgA Funds<br />
Peter Gunning,<br />
Born February 22, 1967<br />
Chief Investment<br />
Officer since 2008<br />
Until removed<br />
by Trustees<br />
• Chief Investment Officer, RIC, RIF<br />
• 1996 to 2008 Chief Investment Officer, Russell, Asia Pacific<br />
909 A Street<br />
Tacoma, Washington<br />
98402-1616<br />
Gregory J. Lyons,<br />
Born August 24, 1960<br />
909 A Street<br />
Tacoma, Washington<br />
98402-1616<br />
Secretary since 2007<br />
Until successor<br />
is chosen and<br />
qualified by<br />
Trustees<br />
• Associate General Counsel and Assistant Secretary FRC and RIA<br />
• Director and Secretary, RIMCo, RFSC and Russell Financial<br />
Services, Inc.<br />
• Secretary and Chief Legal Counsel, RIC and RIF<br />
58 Disclosure of Information about Fund Trustees and Officers
LifePoints ® Funds Variable Target Portfolio Series<br />
Russell Investment Funds<br />
909 A Street, Tacoma, Washington 98402<br />
(800) 787-7354<br />
Interested Trustees<br />
Greg J. Stark<br />
Independent Trustees<br />
Thaddas L. Alston<br />
Kristianne Blake<br />
Daniel P. Connealy<br />
Jonathan Fine<br />
Raymond P. Tennison, Jr.<br />
Jack R. Thompson<br />
Julie W. Weston<br />
Trustees Emeritus<br />
George F. Russell, Jr.<br />
Paul E. Anderson<br />
William E. Baxter<br />
Lee C. Gingrich<br />
Eleanor W. Palmer<br />
Officers<br />
Greg J. Stark, President and Chief Executive Officer<br />
Cheryl Wichers, Chief Compliance Officer<br />
Peter Gunning, Chief Investment Officer<br />
Mark E. Swanson, Treasurer and Chief Accounting Officer<br />
Gregory J. Lyons, Secretary<br />
Adviser<br />
Russell Investment Management Company<br />
909 A Street<br />
Tacoma, WA 98402<br />
Administrator and Transfer and Dividend Disbursing<br />
Agent<br />
Russell Fund Services Company<br />
909 A Street<br />
Tacoma, WA 98402<br />
Custodian<br />
State Street Bank and Trust Company<br />
Josiah Quincy Building<br />
200 Newport Avenue<br />
North Quincy, MA 02171<br />
Office of Shareholder Inquiries<br />
909 A Street<br />
Tacoma, WA 98402<br />
(800) 787-7354<br />
Legal Counsel<br />
Dechert LLP<br />
200 Clarendon Street, 27th Floor<br />
Boston, MA 02116-5021<br />
Distributor<br />
Russell Financial Services, Inc.<br />
909 A Street<br />
Tacoma, WA 98402<br />
Independent Registered Public Accounting Firm<br />
PricewaterhouseCoopers LLP<br />
1420 5th Avenue<br />
Suite 1900<br />
Seattle, WA 98101<br />
Money Managers of Underlying Funds as of<br />
December 31, 2008<br />
RIF Core Bond Fund<br />
Goldman Sachs Asset Management, L.P., New York, NY<br />
Metropolitan West Asset Management, LLC, Los Angeles, CA<br />
Pacific Investment Management Company LLC, Newport Beach, CA<br />
RIF Aggressive Equity Fund<br />
ClariVest Asset Management LLC, San Diego, CA<br />
DePrince, Race & Zollo, Inc., Winter Park, FL<br />
Gould Investment Partners LLC, Berwyn, PA<br />
Jacobs Levy Equity Management, Inc., Florham Park, NJ<br />
PanAgora Asset Management, Inc., Boston, MA<br />
Ranger Investment Management, L.P., Dallas, TX<br />
Signia Capital Management, LLC, Spokane, WA<br />
Tygh Capital Management, Inc., Portland, OR<br />
RIF Multi-Style Equity Fund<br />
Arnhold and S. Bleichroeder Advisers, LLC, New York, NY<br />
Columbus Circle Investors, Stamford, CT<br />
DePrince, Race & Zollo, Inc., Winter Park, FL<br />
Institutional Capital LLC, Chicago, IL<br />
Jacobs Levy Equity Management, Inc., Florham Park, NJ<br />
Montag & Caldwell, Inc., Atlanta, GA<br />
Suffolk Capital Management, LLC, New York, NY<br />
Turner Investment Partners, Inc., Berwyn, PA<br />
RIC Russell U.S. Quantitative Equity Fund<br />
Aronson+Johnson+Ortiz, LP, Philadelphia, PA<br />
Franklin Portfolio Associates, LLC, Boston, MA<br />
Goldman Sachs Asset Management, L.P., New York, NY<br />
INTECH Investment Management, LLC, West Palm Beach, FL<br />
Jacobs Levy Equity Management, Inc., Florham Park, NJ<br />
RIF Real Estate Securities Fund<br />
AEW Management and Advisors, L.P., Boston, MA<br />
Cohen & Steers Capital Management, Inc., New York, NY<br />
Heitman Real Estate Securities LLC, Chicago, IL<br />
INVESCO Institutional (N.A.), Inc. which acts as a money manager<br />
to the Fund through its INVESCO Real Estate division, Dallas,<br />
TX<br />
RREEF America L.L.C., Chicago, IL<br />
RIC Russell Emerging Markets Fund<br />
AllianceBernstein L.P., New York, NY<br />
Arrowstreet Capital, Limited Partnership, Boston, MA<br />
Genesis Asset Managers, LLP, London, United Kingdom<br />
Harding, Loevner LLC, Somerville, NJ<br />
T. Rowe Price International, Inc., Baltimore, MD<br />
UBS Global Asset Management (Americas) Inc., Chicago, IL<br />
RIC Russell Global Equity Fund<br />
ClariVest Asset Management LLC, San Diego, CA<br />
Gartmore Global Partners, London, United Kingdom<br />
Harris Associates, L.P., Chicago, IL<br />
Tradewinds Global Investors, LLC, Los Angeles, CA<br />
T. Rowe Price International, Inc., Baltimore, MD<br />
RIF Non-U.S. Fund<br />
Altrinsic Global Advisors, LLC, Stamford, CT<br />
AQR Capital Management, LLC, Greenwich, CT<br />
MFS Institutional Advisors, Inc., Boston, MA<br />
Wellington Management Company, LLP, Boston, MA<br />
This report is prepared from the books and records of the Funds and is submitted for the general information of shareholders and is not<br />
authorized for distribution to prospective investors unless accompanied or preceded by an effective Prospectus. Nothing herein contained<br />
is to be considered an offer of sale or a solicitation of an offer to buy shares of Russell Investment Funds. Such offering is made only by<br />
Prospectus, which includes details as to offering price and other material information.<br />
Adviser, Money Managers and Service Providers 59
Russell Investment Funds 909 A Street 800-787-7354<br />
Tacoma, Washington 98402 Fax: 253-591-3495<br />
www.russell.com<br />
Cert no. SCS-COC-0063<br />
36-08-195
Prospectus Supplements
<strong>Northwestern</strong> <strong>Mutual</strong> Series Fund, Inc.<br />
Supplement Dated January 2, 2009 to the<br />
Prospectus Dated April 30, 2008<br />
The following information supplements the Prospectus for the <strong>Northwestern</strong> <strong>Mutual</strong> Series Fund, Inc. (the<br />
“Series Fund”) dated April 30, 2008 (the “Prospectus”), a copy of which you have already received. You<br />
should read this Supplement together with the Prospectus. Please retain this Supplement for future<br />
reference.<br />
Temporary Management Fee Waiver for Money Market Portfolio<br />
In light of current economic and market conditions, Mason Street Advisors, LLC (“Mason Street<br />
Advisors”), investment adviser to the Money Market Portfolio of the Series Fund (the “Portfolio”) has<br />
elected to waive the 30 basis point fee it receives for managing the Portfolio’s assets on a temporary<br />
basis, effective December 31, 2008. This fee waiver, which is voluntary, will be reviewed periodically by<br />
Mason Street Advisors in light of market and economic developments and may be revised or discontinued<br />
at any time.<br />
An investment in the Portfolio is not insured or guaranteed by the Federal Deposit Insurance<br />
Corporation or any other government agency. Although the Portfolio seeks to preserve the value of your<br />
investment at $1.00 per share, it is possible to lose money by investing in the Portfolio.
THE NORTHWESTERN MUTUAL LIFE INSURANCE COMPANY<br />
NML VARIABLE ANNUITY ACCOUNT A<br />
SUPPLEMENT TO THE PROSPECTUSES<br />
FLEXIBLE PAYMENT VARIABLE ANNUITY (DATED APRIL 30, 2008)<br />
INDIVIDUAL FLEXIBLE PAYMENT VARIABLE ANNUITY (FEE-BASED) (DATED APRIL 30, 2008)<br />
________________________________________________________<br />
NML VARIABLE ANNUITY ACCOUNT B<br />
SUPPLEMENT TO THE PROSPECTUSES<br />
FLEXIBLE PAYMENT VARIABLE ANNUITY (DATED APRIL 30, 2008)<br />
FLEXIBLE PAYMENT VARIABLE ANNUITY (FEE-BASED) (DATED APRIL 30, 2008)<br />
________________________________________________________<br />
NML VARIABLE ANNUITY ACCOUNT C<br />
SUPPLEMENT TO THE PROSPECTUSES<br />
GROUP COMBINATION ANNUITY (DATED APRIL 30, 2008)<br />
INDIVIDUAL FLEXIBLE PAYMENT VARIABLE ANNUITY (NETWORK EDITION)<br />
(DATED APRIL 30, 2008)<br />
________________________________________________________<br />
This Supplement revises certain information with regard to the total annual operating expenses of the Money Market<br />
Portfolio contained in the Prospectuses referenced above dated April 30, 2008.<br />
The following replaces the row with regard to the Money Market Portfolio in the table under “<strong>Annual</strong> Portfolio<br />
Operating Expenses”:<br />
Portfolio<br />
Investment<br />
Advisory<br />
Fees<br />
Other<br />
Expenses<br />
12b-1<br />
Fees<br />
Acquired<br />
Fund Fees &<br />
Expenses<br />
Total<br />
Operating<br />
Expenses<br />
Total Net Operating<br />
Expenses (Including<br />
Contractual Waivers,<br />
Limitations and<br />
Reimbursements)<br />
Money Market Portfolio * .......................... 0.30% 0.02% 0.00% 0.00% 0.32% 0.32%<br />
The following footnote is added to the table under “<strong>Annual</strong> Portfolio Operating Expenses”:<br />
*<br />
Money Market Portfolio In light of current economic and market conditions, MSA has elected to waive the 30 basis point fee it<br />
receives for managing the Portfolio’s assets on a temporary basis, effective December 31, 2008. This fee waiver, which is voluntary, will be<br />
reviewed periodically by MSA in light of market and economic developments and may be revised or discontinued at any time. “Other Expenses”<br />
has been updated to reflect fees paid by the Portfolio to participate in the U.S. Department of Treasury's Temporary Guarantee Program for<br />
Money Market Funds. Due to the temporary nature of the Program, this expense has not been annualized.<br />
Please read this Supplement carefully and keep it with your Prospectus for future reference.<br />
This Supplement is dated January 12, 2009.
THE NORTHWESTERN MUTUAL LIFE INSURANCE COMPANY<br />
NML VARIABLE ANNUITY ACCOUNT A<br />
SUPPLEMENT TO THE PROSPECTUSES<br />
FLEXIBLE PAYMENT VARIABLE ANNUITY (DATED APRIL 30, 2008)<br />
________________________________________________________<br />
NML VARIABLE ANNUITY ACCOUNT B<br />
SUPPLEMENT TO THE PROSPECTUSES<br />
FLEXIBLE PAYMENT VARIABLE ANNUITY (DATED APRIL 30, 2008)<br />
________________________________________________________<br />
This Supplement revises certain information with regard to the Reinvestment of Redemptions and Waiver of Withdrawal<br />
Charges sections of the Prospectuses referenced above dated April 30, 2008.<br />
The following underlined language is added to the section titled “Reinvestment of Redemptions”:<br />
Reinvestment of Redemptions In special limited circumstances, we will allow Purchase Payments to be made<br />
without the deduction of a sales load (or with a refund of a withdrawal charge) for those Contract Owners who make a<br />
Purchase Payment in connection with a request to void a redemption made within 60 days (or whatever period that<br />
may be required under applicable state law) of our receipt of the redemption request. Such Purchase Payments and the<br />
amount of any withdrawal charge deducted upon redemption will be reinvested at the accumulation unit value next<br />
determined for each investment option after our receipt of the signed request for reinvestment in good order at our<br />
Home Office. Purchase payments will be applied to the same investment option(s) from which the initial<br />
redemption(s) were made. We will not process a request for reinvestment where redemption proceeds were paid by<br />
check made payable to the Contract Owner and such check was cashed. Similarly, we may refuse to process requests<br />
for reinvestment where it is not administratively feasible. Any redemptions, whether paid by check, wire, or direct<br />
deposit, that – but for the Worker, Retiree, and Employer Recovery Act of 2008 (the “Act”) would have been<br />
considered “required minimum distributions” (“RMDs”) for the 2009 calendar year – may be reinvested, as described<br />
above, without the deduction of a sales load so long as you request such reinvestment within 60 days of the date such<br />
distribution is made. Decisions regarding requests for reinvestment will take into consideration differences in costs<br />
and services and will not be unfairly discriminatory. For further information, contact your financial representative.<br />
The last paragraph of the section titled “Waiver of Withdrawal Charges” is amended with the following underlined language:<br />
As a matter of administrative practice, which we reserve the right to change at any time in our sole discretion, we are<br />
currently waiving withdrawal charges for Required Minimum Distributions (except for withdrawals from GIF8) when<br />
submitted on our Required Minimum Distribution Request form. For Contract Owners or Beneficiaries affected by<br />
section 201 of the Worker, Retiree, and Employer Recovery Act of 2008 (the “Act”), we will waive withdrawal<br />
charges during the 2009 calendar year for withdrawals in an amount that, but for the Act, would have been Required<br />
Minimum Distributions (except for withdrawals from GIF8) using the RMD form described above.<br />
Please read this Supplement carefully and keep it with your Prospectus for future reference.<br />
This Supplement is dated January 12, 2009.
THE NORTHWESTERN MUTUAL LIFE INSURANCE COMPANY<br />
NML VARIABLE ANNUITY ACCOUNT A<br />
SUPPLEMENT TO THE PROSPECTUSES<br />
FLEXIBLE PAYMENT VARIABLE ANNUITY (DATED APRIL 30, 2008)<br />
INDIVIDUAL FLEXIBLE PAYMENT VARIABLE ANNUITY (FEE-BASED) (DATED APRIL 30, 2008)<br />
________________________________________________________<br />
NML VARIABLE ANNUITY ACCOUNT B<br />
SUPPLEMENT TO THE PROSPECTUSES<br />
FLEXIBLE PAYMENT VARIABLE ANNUITY (DATED APRIL 30, 2008)<br />
FLEXIBLE PAYMENT VARIABLE ANNUITY (FEE-BASED) (DATED APRIL 30, 2008)<br />
________________________________________________________<br />
NML VARIABLE ANNUITY ACCOUNT C<br />
SUPPLEMENT TO THE PROSPECTUSES<br />
GROUP COMBINATION ANNUITY (DATED APRIL 30, 2008)<br />
INDIVIDUAL FLEXIBLE PAYMENT VARIABLE ANNUITY (NETWORK EDITION)<br />
(DATED APRIL 30, 2008)<br />
________________________________________________________<br />
This Supplement revises certain information contained in the Prospectuses referenced above dated April 30, 2008<br />
with regard to the Mid Cap Value Portfolio of the <strong>Northwestern</strong> <strong>Mutual</strong> Series Fund, Inc.<br />
Effective February 23, 2009, in the section titled, “The Funds”, under the heading for <strong>Northwestern</strong> <strong>Mutual</strong> Series<br />
Fund, Inc., the disclosure is replaced with the following:<br />
<strong>Northwestern</strong> <strong>Mutual</strong> Series Fund, Inc. The principal investment adviser for the Portfolios of the<br />
<strong>Northwestern</strong> <strong>Mutual</strong> Series Fund is Mason Street Advisors, LLC (“MSA”), our wholly-owned company.<br />
The investment advisory agreements for the respective Portfolios provide that MSA will provide services<br />
and bear certain expenses of the Portfolios. MSA employs a staff of investment professionals to manage the<br />
assets of the Fund and the other advisory clients of MSA. We provide related facilities and personnel,<br />
which MSA uses in performing its investment advisory functions. MSA has retained and oversees<br />
Templeton Investment Counsel, LLC, Capital Guardian Trust Company, T. Rowe Price Associates, Inc.,<br />
Janus Capital Management LLC, American Century Investment Management, Inc., Massachusetts<br />
Financial Services Company, and Pacific Investment Management Company LLC under investment subadvisory<br />
agreements to provide day-to-day management of the Portfolios indicated below. Templeton<br />
Investment Counsel, LLC has appointed Franklin Templeton Investments (Asia) Limited as an additional<br />
sub-adviser for the International Equity Portfolio. Each such sub-adviser may be replaced without the<br />
approval of shareholders. Please see the attached prospectus for the <strong>Northwestern</strong> <strong>Mutual</strong> Series Fund for<br />
more information.<br />
Effective February 23, 2009, in the section titled, “The Funds”, under the heading for <strong>Northwestern</strong> <strong>Mutual</strong> Series<br />
Fund, Inc., the table is amended to contain the following information for the Mid Cap Value Portfolio:<br />
Portfolio Investment Objective Sub-adviser (if applicable)<br />
Mid Cap Value Portfolio Long-term capital growth;<br />
current income is a secondary<br />
objective<br />
American Century Investment<br />
Management, Inc.<br />
Please read this Supplement carefully and keep it with your Prospectus for future reference.<br />
This Supplement is dated February 11, 2009.
<strong>Northwestern</strong> <strong>Mutual</strong> Series Fund, Inc.<br />
Supplement Dated February 11, 2009 to the<br />
Prospectus Dated April 30, 2008<br />
This Supplement revises certain information contained in the Prospectus for the<br />
<strong>Northwestern</strong> <strong>Mutual</strong> Series Fund, Inc. (the “Fund”) dated April 30, 2008, a copy of which you<br />
have already received, as supplemented to date (the “Prospectus”). You should read this<br />
Supplement together with the Prospectus. Please retain this Supplement for future reference.<br />
Mid Cap Value Portfolio<br />
Effective February 23, 2009, American Century Investment Management, Inc.<br />
(“American Century”) will replace AllianceBernstein L.P. as the sub-adviser for the Fund’s Mid<br />
Cap Value Portfolio. American Century will provide investment sub-advisory services for the<br />
Portfolio pursuant to an Investment Sub-Advisory Agreement approved by the Fund’s Board of<br />
Directors on November 4, 2008. In approving the Investment Sub-Advisory Agreement, the<br />
Fund relied on an Exemptive Order issued by the Securities and Exchange Commission that<br />
permits the Fund and its adviser to engage or terminate a sub-adviser at any time without<br />
shareholder approval so long as, among other conditions, shareholders are provided notice of the<br />
change.<br />
As a result of the change in sub-adviser, certain sections of the Prospectus shall be<br />
amended effective February 23, 2009, as follows:<br />
The second, third and fifth paragraphs of the “Objective and Strategy” section of the<br />
Portfolio Summary with respect to the Mid Cap Value Portfolio shall be amended to read as<br />
follows:<br />
“Normally, the Portfolio invests at least 80% of net assets (plus any borrowings<br />
for investment purposes) in equity securities of mid-sized companies. The<br />
Portfolio invests primarily in a diversified portfolio of equity securities of midsized<br />
companies that are determined by Portfolio’s Adviser to be undervalued.<br />
At the time of investment, companies purchased typically will fall within the<br />
capitalization range of the Russell 3000® Index, excluding the largest 100 such<br />
companies ($7.4 million to $18.6 billion as of December 31, 2008). The Adviser<br />
intends to manage the Portfolio so that its weighted capitalization falls within the<br />
capitalization range of the members of the Russell Midcap® Index ($24.1 million<br />
to $14.9 billion as of December 31, 2008).<br />
In managing the Portfolio, the Adviser uses its own fundamental value approach.<br />
In selecting securities for the Portfolio, the Adviser attempts to identify<br />
companies whose long-term earnings, cash flows and/or assets are not reflected<br />
in the current market price of their securities and hold each security until it has<br />
returned to favor in the market and the price has increased to, or is higher than a<br />
level the Adviser believes more accurately reflects the fair value of the company.<br />
The Adviser also may consider whether the companies’ securities have a<br />
favorable income-paying history and whether income payments are expected to<br />
continue or increase.
The Adviser may sell a stock from the Portfolio if it believes the stock no longer<br />
meets established valuation criteria, the stock’s risk parameters outweigh its<br />
return opportunity, specific events alter a stock’s prospects or more attractive<br />
alternatives are identified. In seeking to achieve its investment objective, the<br />
Adviser may sell stocks from the Portfolio without regard to the length of time a<br />
security has been held.”<br />
In addition, the following bullet points are added to the “Principal Risks” section of the<br />
Portfolio Summary with respect to such Portfolio:<br />
<br />
<br />
High Portfolio Turnover Risk<br />
Preferred Stock Risk<br />
Finally, the following text replaces the information set forth under the “Mid Cap Value<br />
Portfolio” paragraph of the “Portfolio Managers” sub-section of the section titled, “THE<br />
INVESTMENT ADVISER AND SUB-ADVISERS:”<br />
“American Century Investments uses teams of portfolio managers and analysts to<br />
manage funds. These teams are organized by broad investment categories. The<br />
individuals listed below are the portfolio managers for the Portfolio. As such,<br />
they are ultimately responsible for the day to day management of the Portfolio,<br />
which includes security selection and portfolio construction, as well as<br />
compliance with stated investment objectives. Other members of the investment<br />
team provide research and analytical support, but generally do not make day-today<br />
investment decisions for the Portfolio.<br />
Phillip N. Davidson, Chief Investment Officer Value Equity, Senior Vice<br />
President and Senior Portfolio Manager, is a member of the team that manages<br />
the Mid Cap Value Portfolio. Prior to joining American Century Investments in<br />
1993 as a portfolio manager, he spent 11 years at Boatman’s Trust Company in<br />
St. Louis and served as vice president and portfolio manager responsible for<br />
institutional value equity clients. He has a bachelor’s degree in finance and an<br />
MBA from Illinois State University. He is a CFA charterholder.<br />
Michael Liss, Vice President and Portfolio Manager, is a member of the team<br />
that manages the Mid Cap Value Portfolio. He joined American Century<br />
Investments in 1998. He became a senior investment analyst in 2003 and then<br />
became a portfolio manager in 2004. He has a bachelor’s degree in accounting<br />
and finance from Albright College and an MBA in finance from Indiana<br />
University. He is a CFA charterholder.<br />
Kevin Toney, Vice President and Portfolio Manager, is a member of the team<br />
that manages the Mid Cap Value Portfolio. He joined American Century<br />
Investments in 1999 as an investment analyst and became a portfolio manager in<br />
2006. He has a bachelor’s degree from the University of Virginia and an MBA<br />
from The Wharton School at the University of Pennsylvania. He is a CFA<br />
charterholder.”
Small Cap Value Portfolio<br />
Effective January 31, 2009, the last sentence of second paragraph of the “Objective and<br />
Strategy” section for the Portfolio Summary with respect to the Small Cap Value Portfolio is<br />
amended by deleting the phrase, “up to 15% of net assets in stocks of mid-sized companies,<br />
and,” so that the amended sentence shall read as follows:<br />
“The Portfolio may also invest in equity securities of micro cap companies<br />
(defined as companies with stock market capitalizations less than $500 million at<br />
the time of investment).”<br />
As a result of the amendment, the portfolio managers responsible for the Portfolio’s<br />
selection of stocks of mid-sized companies will no longer serve as portfolio managers for the<br />
Small Cap Value Portfolio. Accordingly, the Prospectus is hereby amended by replacing the<br />
information currently set forth under the “Small Cap Value Portfolio” paragraph of the “Portfolio<br />
Managers” sub-section of the section titled, “THE INVESTMENT ADVISER AND SUB-<br />
ADVISERS” in its entirety, with the following information:<br />
“The Small Cap Value Portfolio is managed by an investment advisory<br />
committee. Preston G. Athey, as committee chairman, has day-to-day<br />
responsibility for managing the Portfolio and works with the committee in<br />
developing and executing its investment program. Mr. Athey, a Vice President of<br />
T. Rowe Price, has been chairman of the Portfolio’s committee since 2001, joined<br />
T. Rowe Price in 1978 and has been managing investments since 1982.”<br />
Inflation Protection Portfolio<br />
Effective November 9, 2008, Seth Plunkett is no longer a portfolio manager for the<br />
Inflation Protection Portfolio.<br />
Extension of Treasury’s Temporary Guarantee Program for Money Market Funds<br />
The U.S Department of the Treasury (“Treasury”) has extended the Temporary Guarantee<br />
Program for Money Market Funds (“Program”) through April 30, 2009. The Money Market<br />
Portfolio is participating in the Program for this extension period and has paid a fee of 0.022% of<br />
its net assets as of September 19, 2008 in order to participate for the period from December 19,<br />
2008 through April 30, 2009. The terms and conditions of the Program and qualifications for<br />
participation and insurance coverage under the Program remain the same as for the initial period.<br />
The term of the Program may be further extended by the Secretary of the Treasury<br />
through September 19, 2009. If the Program is extended for an additional period, the Money<br />
Market Portfolio would have to renew its participation and pay any additional fees required to<br />
maintain coverage. The duration and terms of any such extension have not been determined, and<br />
there is no guarantee that the Program will be extended beyond April 30, 2009 or that the Money<br />
Market Portfolio will elect or be eligible to participate in the Program extension.<br />
Neither this Supplement nor the Money Market Portfolio itself is in any manner<br />
approved, endorsed, sponsored or authorized by the U.S. Department of the Treasury.
Amendments to Investment Sub-Advisory Agreements with T. Rowe Price Associates, Inc.<br />
Effective November 4, 2008, the Board of Directors of the Fund approved an Amended<br />
and Restated Investment Sub-Advisory Agreement between Mason Street Advisors, LLC<br />
(“Mason Street Advisors”) and T. Rowe Price Associates, Inc. (“T. Rowe Price”) with respect to<br />
the Small Cap Value Portfolio and the Equity Income Portfolio (the “Amended Agreement”). In<br />
approving the Amended Agreement, the Fund relied on an Exemptive Order issued by the<br />
Securities and Exchange Commission that permits the Fund and Mason Street Advisors to amend<br />
investment sub-advisory agreements without shareholder approval so long as, among other<br />
conditions, shareholders are provided notice of the amendment.<br />
The Amended Agreement, which conformed the existing agreements with T. Rowe Price<br />
to Mason Street Advisors’ current form of Investment Sub-Advisory Agreement, place<br />
heightened obligations on T. Rowe Price with respect to reporting amendments to, and violations<br />
of, codes of ethics and other procedures, as well as violations of law. The Amended Agreement<br />
also includes an obligation to cooperate with the Fund’s and Mason Street Advisors’ chief<br />
compliance officers in connection with compliance matters. Finally, the Amended Agreement<br />
provides additional clarity regarding T. Rowe Price’s responsibility in connection with the<br />
performance of various operational matters. The Amended Agreement did not include any<br />
changes to fees.
<strong>Northwestern</strong> <strong>Mutual</strong> Series Fund, Inc.<br />
Supplement Dated February 11, 2009 to the<br />
Prospectus Dated April 30, 2008<br />
The following information supplements the Prospectus for the <strong>Northwestern</strong> <strong>Mutual</strong> Series<br />
Fund, Inc. (the “Series Fund”) dated April 30, 2008 (the “Prospectus”), a copy of which you have already<br />
received. You should read this Supplement together with the Prospectus. Please retain this Supplement<br />
for future reference.<br />
Portfolio Manager Changes<br />
Large Cap Blend Portfolio<br />
Effective February 28, 2009, James S. Kang will no longer serve as a portfolio manager for the<br />
Large Cap Blend Portfolio.<br />
Domestic Equity Portfolio<br />
Effective February 28, 2009, Gene D. Barron will be replaced by Darcy Kopcho on the portfolio<br />
management team for the Domestic Equity Portfolio. The Prospectus is hereby amended to delete the<br />
biography for Gene D. Barron currently set forth under the “Domestic Equity Portfolio” paragraph of the<br />
“Portfolio Managers” sub-section of the section titled, “THE INVESTMENT ADVISER AND SUB-<br />
ADVISERS,” and to add the following biography for Ms. Kopcho:<br />
“Darcy Kopcho, Senior Vice President, CGTC, has been employed by CGTC or an<br />
affiliate for 23 years and has served as a portfolio manager selecting equity securities<br />
during the past five years. Ms. Kopcho holds an MBA from the Graduate School of<br />
Management at the University of California and a BA in Religious Studies from the<br />
University of California.”
PO BOX 3095<br />
Milwaukee WI 53201-3095<br />
PRSRT BPM<br />
US POSTAGE<br />
PAID<br />
NORTHWESTERN<br />
MUTUAL<br />
This booklet contains information about the <strong>Northwestern</strong> <strong>Mutual</strong> variable insurance product and the<br />
mutual funds identified on the front cover. The mutual funds correspond with the investment divisions<br />
available under the variable insurance product (“Product”). The information is prepared for Product<br />
owners and does not represent an offer of the Product, nor should it be used in connection with any<br />
offer, except when accompanied or preceded by the current Product prospectus or offering circular<br />
and the mutual fund prospectuses, which contain detailed information about mutual fund investment<br />
objectives and operations, and applicable fees, expenses and sales charges. Prospectuses or offering<br />
circulars may be obtained by calling the telephone number or visiting the website address listed below.<br />
You should read and carefully consider this information before you invest or send money.<br />
The mutual fund reports are prepared from the books and records of the funds. Discussions of<br />
investment performance in the reports represent the views of the funds’ portfolio managers as of the<br />
dates of the reports. They are not guarantees of investment results, nor should they be relied upon as<br />
investment advice or indications of current or future trading strategies of the portfolio managers.<br />
Portfolio manager views and security holdings are subject to change at any time.<br />
The <strong>Northwestern</strong> <strong>Mutual</strong> Life Insurance Company (<strong>Northwestern</strong> <strong>Mutual</strong>), 1-888-455-2232,<br />
www.northwesternmutual.com<br />
Product Distributor: <strong>Northwestern</strong> <strong>Mutual</strong> Investment Services, LLC (NMIS), Suite 600,<br />
611 East Wisconsin Avenue, Milwaukee, WI 53202-4797, 1-866-664-7737, member FINRA and SIPC.<br />
The <strong>Northwestern</strong> <strong>Mutual</strong><br />
Life Insurance Company • Milwaukee, WI<br />
www.northwesternmutual.com<br />
14-1558 (0107) (REV 0109)