June 27, 2013 - Public Employees Retirement Association of New ...
June 27, 2013 - Public Employees Retirement Association of New ...
June 27, 2013 - Public Employees Retirement Association of New ...

Create successful ePaper yourself
Turn your PDF publications into a flip-book with our unique Google optimized e-Paper software.
1. Pledge <strong>of</strong> Allegiance<br />
2. Roll Call<br />
3. Approval <strong>of</strong> Agenda<br />
4. Approval <strong>of</strong> Consent Agenda<br />
5. Current Business<br />
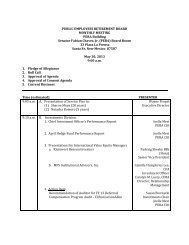
PUBLIC EMPLOYEES RETIREMENT ASSOCIATION BOARD<br />
MONTHLY MEETING<br />
PERA Building<br />
Senator Fabian Chavez, Jr. (PERA) Board Room<br />
33 Plaza La Prensa<br />
Santa Fe, <strong>New</strong> Mexico 87507<br />
<strong>June</strong> <strong>27</strong>, <strong>2013</strong><br />
1:30 p.m.<br />
Time (estimated)<br />
1:35 p.m. A. Presentation <strong>of</strong> Service Pins to:<br />
(1) Angel Lujan (10 years)<br />
(2) Brenda Cordova (15 years)<br />
1:40 p.m. B. Investments Division.<br />
1. Chief Investment Officer’s Performance Report<br />
2. May Hedge Fund Performance Report<br />
3. Presentations by Active Domestic Small Cap Managers<br />
a. TimesSquare Capital Management, LLC<br />
b. RBC Global Asset Management (U.S.)<br />
4. Action Item:<br />
Alternative Asset Recommendations to be Funded<br />
According to the Cash Plan and Subject to Review by<br />
General Counsel.<br />
PRESENTER<br />
Wayne Propst<br />
Executive Director<br />
Joelle Mevi<br />
PERA CIO<br />
Jason Goeller<br />
PERA Portfolio Manager<br />
Jeffrey Braemer<br />
Senior Vice President<br />
Product Manager<br />
Growth Equity Group<br />
Kenneth A. Tyszko, CPA,<br />
CFA, Managing Director<br />
Senior Portfolio<br />
Manager<br />
Bridget Tompkins<br />
Managing Director,<br />
Client Services Manager<br />
Susan Biernacki<br />
Investments Chair<br />
Joelle Mevi<br />
PERA CIO
a. £26 Million Commitment to DRC Capital European<br />
Real Estate Debt Fund II, LP, a European<br />
Commercial Real Estate Fund for the Real Estate<br />
Portfolio<br />
b. $35 Million Commitment to Lime Rock Resources<br />
Fund III, LP, an Energy Fund for the Real Asset<br />
Portfolio<br />
3:00 p.m. C. Approval <strong>of</strong> Resolution No. 13-06 Declaring a Vacancy<br />
on the <strong>Public</strong> <strong>Employees</strong> <strong>Retirement</strong> <strong>Association</strong> Board<br />
Joaquin Lujan<br />
PERA Portfolio Manager<br />
Julian Baca<br />
Deputy CIO<br />
Patricia French<br />
Board Chair<br />
3:10 p.m. D. SB <strong>27</strong> Implementation – Legislative Changes Greg Portillos<br />
PERA CIO<br />
Vince Jaramillo<br />
User Administrator<br />
3:30 p.m. E. Trustee Report on Conference Loretta Naranjo-Lopez<br />
3:45 p.m. F. Executive Director’s Report Wayne Propst<br />
Executive Director<br />
4:00 p.m. G. Executive Session<br />
a. Attorney Reports<br />
Administrative Appeals (The Board will go into<br />
Executive Session under NMSA 1978, Section<br />
10-15-1(H)(3) to discuss this item)<br />
a. Bernard Raymond<br />
b. Andres S. Vargas<br />
Zachary Shandler<br />
Assistant Attorney<br />
General<br />
and/or<br />
Mark Reynolds<br />
Assistant Attorney<br />
General<br />
6. Other Business<br />
7. Adjournment<br />
Any person with a disability who is in need <strong>of</strong> a reader, amplifier, qualified sign language<br />
interpreter, or any other form <strong>of</strong> auxiliary aid or service to attend or participate in the<br />
hearing or meeting, please contact Judy Olson at (505) 476-9305 at least one week prior to<br />
the meeting, or as soon as possible. <strong>Public</strong> documents, including the agenda and minutes,<br />
can be provided in various accessible formats. Please contact Ms. Olson if a summary or<br />
other type <strong>of</strong> accessible format is needed.
PUBLIC EMPLOYEES RETIREMENT ASSOCIATION<br />
MONTHLY MEETING<br />
<strong>June</strong> <strong>27</strong>, <strong>2013</strong><br />
CONSENT AGENDA<br />
1. Approval <strong>of</strong> Minutes: May 14, <strong>2013</strong> Special Board Meeting<br />
May 30, <strong>2013</strong> Board Meeting<br />
2. Ratification <strong>of</strong> <strong>Retirement</strong>s – Benefits processed through <strong>June</strong> 21, <strong>2013</strong>.<br />
a. Normal d. Non-Duty Death<br />
b. Deferred e. Non-Duty Disability<br />
c. Reciprocity to ERA f. Reciprocity to PERA<br />
3. Affidavits for Free Military Service:<br />
a. Christopher Baca, 10 months <strong>of</strong> Free Military Service<br />
b. John Zamora, 10 months <strong>of</strong> Free Military Service<br />
c. Damien Horne, 10 months <strong>of</strong> Free Military Service<br />
4. Duty and Non-Duty Death Determinations:<br />
a. Kenneth Griego, Non-duty death<br />
b. Vincent Sanchez, Non-duty death<br />
c. Rudolfo Rivera, Non-duty death<br />
d. Michael Baca, Non-duty death<br />
e. Kenneth Baca, Non-duty death<br />
5. Resolutions:<br />
1. A Resolution Authorizing a 24.39% Pick-Up <strong>of</strong> PERA Municipal Police<br />
Member Contributions for Police Non-Bargaining Unit Members Only, for<br />
the City <strong>of</strong> Hobbs.<br />
2. Carrizozo Soil and Water conservation District, Resolution No. 05-2012-<br />
<strong>2013</strong>. A Resolution to Adopt the State <strong>of</strong> <strong>New</strong> Mexico Deferred<br />
Compensation Plan.<br />
3. Southwest Solid Waste Authority, Resolution No. R-13-10. A Resolution<br />
to Adopt the State <strong>of</strong> <strong>New</strong> Mexico Deferred Compensation Plan.<br />
4. Albuquerque Bernalillo County Water Utility Authority, Resolution No.<br />
R-13-10. A Resolution to Adopt the State <strong>of</strong> <strong>New</strong> Mexico Deferred<br />
Compensation Plan.<br />
5. Albuquerque Bernalillo County Water Utility Authority Resolution<br />
Establishing Water Authority Policy Concerning the PERA <strong>Employees</strong>’<br />
Contribution Rate (Bill No. F/S R 13-12) approved <strong>June</strong> 19, <strong>2013</strong>.
Setting <strong>of</strong> Meetings – July, <strong>2013</strong><br />
a. Special Board Meeting 7/9/<strong>2013</strong> 9:00 a.m.<br />
b. Investments Committee 7/9/<strong>2013</strong> After Special Board Meeting<br />
c. Legislative Committee 7/9/<strong>2013</strong> After Investments Committee<br />
d. Audit & Budget Committee 7/9/<strong>2013</strong> After Legislative Committee<br />
e. Rules & Administration<br />
Committee<br />
7/9/<strong>2013</strong> After Audit & Budget Committee<br />
f. Disability Review Committee 7/9/<strong>2013</strong> 2:00 p.m. PERA Board Room<br />
g. PERA Board – <strong>New</strong> Board<br />
Member Orientation<br />
7/29/<strong>2013</strong> 1:00 p.m.<br />
Red River Conference Center<br />
101 West River Street<br />
Red River, <strong>New</strong> Mexico 87558<br />
h. PERA Board Retreat 7/30/<strong>2013</strong> 8:30 a.m. Red River Conference Center<br />
i. PERA Board Retreat 7/31/<strong>2013</strong> 8:30 a.m. Red River Conference Center<br />
j. Monthly Board Meeting 8/1/<strong>2013</strong> 9:00 a.m. Red River Conference Center
PERA Executive Investment Summary<br />
May <strong>2013</strong><br />
Market Review:<br />
After touching an all-time high in the middle <strong>of</strong> the month, comments by Federal Reserve chairman<br />
Bernanke that alluded to the eventual wind-down <strong>of</strong> the current quantitative easing unnerved<br />
investors, causing equity markets to decline and interest rates to rise. Despite the sell-<strong>of</strong>f, the US<br />
equity markets managed to finish higher than the previous month’s close with the S&P 500 up<br />
2.34% (15.37% CYTD and 22.24% FYTD). The EAFE index reversed the previous month’s gains by<br />
declining -2.31% (8.29% CYTD and 23.5% FYTD) while the EMF index declined -2.52% (-3.29% CYTD<br />
and 10.19% FYTD). The Barclays core bond index fell -1.78% (-0.91% CYTD and 0.89% FYTD) while<br />
High Yield bonds returned -0.58% (4.15% CYTD and 12.45% FYTD).<br />
US data releases during the month showed that consumer spending fell 0.2% m/m, retail sales<br />
climbed 0.1% (core was up 0.5%), consumer confidence rose to 76.2 in May from 68.1 in April, while<br />
the ISM manufacturing index declined to 50.7 from 51.3 and the ISM nonmanufacturing index fell to<br />
53.1 from 54.4. Nonfarm payrolls increased 165,000 while Gross Domestic Product grew by 2.4% in<br />
the first quarter. At its May meeting, the Federal Open Market Committee left the Fed funds rate<br />
unchanged at a range <strong>of</strong> 0 to 0.25%. It also maintained its program <strong>of</strong> buying $40 billion <strong>of</strong><br />
mortgage-backed securities and $45 billion <strong>of</strong> Treasury securities each month. In the<br />
accompanying statement the FOMC said that it “is prepared to increase or reduce the pace <strong>of</strong> its<br />
[securities] purchases to maintain appropriate policy accommodation as the outlook for the labor<br />
market or inflation changes.” There were also modest changes to the economic summary<br />
paragraph – labor market conditions have shown signs <strong>of</strong> improvement “on balance,” while fiscal<br />
policy “is restraining growth” (rather than “has become somewhat more restrictive”).<br />
Outside the US, the Euro area GDP contracted 0.2% in the first quarter, Japan’s GDP rose 3.5%, the<br />
Bank <strong>of</strong> England made no changes to its existing asset purchase program (375 billion) or <strong>of</strong>ficial<br />
interest rate (0.5%), and the Reserve Bank <strong>of</strong> Australia cut the cash rate 25 basis points to 2.75%.<br />
The PERA Fund has returned 15.76% for the FYTD and 0.02% in the month <strong>of</strong> May, bringing the Fund<br />
market value to $13.268 billion.<br />
Pension Systems Update:<br />
Fed data show public DB plans rise, corporate DC disappoints<br />
According to the Federal Reserve's Financial Accounts <strong>of</strong> the United States report issued <strong>June</strong> 6,<br />
defined benefit state and local government public pension assets rose 6.81% in the quarter ending<br />
March 31, <strong>2013</strong> to $3.41 trillion. U.S. corporate retirement plan assets rose just 2.78% in the<br />
quarter, to $6.82 trillion; corporate defined benefit plan assets totaled $2.57 trillion, up 0.73%<br />
from the previous quarter, and defined contribution plans had $4.26 trillion in assets, an increase<br />
<strong>of</strong> 4.06%. The real story, according to plan experts, was the level <strong>of</strong> net asset flows. A modest $4.4<br />
billion in net asset inflows for defined contribution plans was a surprise in light <strong>of</strong> strong market<br />
returns. Comparing the 4.06% increase in defined contribution assets to a typical return <strong>of</strong> 5%<br />
based on a composite portfolio tracked by J.P. Morgan Asset Management (JPM), “it appears that<br />
they underperformed the market,” said Mr. Barron. “If that is a trend, it would be disappointing. If<br />
defined contribution is going to replace defined benefit, this pattern has to be continuously on the<br />
upswing.” On the public plan side, the latest Federal Reserve data “show that state and local<br />
government retirement fund assets have rebounded since the financial crisis,” said Paul Zorn,<br />
director <strong>of</strong> governmental research for actuarial firm Gabriel, Roeder, Smith & Co., Southfield,<br />
Mich.<br />
~Read more http://www.pionline.com/.<br />
Quote for the Month:<br />
“ Bernanke may be driving in a fog…”<br />
~Bill Gross, the “Bond King <strong>of</strong> PIMCO,” at a <strong>June</strong> 19 th Bloomberg press conference<br />
following the release <strong>of</strong> the FOMC meeting minutes. 1
PERA Executive Investment Summary<br />
May <strong>2013</strong><br />
Market Values, Asset Allocation & Performance Data:<br />
TABLE I: Fund Market Values (in millions $)<br />
Asset Class 5/31/<strong>2013</strong> Prev. Month's Chg<br />
Total Equities 7,297 -8.01<br />
Domestic Equity 4,015 64.62<br />
Large Cap 2,732 6.26<br />
Small/Mid Cap 1,283 58.36<br />
International Equity 3,282 -72.63<br />
Total Fixed Income 3,363 -2.41<br />
Total Alternatives 2,441 3.33<br />
Absolute Return 1,133 8.91<br />
Private Equity 539 8.70<br />
Real Estate 428 -11.07<br />
Real Assets 341 -3.21<br />
STIF/STO Cash Balances 167 18.91<br />
TOTAL FUNDS 13,268 11.82<br />
TABLE II: Fund Asset Allocation Comparison<br />
Asset Class Actual Target Variance Ranges $ in Millions<br />
Total Equities 55.0% 49% 6.0% - 795.6<br />
Domestic Equity 30.3% 29% 1.3% 24-34% 166.9<br />
Large Cap 20.6% 20% 0.3% - 38.1<br />
Small/Mid Cap 9.7% 9% 1.0% - 128.8<br />
International Equity 24.7% 20% 4.7% 15-25% 628.7<br />
Total Fixed Income 25.3% 26% -0.7% 23-29% -86.7<br />
Liquid Alpha 0.0% 5% -5.0% 0-7% -<br />
Total Alternatives 18.4% 20% -1.6% - -212.5<br />
Absolute Return 8.5% 7% 1.5% 5-9% 204.0<br />
Private Equity 4.1% 5% -0.9% 3-7% -124.0<br />
Real Estate 3.2% 3% 0.2% 1-5% 30.1<br />
Real Assets 2.6% 5% -2.4% 3-7% -322.5<br />
STIF/STO Cash Balances 1.3% 0% 1.3% - 167.0<br />
TABLE III: PERA Performance for Month and Fiscal Year to Date (in percent %)<br />
5/31/<strong>2013</strong> Fiscal YTD 1 Year 3 Year<br />
Total Domestic Equity 3.28% 26.47% 31.18% 18.25%<br />
Russell 3000 Index 2.36% 23.06% <strong>27</strong>.88% 16.82%<br />
Value Added 0.92% 3.41% 3.31% 1.43%<br />
International Equity -2.16% 19.86% 26.15% 10.16%<br />
MSCI ACWI ex-US Index -2.18% 19.71% 26.83% 9.75%<br />
Value Added 0.02% 0.15% -0.68% 0.41%<br />
Fixed Income -2.12% 5.47% 6.52% 6.91%<br />
85/15 Barclays Index -1.95% 0.47% 0.51% 4.45%<br />
Value Added -0.17% 5.00% 6.01% 2.46%<br />
Alternative Assets 0.78% 10.42% 11.17% 9.46%<br />
Cash Equivalents 0.23% 3.29% 3.92% 5.88%<br />
TOTAL FUND 0.02% 15.76% 18.92% 11.46%<br />
Custom Benchmark -0.13% 13.29% 16.62% 10.53%<br />
Value Added 0.15% 2.47% 2.30% 0.93%<br />
2
PERA Executive Investment Summary<br />
May <strong>2013</strong><br />
Market Values, Asset Allocation & Performance:<br />
Market Value & Asset Allocation:<br />
The US equity markets were higher in May with the Total Fund market value up $12 million over<br />
the previous month to $13,268,240,000. The Board ratified a new strategic asset allocation in<br />
November by approving revisions to its IPS, which increased the target US equity allocation by 2%<br />
to 29%, reduced the Non-US equity allocation by 7% to 20%, added the 5% Liquid Alpha bucket,<br />
reduced hedge funds by 2% to 7%, and increased the Real Assets target by 2% to 5%. Based on<br />
current market values and the new strategic asset allocation targets, the non-US allocation is<br />
overweight by 4.7%, but still within the allowable range, pending the GTAA implementation. Along<br />
the same lines, the Absolute Return portfolio is overweight and the Real Assets portfolio is<br />
underweight pending an AR portfolio rebalance and the expansion <strong>of</strong> the RA portfolio.<br />
Asset Transfers:<br />
PERA transferred $30 million at month-end from the STIF account to supplement beneficiary<br />
payments and to pay refunds and agency expenses, including investment manager fees. For the<br />
fiscal-year-to-date, PERA has transferred $368 million to the PERA General account, $16.5 million<br />
to the Magistrate account, and $3 million to the Judicial fund to cover potential shortfalls in<br />
employer and employee contributions. PERA has made no transfers to the Volunteer Fire Fighter<br />
account for the fiscal-year-to-date. Excess cash <strong>of</strong> $70 million in the beta overlay account was<br />
rebalanced to core bond managers MacKay Shields and BlackRock. Hedge fund redemptions<br />
totaling $9.5 million were received in the month.<br />
Private partnerships called $10 million in the month <strong>of</strong> May, distributing $19.8 million. In the<br />
current fiscal year, capital calls have averaged $19 million per month and have totaled $210<br />
million. In fiscal year 2012 capital calls averaged $22.5 million per month and totaled $<strong>27</strong>0 million.<br />
Fund Returns & Performance:<br />
The Total Fund returned 0.02% for the month with active management in the domestic equity<br />
composite added value on both an absolute as well as a relative basis across most public market<br />
mandates. Hedge funds also generated a positive return on an absolute basis. Over the trailing<br />
one-year and three-year periods, the Fund has returned 18.92% (1YR) and 11.46% (3YR) compared<br />
to the Custom Index return <strong>of</strong> 16.62% (1YR) and 10.53% (3YR).<br />
The PERA Fund ranked 29 th for the quarter and 21 st for the year ending March 31, <strong>2013</strong> in the<br />
Wilshire TUCS universe <strong>of</strong> public funds > $1 billion.<br />
Watch List Update:<br />
None <strong>of</strong> PERA’s active domestic equity and fixed income managers are on the Watch List. The<br />
Wellington Emerging Markets Equity mandate is on Watch at present. The Investment Committee<br />
voted to terminate SSgA International Alpha Select at the August 2012 meeting. This account was<br />
held since late September with an interim manager and transitioned in early April to the Northern<br />
Trust passive ACWI ex-US account. The Board approved a recommendation to add Schroder<br />
International Equity Small Cap mandate to the watch list at the April meeting. Four <strong>of</strong> PERA’s<br />
alternative investments are on Cliffwater’s Watch List.<br />
3
PERA Executive Investment Summary<br />
May <strong>2013</strong><br />
Portfolio Manager Views:<br />
<strong>Public</strong> Equity:<br />
In May, small cap stocks outperformed large cap with the S&P 500 posting 2.34% and the Russell<br />
2000 Index posting 4.00%. The U.S. equity markets continued positively due to better than<br />
expected U.S. employment data and corporate earnings. May was the 7 th consecutive monthly rise<br />
in the S&P 500. NMPERA’s small cap value managers, DFA and MetWest both exceeded their<br />
benchmark in excess <strong>of</strong> 150 basis points, both managers underweighted REITS and utilities which<br />
helped since both sectors did poorly for the month. International equity saw a negative return for<br />
the month; the NMPERA managers had mixed results although the international small cap managers<br />
held up the best. Small and Smid Cap growth managers, RBC and TimesSquare, whose contracts<br />
were recently renewed, fared well for the month. For the 5 year return, both managers have<br />
exceeded their benchmarks by at least 350 basis points.<br />
~ LeAnne Larrañaga-Ruffy<br />
Fixed Income:<br />
In May, the fixed income markets were negative with the Barclays U.S. Aggregate bond index<br />
posting -1.78%. The Fed announced possible reduction <strong>of</strong> the quantitative easing stimulus which<br />
caused the Fixed Income markets to slide, with Treasuries being hit the hardest and riskier assets<br />
such as high yield and emerging markets also being impacted negatively. All <strong>of</strong> NMPERA’s managers<br />
struggled for the month, posting negative returns with only the global managers beating their<br />
respective benchmarks. Manulife, which was slow out <strong>of</strong> the gate after being hired in 2011, has<br />
exceeded their benchmark by 850 basis points for the one year return. In May they had an excess<br />
return <strong>of</strong> 101 basis points, due to their underweight exposure to U.S. Treasuries and a shorter<br />
duration. In addition their use <strong>of</strong> the British pound and Canadian dollar hedges, emerging market<br />
positions within Asia benefitted performance.<br />
~ LeAnne Larrañaga-Ruffy<br />
Real Assets:<br />
PERA’s Real Assets private partnerships called $1.7 million during the month <strong>of</strong> May. Distributions<br />
<strong>of</strong> $5.3 million were received during the month. Year to date the portfolio <strong>of</strong> sixteen partnerships<br />
drawn $243 million on $417 million in commitments. Cumulative distributions total $77.6 million,<br />
with an (unrealized) fair value <strong>of</strong> $208 million, resulting in an Internal Rate <strong>of</strong> Return <strong>of</strong> 10.43%, or<br />
1.22x cost since the inception <strong>of</strong> the program. Various areas <strong>of</strong> real assets provided modest results<br />
for the month <strong>of</strong> May. Crude oil, gold and natural gas in particular, provided divergent returns. WTI<br />
Brent spread increased to an eight month high given the increased geo-political volatility in the<br />
Middle East leaning towards possible reduced exports. Agriculture commodities were mixed with a<br />
couple <strong>of</strong> leaders: c<strong>of</strong>fee, wheat and soybeans.<br />
~ Christina Keyes<br />
Private Equity:<br />
As <strong>of</strong> May 31, <strong>2013</strong> the Private Equity portfolio is 65% drawn ($628 million) on $887 million<br />
committed. Residual fair value ($543 million) plus cumulative distributions ($224 million) make for<br />
a total fair value <strong>of</strong> $768 million, or 1.22 times cost, and a net since inception IRR <strong>of</strong> +8.26%.<br />
PERA’s $40mm <strong>2013</strong> commitment to Carlyle VI buyout fund is in the last stages <strong>of</strong> closing. This is<br />
PERA’s first <strong>of</strong> four private equity commitments slated for <strong>2013</strong>.<br />
~Joaquin Lujan<br />
4
PERA Executive Investment Summary<br />
May <strong>2013</strong><br />
Portfolio Manager Views, cont.:<br />
Hedge Funds:<br />
With the exception <strong>of</strong> a narrow (but volatile) decline in the Nikkei, May was a modestly good month<br />
for most developed market equities. The US S&P 500 led the way with a gain <strong>of</strong> +2.3% on<br />
improving US economic data and upbeat consumer confidence sentiment. Contributions came from<br />
all market capitalizations with sector strength from Technology, Financials and Healthcare. The<br />
real action for the month, however, came from fixed income. Trading in a huge range, the US 10<br />
year Treasury started May at a yield <strong>of</strong> 1.67% before rising to over 2.2% on May 29 th and then falling<br />
to 2.13% to finish the month, its worst since December 2009. It wasn’t only the US that suffered<br />
losses, as fixed income markets worldwide experienced large sell-<strong>of</strong>fs, with participants fearing<br />
that the Federal Reserve would exit its quantitative easing programs sooner than previously<br />
anticipated. May was one <strong>of</strong> the worst months for global government bonds in the past two<br />
decades. May was also a difficult month for commodities, with the DJ UBS Commodities Index<br />
losing -2.2% for the month – primarily on large declines in precious metals.<br />
Despite the volatility in the broader markets during the month, hedge funds continued along their<br />
positive trajectory in May. The HFRI Fund Weighted Composite Index advanced +0.54%, with solid<br />
gains from equity-focused funds. The HFRI Equity Hedge Index returned +1.78%, outperforming<br />
global equity markets. Additional contributions came from Event Driven strategies, with positive<br />
performance coming from the continuation <strong>of</strong> a dynamic market for corporate transactions. The<br />
HFRI Event Driven Index posted a gain <strong>of</strong> +1.7%. Global macro managers as a whole were the worst<br />
performers during the month, with particular weakness in quantitative trend-following CTAs and<br />
Commodity-focused strategies. CTAs with significant long exposure to fixed income were<br />
especially hard hit as government bonds sold <strong>of</strong>f sharply. The HFRI Systematic Diversified Index<br />
was down -2.22%.<br />
NM PERA’s Absolute Return portfolio fared relatively well, returning +1.32% (based on initial<br />
estimates) and outperforming both PERA’s benchmark <strong>of</strong> Libor + 4% and the broader HFRI indices by<br />
a fair margin. Consistent with the broader performance trend for May, PERA managers with<br />
significant equity exposure and dedicated Event Driven books performed strongly while the<br />
systematic trading strategies (CTAs) underperformed. PERA’s dedicated Market Neutral managers<br />
also posted notable positive returns.<br />
~ Jason Goeller<br />
Real Estate:<br />
As <strong>of</strong> May 31, <strong>2013</strong> the Real Estate portfolio excluding REITs is 58% drawn ($245 million) on $350<br />
million committed. Residual fair value ($192 million) plus cumulative distributions ($91 million)<br />
make for a total fair value <strong>of</strong> $283 million, or 1.17 times cost, and a net since inception IRR <strong>of</strong><br />
+7.82%. The PERA IC committee has forwarded to the Board a recommendation to commit $40<br />
million to ERED II, a European commercial real estate fund. This will be first <strong>of</strong> two real estate<br />
commitments slated for <strong>2013</strong>.<br />
~Joaquin Lujan<br />
5
PERA Executive Investment Summary<br />
May <strong>2013</strong><br />
Monthly Outlook: ‘Terra Incognita’<br />
Over the course <strong>of</strong> the perilous climb out <strong>of</strong> the depths <strong>of</strong> the dark recession to the economic recovery<br />
during the last few years, the U.S. Federal Reserve’s fiscal policies and practices <strong>of</strong> quantitative easing<br />
(QE) have taken various twists and turns leading to a grey area <strong>of</strong> terra incognita (Latin: ‘uncharted<br />
territory’). The Fed has worked tirelessly since 2009 to provide unprecedented interest rate<br />
accommodations bringing the rates to negative real levels and creating extensive liquidity injections to<br />
stimulate the American economy. They have committed to battling deflation and held fast against<br />
economic slippage by purchasing billions <strong>of</strong> dollars <strong>of</strong> debt and risky mortgage assets through a buy-back<br />
program. Currently, the Fed is buying $85 billion <strong>of</strong> Treasuries and mortgage-back securities each month<br />
in order to put downward pressure on borrowing costs and to help spur economic growth. The average<br />
economic recovery expansion <strong>of</strong> a post-war period typically lasts 63-65 months. The U.S. is currently in<br />
the 47 th month <strong>of</strong> the current economic recovery, assisted by the bond purchasing program; the bond<br />
purchasing program that was never intended to be permanent, but as an emergency measure. Gauging<br />
the full impact <strong>of</strong> Quantitative Easing (QE) measures has required a steel reserve <strong>of</strong> calm and patience.<br />
In an attempt to foster a longer-term view for the remainder <strong>of</strong> the recovery and finding new techniques<br />
to keep inflation low while paring back on aggressive monetary stimulation, the Fed has taken on the<br />
discussion <strong>of</strong> tapering at their monthly bond purchases. Chairman Ben Bernanke told Congress’s Joint<br />
Economic Committee on May 22 nd that the Fed ‘could scale back stimulus efforts in the next few<br />
meetings’ if the employment outlook shows ‘sustainable’ improvement. He emphasized that any decision<br />
would hinge upon the economic data and that the Fed is prepared to stop tapering or even reverse it, if<br />
economic growth does not meet expectations.<br />
On <strong>June</strong> 18 th & 19 th , the Federal Open Market Committee met to focus on when and how they will tackle<br />
the process <strong>of</strong> retracting the QE and continuing the deleveraging process. The Fed has stated an<br />
unemployment rate <strong>of</strong> 6.5% as its threshold for pulling back on monetary policy. This level is interpreted<br />
as a healthy position in the recovery <strong>of</strong> the housing market and the economic impact <strong>of</strong> an improved<br />
labor market. At which time a reduction or ‘tapering’ <strong>of</strong> the bond purchase program should be<br />
implemented as an act <strong>of</strong> confidence in economic strength. Economic data has shown signs <strong>of</strong> a steady<br />
recovery in the U.S., which has led to robust discussions among Fed <strong>of</strong>ficials. The current talks have<br />
tentatively considered paring back the purchases from $85 billion to $65 billion per month possibly<br />
beginning in October, and eventually to $45 billion per month in late 2014. The steady decline in easing<br />
would last through 2015 in order to alleviate any potential spikes <strong>of</strong> inflationary reaction to the Fed’s<br />
attempts at a smooth adjustment. Since a reduction in bond purchases hinges upon the unemployment<br />
rate, movement towards the 6.5% threshold has been rather painfully slow thus far. The stock market<br />
and the housing market are resurgent and job market participation has been inching up, but the<br />
unemployment rate is still uncomfortably high. Even the most optimistic <strong>of</strong> economists hold the 6.5% rate<br />
as a target further out in the 2014 & 2015 calendar than the Fed. Importantly, once the tapering has<br />
been completed, only then will the Fed consider reassessing the interest rate and a possible move to<br />
increase it for the first time since 2006.<br />
The speculation over the unknown outcome <strong>of</strong> the discussions have led investors to recalibrate their<br />
interest rate expectations and outlook in various markets; domestic, international and in particular,<br />
emerging. Jim O’Neill, formerly <strong>of</strong> Goldman Sachs, has stated that concerns over changing Fed policy are<br />
especially front-and-center for emerging market investors. The global bond market stands to be exposed<br />
to high levels <strong>of</strong> market instability particularly for those countries with excessive account deficits and<br />
uncertainty over resolving them. Turkey, India, Brazil, South Africa, Indonesia and Thailand have all<br />
begun to feel the mounting volatility over U.S. interest rates. The market chatter over the Fed’s tapering<br />
process is leading to rising Treasury yields and strengthening USD, which is contributing to the early<br />
demise <strong>of</strong> the ‘great reach for yield’ trades which propped up the Emerging Markets. The emerging<br />
6
PERA Executive Investment Summary<br />
May <strong>2013</strong><br />
markets were the recipients <strong>of</strong> rampant interest from global investors through the relatively cheap<br />
liquidity which was created by the Fed’s aggressive monetary stimulation through its recovery program.<br />
One side effect in the shift in investor sentiment regarding the Fed’s recovery movements is a marked<br />
sell-<strong>of</strong>f in emerging market stocks, bonds and currencies, thus causing a tightening <strong>of</strong> liquidity during a<br />
crucial time for EM economies with economic growth below potential, low levels <strong>of</strong> inflation, price<br />
dislocations and currencies near their strongest levels. This pain has also been compounded by the<br />
contraction in China’s economic growth projections and the subsequent slow-down <strong>of</strong> the commodities<br />
market super-cycle. Foreign investors world-wide have been pulling their money out <strong>of</strong> emerging markets<br />
en masse, ($2.94 billion out <strong>of</strong> emerging market equity funds during the week <strong>of</strong> May 29 th alone) creating<br />
one <strong>of</strong> the biggest declines in four years.<br />
Market jitters and panic in the bond market have caught people <strong>of</strong>f guard and led to an increase in<br />
volatility. The U.S. Treasury market has declined dramatically with 10-year yields reaching nearly 2.25%,<br />
which will likely negatively impact global growth. Inflation expectations in the U.S. have lowered.<br />
Consumer Prices in May are seen rising by only 1.4% from a year ago, which is well below the Fed’s target<br />
2% inflation rate. Extensive sell-<strong>of</strong>fs in German, British and Japanese fixed income markets reflected the<br />
U.S. markets contributing to the May performance as one <strong>of</strong> the worst for global government bonds in 20<br />
years. Investors are split on the outcome <strong>of</strong> the Fed’s future actions which presents a choppy market.<br />
As a cautionary measure, the leaders <strong>of</strong> the G-8 nations say that the worst has passed for the global<br />
economy. The Fed has stated that the tapering will only go into effect when they perceive the economy<br />
to be on stable footing. Despite the mood swings <strong>of</strong> the markets and extensive investor rumblings, in<br />
anticipation <strong>of</strong> the Fed’s future easing calendar, Treasuries are still near historic lows, the VIX is still<br />
below its long-term average and the Dow is still up nearly 16% YTD. The course <strong>of</strong> the year thus far has<br />
proven a strengthening economy which should continue down a moderately bouncy road while absorbing<br />
the Fed’s subtle economic taming attempts.<br />
~Christina Keyes, Alternative Investments Analyst<br />
Historical Fed Interest Rates<br />
Historical U.S. Inflation (Consumer Price Index)<br />
7
Manager Update Memorandum<br />
To:<br />
Susan Biernacki, PERA Investment Committee Chair<br />
PERA Board Members<br />
From:<br />
Ben Rotenberg, Cliffwater LLC<br />
Regarding: Manager Update – TimesSquare Capital Management<br />
Mandate/Strategy: U.S. Small/Mid Cap Growth Equity / TimesSquare Capital Management Small/Mid<br />
Cap Growth Strategy<br />
Meeting Date: <strong>June</strong> <strong>27</strong>, <strong>2013</strong><br />
CC:<br />
Joelle Mevi, Chief Investment Officer<br />
Julian Baca, Deputy Chief Investment Officer<br />
LeAnne Larrañaga-Ruffy, Portfolio Manager<br />
Summary<br />
The <strong>Public</strong> <strong>Employees</strong> <strong>Retirement</strong> <strong>Association</strong> <strong>of</strong> <strong>New</strong> Mexico (“PERA”) hired TimesSquare Capital<br />
Management (“TSCM” or “TimesSquare” or “the firm”) to manage a U.S. small/mid cap growth equity<br />
mandate in 2005. TimesSquare is managing the portfolio in the style <strong>of</strong> the firm’s Small/Mid Cap Growth<br />
Equity strategy. PERA funded a separate account for TSCM in April 2005.<br />
TimesSquare manages $202.2 million for PERA as <strong>of</strong> April <strong>2013</strong>, representing 16.5% <strong>of</strong> PERA’s<br />
Small/Mid Cap Equity Composite, and 1.5% <strong>of</strong> PERA’s total plan.<br />
The firm is stable, and grew overall firm assets and strategy assets in the Small/Mid Cap Growth Equity<br />
strategy by 12% in 2012 through strong market performance. The firm has seen some outflows <strong>of</strong> client<br />
assets, with $100 million <strong>of</strong> net outflows from one client in the Small/Mid Cap Growth Equity strategy.<br />
Recent performance in the strategy has been strongly positive relative to its benchmark.<br />
Relative performance for PERA has also been very good. According to PERA’s custodian, TSCM has<br />
outperformed its benchmark (Russell 2500 Growth) by 3.92% annualized since inception in April 2005<br />
through April <strong>2013</strong>.<br />
Cliffwater believes that the firm is well positioned to continue to manage assets for PERA, and<br />
recommends no changes to the mandate at this time.<br />
Firm / Personnel Update<br />
The firm manages $16.6 billion as <strong>of</strong> March 31, <strong>2013</strong>. The firm employs 49 pr<strong>of</strong>essionals, including 22<br />
investment pr<strong>of</strong>essionals. The investment pr<strong>of</strong>essionals are comprised <strong>of</strong> four portfolio managers,<br />
fourteen research analysts, and four traders. The firm is stable, and grew assets under management by<br />
12% in 2012 through strong market performance. The firm and strategy experienced slight net outflows<br />
during 2012. The firm now manages $5.0 billion in the strategy, which has been closed to new clients for<br />
several years.<br />
TSCM’s Small/Mid Cap Growth team joined the firm in 2000 from their former firm, Fiduciary Trust<br />
Company International, where they had been managing the predecessor fund since 1985. The team is<br />
comprised <strong>of</strong> two portfolio managers, twelve research analysts, and three traders. This team has been<br />
fairly stable since Yvette Bockstein, the strategy’s founder, retired in 2007. Over the last three years, the<br />
team has added three research analysts, and has lost two research analysts.<br />
This report reflects information only through the date here<strong>of</strong>. Our due diligence and reporting rely upon the accuracy and completeness <strong>of</strong> financial<br />
information (which may or may not be audited by the fund manager) and other information publicly available or provided to us by the fund manager, its<br />
pr<strong>of</strong>essional staff, and through other references we have contacted. We have not conducted an independent verification <strong>of</strong> the information provided<br />
other than as described in this report. Our conclusions do not reflect an audit <strong>of</strong> the investment nor should they be construed as providing legal<br />
advice. Past performance does not guarantee future performance. The information contained herein is confidential commercial or financial information,<br />
the disclosure <strong>of</strong> which would cause substantial competitive harm to you, Cliffwater LLC, or the person or entity from whom the information was<br />
obtained, and may not be disclosed except as required by applicable law.<br />
© <strong>2013</strong> Cliffwater LLC. All rights reserved.
Overview <strong>of</strong> Investment Process<br />
TSCM believes that fundamental equity research skills can generate superior risk-adjusted returns in an<br />
inefficient asset class like small/mid cap growth. TSCM’s fundamental research places a particular<br />
emphasis on the assessment <strong>of</strong> management quality and an in-depth understanding <strong>of</strong> superior business<br />
models. The team’s goal is to build a diversified portfolio <strong>of</strong> small- and mid-cap growth stocks which will<br />
generate superior risk-adjusted returns. The foundation <strong>of</strong> TSCM’s research is frequent meetings with a<br />
company’s management to assess the quality <strong>of</strong> management and the business model. This review <strong>of</strong>ten<br />
includes on-site company visits, meetings with customers, competitors, and suppliers as well as<br />
investment conferences and discussions with venture capitalists. Approximately 90% <strong>of</strong> TSCM’s<br />
investment ideas are derived from internal research, while 10% come from their contacts at venture<br />
capital and regional sell-side research firms. The team’s dedicated analysts are all sector specialists.<br />
Performance<br />
Relative performance against the benchmark has been very strong. According to PERA’s custodian,<br />
TSCM has outperformed its benchmark (Russell 2500 Growth Index) by 3.92% annualized since<br />
inception in April 2005.<br />
TimesSquare has delivered a +12.28% annualized rate <strong>of</strong> return, compared to +8.36% for the benchmark<br />
Russell 2500 Growth Index, since inception <strong>of</strong> the PERA account in April 2005. Over longer periods <strong>of</strong><br />
time, the strategy has also delivered very good absolute and relative returns as compared to its<br />
benchmark and peer group.<br />
Performance Notes: Please note that the PERA-specific performance comes from PERA’s custodian. All<br />
other performance data is shown gross <strong>of</strong> fees and comes from eVestment Alliance and/or the investment<br />
manager. This data is only shown through March <strong>2013</strong>.<br />
Exhibit 1<br />
TimesSquare Performance for <strong>New</strong> Mexico PERA<br />
As <strong>of</strong> April 30, <strong>2013</strong><br />
Portfolio Name Market Value % MTD 3 Mo FYTD YTD 1 Year 3 Year 5 Year<br />
Since<br />
Incep. Inception Date<br />
Times Square 202,206,260 1.53 (0.76) 5.71 24.24 12.65 19.61 17.38 11.44 12.28 01-Apr-2005<br />
Russell 2500 Grow th 0.35 5.36 20.58 12.59 15.08 13.77 7.83 8.36<br />
Excess Return (1.11) 0.35 3.66 0.05 4.53 3.60 3.62 3.92<br />
Exhibit 2<br />
TimesSquare Small/Mid Cap Growth Equity Strategy (gross <strong>of</strong> fees)<br />
Annualized Performance<br />
As <strong>of</strong> March 31, <strong>2013</strong><br />
Annualized Returns<br />
1 Yr 3 Yr 5 Yr 7 Yr 10 Yr Oct '00<br />
TSCM Small/Mid Growth 22.12% 19.25% 13.13% 10.37% 14.80% 8.31%<br />
Russell 2500 Growth 13.69% 14.95% 9.02% 6.04% 12.19% 3.62%<br />
Difference 8.43% 4.30% 4.11% 4.33% 2.61% 4.70%<br />
Manager Update Memorandum Page 2 <strong>of</strong> 7<br />
© <strong>2013</strong> Cliffwater LLC. All rights reserved.
Exhibit 3<br />
TimesSquare Small/Mid Cap Growth Equity Strategy (gross <strong>of</strong> fees)<br />
Calendar Year Performance<br />
As <strong>of</strong> March 31, <strong>2013</strong><br />
YTD <strong>2013</strong> 2012 2011 2010 2009 2008 2007<br />
TSCM Small/Mid Growth 13.40% 22.44% 3.40% 24.69% 44.63% -35.13% 16.33%<br />
Russell 2500 Growth 12.20% 16.14% -1.59% 28.87% 41.64% -41.50% 9.68%<br />
Difference 1.20% 6.30% 4.99% -4.18% 2.99% 6.36% 6.65%<br />
2006 2005 2004 2003 2002 2001 Oct-Dec'00<br />
TSCM Small/Mid Growth 14.09% 12.51% 12.77% 37.06% -17.57% -10.70% -4.89%<br />
Russell 2500 Growth 12.<strong>27</strong>% 8.18% 14.59% 46.29% -29.10% -10.83% -19.34%<br />
Difference 1.82% 4.33% -1.83% -9.23% 11.53% 0.13% 14.45%<br />
Exhibit 4<br />
TimesSquare Small/Mid Cap Growth Equity Strategy (gross <strong>of</strong> fees)<br />
Risk Statistics vs. Russell 2500 Growth Index<br />
As <strong>of</strong> March 31, <strong>2013</strong><br />
TSCM Small/Mid Growth<br />
vs. Russell 2500 Growth Index<br />
Return Risk<br />
Return /<br />
Risk<br />
Excess<br />
Return<br />
Excess<br />
Risk Info Ratio<br />
3 Yr 19.25% 18.11% 1.06 4.30% 3.76% 1.14<br />
5 Yr 13.13% 21.06% 0.62 4.11% 4.84% 0.85<br />
7 Yr 10.37% 18.79% 0.55 4.33% 4.42% 0.98<br />
10 Yr 14.80% 17.16% 0.86 2.61% 4.54% 0.57<br />
October 2000 (inception) 8.31% 18.96% 0.44 4.70% 6.36% 0.74<br />
Manager Update Memorandum Page 3 <strong>of</strong> 7<br />
© <strong>2013</strong> Cliffwater LLC. All rights reserved.
Exhibits 5 and 6 are “skill charts” which attempt to discern whether or not the manager’s outperformance<br />
is attributable to luck or skill. The blue line represents the manager’s gross <strong>of</strong> fees rolling three or five<br />
year performance relative to the Russell 2500 Growth Index. If the blue line is above 0, the manager has<br />
outperformed the index<br />
and conversely, if the blue line is below 0, the manager has underperformed the<br />
index. The black lines represent confidence bands at the 80% level which incorporate the manager’s<br />
tracking error (standard deviation <strong>of</strong> excess return) relative too the index. If the blue line is above the top<br />
black line, their outperformance can be attributable to skill. . Conversely, if the blue<br />
line is below the<br />
bottom black line, their underperformance can be attributable to a lack<br />
<strong>of</strong> skill. If the blue line<br />
is in<br />
between the two black<br />
lines, it is unclear whether or not their r relative performance is attributable to either<br />
luck or skill. These charts demonstrate that TimesSquare has added alpha over most rolling threee year<br />
and five year periods and has done so with skill at times.<br />
Exhibit 5<br />
TimesSquare Small/Mid Cap Growth Equity Strategy (gross <strong>of</strong> fees)<br />
Rolling Three-Year Returns<br />
October 20000 through March <strong>2013</strong><br />
Manager Update Memorandum<br />
© <strong>2013</strong> Cliffwater LLC. All rights reserved.<br />
Page<br />
4 <strong>of</strong> 7
Exhibit 6<br />
TimesSquare Small/Mid Cap Growth Equity Strategy (gross <strong>of</strong> fees)<br />
Rolling Five-Year Returns<br />
October 20000 through March <strong>2013</strong><br />
Manager Update Memorandum<br />
© <strong>2013</strong> Cliffwater LLC. All rights reserved.<br />
Page 5 <strong>of</strong> 7
Exhibit 7<br />
Performancee Universe for<br />
Small/Mid Cap Growth Strategies<br />
Gross <strong>of</strong> Fees<br />
As <strong>of</strong> March 31, <strong>2013</strong><br />
Source: Evestment Alliance.<br />
Exhibit 8<br />
MPT Statistics Universe for Small/Mid Cap<br />
Growth Strategies vs. Russell 2500 Growth Index<br />
Gross <strong>of</strong> Fees<br />
As <strong>of</strong> March 31, <strong>2013</strong><br />
Source: Evestment Alliance.<br />
Manager Update Memorandum<br />
© <strong>2013</strong> Cliffwater LLC. All rights reserved.<br />
Page<br />
6 <strong>of</strong> 7
Watch List Test<br />
As stated in PERA’s investment policy, the following represent guidelines to be used in making a<br />
recommendation to the Investment Committee with regards to placing a traditional manager on the Watch<br />
List:<br />
Test 1: If the manager’s rolling three-year return (gross <strong>of</strong> fees) falls below the rolling three-year<br />
return <strong>of</strong> the benchmark for three consecutive quarters.<br />
Test 2: If the managers rolling three year return for three consecutive quarters ranks in the bottom<br />
third <strong>of</strong> the Consultant’s peer group universe.<br />
As <strong>of</strong> March 31, <strong>2013</strong>, the strategy did not pass either Watch List Test.<br />
Exhibit 9<br />
Watch List Test 1:<br />
TimesSquare Small/Mid Cap Growth Equity Strategy (gross <strong>of</strong> fees)<br />
Rolling Three Year Annualized Performance vs. Benchmark<br />
For Periods Ending 3/31/<strong>2013</strong>, 12/31/2012, and 9/30/2012<br />
3 Years<br />
ending<br />
3/31/<strong>2013</strong><br />
3 Years<br />
ending<br />
12/31/2012<br />
Exhibit 10<br />
Watch List Test 2:<br />
TimesSquare Small/Mid Cap Growth Equity Strategy (gross <strong>of</strong> fees)<br />
Rolling Three Year Annualized Performance vs. Peer Group Universe<br />
For Periods Ending 3/31/<strong>2013</strong>, 12/31/2012, and 9/30/2012<br />
3 Years<br />
ending<br />
9/30/2012<br />
TSCM Smid Growth 19.25% 16.44% 18.25%<br />
Russell 2500 Growth 14.95% 13.78% 15.17%<br />
Difference 4.30% 2.66% 3.08%<br />
3 Years<br />
ending<br />
3/31/<strong>2013</strong><br />
3 Years<br />
ending<br />
12/31/2012<br />
3 Years<br />
ending<br />
9/30/2012<br />
TSCM Smid Growth 19.25% 16.44% 18.25%<br />
eVestment Alliance Small/Mid Cap Growth Equity Universe Median 15.01% 13.54% 15.47%<br />
TSCM Rank in Universe 9 23 24<br />
Suggested Questions for the Investment Manager<br />
1) In what sectors are you currently finding opportunities?<br />
2) Are there any significant changes in portfolio positioning in the last year or so?<br />
3) What do you believe are the greatest risks in our portfolio today? What are the greatest<br />
opportunities?<br />
[As a reminder, we have not conducted full diligence on, or reviewed the legal documents for, this<br />
investment due to its legacy status in your portfolio.]<br />
Manager Update Memorandum Page 7 <strong>of</strong> 7<br />
© <strong>2013</strong> Cliffwater LLC. All rights reserved.
Jeffrey D. Braemer, CFA<br />
25 Years Experience<br />
Jeff is a Senior Vice President, Product Manager in TimesSquare’s growth equity group. His<br />
responsibilities include client servicing as well as portfolio and attribution analysis and general<br />
investment research. Prior to joining the firm, Jeff was a Director, Client Service and Marketing<br />
at Jacobs Levy Equity Management where he co-led the client service and portfolio analysis<br />
department. In that capacity, he was a primary point person for all client needs. Prior to Jacobs<br />
Levy, Jeff was a Product Specialist at Batterymarch Financial Management for U.S. and non-U.S.<br />
equity portfolios. Jeff has a B.A. in Political Science from Washington University in St. Louis and<br />
an M.S. in Management from Boston University. He is a member <strong>of</strong> the CFA Institute and the<br />
<strong>New</strong> York Society <strong>of</strong> Security Analysts. He holds FINRA Series 7 and 63 licenses
TIMESSQUARE CAPITAL MANAGEMENT, LLC<br />
A Small/Mid Cap Growth<br />
Portfolio Review Presentation To<br />
Jeffrey D. Braemer, CFA, Senior Vice President, Product Manager<br />
<strong>June</strong> <strong>27</strong>, <strong>2013</strong><br />
1 1 7 7 A v e n u e o f t h e A m e r i c a s , 3 9 th F l o o r ● N e w Y o r k , N Y 1 0 0 3 6 ● P h o n e: 8 0 0 – 5 4 1 – 5 1 5 6
TABLE OF CONTENTS<br />
I. TimesSquare Capital Management, LLC (TimesSquare)<br />
Organization<br />
Assets Under Management<br />
Representative Client List<br />
II. TimesSquare Small/Mid Cap Growth Strategy<br />
Team<br />
Philosophy<br />
Process<br />
III. Portfolio Results & Characteristics<br />
IV. Appendix<br />
Additional Performance Information<br />
Biographies<br />
Disclosures<br />
2
TimesSquare Capital Management, LLC<br />
(TimesSquare)<br />
3
TIMESSQUARE CAPITAL MANAGEMENT, LLC<br />
Investment manager focused on providing superior investment solutions<br />
exclusively to the institutional marketplace<br />
Experienced team <strong>of</strong> international and U.S. equity pr<strong>of</strong>essionals<br />
Time-tested investment strategies driven by internally generated research<br />
Significant employee ownership<br />
We are growth equity specialists.<br />
4
TIMESSQUARE CAPITAL MANAGEMENT, LLC<br />
Grant Babyak<br />
CEO, Portfolio Manager<br />
Management Committee<br />
Tony Rosenthal, CFA<br />
Portfolio Manager<br />
Stephen Green, CFA<br />
Head <strong>of</strong> Business Development<br />
International Equities<br />
U.S. Equities<br />
Trading<br />
Technology/Operations/<br />
Administration<br />
Marketing &<br />
Product Management<br />
Magnus Larsson<br />
Head <strong>of</strong> International Equities/<br />
Portfolio Manager<br />
Seth Bienstock<br />
Analyst<br />
Joshua Bisch<strong>of</strong>f<br />
Head Trader<br />
Mark Aaron<br />
Chief Operating Officer<br />
& Chief Compliance Officer<br />
Jeffrey Braemer, CFA<br />
Client Service &<br />
Product Management<br />
David Hirsh<br />
Analyst - Europe<br />
Robert Madsen, CFA<br />
Analyst - Asia<br />
Matthew D’Alto<br />
Analyst<br />
Kenneth Duca, CFA<br />
Portfolio Manager/Analyst<br />
Keith Ferguson, CFA<br />
Analyst<br />
Dr. Weidong Huang, CFA<br />
Analyst<br />
Timothy Corliss<br />
International Trader<br />
Christina Muk<strong>of</strong>sky<br />
U.S. Trader<br />
Adam Salomon<br />
U.S. Trader<br />
Carl Jano<br />
Chief Financial Officer<br />
Fred Kramer<br />
Operations & Systems<br />
John Metzner<br />
Technology Support<br />
Joseph DeVera<br />
Client Service &<br />
Product Management<br />
Siobhan Flannery<br />
Marketing &<br />
Product Management<br />
Brenda Le, CFA<br />
Marketing &<br />
Product Management<br />
Mark Grzymski<br />
Analyst<br />
Russell <strong>New</strong>man<br />
International Trade Support<br />
Joy Ragland<br />
Client Service &<br />
Product Management<br />
Michael Russell<br />
Analyst<br />
James Russo<br />
Analyst<br />
Valerie Vazquez<br />
Office Manager<br />
Michael Ray<br />
Client Service &<br />
Product Management<br />
5
GROWTH EQUITY STRATEGIES<br />
As <strong>of</strong> March 31, <strong>2013</strong><br />
International<br />
International Small Cap<br />
Total Assets ($M)<br />
$6<br />
U.S.<br />
Small Cap Growth<br />
(CLOSED)<br />
Small/Mid Cap Growth<br />
(CLOSED)<br />
Mid Cap Growth<br />
(CLOSED)<br />
FOCUS Growth<br />
$4,1<strong>27</strong><br />
$4,969<br />
$6,952<br />
$435<br />
All-Cap Growth<br />
$<strong>27</strong>8*<br />
$16.77* Billion<br />
*Includes an All-Cap Growth account funded in April <strong>2013</strong><br />
6
REPRESENTATIVE CLIENT LIST<br />
Corporate<br />
Allergan<br />
AMETEK<br />
Barnes Group<br />
Baxter International<br />
Boeing<br />
Bombardier Trust Canada, U.K., U.S.<br />
Bowne & Co.<br />
Catholic Health Partners<br />
CBS Corporation<br />
CenturyLink<br />
Chevron Corporation<br />
Colgate-Palmolive Company<br />
Cox Enterprises<br />
Dell Inc.<br />
DuPont and Related Companies Defined<br />
Contribution Plan Master Trust<br />
General Mills<br />
Hallmark Cards<br />
Illinois Tool Works Inc.<br />
Invensys<br />
Jefferson Regional Medical Center<br />
Blue Cross and Blue Shield <strong>of</strong> Minnesota<br />
Nestlé<br />
Pacific Gas and Electric Company<br />
PCA <strong>Retirement</strong> & Benefits, Inc.<br />
Providence Health System<br />
Realdania<br />
Ricoh Americas Corporation<br />
St. Joseph Health System<br />
SCANA Corporation<br />
Textron<br />
UL<br />
Wells Fargo Advisors<br />
<strong>Public</strong><br />
Arizona State <strong>Retirement</strong> System<br />
Colorado <strong>Public</strong> <strong>Employees</strong>’ <strong>Retirement</strong> <strong>Association</strong><br />
HEB Manitoba<br />
Imperial County <strong>Employees</strong>’ <strong>Retirement</strong> System<br />
Indiana <strong>Public</strong> <strong>Retirement</strong> System<br />
Manhattan and Bronx Surface Transit Operating Authority<br />
Montana Board <strong>of</strong> Investments<br />
<strong>Public</strong> <strong>Employees</strong> <strong>Retirement</strong> <strong>Association</strong> <strong>of</strong> <strong>New</strong> Mexico<br />
Oakland County <strong>Employees</strong>’ <strong>Retirement</strong> System<br />
Oklahoma City Employee <strong>Retirement</strong> System<br />
Oklahoma Municipal <strong>Retirement</strong> Fund<br />
Metropolitan St. Louis Sewer District<br />
Regional Transportation Authority<br />
South Carolina <strong>Retirement</strong> Systems<br />
Stilllegungsfonds für Kernanlagen/Entsorgungsfonds für Kernkraftwerke<br />
Virginia <strong>Retirement</strong> System<br />
Worldwide Assurance for <strong>Employees</strong> <strong>of</strong> <strong>Public</strong> Agencies<br />
Taft-Hartley<br />
Carpenters Pension Trust Fund for Northern California<br />
Laborers’ District Council & Contractors Pension Fund <strong>of</strong> Ohio<br />
Maritime <strong>Association</strong> - I.L.A. Pension Fund<br />
Operating Engineers Pension Trust Fund <strong>of</strong> Washington, DC<br />
San Diego Electrical Industry Trust<br />
Twin City Iron Workers<br />
UFCW Denver Area Meat Cutters & Employers Pension Plan<br />
UFCW Rocky Mountain Unions & Employers Pension Plan<br />
Endowment/Foundation<br />
American College <strong>of</strong> Surgeons<br />
American Legacy Foundation<br />
UCLA Foundation<br />
Foundation for the Carolinas<br />
Cook Children’s Health Foundation<br />
Howard University<br />
Idaho Endowment Fund Investment Board<br />
Kansas Health Foundation<br />
Kemper & Ethel Marley Foundation<br />
Silicon Valley Community Foundation<br />
Spectrum Health Foundation<br />
Texas Tech University System<br />
University <strong>of</strong> Arizona Foundation<br />
Wichita State University Foundation<br />
Sub-Advisory<br />
Aon Group Trust<br />
GuideStone Capital Management<br />
Managers Investment Group<br />
Nestlé Capital Advisers<br />
Old Mutual Global Investors<br />
Prudential Financial<br />
Vantagepoint Funds<br />
Please see the Appendix for important disclosures regarding this list.<br />
7
TimesSquare Small/Mid Cap Growth Strategy<br />
8
SMALL/MID CAP GROWTH INVESTMENT TEAM<br />
Portfolio Managers<br />
Credentials<br />
Investment Focus<br />
Years <strong>of</strong> Experience<br />
Grant R. Babyak<br />
MBA/<strong>New</strong> York University<br />
BA/Yale University<br />
Generalist<br />
25<br />
Tony Rosenthal, CFA<br />
MBA/Columbia Business School<br />
BA/Wesleyan University<br />
Generalist<br />
24<br />
Small/Mid Cap Analysts<br />
Credentials<br />
Investment Focus<br />
Years <strong>of</strong> Experience<br />
Seth M. Bienstock<br />
BS/Wharton School<br />
Financial Services<br />
16<br />
Matthew T. D’Alto<br />
MBA/University <strong>of</strong> Chicago<br />
BA/Fairfield University<br />
Energy<br />
15<br />
Kenneth C. Duca, CFA<br />
MBA/Rutgers University<br />
BA/Muhlenberg College<br />
Business Services,<br />
Transaction Processing<br />
23<br />
Keith E. Ferguson, CFA<br />
MBA/<strong>New</strong> York University<br />
BBA/H<strong>of</strong>stra University<br />
Communications, Data Networking,<br />
Data Storage, Lodging, Transportation<br />
21<br />
Mark E. Grzymski<br />
MBA/Fordham University<br />
BSBA/Bucknell University<br />
Industrials, Materials & Processing,<br />
Machinery<br />
16<br />
Dr. Weidong Huang, CFA<br />
PhD/Harvard University<br />
AB/Princeton University<br />
Biotechnology, Pharmaceuticals,<br />
Medical Devices, Healthcare Services<br />
17<br />
Michael J. Russell<br />
MBA/Harvard University<br />
AB/Princeton University<br />
Consumer, Media, Marketing Services<br />
20<br />
James J. Russo<br />
BS/Boston College<br />
Semiconductor, S<strong>of</strong>tware, Internet,<br />
Computer Hardware<br />
10<br />
9
SMALL/MID CAP GROWTH INVESTMENT PHILOSOPHY<br />
“We believe that our proprietary fundamental Small/Mid cap<br />
research skills, which place a particular emphasis on the<br />
assessment <strong>of</strong> management quality and an in-depth understanding<br />
<strong>of</strong> superior business models, enable us to build a diversified<br />
portfolio <strong>of</strong> Small/Mid cap growth stocks that will generate<br />
superior risk-adjusted returns.”<br />
10
SMALL/MID CAP GROWTH INVESTMENT PROCESS<br />
Research-Driven, Bottom-Up Discipline<br />
STEP 1 STEP 2 STEP 3<br />
Market Cap<br />
Criteria<br />
≥$300 million<br />
≤$5 billion<br />
2,500 stocks<br />
Growth Criteria<br />
3 Yrs. Projected<br />
EPS/Sales growth<br />
≥15%<br />
1,000 stocks<br />
PRIMARY<br />
REQUIREMENTS<br />
Exceptional<br />
management<br />
Distinct, sustainable<br />
competitive<br />
advantage<br />
Strong, consistent<br />
growth<br />
WORKING<br />
UNIVERSE<br />
400 STOCKS<br />
FURTHER<br />
IN-DEPTH<br />
ANALYSIS<br />
Management<br />
scrutiny<br />
Financial<br />
modeling<br />
Valuation<br />
Price<br />
targets<br />
PORTFOLIO<br />
CONSTRUCTION/<br />
RISK MANAGEMENT<br />
Sector/security<br />
diversification<br />
Active<br />
oversight<br />
Sell<br />
discipline<br />
PORTFOLIO<br />
100<br />
STOCKS<br />
11
SMALL/MID CAP GROWTH INVESTMENT PROCESS<br />
Identifying “Superior Growth Businesses”<br />
Exceptional management<br />
Clear goals and viable business model<br />
<br />
<br />
<br />
<br />
Alignment <strong>of</strong> interests with shareholders<br />
Experience and integrity<br />
Meaningful proportion <strong>of</strong> net worth tied<br />
to company<br />
Track record <strong>of</strong> success<br />
PRIMARY<br />
REQUIREMENTS<br />
Exceptional<br />
management<br />
Distinct, sustainable<br />
competitive<br />
advantage<br />
Strong, consistent<br />
growth<br />
WORKING<br />
UNIVERSE<br />
400 STOCKS<br />
Distinct, sustainable competitive advantage<br />
Proprietary products, services,<br />
distribution/manufacturing advantages<br />
<br />
<br />
<br />
<br />
<br />
Demonstrated franchise value<br />
High barriers to entry<br />
Relatively few competitors<br />
Brand name recognition<br />
Patents<br />
Strong, consistent growth<br />
Both top line (revenue) and bottom line (earnings)<br />
<br />
<br />
<br />
<br />
<br />
<br />
Strong probability <strong>of</strong> retaining or widening margins<br />
High proportion <strong>of</strong> recurring revenues<br />
Sales to many customers in multiple markets<br />
Strong balance sheet, conservative accounting,<br />
sufficient cash flow<br />
Visibility <strong>of</strong> earnings<br />
Growth rate potential unidentified<br />
12
SMALL/MID CAP GROWTH INVESTMENT PROCESS<br />
Further In-Depth Analysis<br />
Management scrutiny<br />
Approximately 1,500 management<br />
meetings per year<br />
On site due diligence <strong>of</strong> manufacturing/<br />
production facilities<br />
Further management discussions<br />
Financial Modeling<br />
Traditional financial analysis<br />
Models based on internally generated<br />
growth forecasts<br />
WORKING<br />
UNIVERSE<br />
400 STOCKS<br />
FURTHER<br />
IN-DEPTH<br />
ANALYSIS<br />
Management<br />
scrutiny<br />
Financial<br />
modeling<br />
Valuation<br />
Price<br />
targets<br />
Valuation tailored to industry<br />
Price/earnings at a discount to<br />
earnings growth<br />
Attractive price/earnings relative to<br />
industry group<br />
Price/revenue, price/cash flow, etc.,<br />
as appropriate<br />
Establish targets for each stock<br />
25-50% price appreciation potential over 12<br />
to 18 months<br />
<br />
Re-evaluate based on evolving fundamentals<br />
and current market conditions<br />
13
SMALL/MID CAP GROWTH INVESTMENT PROCESS<br />
Portfolio Construction/Risk Management<br />
Sector/Security Diversification<br />
Approximately 100 stocks in a portfolio<br />
<br />
<br />
<br />
<br />
No one issue greater than 5% at market<br />
No one major industry greater than 2x<br />
the index weight<br />
No one sector greater than 45% <strong>of</strong> portfolio<br />
market value<br />
Top 15 positions targeted to represent<br />
30% <strong>of</strong> the portfolio<br />
PORTFOLIO<br />
CONSTRUCTION/<br />
RISK MANAGEMENT<br />
Sector/security<br />
diversification<br />
Active<br />
oversight<br />
Sell<br />
discipline<br />
PORTFOLIO<br />
100<br />
STOCKS<br />
Active Oversight<br />
Trading system with built-in<br />
pre-trade compliance<br />
<br />
<br />
<br />
<br />
Daily compliance review<br />
Formal weekly review versus<br />
client guidelines and peer group review<br />
Daily and weekly strategy/<br />
research meetings<br />
Monthly attribution analysis<br />
Sell Discipline<br />
Operating objectives not met<br />
<br />
<br />
<br />
<br />
<br />
Management unable to sustain<br />
competitive advantage<br />
Anticipated deterioration in<br />
fundamentals<br />
Reasons for purchase changed<br />
Overvaluation<br />
Prudent pr<strong>of</strong>it-taking/trimming<br />
14
Portfolio Results & Characteristics<br />
15
PUBLIC EMPLOYEES RETIREMENT ASSOCIATION OF NEW MEXICO<br />
Total Returns for the Period Ending May 31, <strong>2013</strong><br />
33.3<br />
32.5<br />
Percent Return<br />
16.9 16.7<br />
17.2<br />
29.6<br />
22.2 21.3<br />
18.0<br />
11.7<br />
10.7<br />
12.8<br />
11.9<br />
8.8<br />
11.5 10.5<br />
7.6<br />
7.6<br />
YTD 1 YR 3 YR 5 YR 7 YR Since Ince ption<br />
(04/01/05)<br />
<strong>New</strong> Mexico (Gross) <strong>New</strong> Mexico (Net) Russell 2500 Growth Index<br />
Market Value as <strong>of</strong> May 31, <strong>2013</strong>: $209,854,015<br />
Returns are Annualized greater than 1 YR<br />
16
RUSSELL 2500 GROWTH INDEX BREAKDOWN<br />
RUSSELL 2500 GROWTH INDEX<br />
(AS OF 5/31/13)<br />
MACRO GROUP<br />
Y-T-D<br />
RETURN (%)<br />
INDEX<br />
WEIGHT (%)<br />
<strong>New</strong> Mexico<br />
WEIGHT (%)<br />
Consumer Discretionary 24.1 20.3 12.1<br />
Consumer Staples 30.5 3.8 4.1<br />
Energy 16.1 5.2 5.8<br />
Financial Services 16.8 14.3 19.1<br />
Healthcare 19.0 15.1 12.8<br />
Materials & Processing 8.8 9.1 5.0<br />
Producer Durables 16.9 16.1 20.4<br />
Technology 11.0 14.6 20.8<br />
Utilities 11.6 1.5 0.0<br />
Index Total 17.2 100 100<br />
Source: FactSet<br />
17
RUSSELL 2500 GROWTH INDEX BREAKDOWN<br />
RUSSELL 2500 GROWTH INDEX<br />
(AS OF 5/31/12)<br />
MACRO GROUP<br />
INDEX<br />
WEIGHT (%)<br />
<strong>New</strong> Mexico<br />
WEIGHT (%)<br />
Consumer Discretionary 16.8 12.4<br />
Consumer Staples 3.7 2.0<br />
Energy 7.5 7.1<br />
Financial Services 11.5 18.5<br />
Healthcare 16.3 15.0<br />
Materials & Processing 9.4 3.6<br />
Producer Durables 16.5 22.7<br />
Technology 16.9 18.7<br />
Utilities 1.2 0.0<br />
Index Total 100 100<br />
Source: FactSet<br />
18
RUSSELL 2500 GROWTH INDEX BREAKDOWN<br />
MACRO GROUP<br />
RUSSELL 2500 GROWTH INDEX<br />
(AS OF 3/31/05)<br />
REPRESENTATIVE<br />
INDEX<br />
ACCOUNT<br />
WEIGHT (%)<br />
WEIGHT (%)<br />
Auto & Transportation 3.6 3.4<br />
Consumer Discretionary 26.1 26.5<br />
Consumer Staples 0.9 0.8<br />
Energy 5.4 6.5<br />
Financial Services 12.0 20.2<br />
Health Care 18.4 17.9<br />
Materials & Processing 5.7 4.1<br />
Producer Durables 8.6 3.8<br />
Technology 17.4 16.7<br />
Utilities / Telecom. 1.4 0.0<br />
Other 0.4 0.0<br />
Index Total 100 100<br />
Source: Vestek<br />
19
PUBLIC EMPLOYEES RETIREMENT ASSOCIATION OF NEW MEXICO<br />
ATTRIBUTION HIGHLIGHTS: TRAILING 1 YEAR (5/31/<strong>2013</strong>)<br />
Performance Contribution by Sector<br />
Relative to Russell 2500 TM Growth Index<br />
SECTOR STOCK ACTIVE<br />
RUSSELL GLOBAL ECONOMIC SECTORS ALLOCATION SELECTION CONTRIBUTION<br />
Consumer Discretionary -0.46 0.07 -0.39<br />
Consumer Staples 0.05 -1.16 -1.11<br />
Energy 0.21 -0.28 -0.07<br />
Financial Services 0.15 1.90 2.06<br />
Health Care 0.04 1.78 1.81<br />
Materials & Processing -0.15 0.06 -0.09<br />
Producer Durables 0.05 0.94 0.98<br />
Technology -0.26 1.49 1.23<br />
Utilities 0.09 0.00 0.09<br />
TOTAL (Includes Cash & Equivalents) -1.05 4.80 3.75<br />
Greatest Contributors<br />
Greatest Detractors<br />
Contrib to Equity<br />
Contrib to Equity<br />
Security Sector Return % Security Sector Return %<br />
DaVita HealthCare Partners Health Care 1.64 Tempur-Pedic International Consumer Discretionary -0.55<br />
SBA Communications Corp. Technology 1.51 Green Dot Corp. Cl A Financial Services -0.39<br />
Genesee & Wyoming Inc. Producer Durables 1.45 VIVUS Inc. Health Care -0.33<br />
FleetCor Technologies Inc. Financial Services 1.39 Micros Systems Inc. Technology -0.30<br />
Apollo Global Management Financial Services 1.08 Volcano Corp. Health Care -0.26<br />
Source: FactSet<br />
20
PUBLIC EMPLOYEES RETIREMENT ASSOCIATION OF NEW MEXICO<br />
PORTFOLIO TEN LARGEST HOLDINGS<br />
YTD Thru<br />
5/31/<strong>2013</strong> Cap 5/31/<strong>2013</strong> Contribution<br />
% <strong>of</strong> Size Portfolio Portfolio<br />
Security Name Description (Year <strong>of</strong> Initial Purchase) Total Price ($ mil) Return (%) Return (%)<br />
SBA Communications Corp. Owns & operates wireless communications<br />
3.01 $75.<strong>27</strong> 9,582 6.02 0.23<br />
infrastructure in the U.S. (2006)<br />
Genesee & Wyoming Inc. Operates short line & regional freight railroads (2012) 2.04 $89.05 4,741 16.83 0.37<br />
Jack Henry & Associates Inc. Develops, markets, & installs integrated computer<br />
systems for in-house & service bureau data processing<br />
to banks & other financial institutions (2000)<br />
1.98 $46.93 4,040 20.35 0.37<br />
Alliance Data Systems Corp<br />
RenaissanceRe Holdings<br />
Clean Harbors<br />
WEX Inc.<br />
RPM International Inc.<br />
Qlik Technologies<br />
Ultimate S<strong>of</strong>tware Group<br />
Provides transaction services, credit services, &<br />
marketing services (2001)<br />
Provides reinsurance & insurance products & services<br />
worldwide (2009)<br />
Provides hazardous waste collection & disposal<br />
services (2009)<br />
Provides payment processing & information<br />
management services to the U.S. commercial &<br />
government vehicle fleet industry (2005)<br />
Manufactures & markets various specialty chemical<br />
products to industrial & consumer markets worldwide<br />
(2011)<br />
Designs business intelligence s<strong>of</strong>tware that visually<br />
analyzes data from multiple sources in real time (2012)<br />
Designs, markets, implements & supports Web-based &<br />
client/server cross-industry human resource<br />
management & payroll s<strong>of</strong>tware solutions (2012)<br />
1.97 $177.09 8,789 22.50 0.48<br />
1.84 $85.96 3,826 6.13 0.15<br />
1.81 $57.20 3,460 4.08 0.05<br />
1.72 $73.87 2,873 -1.93 -0.02<br />
1.64 $33.13 4,390 13.55 0.26<br />
1.63 $30.76 2,674 41.37 0.51<br />
1.55 $111.30 3,076 17.87 0.28<br />
19.21 2.68<br />
Source: FactSet<br />
21
PUBLIC EMPLOYEES RETIREMENT ASSOCIATION OF NEW MEXICO<br />
HISTORICAL TEN LARGEST HOLDINGS<br />
5/31/2012 Years <strong>of</strong> 3/31/2005 Years <strong>of</strong><br />
% <strong>of</strong> Initial % <strong>of</strong> Initial<br />
Security Name Total Purchase Security Name Total Purchase<br />
DaVita 3.85 2000 DaVita 3.96 2000<br />
SBA Communications Corp. 3.13 2006 Alliance Data Systems Corp 3.18 2001<br />
Alliance Data Systems Corp 2.16 2001 SCP Pool 2.72 1997<br />
Solera Holdings Inc. 1.95 2009 Investors Financial Services 2.67 1998<br />
Wright Express Corp. 1.91 2005 Education Management 2.31 2000<br />
Clean Harbors 1.81 2009 Capital Source 2.14 2003<br />
CoStar Group Inc. 1.78 2005 Global Payments Inc. 2.04 2001<br />
Global Payments Inc. 1.62 2001 Getty Images 1.99 2001<br />
Genesee & Wyoming Inc. 1.61 2012 Markel 1.93 1998<br />
Jack Henry & Associates Inc. 1.55 2000 Corporate Executive Board 1.82 1999<br />
21.37 24.76<br />
Source:Vestek<br />
22
PUBLIC EMPLOYEES RETIREMENT ASSOCIATION OF NEW MEXICO<br />
PORTFOLIO CHARACTERISTICS<br />
As <strong>of</strong> May 31, <strong>2013</strong><br />
Median Market<br />
Capitalization ($ Billions)<br />
Weighted Median Market<br />
Capitalization ($ Billions)<br />
<strong>New</strong> Mexico<br />
3.2<br />
3.3<br />
Russell 2500 <br />
Growth Index<br />
1.0<br />
3.2<br />
Weighted Average Market<br />
Capitalization ($ Billions)<br />
3.8<br />
3.7<br />
P/E (FY1 Forecast) 1 17.4x<br />
19.1x<br />
L.T. Earnings Growth Forecast 1 15.6%<br />
17.3%<br />
Number <strong>of</strong> Holdings<br />
98<br />
1,376<br />
Active Share<br />
86%<br />
-<br />
¹ Source: FactSet Estimates<br />
23
Appendix<br />
24
SMALL/MID CAP GROWTH HISTORICAL PERFORMANCE<br />
Calendar Year Gross-<strong>of</strong>-Fee Returns<br />
Calendar<br />
Years<br />
Small/Mid Cap<br />
Growth Composite<br />
Russell 2500 <br />
Growth Index<br />
2012 22.44% 16.13%<br />
2011 3.41 -1.57<br />
2010 24.68 28.86<br />
2009 44.60 41.66<br />
2008 -35.13 -41.50<br />
2007 16.34 9.69<br />
2006 14.09 12.26<br />
2005 12.51 8.18<br />
2004 12.75 14.59<br />
2003 37.07 46.31<br />
2002 -17.57 -29.09<br />
2001 -10.71 -10.82<br />
2000 13.20 -16.09<br />
1999 82.72 55.48<br />
1998 15.44 3.10<br />
1997 <strong>27</strong>.86 14.76<br />
1996 24.33 15.07<br />
1995 50.99 33.56<br />
1994 1.78 -1.28<br />
1993 22.40 12.13<br />
⇒ Our team has outperformed the Russell 2500 Growth Index in 10 <strong>of</strong> the 10 negative benchmark quarters over the last seven years (100%)<br />
⇒ Our team has outperformed the Russell 2500 Growth Index in 11 <strong>of</strong> the 12 negative benchmark quarters over the last ten years (92%)<br />
Please see the Appendix for important disclosures regarding past performance.<br />
25
Biographies<br />
26
MANAGEMENT COMMITTEE<br />
Grant R. Babyak<br />
25 Years Experience<br />
Grant is a Managing Director and Portfolio Manager in TimesSquare’s growth equity group. Prior to joining the firm, Grant managed small cap and mid cap<br />
portfolios at Fiduciary Trust Company International. He previously worked for six years at Avatar Associates as an institutional portfolio manager and for two<br />
years at U.S. Trust Company <strong>of</strong> <strong>New</strong> York as an analyst covering the consumer and basic industrial sectors. Grant has a B.A. in Political Science from Yale<br />
University and an M.B.A. in Finance from the Leonard N. Stern School <strong>of</strong> Business at <strong>New</strong> York University.<br />
Stephen Green, CFA<br />
24 Years Experience<br />
Stephen is a Managing Director and Head <strong>of</strong> Marketing & Product Management at TimesSquare. Prior to joining the firm, Stephen was Senior Vice President and<br />
Head <strong>of</strong> Product Management at Fiduciary Trust Company International. In that capacity, he was in charge <strong>of</strong> Fiduciary’s product development efforts and global<br />
client servicing in the U.S., Asia, and Europe. Stephen’s investment background also includes institutional investment consulting experience at William M. Mercer<br />
Investment Consulting and Stratford Advisory Group. At both firms, he was a Senior Consultant & Director <strong>of</strong> Investment Manager Research and was responsible<br />
for major client relationships in the U.S., Europe, and Australia. Stephen has a B.S. in Finance and an M.B.A. from the University <strong>of</strong> Illinois. He is a member <strong>of</strong><br />
the CFA Institute and the <strong>New</strong> York Society <strong>of</strong> Security Analysts.<br />
Tony Rosenthal, CFA<br />
24 Years Experience<br />
Tony is a Managing Director and Portfolio Manager in TimesSquare’s growth equity group. Before joining the firm, Tony held a similar position at Fiduciary<br />
Trust Company International. Prior experience includes three years at the Bank <strong>of</strong> <strong>New</strong> York as an equity portfolio manager and analyst and time at U.S. Trust<br />
Company <strong>of</strong> <strong>New</strong> York, where he conducted economic research. Tony has a B.A. in Economics from Wesleyan University and an M.B.A. from Columbia<br />
Business School. He is a member <strong>of</strong> the CFA Institute and the <strong>New</strong> York Society <strong>of</strong> Security Analysts.<br />
<strong>27</strong>
U.S. EQUITY INVESTMENT PROFESSIONALS<br />
Seth M. Bienstock<br />
16 Years Experience<br />
Seth is a Director and Analyst in TimesSquare’s growth equity group and is responsible for research coverage <strong>of</strong> the financial services sector. Prior to joining the<br />
firm, Seth was a Senior Analyst at Second Curve Capital, a financial services hedge fund. Prior experience includes eight years in private equity with Conning<br />
Capital Partners and Securitas Capital. At Securitas, he also worked extensively on strategy and corporate development assignments for Swiss Re. Seth has a B.S.<br />
in Economics from the Wharton School at the University <strong>of</strong> Pennsylvania, with a dual concentration in Finance and Insurance/Risk Management.<br />
Joshua A. Bisch<strong>of</strong>f<br />
18 Years Experience<br />
Joshua is a Director and Head <strong>of</strong> Trading at TimesSquare. Joshua joined the firm from Loomis Sayles & Co. where he held a similar position. His previous<br />
experience includes trading for small capitalization equity products at Scudder Kemper and Dreman Value and working as a block trader for Bear Stearns where he<br />
concentrated on trading financial and energy stocks. Joshua has a B.S. in Business Administration from Providence College and holds FINRA Series 7 and 55<br />
licenses.<br />
Matthew T. D’Alto<br />
15 Years Experience<br />
Matt is a Senior Vice President and Analyst in TimesSquare’s growth equity group, responsible for research coverage <strong>of</strong> the energy sector. Prior to joining the<br />
firm, Matt was a Senior Vice President/Senior Equity Analyst at J. & W. Seligman on their small- and SMID-cap growth equity team for eight years. Prior to J. &<br />
W. Seligman, Matt worked at Putnam Investments as an Investment Associate. Matt holds a B.A. in English writing with a Finance minor from Fairfield<br />
University, and an MBA from the University <strong>of</strong> Chicago Booth School <strong>of</strong> Business.<br />
Kenneth C. Duca, CFA<br />
23 Years Experience<br />
Ken is a Director and Portfolio Manager/Analyst in TimesSquare’s growth equity group, responsible for covering the business services and transaction processing<br />
sectors. Prior to joining the firm, Ken held a similar position at Fiduciary Trust Company International. Before joining Fiduciary Trust, Ken spent 10 years with<br />
Prudential where, at the time <strong>of</strong> his departure, he was a senior equity analyst on the small cap growth team. Ken has a B.A. in Economics from Muhlenberg<br />
College and an M.B.A. from Rutgers University. He is a member <strong>of</strong> the CFA Institute and the <strong>New</strong> York Society <strong>of</strong> Security Analysts.<br />
Keith E. Ferguson, CFA<br />
21 Years Experience<br />
Keith is a Director and Analyst in TimesSquare’s growth equity group. He is responsible for research coverage <strong>of</strong> the communications, data networking, data<br />
storage, lodging and transportation industries. Keith joined the firm from Alkeon Capital, a technology hedge fund, where he held a similar position. His previous<br />
research analyst experiences were as a Vice President at Loomis, Sayles and a Senior Analyst at Value Line, Inc. Keith has a B.B.A. in Banking and Finance from<br />
H<strong>of</strong>stra University, and an M.B.A. from the Leonard N. Stern School <strong>of</strong> Business at <strong>New</strong> York University. He is a member <strong>of</strong> the CFA Institute and the <strong>New</strong> York<br />
Society <strong>of</strong> Security Analysts.<br />
28
U.S. EQUITY INVESTMENT PROFESSIONALS<br />
Mark E. Grzymski<br />
16 Years Experience<br />
Mark is a Director and Analyst in TimesSquare’s growth equity group. He is responsible for research coverage <strong>of</strong> the industrial manufacturing, services, materials<br />
and processing industries. Prior to joining the firm, Mark was a Director at RBC Capital Markets covering industrial manufacturing and services companies. His<br />
previous research analyst experiences were as a Vice President at Needham & Company and as an associate analyst at Prospector Partners LLC. Mark has a<br />
B.S.B.A. in Management from Bucknell University, and an M.B.A. from the Graduate School <strong>of</strong> Business at Fordham University.<br />
Weidong Huang, Ph.D., CFA<br />
17 Years Experience<br />
Weidong is a Director and Analyst in TimesSquare’s growth equity group with research responsibilities for biotechnology, pharmaceutical, medical device, and<br />
healthcare services stocks. Prior to joining the firm, Weidong held a similar position at Fiduciary Trust Company International since 1999. Weidong previously<br />
held analyst positions at both PaineWebber and Hambrecht & Quist where he covered the biotechnology industry. He also was a research scientist at SmithKline<br />
Beecham Pharmaceuticals where he conducted genomics research. Weidong has an A.B. in Molecular Biology from Princeton University and a Ph.D. in<br />
Molecular and Cellular Biology from Harvard University. He is a member <strong>of</strong> the CFA Institute and the <strong>New</strong> York Society <strong>of</strong> Security Analysts.<br />
Michael J. Russell<br />
20 Years Experience<br />
Mike is a Director and Analyst in TimesSquare’s growth equity group with research responsibilities for the consumer, media and marketing services sectors.<br />
Before joining the firm, Mike was an Executive Director at Morgan Stanley covering media stocks since 1995 where he was a four year member <strong>of</strong> the Institutional<br />
Investor All-America Research Team and was rated the top broadcasting analyst in the Greenwich Associates survey in his last year on the sell-side. Mike<br />
graduated magna cum laude with an A.B. in Economics from Princeton University and has an M.B.A. from Harvard Business School.<br />
James J. Russo<br />
10 Years Experience<br />
Jim is a Vice President and Analyst in TimesSquare’s growth equity group, responsible for research coverage <strong>of</strong> the semiconductor, s<strong>of</strong>tware, internet, and<br />
computer hardware industries. Prior to joining the firm, Jim was an Equity Research Analyst at Adage Capital Management, L.P. for four years. Prior to Adage<br />
Capital Management, he worked at Fidelity Management and Research as an Equity Research Associate. Jim holds a B.S. in Management with concentrations in<br />
Finance and Economics from Boston College.<br />
29
KEY BUSINESS PROFESSIONALS<br />
Mark J. Aaron<br />
24 Years Experience<br />
Mark is Chief Operating Officer and Chief Compliance Officer <strong>of</strong> TimesSquare. He leads the back <strong>of</strong>fice and operations team supporting the investment team and<br />
process. Mark was part <strong>of</strong> the initial team responsible for the development and implementation <strong>of</strong> TimesSquare’s systems, operations and control environment in<br />
1999. Prior to joining TimesSquare, Mark was Senior Vice President at Credit Suisse Asset Management from 1991 to 1999 where he managed the Global<br />
Infrastructure and Technology Group responsible for the implementation and management <strong>of</strong> their global network and technical infrastructure. Prior to Credit<br />
Suisse, Mark worked in network management and system development roles at Applied Business Technologies, Inc. and Selectronics, Inc. Mark has a B.A. from<br />
the University <strong>of</strong> Rochester.<br />
Jeffrey D. Braemer, CFA<br />
25 Years Experience<br />
Jeff is a Senior Vice President, Product Manager in TimesSquare’s growth equity group. His responsibilities include client servicing as well as portfolio and<br />
attribution analysis and general investment research. Prior to joining the firm, Jeff was a Director, Client Service and Marketing at Jacobs Levy Equity<br />
Management where he co-led the client service and portfolio analysis department. In that capacity, he was a primary point person for all client needs. Prior to<br />
Jacobs Levy, Jeff was a Product Specialist at Batterymarch Financial Management for U.S. and non-U.S. equity portfolios. Jeff has a B.A. in Political Science<br />
from Washington University in St. Louis and an M.S. in Management from Boston University. He is a member <strong>of</strong> the CFA Institute and the <strong>New</strong> York Society <strong>of</strong><br />
Security Analysts. He holds FINRA Series 7 and 63 licenses.<br />
Joseph B. DeVera<br />
19 Years Experience<br />
Joe is a Senior Vice President, Product Manager in TimesSquare’s growth equity group. His responsibilities include client servicing as well as portfolio and<br />
attribution analysis and general investment research. Prior to joining TimesSquare, Joe was a Vice President, Director <strong>of</strong> Investment Strategy at Sentinel Asset<br />
Management where he was the product specialist for the firm’s products, including their Small Cap Growth and Mid Cap Growth products. Prior to Sentinel, Joe<br />
was a Director and Senior Client Portfolio Manager for the Small Cap and Mid Cap Growth portfolio management team at Deutsche Asset Management. He has a<br />
B.S. in Finance, Marketing and International Business from the Leonard N. Stern School <strong>of</strong> Business at <strong>New</strong> York University and holds FINRA Series 7 and 63<br />
licenses.<br />
30
KEY BUSINESS PROFESSIONALS<br />
Brenda N. Le, CFA<br />
10 Years Experience<br />
Brenda is a Vice President, Marketing & Product Management at TimesSquare. Her responsibilities include consultant relations, marketing, and client servicing.<br />
She is also involved with written commentary and attribution analysis. Prior to joining the firm, Brenda was a Press Assistant in the <strong>New</strong> York State Executive<br />
Chamber where she assisted with media inquiries, reviewed television news summaries, and organized media requests for Governor George E. Pataki. Brenda<br />
graduated cum laude with a B.A. in Communications and a B.S.E. in Digital Media Design from the University <strong>of</strong> Pennsylvania and holds FINRA Series 7 and 63<br />
licenses. She is a member <strong>of</strong> the CFA Institute and the <strong>New</strong> York Society <strong>of</strong> Security Analysts.<br />
Michael B. Ray<br />
25 Years Experience<br />
Mike is a Senior Vice President, Product Manager in TimesSquare’s growth equity group. His responsibilities include client servicing as well as portfolio and<br />
attribution analysis and general investment research. Prior to joining the firm, Mike was a Vice President, Client Service Manager at Goldman Sachs Asset<br />
Management. In that position, Mike worked closely with GSAM relationship and product managers with the common goal <strong>of</strong> deepening public fund client<br />
relationships. Prior to joining Goldman Sachs, Mike was a Vice President, Portfolio Specialist with Morgan Stanley Investment Management working with<br />
institutional and retail clients with a focus on the firm’s US Growth products. Mike has a B.S. in Accounting from St. John’s University and holds FINRA Series 7,<br />
63 and 3 licenses.<br />
31
Disclosures<br />
32
SMALL/MID CAP GROWTH DISCLOSURES<br />
Composite Disclosure:<br />
TimesSquare Capital Management, LLC (“TimesSquare”) is a registered investment adviser that is owned by the former equity management team <strong>of</strong> TimesSquare Capital Management, Inc. (“TimesSquare Inc.”) and Affiliated<br />
Managers Group, Inc. TimesSquare was formed to manage TimesSquare Inc.’s growth equity investment advisory business which was sold to TimesSquare in a transaction that closed on November 19, 2004. The members <strong>of</strong><br />
TimesSquare’s Small/Mid Cap Growth team joined TimesSquare Inc. on September 7, 2000 after working together at Fiduciary Trust Company International (“FTCI”). While employed at FTCI, the team managed the Fiduciary<br />
Special Equity Fund, an ERISA-only commingled vehicle managed in the Small/Mid Cap Growth style. The team is currently led by Grant Babyak (and Tony Rosenthal), who served as co-manager <strong>of</strong> the Special Equity Fund<br />
starting in 1996 through September 6, 2000. There has been no change in investment strategy from the prior two firms.<br />
Effective October 4, 2000, the team began managing its first Small/Mid Cap Growth account at TimesSquare Inc. Five other Small/Mid Cap Growth accounts came to the team from the same client in the fourth quarter <strong>of</strong> 2000.<br />
The performance record we have submitted to the recipient <strong>of</strong> this presentation as indicated on the cover consists <strong>of</strong> the following:<br />
• From 12/31/85 to 9/30/00: Gross performance <strong>of</strong> the FTCI Special Equity Fund as published in the PSN database <strong>of</strong> manager returns. TimesSquare has not independently verified the accuracy <strong>of</strong> the performance published in the<br />
PSN database, all returns in which are submitted by the participating investment management firms.<br />
• From 10/4/00 to 10/31/00: Gross performance <strong>of</strong> the TimesSquare Inc. Small/Mid Cap Growth representative account.<br />
• From 10/31/00 to 11/18/04 and from 11/19/04 to present: Gross performance <strong>of</strong> all TimesSquare Inc. and TimesSquare, respectively, discretionary Small/Mid cap accounts with market values greater than $5 million that invested<br />
in stocks with market capitalizations generally between $300 million and $5 billion at time <strong>of</strong> purchase.<br />
The performance <strong>of</strong> the Fiduciary Special Equity Fund reflects a number <strong>of</strong> factors, including the contributions <strong>of</strong> Mr. Babyak and other members <strong>of</strong> the TimesSquare team such as the four dedicated research analysts (present as <strong>of</strong><br />
9/7/00) as well as those <strong>of</strong> other persons who are not part <strong>of</strong> the TimesSquare team. Prior to September 7, 2000, the TimesSquare team also managed other accounts investing in Small/Mid cap growth stocks. Performance <strong>of</strong> those<br />
other accounts may have been higher or lower than that <strong>of</strong> the FTCI Special Equity Fund. TimesSquare, however, cannot independently verify that the Fund's performance is representative <strong>of</strong> the performance <strong>of</strong> those Small/Mid cap<br />
accounts managed by the TimesSquare team prior to September 7, 2000. Variations in performance, investments, strategies, allocation percentages among other things, can be attributed to a number <strong>of</strong> factors, including, but not<br />
limited to, cash flows, timing <strong>of</strong> purchases and sales <strong>of</strong> portfolio securities, and investment restrictions imposed by account holders. There can be no assurance that the future performance <strong>of</strong> an individual account will be the same as<br />
the performance <strong>of</strong> any other account, including those represented in the historical record we present.<br />
The performance figures shown are calculated in U.S. dollars on a size-weighted basis and reflect the reinvestment <strong>of</strong> dividends and other earnings, and the deduction <strong>of</strong> brokerage commissions and other transaction costs.<br />
Performance is provided on a gross basis (before the deduction <strong>of</strong> management fees) as well as net <strong>of</strong> the highest management fee <strong>of</strong> 1.00% charged by TimesSquare to separately managed institutional accounts in this composite.<br />
Investment advisory fees generally charged by TimesSquare are described in Part II <strong>of</strong> its Form ADV. To illustrate performance net <strong>of</strong> fees, assume $20,000,000 is placed under management for ten years sustaining 10% compound<br />
gross total return. If an advisory fee <strong>of</strong> 1.00% <strong>of</strong> average assets under management is charged per year, for each year <strong>of</strong> the ten-year period, the resulting compound annual return would be reduced to 9.0%. The ending dollar value<br />
<strong>of</strong> the account would be $47,347,<strong>27</strong>4 compared with the unreduced account value <strong>of</strong> $51,874,849.<br />
The “linked” performance results included in this presentation are exclusively for the use <strong>of</strong> the recipient <strong>of</strong> this presentation as indicated on the cover, and are suitable for use exclusively in “one on one” institutional settings. The<br />
performance results <strong>of</strong> the Fiduciary Special Equity Fund and the TimesSquare Inc. and TimesSquare return series, for the respective time periods as represented in the linked performance results, are presented on the following<br />
pages.<br />
The opinions and information expressed and provided are for general information only and are not intended to provide specific advice or recommendations but rather, a basis from which strategies can be built, taking into account the<br />
specific objectives <strong>of</strong> each portfolio, in terms <strong>of</strong> return, time horizon, and risk constraints, as well as diverging investment perspectives and assumptions. All material has been obtained from sources believed to be reliable, but its<br />
accuracy and completeness are not guaranteed.<br />
Russell ® Disclosure:<br />
Performance is measured against the Russell 2500 Growth – a market capitalization-weighted index that measures the performance <strong>of</strong> those Russell 2500 companies with higher price-to-book ratios and higher forecasted growth<br />
rates. All indexes, including the Russell 2500 Growth Index, are based on gross-<strong>of</strong>-fee returns. Russell Investment Group is the source and owner <strong>of</strong> the Russell Index data contained or reflected in this material and all trademarks<br />
and copyrights related thereto.<br />
Representative Client List Disclosure:<br />
The Representative Client List includes the clients <strong>of</strong> TimesSquare Capital Management, LLC that have consented to inclusion on this list, and is not based on performance criteria. Inclusion on this list does not represent an<br />
endorsement by or <strong>of</strong> these entities or <strong>of</strong> the services provided by TimesSquare or these entities.<br />
Portfolio Holdings:<br />
The holdings and weightings displayed represent a particular point in time. It should not be assumed that the securities continue to be held and/or continue to be held in the same percentage. In addition, the holdings and percentage<br />
weights <strong>of</strong> a particular client account may differ from the information shown. The sector weightings shown for TSCM reflect the Russell Global Sectors classification system <strong>of</strong> the securities within our portfolios.<br />
Representative Portfolio:<br />
The representative portfolio is an account that we believe most closely reflects the current portfolio management style for this strategy. Performance is not a consideration in the selection <strong>of</strong> the representative portfolio. The<br />
characteristics <strong>of</strong> the representative portfolio may differ from those <strong>of</strong> other managed accounts and from those <strong>of</strong> a start-up portfolio. The characteristics relate to the portfolio as <strong>of</strong> a particular point in time and should not be<br />
regarded as predictive.<br />
Notice to Consultants:<br />
Consultants may provide gross performance data to prospective clients only in one-on-one presentations and such performance must be accompanied by the disclosures set forth herein.<br />
33
SMALL/MID CAP GROWTH DISCLOSURES<br />
Fiduciary Trust Company International Special Equity Fund, Quarterly Returns, Gross <strong>of</strong> Fees, 12/31/85 through 9/30/00<br />
FTCI<br />
Russell 2500 <br />
Growth<br />
FTCI<br />
Russell 2500 <br />
Growth<br />
FTCI<br />
Russell 2500 <br />
Growth<br />
2000<br />
1999<br />
1998<br />
1997<br />
1996<br />
1st Quarter 19.22% 15.15%<br />
2nd Quarter -6.24 -6.91<br />
3rd Quarter 6.50 -2.94<br />
1st Quarter 4.20 -1.05<br />
2nd Quarter 8.97 16.81<br />
3rd Quarter 2.55 -3.47<br />
4th Quarter 56.92 39.36<br />
Year 82.72 55.48<br />
1st Quarter 14.03 11.15<br />
2nd Quarter 0.10 -4.88<br />
3rd Quarter -19.18 -22.21<br />
4th Quarter 25.14 25.35<br />
Year 15.44 3.10<br />
1st Quarter -9.40 -8.00<br />
2nd Quarter 18.51 16.25<br />
3rd Quarter 16.13 16.64<br />
4th Quarter 2.54 -8.01<br />
Year <strong>27</strong>.86 14.76<br />
1st Quarter 7.66 7.00<br />
2nd Quarter 9.78 5.11<br />
3rd Quarter 3.40 1.37<br />
4th Quarter 1.74 0.93<br />
Year 24.33 15.07<br />
1995<br />
1994<br />
1993<br />
1992<br />
1991<br />
1st Quarter 10.78% 8.46%<br />
2nd Quarter 8.66 8.92<br />
3rd Quarter 14.72 11.11<br />
4th Quarter 9.34 1.75<br />
Year 50.99 33.56<br />
1st Quarter -4.75 -2.94<br />
2nd Quarter -4.36 -6.47<br />
3rd Quarter 9.84 9.63<br />
4th Quarter 1.72 -0.81<br />
Year 1.78 -1.28<br />
1st Quarter 3.39 -1.26<br />
2nd Quarter 2.15 2.44<br />
3rd Quarter 16.51 8.06<br />
4th Quarter -0.53 2.59<br />
Year 22.40 12.13<br />
1st Quarter -0.05 -0.75<br />
2nd Quarter -4.89 -10.21<br />
3rd Quarter 3.54 2.36<br />
4th Quarter 16.85 15.96<br />
Year 15.01 5.78<br />
1st Quarter <strong>27</strong>.37 28.87<br />
2nd Quarter -0.24 -2.90<br />
3rd Quarter 16.16 11.46<br />
4th Quarter 20.69 11.14<br />
Year 78.14 55.01<br />
1990<br />
1989<br />
1988<br />
1987<br />
1986<br />
1st Quarter -3.83% -2.88%<br />
2nd Quarter 7.88 7.44<br />
3rd Quarter -14.38 -24.09<br />
4th Quarter 11.30 10.84<br />
Year -1.13 -12.20<br />
1st Quarter 9.85 7.64<br />
2nd Quarter 14.89 8.06<br />
3rd Quarter 16.91 9.54<br />
4th Quarter 0.40 -2.<strong>27</strong><br />
Year 48.14 24.52<br />
1st Quarter 9.72 14.09<br />
2nd Quarter 5.58 5.73<br />
3rd Quarter -2.94 -2.91<br />
4th Quarter 3.37 -0.18<br />
Year 16.23 16.91<br />
1st Quarter 26.71 25.08<br />
2nd Quarter 2.32 0.24<br />
3rd Quarter 6.85 4.34<br />
4th Quarter -20.63 -<strong>27</strong>.17<br />
Year 9.95 -4.72<br />
1st Quarter 54.13 16.06<br />
2nd Quarter 32.84 8.85<br />
3rd Quarter -7.05 -13.35<br />
4th Quarter 6.24 2.37<br />
Year 102.19 12.06<br />
Please see the important disclosures regarding past performance.<br />
34
SMALL/MID CAP GROWTH DISCLOSURES<br />
Small/Mid Cap Growth Composite, Quarterly Returns, Gross <strong>of</strong> Fees, Since 9/30/00<br />
<strong>2013</strong><br />
2012<br />
2011<br />
2010<br />
Russell 2500 <br />
TSCM Growth<br />
1st Quarter 13.41% 12.20%<br />
Year 13.41 12.20<br />
1st Quarter 13.69 14.60<br />
2nd Quarter -2.29 -5.38<br />
3rd Quarter 6.41 5.22<br />
4th Quarter 3.58 1.78<br />
Year 22.44 16.13<br />
1st Quarter 9.31 9.83<br />
2nd Quarter -0.37 0.38<br />
3rd Quarter -19.52 -21.35<br />
4th Quarter 17.99 13.51<br />
Year 3.41 -1.57<br />
1st Quarter 5.57 8.81<br />
2nd Quarter -8.44 -9.77<br />
3rd Quarter 12.26 13.15<br />
4th Quarter 14.90 16.00<br />
Year 24.68 28.86<br />
2009<br />
2008<br />
2007<br />
2006<br />
2005<br />
Russell 2500 <br />
TSCM Growth<br />
1st Quarter -4.45% -5.97%<br />
2nd Quarter 17.56 21.79<br />
3rd Quarter 18.66 17.17<br />
4th Quarter 8.49 5.57<br />
Year 44.60 41.66<br />
1st Quarter -9.37 -11.08<br />
2nd Quarter 3.43 3.62<br />
3rd Quarter -9.33 -12.09<br />
4th Quarter -23.68 -<strong>27</strong>.77<br />
Year -35.13 -41.50<br />
1st Quarter 2.31 4.03<br />
2nd Quarter 8.23 6.99<br />
3rd Quarter 2.91 0.66<br />
4th Quarter 2.09 -2.09<br />
Year 16.34 9.69<br />
1st Quarter 11.74 11.83<br />
2nd Quarter -4.12 -6.13<br />
3rd Quarter -0.66 -1.20<br />
4th Quarter 7.21 8.25<br />
Year 14.09 12.26<br />
1st Quarter -2.84 -4.33<br />
2nd Quarter 5.51 3.56<br />
3rd Quarter 6.23 6.29<br />
4th Quarter 3.30 2.72<br />
Year 12.51 8.18<br />
2004<br />
2003<br />
2002<br />
2001<br />
2000<br />
Russell 2500 <br />
TSCM Growth<br />
1st Quarter 3.68% 5.50%<br />
2nd Quarter 1.30 0.13<br />
3rd Quarter -6.53 -5.61<br />
4th Quarter 14.85 14.91<br />
Year 12.75 14.59<br />
1st Quarter -2.49 -3.20<br />
2nd Quarter 19.78 -22.72<br />
3rd Quarter 6.03 9.97<br />
4th Quarter 10.68 12.00<br />
Year 37.07 46.31<br />
1st Quarter 2.49 -2.95<br />
2nd Quarter -11.66 -16.63<br />
3rd Quarter -16.64 -19.06<br />
4th Quarter 9.20 8.28<br />
Year -17.57 -29.09<br />
1st Quarter -18.60 -19.91<br />
2nd Quarter 14.92 21.<strong>27</strong><br />
3rd Quarter -20.42 -<strong>27</strong>.07<br />
4th Quarter 19.94 25.90<br />
Year -10.71 -10.82<br />
1st Quarter -4.91 -19.35<br />
Please see the important disclosures regarding past performance.<br />
35
SMALL/MID CAP GROWTH DISCLOSURES<br />
Calendar Year Net-<strong>of</strong>-Fee Returns<br />
Calendar<br />
Years<br />
Small/Mid Cap<br />
Growth Composite<br />
Russell 2500 <br />
Growth Index<br />
2012 21.24% 16.13%<br />
2011 2.38 -1.57<br />
2010 23.46 28.86<br />
2009 43.20 41.66<br />
2008 -35.80 -41.50<br />
2007 15.19 9.69<br />
2006 12.97 12.26<br />
2005 11.39 8.18<br />
2004 11.64 14.59<br />
2003 35.74 46.31<br />
2002 -18.42 -29.09<br />
2001 -11.69 -10.82<br />
2000 12.10 -16.09<br />
1999 81.13 55.48<br />
1998 14.32 3.10<br />
1997 26.65 14.76<br />
1996 23.16 15.07<br />
1995 49.63 33.56<br />
1994 0.77 -1.28<br />
1993 21.24 12.13<br />
The Russell 2500 Growth Index is based on gross-<strong>of</strong>-fee returns.<br />
Please see the important disclosures regarding past performance.<br />
36
Manager Update Memorandum<br />
To:<br />
Susan Biernacki, PERA Investment Committee Chair<br />
PERA Board Members<br />
From:<br />
Ben Rotenberg, Cliffwater LLC<br />
Regarding: Manager Update – RBC–Global Asset Management<br />
Mandate/Strategy: U.S. Small Cap Growth Equity / RBC-GAM US Small Cap Growth Strategy<br />
Meeting Date: <strong>June</strong> <strong>27</strong>, <strong>2013</strong><br />
CC:<br />
Joelle Mevi, Chief Investment Officer<br />
Julian Baca, Deputy Chief Investment Officer<br />
LeAnne Larrañaga-Ruffy, Portfolio Manager<br />
Summary<br />
The <strong>Public</strong> <strong>Employees</strong> <strong>Retirement</strong> <strong>Association</strong> <strong>of</strong> <strong>New</strong> Mexico (“PERA”) hired RBC-Global Asset<br />
Management (“RBC-GAM” or “RBC” or “the firm”) to manage a U.S. small cap growth equity mandate in<br />
2005. RBC-GAM was founded in 1983 as Voyageur Asset Management; Voyageur was purchased by an<br />
affiliate <strong>of</strong> RBC in 2000. RBC-GAM is managing the portfolio in the style <strong>of</strong> the firm’s US Small Cap<br />
Growth strategy. PERA funded a separate account for RBC in April 2005.<br />
RBC-GAM manages $195.6 million for PERA as <strong>of</strong> April <strong>2013</strong>, representing 16.0% <strong>of</strong> PERA’s Small/Mid<br />
Cap Equity Composite, and 1.5% <strong>of</strong> PERA’s total plan.<br />
The firm is stable; its assets under management have been at close to the same levels (within 10%) for<br />
the last four years. In the US Small Cap Growth strategy, assets grew over 10% due to market<br />
performance. Flows were slightly negative in the US Small Cap Growth strategy as one client departed.<br />
Recent performance in the strategy has been strongly positive relative to its benchmark.<br />
Relative performance for PERA has been very good, especially in the most recent five years. According<br />
to PERA’s custodian, RBC-GAM has outperformed its benchmark (Russell 2000 Growth) by 1.30%<br />
annualized since inception in April 2005 through April <strong>2013</strong>. RBC-GAM has outperformed its benchmark<br />
by 3.65% annualized for the five year period ending April <strong>2013</strong>.<br />
Cliffwater believes that the firm is well positioned to continue to manage assets for PERA, and<br />
recommends no changes to the mandate at this time.<br />
Firm / Personnel Update<br />
As <strong>of</strong> March 31, <strong>2013</strong>, the firm manages $42.2 billion. The firm employs 118 pr<strong>of</strong>essionals, including 28<br />
investment pr<strong>of</strong>essionals. The investment pr<strong>of</strong>essionals are comprised <strong>of</strong> 17 portfolio managers, 9<br />
research analysts, and 2 traders. The firm is stable, and assets under management have also been<br />
stable in recent years. The US Small Cap Growth strategy has experienced marginal growth in assets<br />
under management, primarily due to market performance. The firm now manages $1.2 billion in the<br />
strategy.<br />
RBC-GAM’s Small Cap Growth team is located in Chicago, and is comprised <strong>of</strong> three portfolio managers,<br />
one dedicated research analyst, and two traders. The team also utilizes an economist who works for an<br />
affiliate <strong>of</strong> RBC-GAM. This team has been very stable since 2009, when a senior portfolio manager<br />
departed the team. Since 2009, there have been no departures from the team, and one addition <strong>of</strong> a<br />
research analyst.<br />
This report reflects information only through the date here<strong>of</strong>. Our due diligence and reporting rely upon the accuracy and completeness <strong>of</strong> financial<br />
information (which may or may not be audited by the fund manager) and other information publicly available or provided to us by the fund manager, its<br />
pr<strong>of</strong>essional staff, and through other references we have contacted. We have not conducted an independent verification <strong>of</strong> the information provided<br />
other than as described in this report. Our conclusions do not reflect an audit <strong>of</strong> the investment nor should they be construed as providing legal<br />
advice. Past performance does not guarantee future performance. The information contained herein is confidential commercial or financial information,<br />
the disclosure <strong>of</strong> which would cause substantial competitive harm to you, Cliffwater LLC, or the person or entity from whom the information was<br />
obtained, and may not be disclosed except as required by applicable law.<br />
© <strong>2013</strong> Cliffwater LLC. All rights reserved.
Overview <strong>of</strong> Investment Process<br />
RBC-GAM’s Small Cap Growth team believes that earnings drive stock prices. The team employs an<br />
investment process based on fundamental, bottom-up research, and builds diversified portfolios <strong>of</strong><br />
pr<strong>of</strong>itable, high-quality, cash-flow rich companies for long term capital appreciation. The team begins with<br />
a universe <strong>of</strong> approximately 2,500 companies with market capitalizations <strong>of</strong> $200 million to $2.0 billion.<br />
They narrow this universe to a focus list <strong>of</strong> 300-400 securities, by identifying companies that are<br />
pr<strong>of</strong>itable, are industry leaders and have strong financial characteristics including: positive earnings<br />
growth, high return on equity and pr<strong>of</strong>it margins relative to peers, and strong balance sheets. Because<br />
the team’s primary thesis is that earnings growth drives stock prices, their research is focused on<br />
identifying market leaders with predictable and sustainable earnings growth. They seek companies led by<br />
strong management teams who can consistently grow revenue and EPS over several years. Once they<br />
have completed their research, the portfolio managers are attempting to build diversified portfolios with<br />
low portfolio volatility, below-average turnover, and sustainable risk-adjusted performance. With 65-80<br />
holdings, the portfolio has broad industry and sector exposure with no large sector bets. In sectors<br />
comprising at least 10% <strong>of</strong> the benchmark, the portfolio’s exposure is limited to 0.5-1.5 times the<br />
benchmark’s weighting. The team keeps exposure to smaller sectors within 300 basis points <strong>of</strong> the<br />
benchmark’s weighting.<br />
Performance<br />
Relative performance against the benchmark has been positive. According to PERA’s custodian, RBC-<br />
GAM has outperformed its benchmark (Russell 2000 Growth Index) by 1.30% annualized since inception<br />
in April 2005.<br />
Since inception, RBC-GAM has delivered a +8.92% annualized rate <strong>of</strong> return, compared to +7.62% for<br />
the benchmark Russell 2000 Growth Index. Over longer periods <strong>of</strong> time, the strategy has also delivered<br />
very good absolute and relative returns as compared to its benchmark and peer group.<br />
Performance Notes: Please note that the PERA-specific performance comes from PERA’s custodian. All<br />
other performance data is shown gross <strong>of</strong> fees and comes from eVestment Alliance and/or the investment<br />
manager. This data is only shown through March <strong>2013</strong>.<br />
Exhibit 1<br />
RBC-GAM Performance for <strong>New</strong> Mexico PERA<br />
As <strong>of</strong> April 30, <strong>2013</strong><br />
Portfolio Name Market Value % MTD 3 Mo FYTD YTD 1 Year 3 Year 5 Year<br />
Since<br />
Incep. Inception Date<br />
Voyageur 195,557,113 1.48 (2.55) 4.49 19.31 9.97 17.44 16.75 11.46 8.92 01-Apr-2005<br />
Russell 2000 Grow th (0.66) 5.52 18.44 12.47 15.67 12.94 7.81 7.62<br />
Excess Return (1.90) (1.03) 0.88 (2.50) 1.77 3.81 3.65 1.30<br />
Exhibit 2<br />
RBC-GAM Small Cap Growth Equity Strategy (gross <strong>of</strong> fees)<br />
Annualized Performance<br />
As <strong>of</strong> March 31, <strong>2013</strong><br />
Annualized Returns<br />
1 Yr 3 Yr 5 Yr 7 Yr 10 Yr Oct '01<br />
RBC-GAM Small Cap Growth 21.03% 19.51% 13.12% 7.56% 12.96% 12.14%<br />
Russell 2000 Growth 14.52% 14.74% 9.04% 5.19% 11.61% 8.43%<br />
Difference 6.51% 4.77% 4.09% 2.37% 1.35% 3.71%<br />
Manager Update Memorandum Page 2 <strong>of</strong> 7<br />
© <strong>2013</strong> Cliffwater LLC. All rights reserved.
Exhibit 3<br />
RBC-GAM Small Cap Growth Equity Strategy (gross <strong>of</strong> fees)<br />
Calendar Year Performance<br />
As <strong>of</strong> March 31, <strong>2013</strong><br />
YTD <strong>2013</strong> 2012 2011 2010 2009 2008<br />
RBC-GAM Small Cap Growth 12.79% 21.57% 5.21% <strong>27</strong>.44% 33.94% -33.47%<br />
Russell 2000 Growth 13.20% 14.59% -2.92% 29.09% 34.47% -38.53%<br />
Difference -0.41% 6.99% 8.14% -1.65% -0.54% 5.06%<br />
2007 2006 2005 2004 2003 2002 Oct-Dec'01<br />
RBC-GAM Small Cap Growth 7.34% 6.69% 6.73% 19.53% 39.92% -9.30% 22.89%<br />
Russell 2000 Growth 7.02% 13.35% 4.15% 14.31% 48.53% -30.<strong>27</strong>% 26.17%<br />
Difference 0.32% -6.66% 2.58% 5.22% -8.61% 20.96% -3.28%<br />
Exhibit 4<br />
RBC-GAM Small Cap Growth Equity Strategy (gross <strong>of</strong> fees)<br />
Risk Statistics vs. Russell 2000 Growth Index<br />
As <strong>of</strong> March 31, <strong>2013</strong><br />
RBC-GAM Small Cap Growth<br />
vs. Russell 2000 Growth<br />
Return Risk<br />
Return /<br />
Risk<br />
Excess<br />
Return<br />
Excess<br />
Risk Info Ratio<br />
3 Yr 19.51% 16.61% 1.17 4.77% 5.33% 0.89<br />
5 Yr 13.12% 21.10% 0.62 4.09% 5.78% 0.71<br />
7 Yr 7.56% 18.82% 0.40 2.37% 5.62% 0.42<br />
10 Yr 12.96% 17.40% 0.75 1.35% 5.97% 0.23<br />
October 2001 (inception) 12.14% 17.48% 0.69 3.71% 6.75% 0.55<br />
Manager Update Memorandum Page 3 <strong>of</strong> 7<br />
© <strong>2013</strong> Cliffwater LLC. All rights reserved.
Exhibits 5 and 6 are “skill charts” which attempt to discern whether or not the manager’s outperformance<br />
is attributable to luck or skill. The blue line represents the manager’s gross <strong>of</strong> fees rolling three or five<br />
year performance relative to the Russell 2000 Growth Index. If the blue line is above 0, the manager has<br />
outperformed the index<br />
and conversely, if the blue line is below 0, the manager has underperformed the<br />
index. The black lines represent confidence bands at the 80% level which incorporate the manager’s<br />
tracking error (standard deviation <strong>of</strong> excess return) relative too the index. If the blue line is above the top<br />
black line, their outperformance can be attributable to skill. . Conversely, if the blue<br />
line is below the<br />
bottom black line, their underperformance can be attributable to a lack<br />
<strong>of</strong> skill. If the blue line<br />
is in<br />
between the two black<br />
lines, it is unclear whether or not their r relative performance is attributable to either<br />
luck or skill. These charts demonstrate that RBC-GAM has added alpha over most rolling three year and<br />
five year periods and has done so with skill recently.<br />
Exhibit 5<br />
RBC-GAM Small Cap Growth Equity Strategy (grosss <strong>of</strong> fees)<br />
Rolling Three-Year Returns<br />
October 2001<br />
through March <strong>2013</strong><br />
Manager Update Memorandum<br />
© <strong>2013</strong> Cliffwater LLC. All rights reserved.<br />
Page<br />
4 <strong>of</strong> 7
Exhibit 6<br />
RBC-GAM Small Cap Growth Equity Strategy (grosss <strong>of</strong> fees)<br />
Rolling Five-Year Returns<br />
October 2001<br />
through March <strong>2013</strong><br />
Manager Update Memorandum<br />
© <strong>2013</strong> Cliffwater LLC. All rights reserved.<br />
Page 5 <strong>of</strong> 7
Exhibit 7<br />
Performance Universe for Small Capp Growth Strategies<br />
Gross <strong>of</strong> Fees<br />
As <strong>of</strong> March 31, <strong>2013</strong><br />
Source: Evestment Alliance.<br />
Exhibit 8<br />
MPT Statisticss Universe for<br />
Small Cap Growth Strategies vs. Russell 2000 Growth Index<br />
Gross <strong>of</strong> Fees<br />
As <strong>of</strong> March 31, <strong>2013</strong><br />
Source: Evestment Alliance.<br />
Manager Update Memorandum<br />
© <strong>2013</strong> Cliffwater LLC. All rights reserved.<br />
Page<br />
6 <strong>of</strong> 7
Watch List Test<br />
As stated in PERA’s investment policy, the following represent guidelines to be used in making a<br />
recommendation to the Investment Committee with regards to placing a traditional manager on the Watch<br />
List:<br />
Test 1: If the manager’s rolling three-year return (gross <strong>of</strong> fees) falls below the rolling three-year<br />
return <strong>of</strong> the benchmark for three consecutive quarters.<br />
Test 2: If the managers rolling three year return for three consecutive quarters ranks in the bottom<br />
third <strong>of</strong> the Consultant’s peer group universe.<br />
As <strong>of</strong> March 31, <strong>2013</strong>, the strategy did not pass either Watch List Test.<br />
Exhibit 9<br />
Watch List Test 1:<br />
RBC-GAM Small Cap Growth Equity Strategy (gross <strong>of</strong> fees)<br />
Rolling Three Year Annualized Performance vs. Benchmark<br />
For Periods Ending 3/31/<strong>2013</strong>, 12/31/2012, and 9/30/2012<br />
3 Years<br />
ending<br />
3/31/<strong>2013</strong><br />
3 Years<br />
ending<br />
12/31/2012<br />
Exhibit 10<br />
Watch List Test 2:<br />
RBC-GAM Small Cap Growth Equity Strategy (gross <strong>of</strong> fees)<br />
Rolling Three Year Annualized Performance vs. Peer Group Universe<br />
For Periods Ending 3/31/<strong>2013</strong>, 12/31/2012, and 9/30/2012<br />
3 Years<br />
ending<br />
9/30/2012<br />
RBC-GAM Small Cap Growth 19.51% 17.69% 19.22%<br />
Russell 2000 Growth 14.74% 12.82% 14.18%<br />
Difference 4.77% 4.87% 5.04%<br />
3 Years<br />
ending<br />
3/31/<strong>2013</strong><br />
3 Years<br />
ending<br />
12/31/2012<br />
3 Years<br />
ending<br />
9/30/2012<br />
RBC-GAM Small Cap Growth 19.51% 17.69% 19.22%<br />
eVestment Alliance Small Cap Growth Equity Universe Median 16.02% 14.26% 15.85%<br />
RBC-GAM Rank in Universe 10 11 14<br />
Suggested Questions for the Investment Manager<br />
1) How do you think about diversification <strong>of</strong> the portfolio? Is a 75-stock portfolio concentrated<br />
enough?<br />
2) What interesting technological developments are providing investment opportunities in the<br />
healthcare and technology sectors?<br />
3) How has the portfolio changed in the last year?<br />
[As a reminder, we have not conducted full diligence on, or reviewed the legal documents for, this<br />
investment due to its legacy status in your portfolio.]<br />
Manager Update Memorandum Page 7 <strong>of</strong> 7<br />
© <strong>2013</strong> Cliffwater LLC. All rights reserved.
Kenneth A. Tyszko, CPA, CFA<br />
Managing Director, Senior Portfolio Manager<br />
Ken Tyszko is responsible for Small Cap Growth and SMID Cap Growth research and portfolio<br />
management. He joined RBC GAM-US in 2001. Ken previously served as a portfolio manager for<br />
Oberweis Asset Management, ABN AMRO Asset Management (USA) Inc., ABN AMRO Incorporated and<br />
Sears Investment Management Company. His background also includes experience at Main Hurdman,<br />
an international accounting and consulting firm. Ken earned a BS in accountancy from the University <strong>of</strong><br />
Illinois. He is a CFA charterholder. Ken is a member <strong>of</strong> the CFA Society <strong>of</strong> Chicago, the CFA Institute and<br />
the Illinois CPA Society. He has been a guest on Bloomberg Television, Bloomberg Radio, CNBC and<br />
WebFN.<br />
Bridget Tompkins<br />
Managing Director, Client Service Manager<br />
Bridget Tompkins is responsible for overseeing all aspects <strong>of</strong> the client experience for our public pension,<br />
corporate pension, and Taft-Hartley clients. Bridget has been with the firm since 1994. Before joining<br />
RBC GAM-US, she worked for formerly affiliated brokerage firm Dougherty, Dawkins, Strand & Bigelow.<br />
Bridget’s previous experience includes sales and marketing <strong>of</strong> various commodities. She has worked in<br />
the financial services industry since 1992. Bridget earned a BA from the College <strong>of</strong> St. Benedict.
<strong>Public</strong> <strong>Employees</strong> <strong>Retirement</strong> <strong>Association</strong> <strong>of</strong> <strong>New</strong> Mexico<br />
<strong>June</strong> <strong>27</strong>, <strong>2013</strong><br />
Presented By:<br />
Kenneth A. Tyszko, CPA, CFA<br />
Managing Director, Senior Portfolio Manager<br />
312-857-9533<br />
ken.tyszko@rbc.com<br />
Bridget A. Tompkins<br />
Managing Director, Client Service<br />
612-376-7056<br />
bridget.tompkins@rbc.com<br />
RBC Global Asset Management (U.S.) Inc.<br />
100 South Fifth Street, Suite 2300 • Minneapolis, MN 55402-1240<br />
612-376-7000 • 800-553-2143 • www.rbcgam.us
Firm Overview
Royal Bank <strong>of</strong> Canada<br />
Strength & Stability<br />
*Ratings: S&P: AA-, Moody's: Aa3 (Bloomberg, 3.31.13). Ranked 5 th largest bank in North America and 12 th globally based on market capitalization (Bloomberg, 3.31.13).<br />
Ranked 2 nd safest bank in North America and 15 th globally (Global Finance, April <strong>2013</strong>).<br />
All other data in U.S. dollars as <strong>of</strong> 3.31.13. Refer to disclosure page for more information on RBC GAM and its affiliates.<br />
3
Breadth <strong>of</strong> Investment Capabilities<br />
Strategies that Allow Us to Create Customized Client Solutions<br />
Not all strategies presented are currently sold in the U.S.<br />
4
Small Cap Growth Equity
Investment Team<br />
Investment experience and number <strong>of</strong> pr<strong>of</strong>essionals as <strong>of</strong> 3.31.13<br />
6
RBC GAM-US Small Cap Growth Equity Overview<br />
Philosophy and Style<br />
• Invest in pr<strong>of</strong>itable, high quality, small cap growth stocks<br />
• Long-term investment horizon (average annual turnover is approximately 15-20%)<br />
• Extremely focused on style consistency<br />
• Favorable upside/downside capture ratio<br />
Process<br />
• Bottom-up fundamental analysis focusing on industry leaders with strong financial characteristics<br />
• Focused sell discipline<br />
Portfolio Construction<br />
• Well diversified portfolio <strong>of</strong> 65-80 stocks<br />
• Broad industry and sector exposure<br />
• No portfolio dispersion<br />
7
Top Ten Holdings<br />
Small Cap Growth Equity<br />
Company Name<br />
% <strong>of</strong> Portfolio<br />
(excluding cash)<br />
Sector<br />
Company Description<br />
MWI Veterinary Supply Inc.<br />
2.9<br />
Health Care<br />
Veterinary product distribution<br />
Balchem Corp.<br />
2.4<br />
Materials<br />
Specialty chemicals<br />
United Natural Foods Inc.<br />
2.2<br />
Consumer Staples<br />
Food distribution<br />
PAREXEL International Corp.<br />
2.2<br />
Health Care<br />
Clinical research testing<br />
Medidata Solutions Inc.<br />
2.1<br />
Health Care<br />
Clinical research s<strong>of</strong>tware<br />
Gulfport Energy Corp.<br />
2.0<br />
Energy<br />
Oil & gas exploration and production<br />
TreeHouse Foods Inc.<br />
2.0<br />
Consumer Staples<br />
Private-label food products<br />
PriceSmart Inc.<br />
1.9<br />
Consumer Staples<br />
Warehouse club retailer<br />
Forum Energy Technologies Inc<br />
1.9<br />
Energy<br />
Oil services<br />
Interactive Intelligence Group Inc.<br />
1.8<br />
Information Technology<br />
Telecommunication s<strong>of</strong>tware and equipment<br />
Total<br />
21.4<br />
As <strong>of</strong> 5.31.13<br />
Portfolio holdings are based on a representative account and are subject to change. Such data may vary for each client in the strategy due to asset size, market conditions, client guidelines and diversity <strong>of</strong> portfolio<br />
holdings. The representative account is the account in the composite that RBC GAM-US believes most closely reflects the current portfolio management style for this strategy. Supplemental information on this page<br />
complements the Small Cap Growth Equity Composite presentation as provided in the “Performance Presentation & Disclosures” appendix to these materials.<br />
8
Portfolio Characteristics<br />
Small Cap Growth Equity<br />
<br />
<br />
Pr<strong>of</strong>itability<br />
Return on Equity (Trailing 12 Months)<br />
Net Pr<strong>of</strong>it Margin<br />
Fundamentals<br />
Long-Term Debt/Total Capitalization (Trailing 12 Months)<br />
Sales Growth (Trailing 5 Years)<br />
EPS Growth (Trailing 5 Years)<br />
Valuation<br />
Price/Earnings Ratio (Forward FY1)<br />
Price/Earnings Ratio (Forward FY2)<br />
Long-Term Future EPS Growth Rate<br />
Price/Earnings to Growth Ratio (Forward FY1)<br />
Price/Earnings to Growth Ratio (Forward FY2)<br />
Price/Cash Flow Ratio (Trailing 12 Months)<br />
Price/Sales Ratio (Trailing 12 Months)<br />
Other<br />
Weighted Average Market Capitalization (Millions)<br />
Median Market Capitalization (Millions)<br />
Number <strong>of</strong> Holdings (Excluding Cash)<br />
Small Cap Growth Equity<br />
11.7%<br />
6.0%<br />
13.8%<br />
13.9%<br />
10.6%<br />
25.9x<br />
21.3x<br />
16%<br />
1.6x<br />
1.3x<br />
15.1x<br />
1.8x<br />
$1,891<br />
$1,461<br />
77<br />
Russell 2000 Growth Index<br />
11.0%<br />
6.3%<br />
33.2%<br />
14.5%<br />
11.0%<br />
22.4x<br />
19.3x<br />
16%<br />
1.4x<br />
1.2x<br />
10.8x<br />
1.8x<br />
$1,850<br />
$705<br />
1,105<br />
As <strong>of</strong> 5.31.13<br />
Source: FactSet, Russell<br />
Portfolio characteristics are based on a representative account and are subject to change. Such data may vary for each client in the strategy due to asset size, market conditions, client guidelines and diversity <strong>of</strong> portfolio<br />
holdings. The representative account is the account in the composite that RBC GAM-US believes most closely reflects the current portfolio management style for this strategy. Supplemental information on this page<br />
complements the Small Cap Growth Equity Composite presentation as provided in the “Performance Presentation & Disclosures” appendix to these materials.<br />
9
Sector Weightings<br />
<strong>Public</strong> <strong>Employees</strong> <strong>Retirement</strong> <strong>Association</strong> <strong>of</strong> <strong>New</strong> Mexico<br />
May 31, <strong>2013</strong><br />
<strong>June</strong> 30, 2012<br />
<strong>June</strong> 30, 2005<br />
Sectors<br />
PERA NM<br />
Russell 2000<br />
Growth<br />
PERA NM<br />
Russell 2000<br />
Growth<br />
NM PERA<br />
Russell 2000<br />
Growth<br />
Information Technology<br />
28.5%<br />
21.1%<br />
26.1%<br />
22.1%<br />
23.2%<br />
24.7%<br />
Health Care<br />
21.0<br />
20.9<br />
24.8<br />
22.1<br />
23.2<br />
20.9<br />
Industrials<br />
18.5<br />
17.9<br />
16.3<br />
16.9<br />
15.5<br />
14.1<br />
Consumer Discretionary<br />
10.5<br />
16.3<br />
11.4<br />
16.1<br />
16.6<br />
17.3<br />
Consumer Staples<br />
7.2<br />
4.7<br />
5.8<br />
4.9<br />
2.8<br />
2.4<br />
Financials<br />
6.7<br />
7.8<br />
6.2<br />
6.8<br />
11.4<br />
10.0<br />
Energy<br />
5.2<br />
5.4<br />
6.0<br />
5.5<br />
5.0<br />
6.6<br />
Materials<br />
2.4<br />
4.8<br />
3.4<br />
4.2<br />
2.3<br />
3.1<br />
Telecommunication<br />
Services<br />
0.0<br />
0.8<br />
0.0<br />
1.1<br />
0.0<br />
0.9<br />
Utilities<br />
0.0<br />
0.3<br />
0.0<br />
0.3<br />
0.0<br />
0.0<br />
Source: RBC GAM-US, Russell<br />
10
May-13<br />
Mar-13<br />
Jan-13<br />
Nov-12<br />
11<br />
Sep-12<br />
Total Active Share – May 2009 through May <strong>2013</strong><br />
<strong>Public</strong> <strong>Employees</strong> <strong>Retirement</strong> <strong>Association</strong> <strong>of</strong> <strong>New</strong> Mexico<br />
94<br />
92<br />
90<br />
88<br />
May-09<br />
Jul-09<br />
Sep-09<br />
Nov-09<br />
Jan-10<br />
Mar-10<br />
May-10<br />
Jul-10<br />
Sep-10<br />
Nov-10<br />
Jan-11<br />
Mar-11<br />
May-11<br />
Jul-11<br />
Sep-11<br />
Nov-11<br />
Jan-12<br />
Mar-12<br />
May-12<br />
Jul-12<br />
Source: FactSet<br />
All material presented is compiled from sources believed to be reliable and current, but accuracy cannot be guaranteed.
Portfolio Holdings<br />
Small Cap Growth Equity<br />
Consumer Discretionary Financials Information Technology Health Care<br />
Buffalo Wild Wings Inc.<br />
Digital Generation Inc.<br />
Dorman Products Inc.<br />
Gentex Corp.<br />
Hibbett Sports Inc.<br />
K12 Inc.<br />
Monro Muffler Brake Inc.<br />
SHFL Entertainment Inc.<br />
True Religion Apparel Inc.<br />
Vitamin Shoppe Inc.<br />
Consumer Staples<br />
Natural Grocers by Vitamin Cottage Inc.<br />
PriceSmart Inc.<br />
TreeHouse Foods Inc.<br />
United Natural Foods Inc.<br />
Energy<br />
Forum Energy Technologies Inc.<br />
Gulfport Energy Corp.<br />
Swift Energy Co.<br />
Unit Corp.<br />
First Cash Financial Services<br />
HCC Insurance Holdings Inc.<br />
Portfolio Recovery Associates Inc.<br />
Tower Group International Ltd.<br />
Industrials<br />
Actuant Corp.<br />
Advisory Board Co.<br />
Applied Industrial Technologies Inc.<br />
Healthcare Services Group Inc.<br />
Huron Consulting Group Inc.<br />
Knight Transportation Inc.<br />
Landstar System Inc.<br />
Mistras Group Inc.<br />
Mobile Mini Inc.<br />
Proto Labs Inc.<br />
Simpson Manufacturing Co. Inc.<br />
Teledyne Technologies Inc.<br />
Tetra Tech Inc.<br />
TriMas Corp.<br />
Woodward Inc.<br />
Materials<br />
Balchem Corp.<br />
Aruba Networks Inc.<br />
Bottomline Technologies Inc.<br />
Cardtronics Inc.<br />
Cavium Inc.<br />
CommVault Systems Inc.<br />
Comtech Telecommunications Corp.<br />
Digital River Inc.<br />
Diodes Inc.<br />
DTS Inc.<br />
Global Payments Inc.<br />
Interactive Intelligence Group Inc.<br />
Manhattan Associates Inc.<br />
NIC Inc.<br />
Open Text Corp.<br />
Pegasystems Inc.<br />
Perficient Inc.<br />
Plexus Corp.<br />
R<strong>of</strong>in-Sinar Technologies Inc.<br />
ScanSource Inc.<br />
SciQuest Inc.<br />
Sourcefire Inc.<br />
SPS Commerce Inc.<br />
Ultimate S<strong>of</strong>tware Group Inc.<br />
Zebra Technologies Corp.<br />
Allscripts Healthcare Solutions Inc.<br />
Bio-Reference Labs Inc.<br />
Cantel Medical Corp.<br />
Cooper Cos. Inc.<br />
Integra LifeSciences Holdings Corp.<br />
Medidata Solutions Inc.<br />
Meridian Bioscience Inc.<br />
MWI Veterinary Supply Inc.<br />
Neogen Corp.<br />
NuVasive Inc.<br />
PAREXEL International Corp.<br />
Teleflex Inc.<br />
Vascular Solutions Inc.<br />
Volcano Corp.<br />
West Pharmaceutical Services Inc.<br />
As <strong>of</strong> 5.31.13<br />
Portfolio holdings are based on a representative account and are subject to change. Such data may vary for each client in the strategy due to asset size, market conditions, client guidelines and diversity <strong>of</strong> portfolio<br />
holdings. The representative account is the account in the composite that RBC GAM-US believes most closely reflects the current portfolio management style for this strategy. Supplemental information on this page<br />
complements the Small Cap Growth Equity Composite presentation as provided in the “Performance Presentation & Disclosures” appendix to these materials. There is no guarantee that the holdings <strong>of</strong> an actual account<br />
will always be identical to the holdings presented here. This presentation should not be construed as a recommendation to buy or sell any financial instruments. The information contained herein should not be relied upon<br />
as the sole investment-making decision.<br />
12
Portfolio Performance<br />
<strong>Public</strong> <strong>Employees</strong> <strong>Retirement</strong> <strong>Association</strong> <strong>of</strong> <strong>New</strong> Mexico<br />
35<br />
30<br />
31.3 30.9<br />
30.2<br />
31.1<br />
Market Value: $206,438,179<br />
Percentage (%)<br />
25<br />
20<br />
15<br />
10<br />
18.2<br />
16.1 15.6 16.5<br />
2.7<br />
12.812.6<br />
13.2<br />
12.4<br />
21.2 20.4<br />
17.5<br />
15.7<br />
11.1 10.4<br />
7.7<br />
7.2<br />
9.5<br />
9.0<br />
8.2<br />
7.4<br />
5<br />
2.9<br />
4.4<br />
3.6<br />
0<br />
YTD (5.31.13) 2QTD 1Q13 1 Year 3 Years 5 Years Since Inception<br />
(4.1.05)<br />
PERA NM (gross) PERA NM (net) Russell 2000 Grow th Index Russell 2000 Index<br />
As <strong>of</strong> 5.31.13<br />
Returns labeled “gross” are presented gross <strong>of</strong> management fees and include the reinvestment <strong>of</strong> all income. Returns labeled “net” are net <strong>of</strong> management fees and include the reinvestment <strong>of</strong> all income. All<br />
returns for periods greater than one year are shown on an annualized basis. Inception <strong>of</strong> the performance record is 4.1.05. Past performance is not a guarantee <strong>of</strong> future results.<br />
13
Returns Since Inception<br />
Small Cap Growth Equity<br />
35<br />
30<br />
31.1<br />
30.9<br />
31.1<br />
Consistent outperformance versus<br />
the Russell 2000 Growth Index<br />
over a complete market cycle<br />
25<br />
21.3<br />
Percentage (%)<br />
20<br />
15<br />
10<br />
5<br />
16.1<br />
18.2<br />
16.5<br />
2.9<br />
4.4<br />
3.6<br />
12.8<br />
13.2<br />
12.4<br />
17.5<br />
15.7<br />
11.1<br />
7.7<br />
7.2<br />
8.9<br />
7.0<br />
6.0<br />
11.9 12.2<br />
9.9 9.8<br />
8.7<br />
9.3<br />
0<br />
YTD<br />
(5.31.13)<br />
2QTD 1Q13 1 Year 3 Years 5 Years 7 Years 10 Years Since Inc.<br />
(10.1.01)<br />
Small Cap Growth Equity Composite (Gross) Russell 2000 Growth Index Russell 2000 Index<br />
As <strong>of</strong> 5.31.13<br />
Returns are presented gross <strong>of</strong> management fees and include the reinvestment <strong>of</strong> all income. The Russell 2000 Index is shown for illustrative purposes as representation <strong>of</strong> the broader market, but is not considered a<br />
benchmark for the strategy. All returns for periods greater than one year are shown on an annualized basis. Inception <strong>of</strong> the performance record is 10.1.01. The Small Cap Growth Equity composite is presented as<br />
supplemental to the “Performance Presentation & Disclosures” appendix to these materials. The appendix contains additional GIPS ® -required disclosures and important information regarding calculation <strong>of</strong> performance<br />
data and includes net <strong>of</strong> fees performance returns. Past performance is not a guarantee <strong>of</strong> future results.<br />
14
Transactions<br />
Small Cap Growth Equity<br />
<strong>2013</strong> Purchases:<br />
<strong>2013</strong> Sales:<br />
1Q<br />
Cardtronics Inc. (consumer financial services)<br />
1Q<br />
Cymer Inc. (semiconductor equipment)*<br />
Natural Grocers by Vitamin Cottage Inc. (specialty retail)<br />
PSS World Medical Inc. (healthcare product distribution)*<br />
Raymond James Financial Inc. (diversified financial services)**<br />
Valspar Corp. (paints and coatings)**<br />
2QTD<br />
Proto Labs Inc. (custom molded machine parts)<br />
2QTD<br />
Berry Petroleum* (oil & gas exportation production)<br />
TriMas Corp. (diversified industrial products)<br />
Unit Corp. (diversified energy operations)<br />
* Takeover<br />
** Market Cap<br />
As <strong>of</strong> 5.31.13<br />
This should not be construed as a recommendation to buy or sell any financial instruments.<br />
15
Risk-Adjusted Performance Ranking<br />
Small Cap Growth Equity<br />
3 Years<br />
5 Years<br />
7 Years<br />
10 Years<br />
Since<br />
Inc.<br />
3 Years<br />
5 Years<br />
7 Years<br />
10 Years<br />
Since<br />
Inc.<br />
Return<br />
Small Cap Growth Equity<br />
Universe Median<br />
Percentile<br />
19.5<br />
15.9<br />
7<br />
13.1<br />
9.6<br />
12<br />
7.6<br />
5.8<br />
19<br />
13.0<br />
12.5<br />
39<br />
12.1<br />
9.8<br />
11<br />
Tracking Error<br />
Small Cap Growth Equity<br />
Universe Median<br />
Percentile<br />
5.5<br />
5.0<br />
40<br />
5.0<br />
6.5<br />
79<br />
4.8<br />
6.4<br />
75<br />
6.1<br />
6.2<br />
54<br />
7.3<br />
6.9<br />
43<br />
Alpha<br />
Small Cap Growth Equity<br />
Universe Median<br />
Percentile<br />
6.9<br />
1.1<br />
3<br />
4.7<br />
0.8<br />
9<br />
2.5<br />
0.8<br />
20<br />
2.8<br />
1.3<br />
17<br />
4.6<br />
1.7<br />
5<br />
Batting Average<br />
Small Cap Growth Equity<br />
Universe Median<br />
Percentile<br />
66.7<br />
50.0<br />
19<br />
70.0<br />
55.0<br />
6<br />
64.3<br />
53.6<br />
14<br />
57.5<br />
55.0<br />
31<br />
58.7<br />
54.4<br />
<strong>27</strong><br />
Information Ratio<br />
Small Cap Growth Equity<br />
Universe Median<br />
Percentile<br />
Sharpe Ratio<br />
Small Cap Growth Equity<br />
Universe Median<br />
Percentile<br />
0.9<br />
0.2<br />
10<br />
1.0<br />
0.7<br />
3<br />
0.8<br />
0.1<br />
6<br />
0.6<br />
0.4<br />
6<br />
0.5<br />
0.1<br />
15<br />
0.3<br />
0.2<br />
13<br />
0.2<br />
0.2<br />
37<br />
0.6<br />
0.5<br />
9<br />
0.5<br />
0.2<br />
10<br />
0.5<br />
0.4<br />
1<br />
Standard Deviation<br />
Small Cap Growth Equity<br />
Universe Median<br />
Percentile<br />
Beta<br />
Small Cap Growth Equity<br />
Universe Median<br />
Percentile<br />
18.6<br />
23.8<br />
96<br />
0.78<br />
0.99<br />
95<br />
22.7<br />
26.7<br />
91<br />
0.85<br />
0.97<br />
85<br />
20.5<br />
24.1<br />
92<br />
0.86<br />
0.99<br />
87<br />
18.6<br />
22.5<br />
95<br />
0.81<br />
0.97<br />
94<br />
19.3<br />
23.4<br />
95<br />
0.78<br />
0.94<br />
94<br />
Repeatable process has generated<br />
superior risk-adjusted returns<br />
Downside Capture<br />
Small Cap Growth Equity<br />
Universe Median<br />
Percentile<br />
64.9<br />
96.7<br />
95<br />
77.9<br />
97.9<br />
89<br />
82.6<br />
100.6<br />
87<br />
78.4<br />
98.3<br />
87<br />
68.4<br />
93.1<br />
95<br />
As <strong>of</strong> 3.31.13<br />
Note: For definitions and additional information, see Definitions in the Appendix.<br />
Source: Zephyr StyleADVISOR, Universe is comprised <strong>of</strong> the eVestment Alliance (eA) Small Cap Growth Equity Universe. Percentile is based on the Universe.<br />
Performance rankings were calculated using RBC GAM-US returns that are presented gross <strong>of</strong> management fees and include the reinvestment <strong>of</strong> all income. All returns for periods greater than one year are shown on an<br />
annualized basis. Inception <strong>of</strong> the performance record is 10.1.01. The Small Cap Growth Equity composite is presented as supplemental to the “Performance Presentation & Disclosures” appendix to these materials. The<br />
appendix contains additional GIPS ® -required disclosures and important information regarding calculation <strong>of</strong> performance data and includes net <strong>of</strong> fees performance returns. Past performance is not a guarantee <strong>of</strong> future<br />
results.<br />
16
Risk vs. Return<br />
Small Cap Growth Equity<br />
Since Universe inception through 3.31.13<br />
Source: Zephyr StyleADVISOR, Universe is comprised <strong>of</strong> the eVestment Alliance (eA) Small Cap Growth Equity Universe.<br />
Returns are presented gross <strong>of</strong> management fees and include the reinvestment <strong>of</strong> all income. All returns for periods greater than one year are shown on an annualized basis. Inception <strong>of</strong> the performance record is<br />
10.1.01. The Small Cap Growth Equity composite is presented as supplemental to the “Performance Presentation & Disclosures” appendix to these materials. The appendix contains additional GIPS ® -required disclosures<br />
and important information regarding calculation <strong>of</strong> performance data and includes net <strong>of</strong> fees performance returns. Past performance is not a guarantee <strong>of</strong> future results.<br />
17
Risk Characteristics vs. Small Cap Growth Universe<br />
5 th Percentile<br />
12.80%<br />
4.61%<br />
0.62<br />
0.50<br />
1.17<br />
29.33%<br />
25 th Percentile<br />
11.05%<br />
3.00%<br />
0.40<br />
0.41<br />
1.02<br />
25.56%<br />
Median<br />
9.76%<br />
1.71%<br />
0.22<br />
0.35<br />
0.94<br />
23.37%<br />
75 th Percentile<br />
8.48%<br />
0.45%<br />
0.01<br />
0.28<br />
0.89<br />
22.37%<br />
95 th Percentile<br />
6.56%<br />
-1.50.%<br />
-0.25<br />
0.19<br />
0.77<br />
19.31%<br />
Small Cap Growth Equity (Gross)<br />
12.14%<br />
4.57%<br />
0.51<br />
0.54<br />
0.78<br />
19.28%<br />
Percentile<br />
11 th<br />
5 th<br />
10 th<br />
1 st<br />
94 th<br />
95 th<br />
Since inception through 3.31.13<br />
Source: Zephyr StyleADVISOR, Universe is comprised <strong>of</strong> the eVestment Alliance (eA) Small Cap Growth Equity Universe.<br />
Returns are presented gross <strong>of</strong> management fees and include the reinvestment <strong>of</strong> all income. All returns for periods greater than one year are shown on an annualized basis. Inception <strong>of</strong> the performance record is<br />
10.1.01. The Small Cap Growth Equity composite is presented as supplemental to the “Performance Presentation & Disclosures” appendix to these materials. The appendix contains additional GIPS ® -required disclosures<br />
and important information regarding calculation <strong>of</strong> performance data and includes net <strong>of</strong> fees performance returns. Past performance is not a guarantee <strong>of</strong> future results.<br />
18
Strong Downside Protection<br />
• The strategy has demonstrated lower volatility and downside protection by outperforming<br />
the benchmark 15 <strong>of</strong> the 17 quarters where the Russell 2000 Growth Index experienced<br />
negative performance since the strategy’s inception<br />
15%<br />
Down Quarters for the Russell 2000 Growth Index<br />
10%<br />
8.5%<br />
10.6%<br />
Small Cap Growth Excess Return vs. Index<br />
6.7%<br />
6.8%<br />
5%<br />
0%<br />
2.9%<br />
3.7%<br />
4.4%<br />
-0.4%<br />
0.5%<br />
-1.8%<br />
1.3%<br />
3.3%<br />
1.6%<br />
2.3% 2.2% 2.0%<br />
2.9%<br />
-5%<br />
1Q02 2Q02 3Q02 1Q03 3Q04 1Q05 2Q06 3Q06 4Q07 1Q08 3Q08 4Q08 1Q09 2Q10 2Q11 3Q11 2Q12<br />
Only down quarters illustrated above from 10/2001 through 3/<strong>2013</strong><br />
Source: RBC, Russell<br />
The stated benchmark for the strategy is the Russell 2000 Growth Index. The Russell 2000 Index is shown for illustrative purposes as representation <strong>of</strong> the broader market, but is not considered a benchmark for the<br />
strategy. Returns are presented gross <strong>of</strong> management fees and include the reinvestment <strong>of</strong> all income. Inception <strong>of</strong> the performance record is 10.1.01. The Small Cap Growth Equity composite is presented as<br />
supplemental to the “Performance Presentation & Disclosures” appendix to these materials. The appendix contains additional GIPS ® -required disclosures and important information regarding calculation <strong>of</strong> performance<br />
data and includes net <strong>of</strong> fees performance returns. Past performance is not a guarantee <strong>of</strong> future results.<br />
19
Russell 2000 Growth Index<br />
Sector Performance<br />
35<br />
<strong>27</strong>.6<br />
25<br />
Percentage (%)<br />
15<br />
5<br />
17.8<br />
14.2<br />
12.5<br />
11.1<br />
5.6<br />
8.5<br />
15.6 16.0<br />
16.8<br />
15.2<br />
14.1<br />
1.3<br />
18.5<br />
13.1<br />
11.0<br />
8.7<br />
16.2<br />
14.3<br />
10.4<br />
15.3<br />
13.4<br />
11.7<br />
5.0<br />
16.8<br />
12.9<br />
12.8<br />
11.2<br />
12.2<br />
10.8<br />
1.9<br />
18.1<br />
13 . 3<br />
10.3<br />
7.1<br />
8.1<br />
4.0<br />
1.0<br />
-0.4<br />
-5<br />
-11.2<br />
-15<br />
Consumer<br />
Discretionary<br />
Consumer<br />
Staples<br />
Energy Financials Health Care Industrials Information<br />
Technology<br />
Materials<br />
Telecomm<br />
Services<br />
Utilities<br />
QTD 1 Year 3 Years 5 Years<br />
As <strong>of</strong> 3.31.13<br />
Source: FactSet<br />
All material presented is compiled from sources believed to be reliable and current, but accuracy cannot be guaranteed.<br />
20
Attribution Analysis: 1 Year through 5.31.13<br />
<strong>Public</strong> <strong>Employees</strong> <strong>Retirement</strong> <strong>Association</strong> <strong>of</strong> <strong>New</strong> Mexico<br />
Sector<br />
Sector<br />
Allocation<br />
Security<br />
Selection<br />
Total<br />
Effect<br />
Consumer Discretionary<br />
-0.28<br />
-1.66<br />
-1.94<br />
Consumer Staples<br />
0.02<br />
-0.09<br />
-0.07<br />
Energy<br />
0.17<br />
1.47<br />
1.64<br />
Financials<br />
-0.06<br />
0.60<br />
0.54<br />
Health Care<br />
-0.01<br />
1.62<br />
1.61<br />
Industrials<br />
-0.11<br />
-2.49<br />
-2.60<br />
Information Technology<br />
-0.19<br />
1.52<br />
1.33<br />
Materials<br />
0.08<br />
0.39<br />
0.47<br />
Telecommunication Services<br />
0.02<br />
--<br />
0.02<br />
Utilities<br />
0.15<br />
--<br />
0.15<br />
Cash<br />
-0.71<br />
--<br />
-0.71<br />
Total<br />
-0.92<br />
1.36<br />
0.44<br />
As <strong>of</strong> 5.31.13<br />
Source: FactSet<br />
There is no guarantee that the holdings <strong>of</strong> an actual account will always be identical to the holdings presented here. This presentation should not be construed as a recommendation to buy or sell any financial<br />
instruments. The information contained herein should not be relied upon as the sole investment-making decision.<br />
21
Attribution Analysis: 1 Year through 5.31.13<br />
<strong>Public</strong> <strong>Employees</strong> <strong>Retirement</strong> <strong>Association</strong> <strong>of</strong> <strong>New</strong> Mexico<br />
Top 5 Stock Contributors:<br />
Company Name<br />
Contribution<br />
Bottom 5 Stock Contributors:<br />
Company Name<br />
Contribution<br />
Gulfport Energy Corp.<br />
2.10%<br />
Tractor Supply Co.<br />
-0.18%<br />
Medidata Solutions Inc.<br />
1.92%<br />
Catamaran Corp<br />
-0.18%<br />
CommVault Systems Inc.<br />
1.32%<br />
DTS Inc.<br />
-0.<strong>27</strong>%<br />
Balchem Corp.<br />
1.12%<br />
Swift Energy Co.<br />
-0.32%<br />
PAREXEL International Corp.<br />
1.07%<br />
Volcano Corp.<br />
-0.53%<br />
Contribution<br />
Sector Allocation<br />
-0.92%<br />
Security Selection<br />
1.36%<br />
Total Effect<br />
0.44%<br />
As <strong>of</strong> 5.31.13<br />
Source: FactSet<br />
There is no guarantee that the holdings <strong>of</strong> an actual account will always be identical to the holdings presented here. This presentation should not be construed as a recommendation to buy or sell any financial<br />
instruments. The information contained herein should not be relied upon as the sole investment-making decision.<br />
22
Attribution Analysis: Year Ended 12.31.12<br />
<strong>Public</strong> <strong>Employees</strong> <strong>Retirement</strong> <strong>Association</strong> <strong>of</strong> <strong>New</strong> Mexico<br />
Sector<br />
Sector<br />
Allocation<br />
Security<br />
Selection<br />
Total<br />
Effect<br />
Consumer Discretionary<br />
-0.05<br />
-0.47<br />
-0.52<br />
Consumer Staples<br />
0.05<br />
0.66<br />
0.71<br />
Energy<br />
0.48<br />
0.82<br />
1.30<br />
Financials<br />
-0.01<br />
0.42<br />
0.41<br />
Health Care<br />
0.09<br />
2.88<br />
2.97<br />
Industrials<br />
-0.08<br />
1.53<br />
1.45<br />
Information Technology<br />
0.02<br />
0.90<br />
0.92<br />
Materials<br />
0.02<br />
-0.05<br />
-0.03<br />
Telecommunication Services<br />
0.05<br />
--<br />
0.05<br />
Utilities<br />
0.09<br />
--<br />
0.09<br />
Cash<br />
-0.20<br />
--<br />
-0.20<br />
Total<br />
0.46<br />
6.69<br />
7.15<br />
As <strong>of</strong> 12.31.12<br />
Source: FactSet<br />
There is no guarantee that the holdings <strong>of</strong> an actual account will always be identical to the holdings presented here. This presentation should not be construed as a recommendation to buy or sell any financial<br />
instruments. The information contained herein should not be relied upon as the sole investment-making decision.<br />
23
Attribution Analysis: Year Ended 12.31.12<br />
<strong>Public</strong> <strong>Employees</strong> <strong>Retirement</strong> <strong>Association</strong> <strong>of</strong> <strong>New</strong> Mexico<br />
Top 5 Stock Contributors:<br />
Company Name<br />
Contribution<br />
Bottom 5 Stock Contributors:<br />
Company Name<br />
Contribution<br />
Catalyst Health Solutions Inc.<br />
2.19%<br />
Pegasystems Inc.<br />
-0.31%<br />
MWI Veterinary Supply Inc.<br />
1.50%<br />
Gentex Corp.<br />
-0.45%<br />
CommVault Systems Inc.<br />
1.28%<br />
True Religion Apparel Inc.<br />
-0.47%<br />
LKQ Corp<br />
1.16%<br />
Swift Energy Co.<br />
-0.49%<br />
Gulfport Energy Corp.<br />
0.98%<br />
Allscripts Healthcare Solutions Inc.<br />
-0.53%<br />
Contribution<br />
Sector Allocation<br />
0.46%<br />
Security Selection<br />
6.69%<br />
Total Effect<br />
7.15%<br />
As <strong>of</strong> 12.31.12<br />
Source: FactSet<br />
There is no guarantee that the holdings <strong>of</strong> an actual account will always be identical to the holdings presented here. This presentation should not be construed as a recommendation to buy or sell any financial<br />
instruments. The information contained herein should not be relied upon as the sole investment-making decision.<br />
24
RBC GAM-US Small Cap Growth Equity<br />
Market Environment<br />
Positives<br />
• U.S. GDP growth has been positive for the last fourteen quarters,<br />
with full year <strong>2013</strong> growth expected to be approximately 2.0%.<br />
Corporate earnings growth, high pr<strong>of</strong>it margins, and low interest<br />
rates present a favorable backdrop for equity investors.<br />
• The Federal Reserve will continue its $85 billion monthly bond<br />
buying program to keep interest rates low and encourage<br />
spending, borrowing, and investing. The Fed indicated that an<br />
accommodative policy will be in effect until the U.S. reaches a<br />
target unemployment rate <strong>of</strong> 6.5%, which is not anticipated to<br />
occur until 2015.<br />
• Corporations have cash balances <strong>of</strong> approximately $2.0 trillion<br />
that can be used for capital expenditures, acquisitions, stock<br />
buybacks, or dividend increases. Management teams are highly<br />
desirous <strong>of</strong> growing their businesses and are awaiting clarity from<br />
Washington regarding fiscal and budget issues, possible<br />
changes to tax laws, and potential new regulatory issues.<br />
• Overall prospects for U.S. economic growth are among the best<br />
in the developed world, and our portfolio companies are generally<br />
expected to show positive revenue and earnings growth in <strong>2013</strong>.<br />
Challenges<br />
• While the fiscal cliff saga reached a partial resolution at the end<br />
<strong>of</strong> 2012 with Congress agreeing to maintain existing income tax<br />
rates for close to 99% <strong>of</strong> all U.S. taxpayers, no agreement was<br />
reached on any type <strong>of</strong> entitlement reforms.<br />
• In <strong>2013</strong>, Congress will once again need to raise the U.S.<br />
government's debt ceiling. A final resolution may not easily be<br />
reached, potentially rattling financial markets and prompting<br />
further possible downgrades <strong>of</strong> U.S. debt by credit rating<br />
agencies.<br />
• Many states and municipalities are under severe budget<br />
pressures. With spending levels growing at a faster rate than<br />
revenues, many states are increasingly looking to raise taxes and<br />
fees in order to make up the shortfall, which places additional<br />
financial burdens on consumers and corporations.<br />
• Many investors are wary <strong>of</strong> investing in U.S. equities and<br />
continue to seek safety in short-term U.S. Treasury securities<br />
despite miniscule yields.<br />
As <strong>of</strong> 3.31.13<br />
25
Portfolio Pr<strong>of</strong>essionals<br />
Kenneth A. Tyszko, CPA, CFA<br />
Managing Director, Senior Portfolio Manager<br />
Ken Tyszko is responsible for Small Cap Growth and SMID Cap Growth research and portfolio management. He joined RBC GAM-US in<br />
2001. Ken previously served as a portfolio manager for Oberweis Asset Management, ABN AMRO Asset Management (USA) Inc., ABN<br />
AMRO Incorporated and Sears Investment Management Company. His background also includes experience at Main Hurdman, an<br />
international accounting and consulting firm. Ken earned a BS in accountancy from the University <strong>of</strong> Illinois. He is a CFA charterholder. Ken<br />
is a member <strong>of</strong> the CFA Society <strong>of</strong> Chicago, the CFA Institute and the Illinois CPA Society. He has been a guest on Bloomberg Television,<br />
Bloomberg Radio, CNBC and WebFN.<br />
Ryan H. Smith, CPA, CFA<br />
Portfolio Manager<br />
Ryan Smith provides fundamental research and portfolio management for our Small Cap Growth and SMID Cap Growth strategies. Before<br />
joining RBC GAM-US in 2007, Ryan spent three years as an equity research associate with William Blair & Company. He was a manager at<br />
Ernst & Young prior to working at William Blair. Ryan began his career in the investment industry in 2004. He earned a BS in Accountancy<br />
from Lehigh University and an MS in Accountancy from the University <strong>of</strong> Notre Dame. Ryan is a CFA charterholder and a member <strong>of</strong> the<br />
CFA Society <strong>of</strong> Chicago and the CFA Institute.<br />
Richard J. Drage, CPA, CFA<br />
Portfolio Manager<br />
Rich Drage provides fundamental research for our Small Cap Growth and SMID Cap Growth strategies. Rich joined RBC GAM-US in 2009<br />
from Susquehanna International Group, where he was a senior research analyst. Before that, he was a senior equity analyst at Neuberger<br />
Berman. Rich’s previous experience also includes various research and portfolio management responsibilities at Highbar Capital<br />
Management, Whitebox Advisors, Fasciano Company, and First Analysis Corporation. He began his career in the investment industry in<br />
1994. Rich earned a BA in Economics from Northwestern University and an MS in Accountancy from DePaul University. He is a CFA<br />
charterholder and a member <strong>of</strong> the CFA Society <strong>of</strong> Chicago and the CFA Institute.<br />
26
Portfolio Pr<strong>of</strong>essionals<br />
Jeff Nevins<br />
Senior Equity Analyst<br />
Jeff Nevins provides fundamental research for our small, SMID, and mid cap growth strategies. Before joining RBC GAM-US in <strong>2013</strong>, Jeff was<br />
a buy-side equity research analyst at Neuberger Berman. He has also served as a public and private equity research analyst for First Analysis<br />
Corporation and as a credit analyst for LaSalle Bank (Bank <strong>of</strong> America). Jeff began his career in the investment industry in 1998. He earned a<br />
BS in Finance with Honors from DePaul University and an MBA from Northwestern’s Kellogg School <strong>of</strong> Management. Jeff is a CFA<br />
charterholder as well as a member <strong>of</strong> the CFA Society <strong>of</strong> Chicago and the CFA Institute.<br />
Ryan Larson<br />
Head <strong>of</strong> Equity Trading<br />
Ryan Larson is responsible for trade execution and management for the firm’s equity division. Ryan works to determine which brokers and<br />
trading vehicles will achieve best execution for our clients. He also serves as a spokesperson raising the firm’s media pr<strong>of</strong>ile. Prior to joining<br />
RBC GAM-US in 2000, Ryan worked at Wells Fargo Investment Management & Trust. He began his career in the investment industry in 2000.<br />
Ryan earned a BS in Business Administration from Creighton University and an MBA from DePaul University Kellstadt Graduate School <strong>of</strong><br />
Business. He is a member <strong>of</strong> the Security Traders <strong>Association</strong> <strong>of</strong> Chicago. Ryan has been quoted in national and international publications<br />
such as The Wall Street Journal, the Financial Times, and The <strong>New</strong> York Times, and has been a guest on Bloomberg Radio and Television.<br />
Kristen Patrie<br />
Equity Trader<br />
Kristen Patrie is responsible for trade execution and management for the firm’s equity division. Kristen joined the RBC GAM-US in 2006 from<br />
Investors Bank & Trust Company, where she was the manager <strong>of</strong> domestic settlements for equity products. Before that, she was responsible<br />
for equity trading and worked to achieve best execution for all equity strategies at Snyder Capital Management. Kristen also served as a senior<br />
account administrator for Babson Capital Management. She began her career in the investment industry in 1994. Kristen earned a BS in<br />
Business Administration from Roger Williams University.<br />
<strong>27</strong>
Appendix
Performance Presentation & Disclosures Appendix<br />
Small Cap Growth Equity as <strong>of</strong> March 31, <strong>2013</strong><br />
N/A – Information is not statistically meaningful due to an insufficient number <strong>of</strong> portfolios in the composite for the entire year.<br />
Please note, on January 10, <strong>2013</strong> the Performance Presentation & Disclosure dated September 30, 2012 for the Small Cap Growth Equity composite was corrected. The composite returns were accurately presented, however,<br />
the disclosure on some marketing materials referenced a different composite.<br />
Effective January 1, 2012, RBC Global Asset management (U.S.) Inc. changed its firm definition for purposes <strong>of</strong> complying with the Global Investment Performance Standards (GIPS). These changes are reflected historically.<br />
Under the new definition, RBC GAM-US is consolidated under RBC Global Asset Management (RBC GAM).<br />
(Performance Presentation and Disclosures continued on the next page)<br />
29
Performance Presentation & Disclosures Appendix<br />
Small Cap Growth Equity as <strong>of</strong> March 31, <strong>2013</strong><br />
30
Definitions<br />
Alpha - measures the difference between an actual return for a stock or a portfolio and its equilibrium expected return.<br />
Batting Average - measures the success frequency <strong>of</strong> a manager. It is calculated by the number <strong>of</strong> periods when the manager returns<br />
are equal to or greater than the selected benchmark divided by the total number <strong>of</strong> periods in the analysis. The measure indicates a<br />
manager’s frequency <strong>of</strong> success, disregarding the degree <strong>of</strong> outperformance vs. the benchmark.<br />
Beta - measures the sensitivity <strong>of</strong> a stock’s return relative to the return <strong>of</strong> a selected market index. When beta is greater than one, it<br />
means a stock will rise or fall more than the market.<br />
Information Ratio - measures portfolio management’s performance against risk and return relative to a benchmark.<br />
Sharpe Ratio - measures the amount by which a set <strong>of</strong> values differs from the arithmetical mean, equal to the square root <strong>of</strong> the mean<br />
<strong>of</strong> the differences’ squares.<br />
Standard Deviation - measures the sensitivity <strong>of</strong> a stock’s return relative to the return <strong>of</strong> a selected market index. When beta is greater<br />
than one, it means a stock will rise or fall more than the market.<br />
Tracking Error - also known as the standard deviation <strong>of</strong> excess returns (both positive and negative), is a statistical measure <strong>of</strong> volatility<br />
and indicates ‘risk’ relative to a stated benchmark. A high Tracking Error indicates greater risk (but not necessarily greater return)<br />
relative to the stated benchmark.<br />
31
Disclosures<br />
This document (the “Presentation”) is being provided by RBC Global Asset Management to the party named on the cover page. Accordingly, this Presentation may<br />
not be reproduced in whole or part, and may not be delivered to any other person without the consent <strong>of</strong> RBC Global Asset Management. This Presentation is not a<br />
solicitation <strong>of</strong> any <strong>of</strong>fer to buy or sell any security or other financial instrument or to participate in any investment strategy and should not be construed as tax or legal<br />
advice.<br />
RBC Global Asset Management is the name used in the United States for certain investment advisory subsidiaries <strong>of</strong> the Royal Bank <strong>of</strong> Canada. RBC Global Asset<br />
Management (U.S.) Inc. (“RBC Global Asset Management – US” or “RBC GAM-US”) is a federally registered investment adviser founded in 1983.<br />
Past performance is not indicative <strong>of</strong> future results. There can be no guarantee that any investment strategy discussed in this Presentation will achieve its investment<br />
objectives. As with all investment strategies, there is a risk <strong>of</strong> loss <strong>of</strong> all or a portion <strong>of</strong> the amount invested. No chart, graph, or formula can by itself determine which<br />
securities an investor should buy or sell or which strategies should be pursued.<br />
This Presentation contains the current opinions <strong>of</strong> RBC Global Asset Management and is not intended to be, and should not be interpreted as, a recommendation <strong>of</strong><br />
any particular security, strategy or investment product. Not all products, services or investments described herein are available in all jurisdictions and some are<br />
available on a limited basis only, due to local regulatory and legal requirements. Unless otherwise indicated, all information and opinions herein are as <strong>of</strong> May 31,<br />
<strong>2013</strong> and are subject to change without notice.<br />
RBC Global Asset Management (“RBC GAM”) is the asset management division <strong>of</strong> Royal Bank <strong>of</strong> Canada (“RBC”) which includes RBC GAM-US, RBC Global Asset<br />
Management Inc., RBC Alternative Asset Management Inc., and BlueBay Asset Management LLP, which are separate, but affiliated corporate entities. ®/<br />
Trademark(s) <strong>of</strong> Royal Bank <strong>of</strong> Canada. Used under license. © <strong>2013</strong> RBC Global Asset Management (U.S.) Inc.<br />
32
RIO Legislative Change<br />
Implementation<br />
Vince Jaramillo, User Administrator<br />
Greg Portillos, Chief Information Officer<br />
<strong>June</strong> <strong>27</strong>, <strong>2013</strong>
RIO System Changes Required as<br />
a Result <strong>of</strong> Legislation<br />
PERA Staff are working with HP to ensure SB <strong>27</strong> changes<br />
are developed, tested and deployed into the RIO System<br />
by July 1 st . This is the most significant modification to RIO<br />
since the system went live in 2005.<br />
• Phase One:<br />
– Cost-<strong>of</strong> Living Adjustment<br />
– Wage and Contribution reporting (Tier 1 & Tier 2)<br />
– VFF – Increased pension amounts effective July 1st<br />
– 90% pension maximum effective July 1st
Outreach<br />
• Outreach Meetings and Employer Trainings: By July 1 st , PERA will have<br />
conducted 62 outreach meetings and employer trainings throughout the<br />
state. Preliminary numbers indicate that more than 1200 members have<br />
attended the meeting to date.<br />
• Member Correspondence: By July 1 st , PERA will have sent more than<br />
100,000 correspondence to our members with information about the<br />
changes resulting from SB <strong>27</strong>, as well as updated member handbooks and<br />
our website with important information.<br />
• La Voz <strong>New</strong>sletters Mailed<br />
• Website updated on continual basis.
Internal Planning<br />
• Change Requests (CCR)<br />
– COLA - Changes to be implemented by July 1, <strong>2013</strong>.<br />
– SB <strong>27</strong><br />
• Stage 1 to be implemented prior to July 1, <strong>2013</strong><br />
• Stage 2 to be implemented after July 1, <strong>2013</strong><br />
• Weekly Conference Calls with HP<br />
• PERA Legislation Group<br />
– Weekly Meetings<br />
– Email Distribution List
Weekly<br />
Progress<br />
Reports
Weekly Progress Reports
Requirements Document
Testing Progress<br />
• COLA – Testing began May 17, <strong>2013</strong> and will continue thru<br />
<strong>June</strong> 28, <strong>2013</strong>. Code will be deployed into RIO Production on<br />
<strong>June</strong> 29, <strong>2013</strong>.<br />
• SB <strong>27</strong> – Stage 1 Wage and Contribution reporting, testing<br />
began <strong>June</strong> 10, <strong>2013</strong> and will continue thru <strong>June</strong> 28, <strong>2013</strong>. Code<br />
will be deployed into RIO Production on <strong>June</strong> 29, <strong>2013</strong>. DFA and<br />
City <strong>of</strong> Albuquerque were successfully posted in the Test<br />
environment.<br />
• VFF – <strong>New</strong> pension amounts have been successfully tested and<br />
are ready for implementation.<br />
• 90% Pension Max – The new pension maximum has been<br />
successfully tested for all plans and is ready for implementation.
Employer Reporting<br />
• The “Physical Interface: Employer<br />
Reporting File” has been updated. This<br />
document is the guide used by employers<br />
for online reporting. All plans have been<br />
updated and a copy <strong>of</strong> the document has<br />
been provided to DFA, City <strong>of</strong> Albuquerque<br />
and Bernalillo County.
Implementation<br />
Milestones<br />
• COLA 4/8/13 – 7/19/13<br />
– Letter to Return to Work Retirees<br />
– COLA Website Updates<br />
– COLA PERA Staff Training<br />
– COLA ERB Automation<br />
– COLA Testing<br />
– COLA Production Deployment<br />
• SB <strong>27</strong> 4/8/13 – 6/28/13<br />
– SB <strong>27</strong> Website Updates<br />
– SB <strong>27</strong> PERA Staff Training<br />
– SB <strong>27</strong> Testing<br />
– SB <strong>27</strong> City <strong>of</strong> Albuquerque/Department <strong>of</strong> Finance and Administration<br />
– SB<strong>27</strong> Testing<br />
– SB<strong>27</strong> Production Deployment