Annual Report 2001 - Regional Ecosystem Office
Annual Report 2001 - Regional Ecosystem Office
Annual Report 2001 - Regional Ecosystem Office

Create successful ePaper yourself
Turn your PDF publications into a flip-book with our unique Google optimized e-Paper software.
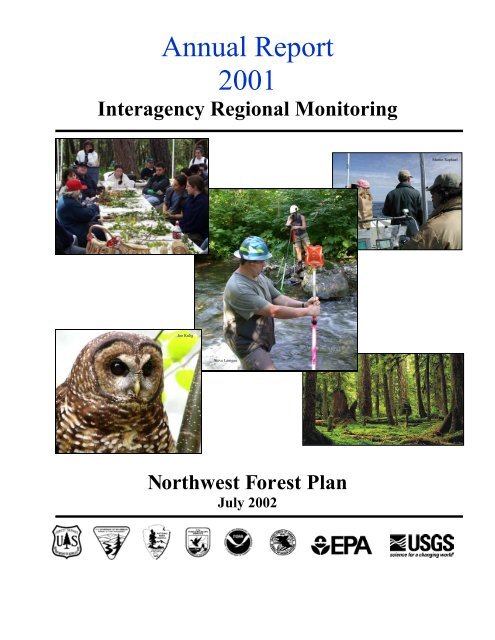
<strong>Annual</strong> <strong>Report</strong><br />
<strong>2001</strong><br />
Interagency <strong>Regional</strong> Monitoring<br />
Martin Raphael<br />
Joe Kulig<br />
Steve Lanigan<br />
Northwest Forest Plan<br />
July 2002
S<br />
ummary<br />
Eight federal agencies have developed an implementation and effectiveness monitoring program<br />
encompassing over 25 million acres of federal land managed by the Forest Service, Bureau of Land<br />
Management, and National Park Service in western Washington, Oregon, and northwest California. This<br />
monitoring is focused on important regional-scale questions about older forests, listed species (northern<br />
spotted owls, marbled murrelets), watershed condition, relations between federal agencies and Tribes,<br />
changing socio-economic conditions in communities closely tied to federal lands, and compliance with<br />
meeting Northwest Forest Plan (the Plan) standards and guidelines.<br />
The purpose of monitoring is to evaluate the success of the Northwest Forest Plan (NWFP) in achieving<br />
the objectives of:<br />
• Protecting and enhancing habitat for late-successional and old-growth forests (LSOG) and<br />
related species.<br />
• Restoring and maintaining the ecological integrity of watersheds and aquatic ecosystems.<br />
• Maintaining sustainable amounts of renewable resources and rural economies and<br />
communities.<br />
This report summarizes program management (pages 1-2) and budgets (page 3), and provides an<br />
overview of progress by each component of the monitoring program (pages 4-16). Accomplishments<br />
during the <strong>2001</strong> field season are highlighted, and the direction for future activities is described. The<br />
report concludes with a list of participants (pages 17-19) and recent reports (pages 20-22).<br />
Highlights from the report include the following monitoring efforts:<br />
i<br />
• Implementation--Overall compliance in meeting Northwest Forest Plan and Record of<br />
Decision standards and guidelines was 98% for the 21 projects and watersheds monitored (see<br />
pages 4-5).<br />
• Late-successional and old-growth--In <strong>2001</strong>, major progress in LSOG monitoring was made<br />
toward completing an existing vegetation map layer, launching change-detection work, and<br />
beginning the assembly and analysis of grid-plot-inventory databases (see pages 6-7).<br />
• Northern spotted owls--The percentage of female owls that nested across the eight areas<br />
ranged from 20 to 84.8%, and the number of young fledged per area ranged from 16 to 109.<br />
The total number of young fledged was 492, up 30% from the 2000 season (see pages 8-9).<br />
• Marbled murrelets--The population of marbled murrelets residing in the range of the Plan<br />
was estimated to be 21,200, and the 95% confidence interval ranged from 16,000 to 26,400<br />
(see pages 10-11).<br />
• Aquatic riparian--A pilot project in <strong>2001</strong> in 16 watersheds continued refining the datacollection<br />
protocols and answering other questions related to implementing the monitoring<br />
plan (see pages 12-13).<br />
• Social and economic--During <strong>2001</strong>, a Phase I report was completed that reviews available<br />
information and recommends developing a community-scale model and data-collection<br />
strategy (see page 14).<br />
• Tribal--A proposal was developed by an interagency workgroup to monitor tribal<br />
relationships and resource concerns of the 76 tribes in the Plan area (see page 15).<br />
• Monitoring Spotlight—Increasing numbers of barred owls have been found in northern<br />
spotted owl demographic study areas (see page 16).
P<br />
rogram Management<br />
Program management priorities for <strong>2001</strong> focused on staffing key positions, resolving the <strong>2001</strong> and<br />
forecasting the 2002 budgets, and establishing program direction from the <strong>Regional</strong> Interagency<br />
Executive Committee (RIEC) and the Interagency Monitoring Program Managers (MPM).<br />
The RIEC approved the MPM-recommended priorities and budget. In addition, they requested (Sept. 5,<br />
<strong>2001</strong>) that we pursue developing a watershed monitoring partnership with California, Oregon, and<br />
Washington and concurrently conduct a review of the northern spotted owl program.<br />
The MPM and the <strong>Regional</strong> Monitoring Team participated in a business requirements workshop (June 19,<br />
<strong>2001</strong>) to establish program priorities for the implementation phase of this program. The workshop<br />
addressed success measures, critical program clients, stakeholders, communication, products, operational<br />
procedures and monitoring issues like adaptive management and the relation of regional scale monitoring<br />
to local- and project-scale efforts. The workshop provided direction for near and long-term program<br />
implementation.<br />
Program Priorities<br />
1. Program priorities were established by the MPM and RIEC. Module accomplishments are<br />
discussed in the following pages. The priorities were to:<br />
• Ensure that RIEC-approved monitoring is implemented as intended in a cost-effective<br />
manner.<br />
• Complete the development of the tribal and socio-economic monitoring modules.<br />
• Complete a scientifically credible 10-year evaluation of the effectiveness of the Plan<br />
according to the approved regional monitoring framework.<br />
• Join forces with Washington, California, and Oregon state agencies and PACFISH to develop<br />
a unified regional monitoring approach for state and federal watershed monitoring.<br />
• Conduct a science-management review of the northern spotted owl monitoring program to<br />
improve efficiency and effectiveness of the monitoring program.<br />
• Conduct an assessment of the past 5-years of implementation monitoring activities and<br />
develop a strategy for the next 5 years.<br />
• Improve the integration of monitoring information in decision-making to enhance adaptive<br />
management.<br />
• Initiate information and decision-support needs assessments to assist in information<br />
management development.<br />
The 2004 Interpretive <strong>Report</strong><br />
Interpretive reports are produced on 5-year intervals and provide information critical to evaluating the<br />
effectiveness of the Northwest Forest Plan in achieving management goals. The first report is scheduled<br />
for 2004 and will report monitoring results on status and trends 10 years after implementation of the<br />
Northwest Forest Plan. There are few existing examples of interpretive reports for effectiveness<br />
monitoring. During <strong>2001</strong> the <strong>Regional</strong> Monitoring Team began to define the process for producing<br />
reports including a draft outline, milestones, and schedule. The <strong>Regional</strong> Monitoring Team expects to<br />
have the process defined and well documented, including detailed outlines for each section and detailed<br />
work plans for each module by August 2002.<br />
1
P<br />
Staffing<br />
rogram Management (continued)<br />
Three lead positions were filled: old-growth (LSOG), watershed (AREMP), and the information<br />
manager. The marbled murrelet (MAMU) lead transferred to Hawaii and a replacement was hired. The<br />
Aquatic Riparian (AREMP) module lead position was filled by an acting. Filling the socioeconomic and<br />
tribal leads will be delayed until the protocols are completed and approved by the RIEC (see organization<br />
chart on page 17).<br />
Information Resources<br />
The monitoring program initiated an analysis of information and decision support needs in <strong>2001</strong>.<br />
Documenting the monitoring questions, data and information requirements, and analysis needs has helped<br />
the program plan for the production of the 2004 interpretive report, its current highest priority. The<br />
Interagency Resource Information Coordinating Committee (IRICC) and the <strong>Regional</strong> <strong>Ecosystem</strong>s <strong>Office</strong><br />
(REO) GIS staff participated in the analysis and continue to assist with the monitoring programs efforts to<br />
develop and implement a long-term information management strategy. Requirements for a GIS interface<br />
tool that supports analysis and spatial summary of Current Vegetation Survey (CVS) and Forest Inventory<br />
and Analysis (FIA) data were defined. Funding was approved for a proof of concept application to be<br />
developed in 2002.<br />
Other Highlights<br />
• RIEC approved the AREMP module and directed the MPM to implement.<br />
• MPM met frequently (about every six weeks) with the RMT to ensure this interagency program<br />
was effectively implemented and funded.<br />
• Based on RIEC priorities the northern spotted owl module was fully funded for FY02 and FY03.<br />
• AREMP was only partially funded for FY02 pending results of partnership possibilities with the 3<br />
states (first ever meeting with three states held in November <strong>2001</strong>).<br />
• Excellent progress was made in outlining scope, timeline, and work plans for completing the tenyear<br />
interpretive report.<br />
• Adaptive Management: A team from PNW, OSU, and management agencies was formed to<br />
explore ways to improve our understanding and processes for integrating the results of<br />
monitoring into the decision-making process.<br />
Budget<br />
The approved monitoring program budget for <strong>2001</strong> was $5.96 million (M); Implementation – $239<br />
thousand (K); Northern spotted owl – $2.40M; LSOG – $411K; Marbled murrelet – $1.19M; Aquatic<br />
Riparian – $1.43M; Socioeconomic – $140K; Biodiversity – $35K; Tribal – $10K; and Program and<br />
information management – $165K. Contributing agencies were the Bureau of Land Management, Forest<br />
Service Regions 5 and 6, National Park Service, US Fish and Wildlife Service, Pacific Northwest<br />
Research Station, Pacific Southwest Research Station, US Geological Survey, US Environmental<br />
Protection Agency, National Marine Fisheries Service, and the Washington State Department of Natural<br />
Resources (see budget chart).<br />
The budget request for 2002 was $7.45M (Sept. 5, <strong>2001</strong> RIEC meeting) and the approved (Dec. 4, 2002<br />
RIEC meeting) budget for 2002 was $6.30M. Allocations for all module budgets were reduced except<br />
Northern Spotted Owl. Northern Spotted Owl was increased slightly ($2.5M) to maintain fieldwork at all<br />
eight demography study areas.<br />
2
BUDGET - NWFP INTERAGENCY MONITORING PROGRAM<br />
Contribution<br />
NWFP Monitoring - Priorities Needs BLM R-5 R-6 NPS FWS PNW PSW USGS EPA NMFS WDNR Total<br />
Program Manager 115 115 115<br />
Info Mgr 50 50 50<br />
TOTAL 165 0 0 165 0 0 0 0 0 0 0 0 165<br />
Implementation Lead 109 109 109<br />
<strong>Regional</strong> IMT 130 40 30 30 30 130<br />
MODULE TOTAL 239 149 30 30 0 30 0 0 0 0 0 0 239<br />
NSO Lead 60 60 60<br />
Demography 2099 600 415 944 140 2099<br />
Predictive models 239 139 100 239<br />
MODULE TOTAL 2398 660 415 944 140 0 139 0 100 0 0 0 2398<br />
LSOG/IVMP Lead 100 100 100<br />
Remote Sens. PNW 70 70 70<br />
GIS/Analyst 40 40 40<br />
IVMP contr., misc. 201 64 137 201<br />
MODULE TOTAL 411 64 0 347 0 0 0 0 0 0 0 0 411<br />
MaMu Lead 100 100 100<br />
Population 613 40 251 157 90 75 613<br />
Habitat modeling 266 70 15 92 89 266<br />
Vegetation Plots 250 160 160<br />
MODULE TOTAL 1229 200 70 0 0 366 249 179 0 0 0 75 1139<br />
AREMP Lead 90 90 90<br />
Analytical Frmwrk 202 89 55 144<br />
Watershed Sampling 1,203 200 259 424 50 80 1013<br />
Aquatic Verts. 179 79 100 179<br />
MODULE TOTAL 1674 200 259 514 50 0 89 0 134 80 100 0 1426<br />
Socio-econ Status <strong>Report</strong> 140 50 90 140<br />
MODULE TOTAL 140 0 0 50 0 0 90 0 0 0 0 0 140<br />
Biodiversity Plan 35 35 35<br />
MODULE TOTAL 35 0 0 0 0 0 35 0 0 0 0 0 35<br />
Tribal Implement Phase I 100 10 10<br />
Analysis/reporting 0<br />
MODULE TOTAL 100 0 0 0 0 0 0 0 0 10 0 0 10<br />
Totals 6391 1273 774 2050 190 396 602 179 234 90 100 75 5888<br />
% contributed fy01 21.6 13.1 34.8 3.2 6.7 10.2 3.0 4.0 1.5 1.7 100.0<br />
3
I<br />
mplementation Monitoring<br />
The <strong>2001</strong> field season marked the 6 th consecutive year of the Northwest Forest Plan implementation<br />
monitoring program. This program is designed to determine whether the Record of Decision and its<br />
corresponding Standards and Guides are consistently followed across the range of the Plan. The <strong>2001</strong><br />
program was designed to sample 24 randomly selected 5 th -field watersheds (2 per province) and 24<br />
specific projects (1 per randomly selected watershed). The fire season and subsequent rehabilitation<br />
efforts, however, prevented monitoring three watersheds and associated projects in eastern Washington.<br />
The projects monitored were in several land-use allocations (Table 1). Each project dealt with activities<br />
related to fuel reduction, roads, special forest products, cellular site development, river deflectors or<br />
timber sales. Standardized questionnaires were used to determine whether the watershed-scale<br />
assessments and projects were meeting the Standards and Guides provided in the Record of Decision.<br />
Highlights<br />
As in previous years, the results from both the watershed-scale monitoring and the project reviews<br />
indicate a high degree of compliance with meeting the Standards and Guidelines. Highlights from the<br />
watershed-scale monitoring include the following:<br />
Implementation Monitoring Fifth Field<br />
• Watershed analyses were completed for 18<br />
Watersheds for <strong>2001</strong><br />
of 21 watersheds, and three of these<br />
analyses had been updated;<br />
• Riparian reserve widths had not been<br />
modified in any of the watersheds;<br />
• Road mileages were reduced, since 1994,<br />
11% in key watersheds (12) and 6.9% in 5 th<br />
field watersheds (15);<br />
• Assessments were completed for all of the<br />
late-successional reserves (19) in the<br />
sampled watersheds;<br />
• Project review results showed general<br />
compliance of 98 percent with Standards<br />
and Guides. The compliance of the 21<br />
projects reviewed ranged from 91 to 100%<br />
with 13 projects being 100% compliant;<br />
• Negative biological effects associated with<br />
instances of noncompliance appeared to be<br />
minimal at the regional scale. Where<br />
noncompliance was found, the local effects<br />
were judged to be generally low to<br />
moderate;<br />
• In FY01, implementation monitoring was<br />
requested to collect information for the<br />
Survey and Manage Program in order to<br />
determine compliance with meeting the<br />
Standards and Guidelines contained in the<br />
Survey and Manage Record of Decision. Eighteen watersheds contained Known Sites and<br />
existing Species’ Management Recommendations were used to manage these sites.<br />
4
Table 1. Compliance by individual categories identified in the project review questionnaire<br />
Categories in the questionnaire Met Not<br />
met<br />
Number of responses<br />
Not<br />
capable*<br />
Percentage<br />
compliance**<br />
All land use allocations 95 1 99<br />
Late-successional reserves and managed<br />
late-successional reserves 85 4 96<br />
Aquatic conservation strategy, watershed<br />
analysis, and riparian reserves 312 2 99<br />
Matrix 54 2 3 97<br />
Adaptive management areas 18 1 95<br />
Research 6 100<br />
Species 28 4 100<br />
Total of the 21 projects reviewed 598 10 7 98<br />
* Not Capable: Physical site limitations prohibit true compliance or meeting the Standard and Guideline (e.g.- no existing<br />
snags or lack of sufficient material for coarse woody debris).<br />
** Percentage Compliance = (number Met + number not capable)/(number met + number not capable + number not<br />
met)x 100 %. Responses of met, and not capable were considered to have met the compliance criteria (from a biological<br />
perspective) associated with Record of Decision Standards and Guides.<br />
Looking Ahead<br />
Although room for improvement exits, none of the deficiencies noted in this report warrant<br />
recommending major corrective actions or operational shifts by land management agencies. Local Forest<br />
Service and Bureau of Land Management units are aware of specific, local noncompliance findings and<br />
are expected to take corrective action. Several have already done so.<br />
Several programmatic actions called for in the Record of Decision have yet to be accomplished. These<br />
include addressing roads in riparian reserves for compliance with aquatic conservation objectives and<br />
evaluating and mitigating existing recreation facilities in riparian reserves. These deficiencies point to the<br />
need for clarifying or adding direction from the agencies, the <strong>Regional</strong> <strong>Ecosystem</strong> <strong>Office</strong>, or both.<br />
Contact Information<br />
For more information on implementation monitoring contact:<br />
Dave Baker, IM Module Leader, Bureau of Land Management, 777 NW Garden Valley Blvd, Roseburg,<br />
OR 97470, 541-464-3223, Email: d1baker@or.blm.gov<br />
Website: www.reo.gov/monitoring/implementation<br />
5
L<br />
ate-successional and Old-growth<br />
The purpose of the late-successional and old-growth effectiveness monitoring module is to assess the<br />
status and trends of these forests to determine if the Plan will achieve its planned goals and objectives for<br />
protecting and enhancing late-successional and old-growth forest and related species on Federal lands in<br />
the range of the northern spotted owl.<br />
Major components of this monitoring module are to:<br />
• Map existing forest vegetation from remote sensing to generate consistent coverages for the Plan<br />
area. Canopy cover, tree size, and stand structure are mapped within physiographic provinces by<br />
the interagency vegetation mapping project (IVMP) in Oregon and Washington, and CALVEG in<br />
California. Forest vegetation maps will be analyzed to evaluate the acreages and distribution<br />
(stand size and arrangement) of late-successional and old-growth forests.<br />
• Conduct statistical analysis of stand-scale inventory data to provide information about structural<br />
attributes and composition that remote sensing cannot detect. Inventory data can also be used to<br />
report acres of late-successional and old-growth forests at regional scales with a known degree of<br />
Completion status of<br />
existing vegetation maps<br />
by physiographic province<br />
statistical reliability. Relating mapped vegetation attributes and<br />
sample-based measurements can help to describe structural<br />
conditions of vegetated landscapes at regional scales. Field<br />
data for monitoring is from the Forest Inventory and Analysis<br />
program (FIA) and the Current Vegetation Survey (CVS).<br />
• Monitoring for trends requires establishing baseline<br />
conditions, and a means of tracking changes from the baseline.<br />
Change detection tracks losses and gains in forest conditions<br />
from a variety of sources—management, natural succession,<br />
wildfire, insects, and diseases. Remote sensing change<br />
detection will be used to track large-scale changes (standreplacing<br />
disturbances) at periodic intervals (about every 5<br />
years).<br />
Physiographic Province<br />
Status<br />
1. Washington Olympic Peninsula Complete<br />
2. Washington Western Lowlands Complete<br />
3. Washington Western Cascades Complete<br />
4. Washington Eastern Cascades Complete<br />
5. Oregon Coast Range Complete<br />
6. Oregon Willamette Valley Dec 2002<br />
7. Oregon Western Cascades Complete<br />
8. Oregon Eastern Cascades Aug 2002<br />
9. Oregon Klamath Oct 2002<br />
10. California Coast Range Complete<br />
11. California Klamath Complete<br />
12. California Cascades Complete<br />
6
Highlights<br />
• Existing vegetation maps have been completed for 9 of 12<br />
provinces, with a target completion date of December 31, 2002, for<br />
all provinces.<br />
• Statistical analysis was piloted for the current vegetation survey<br />
databases for classifying inventory plots based on plot and tree-list<br />
attributes into late-successional and old-growth classes. A unified<br />
approach to incorporate FIA data is being developed.<br />
Old-growth forests in the<br />
Northwest Forest Plan area<br />
typically display a multilayered,<br />
multi-species<br />
canopy dominated by large<br />
overstory trees.<br />
• A remote-sensing change detection program was initiated in<br />
Oregon and Washington. The first map update incorporating 5-yr<br />
change has been completed for the 3 California provinces.<br />
• The year <strong>2001</strong> marked a major milestone for the late-successional<br />
and old-growth monitoring program’s planning and development.<br />
A module leader was hired in December 2000. An implementation<br />
strategy was prepared to plot an overall approach to monitoring<br />
these forests. The implementation strategy discusses short- and<br />
long-term program objectives, major analytic approaches, a course<br />
for benchmarking progress, and annual and periodic reporting of<br />
the monitoring, and program management needs, such as staffing<br />
and budgeting.<br />
Looking Ahead<br />
Tom Kogut<br />
Full-scale analysis will begin in FY 2002 using vegetation maps completed and analytical approaches<br />
developed in FY <strong>2001</strong>. The late-successional and old-growth chapter of the 2004 monitoring interpretive<br />
report will contain a complete analysis of baseline conditions summarized from existing vegetation maps<br />
and from first-occasion grid-plot inventory data. It will also contain a first approximation of trends<br />
(observed changes from baseline condition) using available updated map and inventory information. It<br />
will address interpretive links between monitoring results and the expectations of the plan to address<br />
management-related questions, such as the efficacy of the late-successional reserve network.<br />
This monitoring module will provide technical consultation for spatial and map analysis for the other<br />
monitoring modules (especially the northern spotted owl, marbled murrelet, and watershed monitoring).<br />
The late-successional and old-growth module will develop pilot approaches and provide guidance for<br />
developing rule sets and image processing techniques for deriving data on owl habitat, murrelet habitat,<br />
and watershed vegetation conditions from the IVMP, CALVEG, and other map data.<br />
Contact Information<br />
For more information on the Late-successional and Old-growth Module contact:<br />
Melinda Moeur, LSOG Module Leader, USDA Forest Service, 333 SW First Ave., PO Box 3623,<br />
Portland, OR 97208-3623, 503-808-2811; Email: mmoeur@fs.fed.us<br />
Website: www.reo.gov/monitoring/og<br />
7
N<br />
orthern Spotted Owl<br />
The <strong>2001</strong> field season marked the 8 th year of monitoring the population of northern spotted owls (Strix<br />
occidentalis caurina) under the Northwest Forest Plan. The purpose of the northern spotted owl<br />
effectiveness monitoring plan is to assess trends in spotted owl populations and their habitat relative to<br />
meeting the Plan goal. The primary goal is to evaluate the Plan’s success in arresting the downward trend<br />
in spotted owl populations and in maintaining and restoring the habitat necessary to support viable<br />
populations on federally administered forests throughout the owl's range.<br />
Northern Spotted Owl<br />
Demographic Study Areas<br />
The primary objectives are to:<br />
• Assess changes in population trend and demographic<br />
performance of spotted owls on federally administered<br />
forests in the owl’s range.<br />
• Assess changes in the amount and distribution of nesting,<br />
roosting, foraging habitat, and dispersal habitat for spotted<br />
owls on federally administered forest lands.<br />
The cornerstones of the spotted owl effectiveness monitoring strategy<br />
are population and habitat assessment. Integrating data from<br />
population and habitat monitoring is being explored through research<br />
to develop predictive models (that is, predicting owl population status<br />
from the state of the habitat).<br />
Highlights<br />
Highlights from the northern spotted owl effectiveness monitoring<br />
activities include the following:<br />
• Surveys of the eight demography study areas in <strong>2001</strong><br />
recorded information on occupancy, survival, and<br />
reproduction from nearly 1100 spotted owl sites. Spotted<br />
owl pairs were present at 52.1% of these sites (Table 2).<br />
• The percentage of female owls that nested across the eight<br />
areas ranged from 20 to 84.8 % and the number of young<br />
fledged per area ranged from 16 to 109. The total number<br />
of young fledged was 492, up 30% from the 2000 season.<br />
• Work on developing a habitat map was begun for the western Cascades in Oregon under the<br />
predictive model-development program. The preliminary rule set for the CALVEG map data<br />
was developed for the owl habitat map in the California portion of the Klamath Province.<br />
• The predictive model-development research project completed several data analyses in the<br />
Roseburg portion of the Oregon Coast Range and initiated Phase II of the project in the Western<br />
Cascades Province in Oregon. Two major tasks were to be completed from Phase I that were not<br />
done at the time of the Phase I progress report: variance components analyses for survival and<br />
productivity models, and estimating habitat fitness potential (8 H ). Both of these analyses were<br />
finished for the Roseburg BLM study area in <strong>2001</strong>.<br />
8
• In <strong>2001</strong>, survival and productivity were modeled for the H.J. Andrews study area by using an<br />
aerial photo-based map, the interagency vegetation mapping project (IVMP) map, and a satellite<br />
image map. The survival modeling is essentially complete, and variance-components analyses for<br />
the best-survival model will be the focus of work in 2002.<br />
Table 2. Summary of northern spotted owl occupancy and reproduction by demography area for<br />
<strong>2001</strong>. This is preliminary data; values may change in the final analysis.<br />
Demographic area Sites surveyed<br />
(number)<br />
Sites with a territorial pair<br />
(number) (%)<br />
Females nesting<br />
(%)*<br />
Young fledged<br />
(number)<br />
Olympic Peninsula 138 68 49.3 41.1 42<br />
Cle Elum 71 23 32.4 73.9 26<br />
H.J. Andrews 162 95 58.6 48.0 81<br />
North Coast 204 94 46.1 84.8 109<br />
Roseburg 131 72 54.9 81.2 85<br />
South Cascades 153 77 50.3 20.0 16<br />
Klamath 142 87 61.3 73.9 82<br />
NW California 94 55 58.5 53.7 51<br />
TOTALS 1095 571 52.1<br />
_____<br />
492<br />
* Female Nesting %: based upon number of territorial females monitored for nesting activity.<br />
Looking Ahead<br />
In 2002, additional steps will be taken towards completing the spotted<br />
owl chapter of the Northwest Forest Plan Monitoring Interpretive<br />
<strong>Report</strong> scheduled for release in 2004. Planning includes a workshop to<br />
analyze population data and steps to map and analyze the status and<br />
trend in maintaining and restoring owl habitat under the Plan.<br />
Collecting northern spotted<br />
owl weight data.<br />
Contact Information:<br />
For more information on the Northern Spotted Owl Module contact:<br />
Joe Lint, NSO Module Leader, Bureau of Land Management, 777<br />
Garden Valley Blvd, Roseburg, OR 97470, 541-464-3288, Email:<br />
joseph_lint@or.blm.gov<br />
Website: www.reo.gov/monitoring/nso<br />
Janice Reid<br />
9
M<br />
arbled Murrelets<br />
Survey data from <strong>2001</strong> represent only the second year of population monitoring data collected under the<br />
effectiveness monitoring program. The purpose of the marbled murrelet effectiveness monitoring plan is<br />
to assess trends in marbled murrelet (Brachyramphus marmoratus) populations and their nesting habitat<br />
throughout the Plan’s range. This program has two components: population monitoring at sea, and<br />
monitoring of nesting habitat at inland forest sites.<br />
The objectives of the population monitoring component are to estimate the size of the population residing<br />
in the coastal waters adjacent to the Plan area and assess trends in population size over time. Each<br />
objective provides results in each of five murrelet conservation zones and also across the range of the Plan<br />
(that is, across all five conservation zones in the Plan area).<br />
The objectives of the Program’s habitat monitoring are to establish a credible nesting-habitat baseline, as<br />
well as to assess status and trends of marbled murrelet nesting habitat in the Plan area. One type of<br />
predictive model being developed is the habitat relation model. The goal is to develop a single,<br />
Marbled Murrelet<br />
Zones<br />
statistically derived Plan-wide predictive model of murrelet nesting habitat.<br />
Its specific objectives are to collect information on murrelet habitat<br />
characteristics from a random sample of occupied and unoccupied (or, in<br />
California, random) sites in each physiographic province; to derive and<br />
compile for each site vegetation and fragmentation data from remote imagery<br />
developed by the interagency vegetation mapping project (IVMP); and to<br />
build predictive statistical models of marbled murrelet habitat associations<br />
based on data sets developed in the first two objectives.<br />
Highlights<br />
Highlights of the marbled murrelet effectiveness monitoring program include<br />
the following:<br />
• Murrelet populations were surveyed were conducted from mid-May<br />
through late July in <strong>2001</strong> in all five of the murrelet conservation zones<br />
in the Plan area. The population of marbled murrelets that resides in<br />
that area was estimated to be 21,200, and the 95% confidence interval<br />
ranged from 16,000 to 26,400 (Table 3).<br />
• The density of marbled murrelets was highest in zone 3 (the Oregon<br />
Coast north of Coos Bay), and the population of murrelets was highest<br />
in zone 1 (Puget Sound and the Strait of Juan de Fuca in Washington).<br />
Murrelet zones in WA,<br />
OR and CA are shown<br />
in red. Zones 1-5 are in<br />
the Northwest Forest<br />
Plan area.<br />
10<br />
• The <strong>2001</strong> population estimate overlaps the population estimate from<br />
2000 (18,100 murrelets, with a 95% confidence interval ranging from<br />
13,000 – 23,200). Given the amount of variability in the estimates,<br />
there is no evidence of a change in population numbers from 2000 to<br />
<strong>2001</strong>.<br />
• As part of the habitat-monitoring program, vegetation and habitat data<br />
(such as canopy cover and number of crown layers) were collected<br />
from 51 sites and 428 plots during <strong>2001</strong>. These sites were in 4 of the<br />
12 provinces in the plan (Olympic, Oregon Coast, Klamath, and<br />
California Coast). A suite of individual tree measurements (e.g., DBH,
number of platforms, crown diameter) were also collected from ca. 10,500 trees across the four<br />
provinces.<br />
Table 3. Summary of marbled murrelet population statistics for the <strong>2001</strong> breeding season across<br />
conservation zones 1-5.<br />
Looking Ahead<br />
Population parameter<br />
Estimate<br />
Area (km 2 ) 8,811<br />
Density (number of birds/km 2 ) 2.4<br />
Coefficient of variation of density (%) 12.5<br />
Population estimate 21,200<br />
95% confidence interval on population estimate 16,000 – 26,400<br />
Now is too soon to detect biologically meaningful changes in estimates of either density or population<br />
size. For example, power analyses conducted at the end of the 2000 survey season showed that at least 8<br />
years may be needed to detect an annual decline in the population of 10% with a reasonable degree of<br />
statistical certainty.<br />
No analyses of previously collected habitat data have been<br />
conducted because the data are not yet complete. Data must<br />
still be collected from 126 sites in five additional provinces<br />
during the 2002 field season.<br />
Conducting marbled murrelet surveys.<br />
Surveying populations and collecting nesting-habitat data<br />
will continue in 2002. No major changes in methods or<br />
sampling designs are scheduled. <strong>Annual</strong> reports are<br />
anticipated for the 2002 and 2003 field seasons. The full<br />
monitoring interpretive report is scheduled for completion in<br />
2004; it will include analyses of both population and nesting<br />
habitat data.<br />
Contact Information<br />
For more information on the marbled murrelet module contact:<br />
Patrick Jodice (Prior to Oct. 1, 2002) Marbled Murrelet<br />
Module Leader, US Fish and Wildlife Service, Portland, OR,<br />
Phone: 541-750-7393, Email: jodicep@ucs.orst.edu<br />
Martin Raphael<br />
Nesting marbled murrelet<br />
Paul Phifer (After Oct. 1, 2002) US Fish and Wildlife<br />
Service, Portland, OR, Phone: 503-872-2823, Email:<br />
Paul_Phifer@r1.fws.gov<br />
Website: www.reo.gov/monitoring/murrelet<br />
Tom Hammer<br />
11
Aquatic<br />
Riparian<br />
The purpose of Aquatic Riparian Effectiveness Monitoring Plan (AREMP) Module is to assess the<br />
ecological condition of watersheds by evaluating status and trends in watershed, stream and riparian<br />
conditions. Specific objectives are to assess aquatic, riparian, and upslope ecosystems; develop<br />
ecosystem management decision support models to refine indicator interpretation; develop predictive<br />
models to improve the use of monitoring data; provide information for adaptive management by analyzing<br />
trends in watershed condition and identifying elements that result in poor watershed condition; and<br />
provide a framework for adaptive monitoring at the regional scale.<br />
A pilot project was conducted in <strong>2001</strong> in 16 watersheds to continue the refinement of the data collection<br />
protocols and to answer other questions related to implementing the monitoring plan. Questions were<br />
addressed about data collection and quality control and a draft decision support model to synthesize data<br />
was developed. Full implementation program costs were refined and meetings with state agency<br />
personnel to discuss how to coordinate monitoring efforts were begun.<br />
Highlights<br />
Highlights of the <strong>2001</strong> pilot program:<br />
• It was concluded that intensive surveys<br />
characterize watershed in-channel<br />
conditions similarly to extensive basinwide<br />
surveys. For example, habitat<br />
indicators such as bankfull width-todepth<br />
ratio, entrenchment ratio, wood<br />
frequency, and substrate were not<br />
significantly different in the two<br />
surveys. Large-pool frequency was<br />
marginally significantly higher in the<br />
intensive surveys than in the extensive<br />
survey. Intensive surveys were also<br />
found to have less variability, so they<br />
will be more sensitive to detecting<br />
changes in watershed condition.<br />
Intensive surveys are also more cost<br />
effective than extensive basinwide<br />
surveys because less sampling is<br />
required.<br />
Location of the sixteen 6 th -field watersheds sampled<br />
during <strong>2001</strong>. Federal lands within the Northwest<br />
Forest Plan area appear as green shading.<br />
• A data quality assurance (QA) program<br />
was developed and implemented. It was<br />
concluded that the original and quality<br />
assurance surveys were not<br />
significantly different for any of the<br />
in-channel attributes examined.<br />
12
• Vegetation composition for riparian and upslope areas<br />
was determined by using data layers developed by the<br />
Interagency Vegetation Mapping Project for Oregon<br />
and Washington and CalVeg in California.<br />
A laser rangefinder was used to<br />
measure stream channel profile.<br />
• The stream GIS layer was buffered 100 m on each side<br />
and overlaid with the roads layer to calculate road<br />
density (miles of road per square mile of watershed) for<br />
both upslope (>100 m from stream) and riparian areas<br />
(
Social<br />
and Economic<br />
The purpose of the social and economic effectiveness monitoring module is to assess the status and trends<br />
of social and economic effects of federal forest management on local communities in the Pacific<br />
Northwest. Accordingly, the program should track indicators that describe social and economic changes<br />
at the local community scale, and identify credible links between federal forest management and such<br />
changes.<br />
Highlights<br />
Highlights of social and economic effectiveness monitoring include the following:<br />
• During <strong>2001</strong>, our team focused on identifying and refining monitoring design options. In this<br />
effort, the team worked with researchers at the University of Washington, under a cooperative<br />
agreement administered by the US Geologic Survey.<br />
• Overcoming incompatibilities between published data and agency information needs has been a<br />
constant consideration. Federal and state government agencies including the US Census, US<br />
Bureau of Labor Statistics, and state employment departments publish credible data tracking of<br />
numerous social and economic indicators. Issues of scale and timeliness, however, pose a<br />
challenge in using published data to obtain meaningful results. For example, much economic data<br />
is reported at the county scale. Rural residents may not consider county boundaries meaningful in<br />
describing their local communities, however.<br />
• Costs and other issues associated with collecting primary data at the local community scale have<br />
been a second critical concern. During <strong>2001</strong>, the team carefully considered a community-scale<br />
individual-survey approach, but rejected it as infeasible because of high cost and significant<br />
operational drawbacks.<br />
Looking Ahead<br />
Developing the monitoring program has progressed in two parts. During <strong>2001</strong>, Phase I was completed.<br />
The Phase I report reviews available information, and recommends developing a community-scale model<br />
and data-collection strategy. Work in 2002 will focus on clarifying monitoring objectives, completing<br />
and revising the monitoring framework, and finalizing data collection and analysis protocols. A final<br />
framework document outlining options for monitoring is expected in 2002.<br />
Contact Information<br />
For more information on the social and economic effectiveness monitoring module contact:<br />
Susan Charnley, Social and Economic Module Lead, PNW, 620 SW Main, Suite 400, Portland, OR 97205<br />
503-808-2051; Email: scharnley@fs.fed.us<br />
Claudia Stuart, Social and Economic Coordinator, USDA Forest Service, USFS Genetic Resource Center,<br />
2741 Cramer Lane, Chico, CA 95928 530-879-6608; Email: cstuart@fs.fed.us<br />
Website: www.reo.gov/monitoring/socio<br />
14
T ribal Relations<br />
The Plan area has 76 American Indian tribal governments that federal agencies are required to consult<br />
with on a government-to-government basis. This consultation is to ensure that tribal rights and interests<br />
are considered in decisions. To evaluate agency performance and, ultimately, to improve government-togovernment<br />
relations, a monitoring program has been designed.<br />
The purpose of the tribal relations module is to determine the effectiveness of federal agency consultation<br />
with Indian tribes on a government-to-government basis and if tribes are able to access resources to<br />
exercise their treaty and other rights and interests.<br />
Highlights<br />
A pilot study was designed and implemented to<br />
determine the most effective approach to monitoring.<br />
The study included feedback from tribal governments,<br />
the Interagency Advisory Committee, and tribal<br />
relations experts.<br />
Looking Ahead<br />
The monitoring program is scheduled for implementing<br />
in 2002 through interviews using a standardized<br />
questionnaire. Its purpose is to obtain information from<br />
all tribes about the effectiveness of agency efforts.<br />
A local federal line officer and agency tribal relations<br />
program staff will meet with tribal government leaders<br />
and staff to complete the interview. Most often, the<br />
federal representative is from the USDA Forest Service<br />
or USDI Bureau of Land Management. Interviews will<br />
be repeated at least every 3 years for each of the 76<br />
tribes in western Washington and Oregon and<br />
northwest California.<br />
Tribal elder describes traditional medicine<br />
and spiritual plants still used by tribal<br />
members in today’s modern world.<br />
The results of the interviews will be used to describe long-term regional patterns in tribal relations and to<br />
provide immediate feedback for improving them. Opportunities for partnerships and improved relations<br />
are ultimately expected; these improvements may then lead to improvements in management decisions.<br />
Contact Information<br />
For more information on the tribal relations effectiveness monitoring module contact:<br />
Les McConnell, Module Coordinator, USDA Forest Service, 33 SW First Ave. Portland, OR 97208-3623,<br />
503-808-2603, Email: lmcconnell@fs.fed.us<br />
Sonia Tamex, USDA Forest Service, 1323 Club Drive, Vallejo, CA 94592, 707-562-8919, Email:<br />
stamez@fs.fed.us<br />
Bruce Crespin, BLM, 915 N. Walla Walla, Wenatchee, WA 98801 509-665-2100, Email:<br />
bcrespin@wa.blm.gov<br />
Website: www.reo.gov/monitoring/tribal<br />
15
M<br />
onitoring Spotlight<br />
Barred Owls<br />
Barred owls (Strix varia) and their relation to northern spotted owl site occupancy and productivity<br />
received continued attention in the monitoring program. These data are gathered along with the spotted<br />
owl surveys, so the costs for data gathering is minimal and may be important to explaining spotted owl<br />
occupancy, or the lack thereof, in otherwise suitable habitat.<br />
Several of the study areas reported “increasing numbers of barred owls” and barred owl occupancy of<br />
sites previously occupied by spotted owls. In the Olympic National Park portion of the Olympic<br />
Peninsula Demography Study Area, barred owls were recorded at 23 sites in <strong>2001</strong>. Eight of these<br />
detections were pairs. Barred owl reproduction was confirmed at two sites. No hybridization with<br />
spotted owls was documented in <strong>2001</strong> in the Park. Farther south in the range, in the Klamath and Tyee<br />
(Roseburg) demography-study areas, more than 50 non-juvenile barred owls were detected in <strong>2001</strong>.<br />
Reproduction in barred owl pairs was documented, as was hybridization of a male spotted owl with a<br />
female barred owl. The graph showing numbers of barred owls detected over time in the Tyee density<br />
study area is indicative of the trend seen in other study areas (Figure 1).<br />
Figure 1. Barred owl detections in the Tyee demographic study area, Roseburg, Oregon 1989-<strong>2001</strong>.<br />
16
Interagency <strong>Regional</strong> Monitoring Program Team<br />
June 2002<br />
<strong>Regional</strong> Interagency Executive Committee<br />
RIEC<br />
Lisa Freedman, Chair<br />
Interagency Monitoring Program Managers<br />
(MPM)<br />
(Representing 8 Federal Agencies)<br />
Jon R. Martin<br />
Program Manager<br />
(FS)<br />
Bruce Bingham<br />
Assistant Program Manager<br />
(FS)<br />
Roberto Morganti<br />
GIS Coordinator<br />
(FS)<br />
Melinda Moeur<br />
Vegetation/LSOG<br />
(FS)<br />
Joe Lint<br />
Northern Spotted Owl<br />
(BLM)<br />
Pat Jodice<br />
Murrelet<br />
(FWS)<br />
David Baker<br />
Implementation<br />
(BLM)<br />
Steve Lanigan, Acting<br />
Watershed<br />
(FS)<br />
Susan Charnley<br />
Socio-Economic<br />
(FS-PNW)<br />
Tribal Monitoring<br />
Les McConnell, Coordinator<br />
FS-R6<br />
Province Teams<br />
GIS<br />
Ecological Analysis<br />
8 demographic area teams<br />
Habitat modelling group<br />
5 at-sea survey teams<br />
3 terrestrial habitat teams<br />
12 Province Teams<br />
Liang Hsin; Mario Mamone<br />
<strong>Regional</strong> advisory group<br />
Travelling <strong>Regional</strong><br />
Monitoring Crew<br />
Science teams<br />
Team<br />
Sonia Tamez, FS-R5<br />
Bruce Crespin, BLM<br />
<strong>2001</strong> Monitoring-Program Participants 1<br />
Interagency Monitoring-Program Managers (MPM)<br />
Lisa Freedman (Chair) USFS-R6 lfreedman@fs.fed.us<br />
Dave Busch USGS dbusch@or.blm.gov<br />
Becky Gravenmier 2 PNW bgravenmier@fs.fed.us<br />
Monty Knudsen USFWS monty_knudsen@fws.gov<br />
George Lottritz USFS-R5 glottritz@fs.fed.us<br />
Garland Mason PSW gmason@fs.fed.us<br />
Ken Mabery NPS kmabery@nps.gov<br />
Neal Middlebrook BLM nmiddlebrook@or.blm.gov<br />
Steve Morris NMFS Steve.Morris@noaa.gov<br />
Dave Powers EPA powers.david@epa.gov<br />
Interagency <strong>Regional</strong> Monitoring Team (RMT)<br />
Jon Martin, manager USFS–R6 jrmartin@fs.fed.us 503-808-2269<br />
Dave Baker, implementation BLM d1baker@or.blm.gov 541-464-3223<br />
Bruce Bingham, assistant program manager USFS–R6 bbingham@fs.fed.us 503-808-2251<br />
Patrick Jodice, marbled murrelets USFWS jodicep@ucs.orst.edu 503-872-2826<br />
Joe Lint, northern spotted owls BLM jlint@or.blm.gov 541-464-3288<br />
Steve Lanigan, 2 watershed USFS–R6 slanigan@fs.fed.us 503-808-2261<br />
Les McConnell, tribal USFS–R6 mcconnell@fs.fed.us 503-808-2603l<br />
Melinda Moeur, vegetation USFS–R6 mmoeur@fs.fed.us 503-808-2811<br />
Claudia Sturart, socio-economic 2 (<strong>2001</strong>) USFS-R6 cstuart@fs.fed.us 530879-6608<br />
Susan Charnley, socio-economic PNW scharnley@fs.fed.us 530-808-2051<br />
1 Agency abbreviations are given at the end of the report.<br />
2 Acting<br />
17
Implementation Monitoring Module<br />
Dave Baker, IM Module Leader, BLM, Roseburg, OR<br />
<strong>Regional</strong> Implementation Monitoring Team<br />
Kathleen Jordan, Shasta-Trinity National Forest, CA<br />
Liang Hsin, BLM, Portland, OR<br />
Mario Mamone, USFWS, Portland, OR<br />
Craig Snider, USFS-R6, Portland, OR<br />
Provincial Implementation Monitoring Team Leaders<br />
Dave Braley, Siuslaw National Forest, OR<br />
Laura Chapman, Six Rivers National Forest, CA<br />
Gery Ferguson, Deschutes National Forest, OR<br />
Neal Forrester, Willamette National Forest, OR<br />
Bob Gunther, BLM, Coos Bay, OR<br />
Ward Hoffman, Olympic National Forest, WA<br />
Arlene Kallis, Shasta-Trinity NF, CA<br />
Jodi Leingang, Wenatchee National Forest, WA<br />
John Roland, Gifford Pinchot National Forest, WA<br />
Bill Ramos, Mt-Baker National Forest, WA<br />
Carolyn Sands, BLM, Salem District, OR<br />
Mike Van Dame, Mendocino National Forest, CA<br />
Late-Successional and Old-Growth Effectiveness Monitoring Module<br />
Melinda Moeur, Late-Successional Old-Growth Module<br />
Leader, USFS-R6, Portland OR<br />
Old-Growth Scientific and Management Team<br />
Bruce Bingham, USFS-R6, Portland OR<br />
Tom DeMeo, USFS-R6, Portland OR<br />
Ken Denton, USFS-R6, Portland OR<br />
Miles Hemstrom, PNW, Portland, OR<br />
Tom Spies, PNW, Corvallis, OR<br />
Ralph Warbington, USFS-R5, Sacramento, CA<br />
Vegetation Change Detection Team<br />
Warren Cohen, PNW, Corvallis, OR<br />
Sean Healey, PNW, Corvallis, OR<br />
Lisa Levien, USFS-R5, Sacramento, CA<br />
Inventory Data Team<br />
Jim Alegria, BLM, Portland, OR<br />
Kevin Casey,USFS-R5, Sacramento, CA<br />
Andy Gray, PNW, Portland, OR<br />
Karen Waddell, PNW, Portland, OR<br />
Ralph Warbington, USFS-R5, Sacramento, CA<br />
Interagency Vegetation Mapping Project Team<br />
Jim Alegria, BLM, Portland, OR<br />
Julie (O’Neil) Browning, Titan, Portland, OR<br />
Warren Cohen, PNW, Corvallis, OR<br />
Tom DeMeo, USFS-R6, Portland OR<br />
Craig Ducey, Titan, Portland, OR<br />
Karin Fassnacht, PNW, Corvallis, OR<br />
Chris Grob, Titan, Portland, OR<br />
KC Kroll, Titan, Portland, OR<br />
Melinda Moeur, USFS-R6, Portland OR<br />
Jeff Nighbert, BLM, Portland, OR<br />
Tom Spies, PNW, Corvallis, OR<br />
Dale Weyermann, PNW, Portland, OR<br />
CALVEG Team<br />
Hazel Gordon, USFS-R5, Sacramento, CA<br />
Brian Schwind, USFS-R5, Sacramento, CA<br />
Ralph Warbington, USFS-R5, Sacramento, CA<br />
Northern Spotted Owl Effectiveness Monitoring Module<br />
Joe Lint, NSO Monitoring Module Leader, BLM,<br />
Roseburg, OR<br />
Population Monitoring<br />
Steve Ackers, Oregon State Univ., Corvallis, OR<br />
Steve Andrews, Oregon State Univ., Corvallis, OR<br />
Robert Anthony, USGS, Corvallis<br />
Eric Forsman, PNW, Corvallis, OR<br />
Alan Franklin; USGS, Fort Collins, CO<br />
Scott Gremel, Olympic National Park, WA<br />
Rocky Gutierrez, University of Minnesota<br />
Patti Happe, Olympic National Park, WA<br />
Rob Horn, BLM, Roseburg, OR<br />
Chris Larson, BLM, Medford, OR<br />
Pete Loschl, Oregon State Univ., Corvallis, OR<br />
Frank Oliver, BLM, Roseburg, OR<br />
David Pavlacky; University of Minnesota<br />
Janice Reid, PNW, Roseburg, OR<br />
Jim Swingle, Oregon State Univ., Olympia, WA<br />
Stan Sovern, Oregon State Univ., Cle Elum, WA<br />
Habitat Map Development and Habitat Monitoring<br />
Ray Davis, Umpqua National Forest, OR<br />
Joseph Lint, BLM, Roseburg, OR<br />
Barry Mulder, USFWS, Portland, OR<br />
Martin Raphael, PNW, Olympia, WA<br />
Lynn Roberts, USFWS, Arcata, CA<br />
Elaine Rybak, USFS-R6, Portland, OR<br />
Predictive Model Development<br />
Robert Anthony, USGS, Corvallis, OR<br />
Elizabeth Glenn, Oregon State Univ., Corvallis, OR<br />
Gail Olson; USGS, Corvallis, OR<br />
William Ripple, Oregon State Univ., Corvallis, OR<br />
18
Marbled Murrelet Effectiveness Monitoring Module<br />
Patrick G.R. Jodice, Module Leader, USFWS, Portland<br />
OR<br />
Population Monitoring<br />
Jim Baldwin, PSW, Albany, CA<br />
Tim Max, PNW, Portland, OR<br />
Sherri Miller, PSW, Arcata, CA<br />
Ken Ostrom, USFWS, Portland, OR (currently Cody, WY)<br />
C.J. Ralph, PSW, Arcata, CA<br />
Martin Raphael, PNW, Olympia, WA<br />
Craig Strong, Crescent Coastal Research, Astoria, OR<br />
Chris Thompson, WDFW, Mill Creek WA<br />
Habitat Monitoring<br />
Jim Baldwin, PSW, Albany, CA<br />
Diane Evans Mack, PNW, Olympia, WA<br />
Tim Max, PNW, Portland, OR<br />
Sherri Miller, PSW, Arcata, CA<br />
Kim Nelson, Researcher, Oregon State University<br />
Ken Ostrom, USFWS, Portland, OR (currently Cody, WY)<br />
Randall Wilk, PNW, Olympia, WA<br />
Key Partners<br />
Gary Falxa USFWS, Arcata, CA<br />
Beth Gallaher, PNW, Olympia, WA<br />
Bill Hoggeboom, PSW, Aracta, CA<br />
Monty Knudsen, USFWS, Portland, OR<br />
Melinda Moeur, USFS-R6, Portland, OR<br />
Amanda Wilson, Oregon State University, Corvallis, OR.<br />
Aquatic Riparian Effectiveness Monitoring Module<br />
Steve Lanigan, Acting Module Leader, USFS-R6, Portland<br />
OR<br />
Peter Eldred, USFS-R6, Corvallis OR<br />
Kirsten Gallo, BLM, Corvallis OR<br />
Chris Moyer, BLM, Corvallis OR<br />
<strong>Regional</strong> Interagency Advisory Team (RIAT)<br />
Dave Busch, USGS-BRD, Portland, OR<br />
Barry Collins, CDFG, Fortuna, CA<br />
Bruce Davies, NWIFC, Olympia, WA<br />
Al Doelker, BLM, Portland, OR<br />
Dave Fuller, BLM, Arcata, CA<br />
Joseph Furnish, USFS-R5, Vallejo, CA<br />
Mike Furniss, PNW, Corvallis, OR<br />
Reed Glesne, NPS, Sedro-Wolley, WA<br />
Bob Gresswell, USGS-BRD, Corvallis, OR<br />
Gretchen Hayslip, EPA, Seattle, WA<br />
Dave Heller, USFS-R6, Portand, OR<br />
Terry Hofstra, NPS, Crescent City, CA<br />
Dave Hohler, USFS, Corvallis, OR<br />
Phil Kaufmann, EPA, Corvallis, OR<br />
Deborah Konoff, USFS-R6, Portland, OR<br />
Kim Kratz, NMFS, Portland, OR<br />
Phil Larsen, EPA, Corvallis, OR<br />
Steve Leider, WDFW, Olympia, WA<br />
Rosy Mazaika, BLM, Portland, OR<br />
Bruce McCammon, USFS-R6, Portland, OR<br />
Bruce McIntosh, ODFW, Corvallis, OR<br />
John Meyner, NPS, Port Angeles, WA<br />
Joe Moreau, BLM, Portland, OR<br />
Kathy Moynan, USFWS, Portland, OR<br />
Tony Olsen, EPA, Corvallis, OR<br />
Dave Powers, EPA, Corvallis, OR<br />
Steve Ralph, EPP, Seattle, WA<br />
John Rector, USFS-R5, Vallejo, CA<br />
Gordie Reeves, USFS-PNW, Corvallis, OR<br />
Keith Reynolds, USFS-PNW, Corvallis, OR<br />
Dave Schuett-Hames, NWIFC, Olympia, WA<br />
George Smith, Intertribal Timber Council, Portland, OR<br />
Gary Stacey, CDFG, Redding, CA<br />
Larry Week, CDFG, Sacramento, CA<br />
Social and Economic Effectiveness Monitoring Module<br />
Susan Charnley, Module Leader, PNW, Portland OR<br />
Claudia Stuart, Mendocino National Forest, Chico CA<br />
Harriet Christensen, PNW, Seattle WA<br />
Leslie Frewing-Runyon, BLM, Portland OR<br />
Darryll Johnson, USGS, Seattle WA<br />
Curt Loop,US Army Corps of Engineers, Portland OR<br />
Richard Phillips, USFS-R6, Portland OR<br />
Terry Raettig, USFS-R6, Portland OR<br />
Tribal Relations Module<br />
Les McConnell, Coordinator, USFS-R6, Portland, OR<br />
Sonia Tamez, USFS-R5, Valejo, CA<br />
Bruce Crespin, BLM, Wenatchee, WA<br />
19
R<br />
eports<br />
Overall Program<br />
Anonymous. 2002. Interagency <strong>Regional</strong> Monitoring Overview: Northwest Forest Plan. 12 p. www.reo.gov/monitoring<br />
Implementation Monitoring Module<br />
Baker, D, and others. 2002. Implementation Monitoring Northwest Forest Plan - <strong>2001</strong> <strong>Annual</strong> Summary <strong>Report</strong>.<br />
www.reo.gov/monitoring/implementation<br />
Baker, D, L Hsin, B Amidon, and M Mamone. 2002. Results of the FY 2000 Implementation Monitoring Program Watershed<br />
Scale Assessment. www.reo.gov/monitoring/implementation<br />
Baker, D, L Hsin, A Horton, B Amidon, and M Mamone. 2000. Results of the FY 1999 Northwest Forest Plan Implementation<br />
Monitoring Program Part 1 Timber Sales. www.reo.gov/monitoring/implementation<br />
Baker, D, L Hsin, A Horton, B Amidon and M Mamone <strong>2001</strong>. Results of the FY 1999 Northwest Forest Plan Implementation<br />
Monitoring Program Part II Watershed Scale Assessment. www.reo.gov/monitoring/implementation<br />
Late-Successional and Old-growth Effectiveness Monitoring Module<br />
Moeur, M. 2002. Late-successional and old-growth effectiveness monitoring, Northwest Forest Plan, <strong>2001</strong> <strong>Annual</strong><br />
Summary <strong>Report</strong>. www.reo.gov/monitoring/og<br />
Browning, J, KC Kroll, C Grob, C Ducey, K Fassnacht, J Alegria, J Nighbert, M Moeur, T DeMeo, J Fetterman, and<br />
D Weyermann. February 2002. Interagency vegetation mapping project (IVMP). Olympic Province Version 2.0. 37 p.<br />
Browning, J, and others. February 2002. Accuracy assessment for the interagency vegetation mapping project<br />
(IVMP). Olympic Province Version 2.0. 36 p.<br />
Browning, J, and others. 2002. Interagency vegetation mapping project (IVMP). Western Washington Cascades<br />
Province Version 2.0. xx p.<br />
Browning, J, and others. 2002. Accuracy assessment for the interagency vegetation mapping project (IVMP). Western<br />
Washington Cascades Province Version 2.0. xx p.<br />
Browning, J, and others. 2002. Interagency vegetation mapping project (IVMP). Western Washington Lowlands<br />
Province Version 2.0. xx p.<br />
Browning, J, and others. 2002. Accuracy assessment for the interagency vegetation mapping project (IVMP). Western<br />
Washington Lowlands Province Version 2.0. xx p.<br />
Cohen, W, T Spies, R Alig, D Oetter, T Maiersperger, and M Fiorella. In press. Characterizing 23 years (1972-1995) of stand<br />
replacement disturbance in western Oregon forests with Landsat imagery. <strong>Ecosystem</strong>s.<br />
Levien, L, C Fischer, P Roffers, B Maurizi,and J Suero. January 2002. Monitoring land cover changes in California. California<br />
land cover mapping and monitoring program. Northeastern California Project Area. <strong>Report</strong> published on the World Wide<br />
Web. 171 p. http://frap.cdf.ca.gov/projects/land_cover/monitoring/pdfs/northeastern_ca_report.pdf<br />
O'Neil, J,KC Kroll, C Grob, C Ducey, K Fassnacht, J Alegria, J Nighbert, M Moeur, T DeMeo, J Fetterman,and D<br />
Weyermann. September <strong>2001</strong>. Interagency vegetation mapping project (IVMP). Oregon Coast Province Version 2.2.<br />
Published to CD. 39 p.<br />
O'Neil, J and others. April <strong>2001</strong>. Interagency vegetation mapping project (IVMP). Western Oregon Cascades<br />
Province Version 2.0. 38 p.<br />
20
O'Neil, J and others. April <strong>2001</strong>. Accuracy assessment for the interagency vegetation mapping project (IVMP).<br />
Western Cascades Oregon Province Version 2.0. 60 p.<br />
O'Neil, J and others. September <strong>2001</strong>. Accuracy assessment for the interagency vegetation mapping project (IVMP).<br />
Oregon Coast Province Version 2.2. Published to CD. 22 p.<br />
Schwind, B, R Warbington, C Curlis, and S Daniel. 1999. Creating A consistent and standardized vegetation database for<br />
Northwest Forest Plan monitoring in California: Proceedings of the 1999 ASPRS <strong>Annual</strong> Conference. Portland, OR. pp. 354-<br />
362. (http://www.krisweb.com/biblio/general/usfs/warbingtonetal.htm).<br />
Northern Spotted Owl Effectiveness Monitoring Module<br />
Lint, J. 2002. Northern spotted owl effectiveness monitoring, Northwest Forest Plan, <strong>2001</strong> <strong>Annual</strong> Summary <strong>Report</strong>.<br />
www.reo.gov/monitoring/nso<br />
Ackers, S. <strong>2001</strong>. Demographic characteristics of northern spotted owls (Strix occidentalis caurina) on the Willamette National<br />
Forest, Oregon: Habitat use and demography. <strong>Annual</strong> project report. Oregon Cooperative Fish and Wildlife Research Unit,<br />
Oregon State University, Corvallis, OR.<br />
Andrews, S. <strong>2001</strong>. Demographic characteristics of spotted owls (Strix occidentalis caurina) in the southern Oregon Cascades.<br />
<strong>Annual</strong> project report. Oregon Cooperative Fish and Wildlife Research Unit, Oregon State University, Corvallis, OR<br />
Gremel, S. <strong>2001</strong>. Spotted owl monitoring in Olympic National Park. <strong>2001</strong> <strong>Annual</strong> <strong>Report</strong>. USDI National Park Service.<br />
Olympic National Park, Port Angeles, WA.<br />
Horn, S. <strong>2001</strong>. Demographic characteristics of spotted owls (Strix occidentalis caurina) in the Klamath Mountain Province of<br />
Oregon. <strong>Annual</strong> project report. USDI Bureau of Land Management. Roseburg District, Roseburg, OR.<br />
Loschl, P. <strong>2001</strong>. Demographic characteristics of spotted owls in the Oregon Coast Ranges, 1990-<strong>2001</strong>. <strong>Annual</strong> project report.<br />
USDA Pacific Northwest Research Station. Forest Sciences Laboratory, Corvallis, OR.<br />
Reid, J. <strong>2001</strong>. Demographic characteristics of northern spotted owls (Strix occidentalis) on the Tyee study area, Roseburg,<br />
Oregon: 1985-<strong>2001</strong>. <strong>Annual</strong> project report. USDA Pacific Northwest Research Station. Forest Sciences Laboratory, Corvallis,<br />
OR.<br />
Sovern, S. <strong>2001</strong>. Demography of spotted owls on the east slope of the Cascade Range, Washington, 1989-<strong>2001</strong>. <strong>Annual</strong> project<br />
report. USDA Pacific Northwest Research Station. Forest Sciences Laboratory, Corvallis, OR.<br />
Marbled Murrelet Effectiveness Monitoring Module<br />
Jodice, P.G.R. 2002. Marbled murrelet effectiveness monitoring, Northwest Forest Plan, <strong>2001</strong> <strong>Annual</strong> Summary <strong>Report</strong>.<br />
www.reo.gov/monitoring/murrelet<br />
Bentivoglio and others. 2002. Northwest forest plan marbled murrelet effectiveness monitoring 2000 annual report. US Fish<br />
and Wildlife Service, Portland, OR. 72pp. Also available at www.reo.gov/monitoring/murrelet.<br />
Evans, D E, W P Ritchie, S K Nelson, E Kuo-Harrison, P Harrison, and T E Hamer. 2000. Methods for surveying marbled<br />
murrelets in forests: an update to the protocol for land management and research. Pacific Seabird Group, Marbled Murrelet<br />
technical committee.<br />
21
R<br />
eports (continued)<br />
Aquatic Riparian Effectiveness Monitoring Module<br />
Lanigan, S., K. Gallo, and C. Moyer. 2002. Aquatic riparian effectiveness monitoring, Northwest Forest Plan, <strong>2001</strong> <strong>Annual</strong><br />
Summary <strong>Report</strong>. www.reo.gov/monitoring/watershed<br />
Gallo, K., C. Moyer, and S. Lanigan. 2002. Aquatic and riparian effectiveness monitoring program. <strong>2001</strong> pilot report.<br />
Corvallis, OR.<br />
Moyer, C., K. Gallo, N. Dachtler, J. Lloyd, E. Moberly, and D. Simmons. <strong>2001</strong>. Aquatic and riparian effectiveness monitoring<br />
program, 2000 annual progress report. Corvallis, OR.<br />
Reeves, G.H., D.B. Hohler, D. P. Larsen, D. E. Busch, K. Kratz, K. Reynolds, K.F. Stein, T. Atzet, P. Hays, and M. Tehan.<br />
<strong>2001</strong>. Aquatic and riparian effectiveness monitoring program for the Northwest Forest Plan. Pre-Publication Draft. Corvallis,<br />
OR.<br />
Social and Economic Effectiveness Monitoring Module<br />
Sommers, P. <strong>2001</strong>. Monitoring socioeconomic trends in the northern spotted owl region: framework, trends update, and<br />
community level monitoring recommendations. Technical <strong>Report</strong>. USGS Forest and Rangeland <strong>Ecosystem</strong> Science Center,<br />
Cascadia Field Station, Seattle, Washington. February <strong>2001</strong>. 49 p.<br />
Stuart, C. 2002. Social and economic effectiveness monitoring, Northwest Forest Plan, <strong>2001</strong> <strong>Annual</strong> Summary <strong>Report</strong>.<br />
www.reo.gov/monitoring/socio<br />
Agency Abbreviations<br />
BLM USDI Bureau of Land Management<br />
CDFG California Department of Fish and Game<br />
EPA US Environmental Protection Agency<br />
NMFS National Marine Fisheries Service<br />
NPS USDI National Park Service<br />
NWIFC Northwest Indian Fisheries Commission<br />
ODFWS Oregon Department of Fish and Wildlife<br />
PNW Pacific Northwest Research Station, United States Forest Service<br />
PSW Pacific Southwest Research Station, United States Forest Service<br />
USFS United States Forest Service<br />
USFS-R5 United States Forest Service Region 5<br />
USFS-R6 United States Forest Service Region 6<br />
USFWS United States Fish and Wildlife Service<br />
USGS United States Geological Survey<br />
USGS-BRD United States Geological Survey- Biological Resources Division<br />
WDFW Washington Department of Fish and Game<br />
WDNR Washington Department of Natural Resources<br />
United States<br />
Department of<br />
Agriculture<br />
Forest Service<br />
Pacific<br />
Northwest<br />
Region<br />
R6-NWFP-TP-08-02<br />
2002<br />
22