Demographic characteristics of northern spotted owls in the Eastern ...
Demographic characteristics of northern spotted owls in the Eastern ...
Demographic characteristics of northern spotted owls in the Eastern ...

You also want an ePaper? Increase the reach of your titles
YUMPU automatically turns print PDFs into web optimized ePapers that Google loves.
1<br />
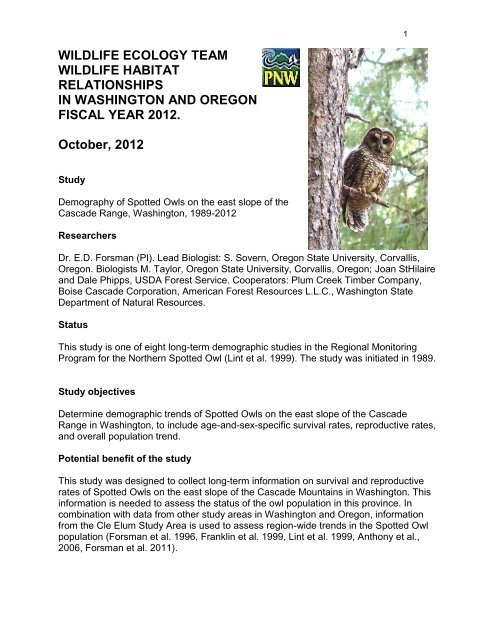
WILDLIFE ECOLOGY TEAM<br />
WILDLIFE HABITAT<br />
RELATIONSHIPS<br />
IN WASHINGTON AND OREGON<br />
FISCAL YEAR 2012.<br />
October, 2012<br />
Study<br />
Demography <strong>of</strong> Spotted Owls on <strong>the</strong> east slope <strong>of</strong> <strong>the</strong><br />
Cascade Range, Wash<strong>in</strong>gton, 1989-2012<br />
Researchers<br />
Dr. E.D. Forsman (PI). Lead Biologist: S. Sovern, Oregon State University, Corvallis,<br />
Oregon. Biologists M. Taylor, Oregon State University, Corvallis, Oregon; Joan StHilaire<br />
and Dale Phipps, USDA Forest Service. Cooperators: Plum Creek Timber Company,<br />
Boise Cascade Corporation, American Forest Resources L.L.C., Wash<strong>in</strong>gton State<br />
Department <strong>of</strong> Natural Resources.<br />
Status<br />
This study is one <strong>of</strong> eight long-term demographic studies <strong>in</strong> <strong>the</strong> Regional Monitor<strong>in</strong>g<br />
Program for <strong>the</strong> Nor<strong>the</strong>rn Spotted Owl (L<strong>in</strong>t et al. 1999). The study was <strong>in</strong>itiated <strong>in</strong> 1989.<br />
Study objectives<br />
Determ<strong>in</strong>e demographic trends <strong>of</strong> Spotted Owls on <strong>the</strong> east slope <strong>of</strong> <strong>the</strong> Cascade<br />
Range <strong>in</strong> Wash<strong>in</strong>gton, to <strong>in</strong>clude age-and-sex-specific survival rates, reproductive rates,<br />
and overall population trend.<br />
Potential benefit <strong>of</strong> <strong>the</strong> study<br />
This study was designed to collect long-term <strong>in</strong>formation on survival and reproductive<br />
rates <strong>of</strong> Spotted Owls on <strong>the</strong> east slope <strong>of</strong> <strong>the</strong> Cascade Mounta<strong>in</strong>s <strong>in</strong> Wash<strong>in</strong>gton. This<br />
<strong>in</strong>formation is needed to assess <strong>the</strong> status <strong>of</strong> <strong>the</strong> owl population <strong>in</strong> this prov<strong>in</strong>ce. In<br />
comb<strong>in</strong>ation with data from o<strong>the</strong>r study areas <strong>in</strong> Wash<strong>in</strong>gton and Oregon, <strong>in</strong>formation<br />
from <strong>the</strong> Cle Elum Study Area is used to assess region-wide trends <strong>in</strong> <strong>the</strong> Spotted Owl<br />
population (Forsman et al. 1996, Frankl<strong>in</strong> et al. 1999, L<strong>in</strong>t et al. 1999, Anthony et al.,<br />
2006, Forsman et al. 2011).
2<br />
Study Area and Methods<br />
The Cle Elum Study Area <strong>in</strong>cludes a 1,787 km 2 General Study Area (GSA), and a 204<br />
km 2 Density Study Area (DSA) that is conta<strong>in</strong>ed with<strong>in</strong> <strong>the</strong> GSA (Figure 1). The U. S.<br />
Forest Service adm<strong>in</strong>isters approximately 60% <strong>of</strong> <strong>the</strong> area with<strong>in</strong> <strong>the</strong> GSA. The GSA<br />
and DSA are composed <strong>of</strong> 34 % and 88 % designated Late Successional Reserves<br />
(LSR), respectively. These LSR’s were allocated by <strong>the</strong> Northwest Forest Plan to<br />
benefit species associated with late successional forest (USDA and USDI 1994).<br />
Figure 1. The Cle Elum Study Area, Wash<strong>in</strong>gton.<br />
With<strong>in</strong> <strong>the</strong> GSA we survey all historic owl territories each<br />
year us<strong>in</strong>g standard protocols to locate and confirm<br />
previously banded <strong>owls</strong>, and to determ<strong>in</strong>e <strong>the</strong> number <strong>of</strong><br />
young produced at each territory (Forsman 1983,<br />
Frankl<strong>in</strong>, et al., 1996, L<strong>in</strong>t et al., 1999). Any new <strong>owls</strong> are<br />
banded with a numbered USFWS band and a uniquely<br />
colored plastic leg band (Figure 2). We attempted a<br />
complete count <strong>of</strong> Spotted Owls <strong>in</strong> <strong>the</strong> DSA each year<br />
beg<strong>in</strong>n<strong>in</strong>g <strong>in</strong> 1991. The DSA survey <strong>in</strong>volves reproduc<strong>in</strong>g<br />
Figure 2. Adult Spotted owl<br />
with yellow and black leg band
Spotted Owl calls at each established call station on 3 occasions dur<strong>in</strong>g <strong>the</strong> March –<br />
August field season (Forsman 1983, L<strong>in</strong>t et al. 1999, Reid et al. 1999). Call stations are<br />
positioned so that we achieve a 100 % auditory coverage <strong>of</strong> <strong>the</strong> entire DSA.<br />
In 2005 and 2006, we collected blood samples and oral swabs from most <strong>owls</strong> we<br />
captured to test for <strong>the</strong> presence <strong>of</strong> West Nile Virus. West Nile Virus has been identified<br />
as a potentially significant source <strong>of</strong> mortality among Spotted Owls (Courtney et al.<br />
2004). We collected blood samples from some captured <strong>owls</strong> for future genetic study<br />
2006-2010 (Haig et al. 2004, Funk et al. 2009).<br />
In January, 2009, we participated <strong>in</strong> a meta-analysis <strong>of</strong> Nor<strong>the</strong>rn Spotted Owl data <strong>in</strong><br />
Corvallis, Oregon. The meta-analysis <strong>in</strong>cluded data from 8 monitor<strong>in</strong>g areas funded<br />
through <strong>the</strong> Northwest Forest Plan, plus 3 additional study areas <strong>in</strong> <strong>the</strong> range <strong>of</strong> <strong>the</strong><br />
Nor<strong>the</strong>rn Spotted Owl. In <strong>the</strong> meta-analysis we used mark-recapture data to estimate<br />
age-and sex-specific survival and recruitment, and population growth rate. The results<br />
<strong>of</strong> <strong>the</strong> meta-analysis are presented <strong>in</strong> Forsman et al. (2011).<br />
3<br />
RESULTS<br />
Population Trends<br />
General Study Area<br />
In 2012 we banded 7 juvenile <strong>owls</strong> and, br<strong>in</strong>g<strong>in</strong>g <strong>the</strong> total number <strong>of</strong> <strong>owls</strong> banded dur<strong>in</strong>g<br />
1989-2012 to 844 (69 subadults, 157 adults, and 617 juveniles, Table 1).<br />
Our monitor<strong>in</strong>g effort has rema<strong>in</strong>ed relatively consistent after 1992, except for 8-10<br />
territories we began monitor<strong>in</strong>g with only 1 visit per year beg<strong>in</strong>n<strong>in</strong>g <strong>in</strong> 2002. None <strong>of</strong><br />
<strong>the</strong>se “m<strong>in</strong>imum-protocol” territories conta<strong>in</strong>ed <strong>owls</strong> <strong>in</strong> 2012. In 2012, we confirmed <strong>the</strong><br />
bands <strong>of</strong> 13 <strong>spotted</strong>, and detected ano<strong>the</strong>r 7 Spotted Owls on 13 territories. This<br />
compares to a high <strong>of</strong> 120 <strong>owls</strong> on 64 territories <strong>in</strong> <strong>the</strong> same area <strong>in</strong> 1992 (Figure 3,<br />
Table 2).<br />
We have noted an 83 % decl<strong>in</strong>e <strong>in</strong> <strong>the</strong> number <strong>of</strong> <strong>owls</strong> detected on <strong>the</strong> study area s<strong>in</strong>ce<br />
1992, and a concomitant <strong>in</strong>crease <strong>in</strong> <strong>the</strong> number <strong>of</strong> vacant territories (Figure 4). The<br />
high male:female ratio observed <strong>in</strong> 2008-2010 appears to have waned <strong>in</strong> <strong>the</strong> last 2<br />
years. (Figure 5).<br />
Although <strong>the</strong> number <strong>of</strong> <strong>owls</strong> detected on <strong>the</strong> GSA this year was 1 less than we<br />
detected last year, we are encouraged by <strong>the</strong> fact that 2 territorial <strong>owls</strong> that appear to<br />
have died over <strong>the</strong> w<strong>in</strong>ter were replaced by new <strong>owls</strong>. The fact that <strong>the</strong>re are a few<br />
non-territorial “floaters” with<strong>in</strong> or near <strong>the</strong> study area is encourag<strong>in</strong>g. We were unable to<br />
capture <strong>the</strong>se <strong>owls</strong> to determ<strong>in</strong>e where <strong>the</strong>y orig<strong>in</strong>ated.<br />
Key f<strong>in</strong>d<strong>in</strong>gs <strong>of</strong> <strong>the</strong> most recent meta-analysis <strong>of</strong> Spotted Owl demography data<br />
(Forsman et al. 2011) were: 1) <strong>the</strong>re was strong evidence <strong>of</strong> population decl<strong>in</strong>es <strong>in</strong>
<strong>spotted</strong> <strong>owls</strong> on 7 <strong>of</strong> 11 study areas exam<strong>in</strong>ed (<strong>in</strong>clud<strong>in</strong>g <strong>the</strong> Cle Elum Study Area); and<br />
2) Barred owl presence had a generally negative effect on demographic rates <strong>of</strong> <strong>spotted</strong><br />
<strong>owls</strong>. The estimate <strong>of</strong> <strong>the</strong> f<strong>in</strong>ite rate <strong>of</strong> population change (λ) for <strong>the</strong> Cle Elum Study<br />
Area was 0.937 (95% CI 0.91 – 0.96), <strong>in</strong>dicat<strong>in</strong>g an annual population decl<strong>in</strong>e <strong>of</strong> 6.3%<br />
(95% CI 4-9%). This estimate <strong>of</strong> population change closely predicts <strong>the</strong> empirical<br />
estimates <strong>of</strong> population size that we collect each year (Figure 3).<br />
4<br />
Figure 3. Number <strong>of</strong> Spotted Owls detected, number <strong>of</strong> territories <strong>in</strong> which we detected<br />
<strong>owls</strong>, number <strong>of</strong> territories surveyed, and number <strong>of</strong> new territories added by year on<br />
<strong>the</strong> Cle Elum Study Area, Okanogan-Wenatchee National Forest, Wash<strong>in</strong>gton, 1989-<br />
2012. M<strong>in</strong>imum protocol territories <strong>in</strong>cluded 8-10 territories that we visited only once per<br />
year beg<strong>in</strong>n<strong>in</strong>g <strong>in</strong> 2002. A territory was considered <strong>in</strong>habited if a s<strong>in</strong>gle owl response<br />
was detected which was not associated with a neighbor<strong>in</strong>g territory.
Figure 4. Number <strong>of</strong> vacant territories, hybrid territories, and number <strong>of</strong> territories<br />
<strong>in</strong>habited by s<strong>in</strong>gles, pairs, and “additional <strong>owls</strong>” on <strong>the</strong> Cle Elum Study Area,<br />
Okanogan-Wenatchee National Forest, Wash<strong>in</strong>gton, 1989-2011. An “additional owl” is<br />
counted when a s<strong>in</strong>gle owl is detected at a territory where a pair or territorial owl has<br />
already been confirmed, and <strong>the</strong> s<strong>in</strong>gle owl response cannot be attributed to an<br />
adjacent territory. A hybrid territory is one <strong>in</strong>habited by a Spotted owl/Barred owl pair or<br />
a hybrid owl (<strong>spotted</strong> owl x barred owl). Totals do not <strong>in</strong>clude 8-10 vacant sites where<br />
we made less than 3 complete visits <strong>in</strong> a year start<strong>in</strong>g <strong>in</strong> 2002.<br />
5
6<br />
Figure 5. Number <strong>of</strong> male and female Spotted Owls detected by year on <strong>the</strong> Cle Elum<br />
Study Area, Okanogan-Wenatchee National Forest, Wash<strong>in</strong>gton, 1989-2012.<br />
Elsewhere on <strong>the</strong> Okanogan-Wenatchee National Forest, we cont<strong>in</strong>ued band<strong>in</strong>g <strong>owls</strong><br />
on a portion <strong>of</strong> what was <strong>the</strong> Wenatchee Demography Study Area (WEN, Figure 12).<br />
The WEN was monitored by National Council for Air and Stream Improvement from<br />
1990-2003, <strong>in</strong> cooperation with <strong>the</strong> Wenatchee National Forest. We banded 3 new <strong>owls</strong><br />
at 10 <strong>in</strong>habited territories on <strong>the</strong> WEN, and changed bands or confirmed bands on 3<br />
adult <strong>owls</strong>. We surveyed 23 territories to protocol.
7<br />
Density Study Area<br />
The DSA survey data <strong>in</strong>dicate an overall decl<strong>in</strong>e <strong>in</strong> <strong>the</strong> number <strong>of</strong> <strong>owls</strong> detected <strong>in</strong> <strong>the</strong><br />
DSA s<strong>in</strong>ce 1991 (Figure 6). We detected <strong>the</strong> same number <strong>of</strong> <strong>owls</strong> this year <strong>in</strong> <strong>the</strong> DSA<br />
as 20112012. However, <strong>the</strong> number <strong>of</strong> confirmed pairs <strong>in</strong> <strong>the</strong> DSA dropped from 2 to 1.<br />
Figure 6. Number <strong>of</strong> non-juvenile Spotted Owls detected on <strong>the</strong> 204 km 2 Swauk Density<br />
Study Area on <strong>the</strong> Okanogan-Wenatchee National Forest, Wash<strong>in</strong>gton, 1991-2012.<br />
Po<strong>in</strong>ts represent actual counts.<br />
West Nile Virus<br />
None <strong>of</strong> <strong>the</strong> oral swab or blood samples from <strong>owls</strong> tested positive for <strong>the</strong> presence <strong>of</strong><br />
West Nile Virus. Samples from 3 mosquitoes collected <strong>in</strong> neighbor<strong>in</strong>g Yakima County<br />
January 1 through September 15, 2011 tested positive for West Nile Virus (CDC 2011).<br />
West Nile Virus was detected <strong>in</strong> 2 each birds, horses, and mosquitoes from Kittitas<br />
County <strong>in</strong> 2009, but no specimens tested positive <strong>in</strong> 2011. The impact <strong>of</strong> West Nile<br />
Virus on <strong>the</strong> Spotted Owl population on <strong>the</strong> Cle Elum Study Area rema<strong>in</strong>s unknown.
8<br />
Barred <strong>owls</strong> and Spotted Owls<br />
The range <strong>of</strong> <strong>the</strong> Barred Owl now overlaps<br />
<strong>the</strong> range <strong>of</strong> <strong>the</strong> Nor<strong>the</strong>rn Spotted Owl,<br />
and <strong>the</strong> potential for <strong>the</strong> Barred Owl to<br />
negatively affect <strong>the</strong> Spotted Owl<br />
population has been a concern for many<br />
years (Taylor and Forsman 1976,<br />
Courtney et al. 2006). Kelly et al. (2003)<br />
found that apparent occupancy and<br />
reproduction <strong>of</strong> Spotted Owls were lower<br />
when Barred <strong>owls</strong> were detected nearby.<br />
Thus, monitor<strong>in</strong>g <strong>the</strong> number <strong>of</strong> <strong>in</strong>habited<br />
Barred Owl territories is an important<br />
<strong>in</strong>dex to measure <strong>the</strong> effect <strong>of</strong> Barred <strong>owls</strong><br />
on Spotted Owl population trends (Olson<br />
et al. 2005)<br />
General Study Area<br />
Barred Owl (Strix varia) (photo by<br />
Steve Sleep)<br />
We recorded 39 Barred Owl responses <strong>in</strong> <strong>the</strong> GSA <strong>in</strong> 2012 dur<strong>in</strong>g our Spotted Owl<br />
surveys. Based on how <strong>the</strong>se responses were situated temporally and/or<br />
geographically, we believe <strong>the</strong> responses represent 28 Barred Owl territories. Due to<br />
limited resources, we did not attempt to determ<strong>in</strong>e whe<strong>the</strong>r <strong>the</strong> responses represented<br />
nest<strong>in</strong>g pairs.<br />
To estimate <strong>the</strong> proportion <strong>of</strong> Spotted Owl territories that are <strong>in</strong>habited by Barred Owls<br />
each year <strong>in</strong> <strong>the</strong> GSA, we assigned a center location to each Spotted Owl territory that<br />
we surveyed each year. We used data from 56 territories that were surveyed<br />
consistently dur<strong>in</strong>g 1992-2012, and that were <strong>in</strong>habited by a pair <strong>of</strong> Spotted Owls at<br />
least one year dur<strong>in</strong>g that period. We coded <strong>the</strong> territory as hav<strong>in</strong>g a Barred Owl<br />
response if a Barred Owl responded with<strong>in</strong> 1 km <strong>of</strong> any <strong>of</strong> <strong>the</strong> historic territory centers.<br />
We felt this measure <strong>of</strong> <strong>the</strong> Barred Owl effect would capture <strong>in</strong>stances where <strong>the</strong> Barred<br />
Owls were displac<strong>in</strong>g Spotted Owls > 1 km between years. The proportion <strong>of</strong> Spotted<br />
Owl territories <strong>in</strong> <strong>the</strong> GSA with Barred Owl responses <strong>in</strong>creased from 1992-2002, after<br />
which time <strong>the</strong> proportion has varied among years but not <strong>in</strong>creased above <strong>the</strong> 2002<br />
level (Figure 7).
9<br />
Figure 7. Percent <strong>of</strong> Spotted Owl territories with a Barred Owl response with<strong>in</strong> 1 km <strong>of</strong><br />
any <strong>of</strong> <strong>the</strong> historic territory centers, Cle Elum Study Area, Okanogan-Wenatchee<br />
National Forest, Wash<strong>in</strong>gton, 1991-2012. The sample <strong>in</strong>cludes 56 territories that were<br />
cont<strong>in</strong>uously surveyed for Spotted Owls 1992-2012, and were <strong>in</strong>habited by a pair <strong>of</strong><br />
<strong>spotted</strong> <strong>owls</strong> at least one year.<br />
Density Study Area<br />
By completely survey<strong>in</strong>g <strong>the</strong> Density Study Area each year, we were able to estimate<br />
which portions <strong>of</strong> <strong>the</strong> DSA were <strong>in</strong>habited by Barred Owls and which portions were<br />
<strong>in</strong>habited by Spotted Owls. The apparent number <strong>of</strong> <strong>in</strong>habited Barred Owl territories <strong>in</strong><br />
<strong>the</strong> DSA <strong>in</strong>creased <strong>in</strong> 1991-2000 (Figure 8), outnumber<strong>in</strong>g <strong>in</strong>habited Spotted Owl<br />
territories <strong>in</strong> several years. This year, we detected <strong>the</strong> highest number Barred Owls<br />
s<strong>in</strong>ce 1991--barred owl territories outnumbered <strong>spotted</strong> owl territories by a ratio <strong>of</strong> more<br />
than 6:1 (Figure 8).
10<br />
Figure 8. Number <strong>of</strong> territories <strong>in</strong> which we detected Spotted Owls and Barred Owls <strong>in</strong><br />
<strong>the</strong> Swauk Cr. Density Study Area, Okanogan-Wenatchee National Forest, Wash<strong>in</strong>gton,<br />
1991-2012.Territories were considered <strong>in</strong>habited if an owl <strong>of</strong> ei<strong>the</strong>r sex was detected at<br />
<strong>the</strong> territory. The values for barred <strong>owls</strong> <strong>in</strong> 2009 <strong>in</strong>clude one territory <strong>in</strong>habited by a<br />
Spotted owl/Barred owl pair.<br />
Although we have detected Barred <strong>owls</strong> on <strong>the</strong> General Study Area<br />
s<strong>in</strong>ce 1989, we documented our first case <strong>of</strong> a Spotted owl/Barred<br />
owl pair <strong>in</strong> 2009. The pair <strong>in</strong>cluded a male Spotted owl and a female<br />
Barred owl—<strong>the</strong> most common pair formation when Spotted Owls<br />
and Barred <strong>owls</strong> hybridize (Haig et al. 2004, Kelly et al. 2004). The<br />
pair nested and produced 2 young. One <strong>of</strong> those young was verified<br />
at an historic <strong>spotted</strong> owl territory <strong>in</strong> 2011.<br />
In December, 2009, <strong>the</strong> US Fish and Wildlife Service published a<br />
notice <strong>of</strong> <strong>in</strong>tent to prepare an Environmental Impact Statement (EIS)<br />
for a Barred Owl removal study (USFWS 2009). This study, if<br />
<strong>in</strong>itiated, will evaluate <strong>the</strong> effect <strong>of</strong> Barred Owl removal on vital rates<br />
(e.g. survival, reproduction, recruitment) <strong>of</strong> <strong>the</strong> Spotted Owl. The<br />
public comment period on <strong>the</strong> letter <strong>of</strong> <strong>in</strong>tent has ended and <strong>the</strong><br />
USFWS is currently draft<strong>in</strong>g an EIS. The Cle Elum Study Area will<br />
likely be a candidate study area for experimental Barred Owl removal under this<br />
proposal. More <strong>in</strong>formation can be found at <strong>the</strong> follow<strong>in</strong>g l<strong>in</strong>k: Barred owl EIS .<br />
“Sparred” owl (Spotted owl x Barred<br />
owl hybrid) fledgl<strong>in</strong>g, 22 July, 2009
11<br />
Reproductive Rates<br />
All <strong>of</strong> <strong>the</strong> 4 females for which we determ<strong>in</strong>ed<br />
nest<strong>in</strong>g status <strong>in</strong> 2012 nested and all nests<br />
produced young. Average fecundity (number<br />
<strong>of</strong> female young produced per female owl) was<br />
0.58 (SE = 0.15, Table 3). The 2012 values for<br />
proportion <strong>of</strong> females nest<strong>in</strong>g and fecundity<br />
were above <strong>the</strong> average for all years (Figure 9,<br />
Table 4).<br />
The pronounced odd-even year pattern <strong>of</strong><br />
nest<strong>in</strong>g and fecundity seen <strong>in</strong> 1989-1999—a<br />
pattern that was evident <strong>in</strong> many studies<br />
throughout <strong>the</strong> range <strong>of</strong> <strong>the</strong> Spotted Owl--has<br />
waned somewhat <strong>in</strong> <strong>the</strong> last 12 years (Figure<br />
9, Table 3-4).<br />
Forsman et al. (2011) found that models that<br />
<strong>in</strong>cluded a time trend covariate were among<br />
<strong>the</strong> compet<strong>in</strong>g models for fecundity on <strong>the</strong> Cle Elum Study area. The 95% confidence<br />
<strong>in</strong>tervals around <strong>the</strong> negative beta estimate (-0.005) for trend <strong>in</strong> fecundity barely<br />
overlapped zero (-0.017 – 0.006, Forsman et al. 2011:25). Thus, <strong>the</strong>se estimates<br />
provide suggestive evidence that fecundity has decl<strong>in</strong>ed over time on this study area.
12<br />
Figure 9. Reproductive <strong>in</strong>dices <strong>of</strong> Nor<strong>the</strong>rn Spotted Owls on <strong>the</strong> Cle Elum Study Area,<br />
Okanogan-Wenatchee National Forest, Wash<strong>in</strong>gton, 1989-2012. Indices shown are:<br />
proportion <strong>of</strong> females nest<strong>in</strong>g and fecundity. Sample size <strong>of</strong> females used for fecundity<br />
analysis for each year (bars) is plotted on <strong>the</strong> y axis on <strong>the</strong> right side <strong>of</strong> <strong>the</strong> graph.<br />
Fecundity is <strong>the</strong> number <strong>of</strong> females produced per female owl, assum<strong>in</strong>g a 50:50 sex<br />
ratio. The dotted and dashed l<strong>in</strong>es show <strong>the</strong> average (all years 1989-2012) fecundity<br />
and proportion nest<strong>in</strong>g, respectively.<br />
Dur<strong>in</strong>g 1989-2012 <strong>the</strong>re were 2 years (1993, 1997) with extremely low reproduction.<br />
While <strong>the</strong> reproductive rates appear to have been somewhat less variable <strong>in</strong> recent<br />
years, most reproductive <strong>in</strong>dices we measure are proportions that apply to a decl<strong>in</strong><strong>in</strong>g<br />
pool <strong>of</strong> reproductive <strong>owls</strong>. Thus, <strong>the</strong> reproductive potential <strong>of</strong> <strong>the</strong> Spotted owl<br />
population on <strong>the</strong> Cle Elum Study Area has decl<strong>in</strong>ed over time (Figure 10). The small<br />
number <strong>of</strong> reproductive females rema<strong>in</strong><strong>in</strong>g on <strong>the</strong> study area is cause for concern<br />
should this situation persist, given recent analyses that suggest <strong>the</strong>re is a genetic<br />
bottleneck <strong>in</strong> this region (Funk et al. 2009). Additionally, small populations can have a<br />
depressed capacity to withstand environmental variation (Soule and Mills’ 1998).
13<br />
Figure 10. Hypo<strong>the</strong>sized annual female reproductive output (average yearly female<br />
fecundity * number <strong>of</strong> females detected each year), Cle Elum Study Area, Okanogan-<br />
Wenatchee National Forest, Wash<strong>in</strong>gton, 1989-2012. Note <strong>in</strong> <strong>the</strong> years prior to 1992<br />
<strong>the</strong> sample <strong>of</strong> females monitored each year was <strong>in</strong>creas<strong>in</strong>g as we added new territories<br />
to <strong>the</strong> sample.<br />
Western Spruce Budworm<br />
An outbreak <strong>of</strong> <strong>the</strong> western spruce budworm (Choristoneura occidentalis) began on <strong>the</strong><br />
Cle Elum Study Area <strong>in</strong> 2000, and <strong>the</strong> amount <strong>of</strong> area affected by <strong>the</strong> budworm has<br />
<strong>in</strong>creased each year (WDNR 2011). Aerial reconnaissance by WDNR 2000-2011<br />
<strong>in</strong>dicates that as much as 48 % <strong>of</strong> <strong>the</strong> GSA has been affected by <strong>the</strong> budworm at some<br />
po<strong>in</strong>t s<strong>in</strong>ce 2000 (figure 11). Defoliation by <strong>the</strong> budworm has <strong>the</strong> potential to reduce<br />
Spotted Owl habitat quality by decreas<strong>in</strong>g canopy closure. Stands that are dom<strong>in</strong>ated<br />
by Douglas-fir (Pseudotsuga menzesii) and grand fir (Abies grandis) are particularly<br />
susceptible to defoliation.
14<br />
Figure 11. Cumulative area (hectares) <strong>of</strong> forest affected by western spruce budworm by<br />
year on <strong>the</strong> Cle Elum Study Area, Okanogan-Wenatchee National Forest, Wash<strong>in</strong>gton,<br />
2000-2011 (WDNR 2011).<br />
Table Mounta<strong>in</strong> Fire<br />
A severe lightn<strong>in</strong>g storm on September 8, 2012 ignited 55 fires with<strong>in</strong> <strong>the</strong> GSA. Sixteen<br />
<strong>of</strong> <strong>the</strong>se fires were with<strong>in</strong> 0.7 mi (1.1 km) <strong>of</strong> <strong>the</strong> historic territory center <strong>of</strong> one or more <strong>of</strong><br />
our <strong>owls</strong>. Several <strong>of</strong> <strong>the</strong>se fires <strong>in</strong>creased <strong>in</strong> size and comb<strong>in</strong>ed <strong>in</strong>to one fire, <strong>the</strong> Table<br />
Mounta<strong>in</strong> fire (Figure 12-14). When <strong>the</strong> fire was conta<strong>in</strong>ed, 16,743 ha <strong>of</strong> <strong>the</strong> GSA and<br />
3842 ha <strong>of</strong> <strong>the</strong> DSA were with<strong>in</strong> <strong>the</strong> fire perimeter. No <strong>spotted</strong> owl territories that were<br />
<strong>in</strong>habited <strong>in</strong> 2012 were threatened by <strong>the</strong> Table Mounta<strong>in</strong> fire. However, 38 historic<br />
territory centers from 8 territories were with<strong>in</strong> <strong>the</strong> fire perimeter.
15<br />
Figure 12. Look<strong>in</strong>g NE toward <strong>the</strong> Table Mtn. fire, September 19, 2012, ~ 1500 hours<br />
Figure 13. Look<strong>in</strong>g E at The Table Mtn. Fire September 19, 2012, ~ sunset
Figure 14. Aerial photography (ca. 2009) with <strong>the</strong> Cle Elum Study Area boundary and<br />
Table Mounta<strong>in</strong> Fire perimeter, 2 October, 2012.<br />
16<br />
The 2009 Spotted Owl <strong>Demographic</strong> Workshop<br />
A workshop to analyze data from Spotted Owl demography study areas was conducted<br />
<strong>in</strong> January 2009, and <strong>the</strong> results from <strong>the</strong> analysis were published <strong>in</strong> <strong>the</strong> monograph<br />
Population Demography <strong>of</strong> Nor<strong>the</strong>rn Spotted Owls (Forsman et al. 2011). This analysis<br />
<strong>in</strong>cluded data from 11 study areas, <strong>in</strong>clud<strong>in</strong>g <strong>the</strong> Cle Elum Study Area 1989-2008, as<br />
well as 7 o<strong>the</strong>r Spotted Owl demography study areas funded under <strong>the</strong> Northwest<br />
Forest Plan (Figure 12). Three additional study areas also participated <strong>in</strong> <strong>the</strong> workshop.<br />
The next <strong>spotted</strong> owl demographic meta-analysis is scheduled for January, 2014.
17<br />
Figure 12. Nor<strong>the</strong>rn Spotted Owl Demography Study Areas <strong>in</strong> <strong>the</strong> range <strong>of</strong> <strong>the</strong> Owl.<br />
Study areas with asterisks (MAR, WEN, and WSR) were discont<strong>in</strong>ued after <strong>the</strong> 2003<br />
analysis.<br />
Problems encountered<br />
We were unable to survey on 9 scheduled survey days and/or nights due to <strong>in</strong>clement<br />
wea<strong>the</strong>r, result<strong>in</strong>g <strong>in</strong> a loss <strong>of</strong> 18 person-days <strong>of</strong> survey. The 2012 average June<br />
temperature <strong>in</strong> Wash<strong>in</strong>gton State was <strong>the</strong> coldest <strong>in</strong> 22 years (National Climatic Data<br />
Center 2012).<br />
Reduced ma<strong>in</strong>tenance and decommission <strong>of</strong> Forest Service roads cont<strong>in</strong>ues to reduce<br />
vehicle access. This <strong>of</strong>ten necessitates o<strong>the</strong>r means <strong>of</strong> travel (e.g. foot, bicycle, ATV)<br />
to our call<strong>in</strong>g stations, which <strong>in</strong>creases time spent for each survey.
As owl territories have become vacant, we have had to <strong>in</strong>crease our number <strong>of</strong><br />
nocturnal visits <strong>in</strong> order to achieve valid surveys. In addition, surveys done by<br />
cooperat<strong>in</strong>g organizations to monitor owl territories <strong>in</strong> our sample have largely ceased.<br />
The comb<strong>in</strong>ation <strong>of</strong> <strong>the</strong>se 2 developments has <strong>in</strong>creased <strong>the</strong> overall workload for<br />
accomplish<strong>in</strong>g this study. These difficulties are not likely to change <strong>in</strong> <strong>the</strong> near future.<br />
Literature cited<br />
Anthony, R. G., E. D. Forsman, A. B. Frankl<strong>in</strong>, D. R. Anderson, K. P. Burnham, G. C.<br />
White, C. J. Schwarz, J. D. Nichols, J. E. H<strong>in</strong>es, G. S. Olson, S. H. Ackers, L. S.<br />
Andrews, B. L. Biswell, P. C. Carlson, L. V. Diller, K. M. Dugger, K. E. Fehr<strong>in</strong>g, T.<br />
L. Flem<strong>in</strong>g, R. P. Gerhardt, S. A. Gremel, R. J. Gutiérrez, P. J. Happe, D. R.<br />
Herter, J. M. Higley, R. B. Horn, L. L. Irw<strong>in</strong>, P. J. Loschl, J. A. Reid, and S. G.<br />
Sovern. 2006. Status and trends <strong>in</strong> demography <strong>of</strong> <strong>nor<strong>the</strong>rn</strong> Spotted <strong>owls</strong>,<br />
1985-2003. Wildlife Monographs 163.<br />
Center For Disease Control (CDC). 2006. http://www.cdc.gov/ncidod/dvbid/westnile/<br />
Collett, D. (1991), Model<strong>in</strong>g B<strong>in</strong>ary Data, London: Chapman & Hall<br />
Courtney, S. Pl, J A Blakesley, R E Bigley, M L Cody, J P Dumbacher, R C Fleischer, A<br />
B Frankl<strong>in</strong>, J F Frankl<strong>in</strong>, R J Gutiérrez, J M Marzluff, L Sztukowski. 2004.<br />
Scientific evaluation <strong>of</strong> <strong>the</strong> status <strong>of</strong> <strong>the</strong> Nor<strong>the</strong>rn Spotted Owl. Susta<strong>in</strong>able<br />
Ecosystems Institute, Portland, Oregon.<br />
Crozier, M. L., M. E. Seamans, R. J. Gutiérrez , P. J. Loschl, R. B. Horn, S. G. Sovern,<br />
and E. D. Forsman. Does <strong>the</strong> presence <strong>of</strong> Barred <strong>owls</strong> suppress <strong>the</strong> call<strong>in</strong>g<br />
behavior <strong>of</strong> <strong>spotted</strong> <strong>owls</strong>? Condor 108:760-769.<br />
Forsman, E. D. 1983. Methods and materials for locat<strong>in</strong>g and study<strong>in</strong>g Spotted Owls.<br />
Gen. Tech. Rep. PNW-162. U.S. Department <strong>of</strong> Agriculture, Forest Service,<br />
Pacific Northwest Research Station. 8 pp.<br />
Forsman, E. D., DeStefano, S., Raphael, M. G., and Gutiérrez, R. J., Eds. 1996.<br />
Demography <strong>of</strong> <strong>the</strong> <strong>nor<strong>the</strong>rn</strong> Spotted Owl. Studies <strong>in</strong> Avian Biology 17. 122 pp.<br />
Forsman, E.D., R. G. Anthony, K. M. Dugger, E. M. Glenn, A.B. Frankl<strong>in</strong>, G.C. White, C.<br />
J. Schwarz, K. P. Burnham, D. R. Anderson, J. D. Nichols, J. E. H<strong>in</strong>es, J. B. L<strong>in</strong>t,<br />
R.J. Davis, S. H. Ackers, L. S. Andrews, B.L. Biswell, P. C. Carlson, L. V. Diller,<br />
S. A.Gremel, D. R. Herter, J.M. Higley, R. B. Horn, J.A. Reid, J. Rockweit, J.<br />
Schaberl, T.J. Snets<strong>in</strong>ger, and S.G. Sovern. 2011. Population demography <strong>of</strong> <strong>the</strong><br />
<strong>nor<strong>the</strong>rn</strong> <strong>spotted</strong> owl. Studies <strong>in</strong> Avian Biology 40.<br />
Frankl<strong>in</strong>, A. B., D. R. Anderson, E. D. Forsman, K. P. Burnham and F. W. Wagner.<br />
1996. Methods for collect<strong>in</strong>g and analyz<strong>in</strong>g demographic data on <strong>the</strong> Nor<strong>the</strong>rn<br />
Spotted Owl. Studies <strong>in</strong> Avian Biology 17:12-20.<br />
18
Frankl<strong>in</strong>, A. B., Burnham, K. P., White, G. C., Anthony, R. G., Forsman, E. D., Schwartz,<br />
C., Nichols, J. D., and H<strong>in</strong>es, J. 1999. Range-wide status and trends <strong>in</strong> <strong>nor<strong>the</strong>rn</strong><br />
Spotted Owl populations. Unpublished report. 71 pp.<br />
Funk, W. C., E. D. Forsman, M. Johnson, T. D. Mull<strong>in</strong>s, and S. M. Haig. 2009.<br />
Evidence for recent population bottlenecks <strong>in</strong> <strong>nor<strong>the</strong>rn</strong> <strong>spotted</strong> <strong>owls</strong> (Strix<br />
occidentalis caur<strong>in</strong>a). Conservation Genetics DOI 10.1007/s10592-009-9946-5.<br />
Haig, S. M., T. D. Mull<strong>in</strong>s, E. D. Forsman, P. W. Trail, and L. Wennerberg. 2004.<br />
Genetic identification <strong>of</strong> Spotted Owls, Barred Owls, and <strong>the</strong>ir hybrids: legal<br />
implications <strong>of</strong> hybrid identity. Conservation Biology 18: 1347-1357.<br />
Kelly, E. G., E. D. Forsman, and R. G. Anthony. 2003. Are Barred Owls displac<strong>in</strong>g<br />
Spotted Owls? Condor 105:45-53.<br />
Kelly, E. G., and E. D. Forsman. 2004. Recent records <strong>of</strong> hybridization between Barred<br />
Owls (Strix varia) and Nor<strong>the</strong>rn Spotted Owls (S. occidentalis caur<strong>in</strong>a). Auk<br />
121:806-810.<br />
L<strong>in</strong>t, J., Noon, B., Anthony, R., Forsman, E., Raphael, M., Collopy, M., and Starkey, E.<br />
1999. Nor<strong>the</strong>rn Spotted Owl effectiveness monitor<strong>in</strong>g plan for <strong>the</strong> Northwest<br />
Forest Plan. Gen. Tech. Rep. PNW-GTR-440. Portland, OR: U.S. Department <strong>of</strong><br />
Agriculture, Forest Service, Pacific Northwest Research Station. 43p.<br />
Millard, J. 2010. Don’t give a hoot! Are we lov<strong>in</strong>g <strong>the</strong>se birds to death? The Wild<br />
Phlox 44:4-5<br />
http://www.ncwaudubon.org/Wild_Phlox/2010Phlox/OctPhlox2010.pdf<br />
Olson, G. S., R. G. Anthony, E. D.Forsman, S. H. Ackers, P. J. Loschl, J. A. Reid, K. M.<br />
Dugger, E. M. Glenn, W. J. Ripple. 2005. Model<strong>in</strong>g <strong>of</strong> site occupancy dynamics<br />
for Nor<strong>the</strong>rn Spotted Owls, with emphasis on <strong>the</strong> effects <strong>of</strong> Barred Owls. Journal<br />
<strong>of</strong> Wildlife Management 69:918-932.<br />
Olson, G. S., E. D. Forsman, R. G. Anthony, S. G. Sovern, and B. Biswell. Nor<strong>the</strong>rn<br />
Spotted Owl site occupancy <strong>in</strong> eastern Wash<strong>in</strong>gton: <strong>the</strong> effects <strong>of</strong> Barred <strong>owls</strong><br />
and landscape pattern. In prep.<br />
Reid, J. R., R. B. Horn, and E. D. Forsman. 1999. Detection rates <strong>of</strong> Spotted Owls<br />
based on acoustic-lure and live-lure surveys. Wildl. Soc. Bull. 27:986-990.<br />
Soule, M. E., and L. S. Mills. 1998. No need to isolate genetics. Science 282:1658-<br />
1659. doi: 10.1126/science.282.5394.1658<br />
SAS Institute Inc. 2009. Cary, NC, USA.<br />
19
Taylor, A. L., and E. D. Forsman. 1976. Recent range extensions <strong>of</strong> <strong>the</strong> Barred owl <strong>in</strong><br />
western North America, <strong>in</strong>clud<strong>in</strong>g <strong>the</strong> first records for Oregon. Condor 78:560-<br />
561.<br />
U.S. Department <strong>of</strong> Agriculture, Forest Service, and U. S. Department <strong>of</strong> <strong>the</strong> Interior,<br />
Bureau <strong>of</strong> Land Management [USDA and USDI]. 1994. Record <strong>of</strong> decision for<br />
amendments to Forest Service and Bureau <strong>of</strong> Land Management plann<strong>in</strong>g<br />
documents with<strong>in</strong> <strong>the</strong> range <strong>of</strong> <strong>the</strong> <strong>nor<strong>the</strong>rn</strong> <strong>spotted</strong> owl. 74pp.<br />
U.S. Fish and Wildlife Service (USFWS). 2009. Notice <strong>of</strong> <strong>in</strong>tent to prepare an<br />
environmental impact statement related to experimental removal <strong>of</strong> Barred <strong>owls</strong><br />
for <strong>the</strong> conservation benefit <strong>of</strong> threatened Nor<strong>the</strong>rn Spotted Owls. Federal<br />
Register 74:65546-65548.<br />
U.S. Fish and Wildlife Service (USFWS). 2011. Protocol for survey<strong>in</strong>g proposed<br />
management activities that may impact <strong>spotted</strong> <strong>owls</strong>. USDI Fish and Wildlife<br />
Service, Portland, OR. 38 pp.<br />
Wash<strong>in</strong>gton State Department <strong>of</strong> Natural Resources (WDNR). 2011. GIS data center.<br />
http://www.dnr.wa.gov/ResearchScience/Topics/ForestHealthEcology/Pages/rp_f<br />
ores<strong>the</strong>alth.aspx<br />
20
21<br />
Publications and presentations <strong>in</strong> Fiscal Year 2012<br />
Sovern, S. G., E. D. Forsman, K. M. Dugger, and M. Taylor. Habitat use by Nor<strong>the</strong>rn<br />
Spotted Owls dur<strong>in</strong>g natal dispersal. In review.<br />
Sovern, S.G., E. D. Forsman, M. Taylor, and B. L. Biswell. Habitat use and home<br />
range <strong>of</strong> Nor<strong>the</strong>rn Spotted Owls on <strong>the</strong> east slope <strong>of</strong> <strong>the</strong> Cascades Mounta<strong>in</strong>s,<br />
Washiongton, 1989-1990. In review.<br />
Sovern, S. G., E. D. Forsman, G. S. Olson, B. L. Biswell, M. Taylor, and R. G. Anthony.<br />
Associations between Barred <strong>owls</strong>, landscape pattern and site occupancy <strong>of</strong> Nor<strong>the</strong>rn<br />
Spotted Owls <strong>in</strong> <strong>the</strong> eastern Cascades <strong>of</strong> Wash<strong>in</strong>gton. In review.<br />
“All about Owls”. “Nature <strong>of</strong> Night” program, 19 November, 2002, Central Wash<strong>in</strong>gton<br />
University Center for Excellence <strong>in</strong> Science and Ma<strong>the</strong>matics Education. A Powerpo<strong>in</strong>t<br />
presentation, owl pellet examples, and a live Great horned owl provided by <strong>the</strong> Kittitas<br />
Animal Rehabilitation Group.<br />
The Cle Elum Ranger District staff was given weekly updates <strong>of</strong> our owl surveys and<br />
<strong>in</strong>formation as needed <strong>in</strong> support <strong>of</strong> District projects.
22<br />
Apppendix 1<br />
Table 1. Number <strong>of</strong> Spotted <strong>owls</strong> banded each year on <strong>the</strong> Cle Elum Study Area, Okanogan-Wenatchee<br />
National forest, Wash<strong>in</strong>gton, 1989-2011. Total for juveniles <strong>in</strong>cludes 2 hybrid <strong>spotted</strong> x barred owl<br />
hybrids banded <strong>in</strong> 2009.<br />
Density Study Area<br />
General Study Area<br />
Year Adults (M,F) Subadults (M,F) Juveniles Adults (M,F) Subadults (M,F) Juveniles Total<br />
1989 12 (7,5) 3 (1,2) 10 16 (10,6) 2 (0,2) 10 53<br />
1990 5 (3,2) 2 (1,1) 12 38 (21,17) 4 (2,2) 28 89<br />
1991 5 (4,1) 2 (2,0) 7 20 (11,9) 12 (3,9) 34 80<br />
1992 0 (0,0) 2 (1,1) 16 16 (7,9) 2 (0,2) 60 96<br />
1993 1 (0,1) 1 (1,0) 2 7 (1,6) 4 (1,3) 8 23<br />
1994 0 (0,0) 1 (1,0) 14 4 (2,2) 2 (1,1) 52 73<br />
1995 0 (0,0) 2 (2,0) 8 4 (3,1) 2 (2,0) 23 39<br />
1996 0 (0,0) 1 (0,1) 12 2 (0,2) 0 (0,0) 39 54<br />
1997 0 (0,0) 0 (0,0) 0 4 (2,2) 3 (2,1) 3 10<br />
1998 0 (0,0) 1 (0,1) 9 2 (1,1) 2 (1,1) 43 57<br />
1999 0 (0,0) 1 (0,1) 7 1 (0,1) 1 (1,0) 8 18<br />
2000 0 (0,0) 2 (2,0) 11 1 (1,0) 3 (0,3) 18 35<br />
2001 1 (1,0) 0 (0,0) 9 2 (1,1) 0 (0,0) 15 27<br />
2002 0 (0,0) 0 (0,0) 5 1 (1,0) 1 (1,0) 11 18<br />
2003 0 (0,0) 1 (1,0) 13 5 (3,2) 1 (1,0) 16 36<br />
2004 0 (0,0) 1 (1,0) 5 2 (0,2) 1 (0,1) 14 23<br />
2005 0 (0,0) 0 (0,0) 7 1 (0,1) 1 (1,0) 11 20<br />
2006 0 (0,0) 1 (1,0) 5 1 (0,1) 0 (0,0) 11 18<br />
2007 1 (1,0) 2 (1,1) 3 3 (3,0) 2 (1,1) 11 22<br />
2008 0 (0,0) 1 (0,1) 3 0 (0,0) 0 (0,0) 6 10<br />
2009 0 (0,0) 0 (0,0) 2 3 (1,2) 1 (1,0) 9 15<br />
2010 0 (0,0) 0 (0,0) 2 0 (0,0) 0 (0,0) 9 11<br />
2011 0 (0,0) 0 (0,0) 2 0 (0,0) 1 (0,1) 7 10<br />
2012 0 (0,0) 0 (0,0) 2 0 (0,0) 0 (0,0) 5 6<br />
Total 25 (16,9) 24 (15,9) 166 133 (68,65) 45 (18,27) 451 844
23<br />
Table 2. Survey effort for <strong>the</strong> Cle Elum Study Area, Okanogan-Wenatchee National Forest, Wash<strong>in</strong>gton,<br />
1989-2012.<br />
territories<br />
surveyed to<br />
m<strong>in</strong>imum<br />
protocol 1<br />
territories<br />
surveyed to<br />
protocol 2<br />
new<br />
territories<br />
added<br />
total <strong>owls</strong><br />
detected<br />
territories<br />
<strong>in</strong>habited 3<br />
hybrid<br />
territories 4<br />
1989 0 19 19 36 19 0<br />
1990 0 46 27 83 43 0<br />
1991 0 71 27 109 59 0<br />
1992 0 82 10 120 64 0<br />
1993 0 80 3 101 54 0<br />
1994 0 87 3 99 53 0<br />
1995 0 86 1 93 51 0<br />
1996 0 81 1 82 46 0<br />
1997 0 86 1 68 40 0<br />
1998 0 87 0 78 44 0<br />
1999 0 82 1 76 45 0<br />
2000 0 82 1 68 39 0<br />
2001 0 80 0 56 33 0<br />
2002 8 75 0 44 26 0<br />
2003 10 75 2 50 28 0<br />
2004 8 77 0 49 26 0<br />
2005 8 77 0 46 26 0<br />
2006 8 77 0 46 29 0<br />
2007 8 77 0 40 23 0<br />
2008 8 75 0 36 26 0<br />
2009 8 75 0 31 22 1<br />
2010 8 75 0 26 18 0<br />
2011 8 75 0 21 11 1<br />
2012 8 75 0 20 13 0<br />
1 M<strong>in</strong>imum protocol consisted <strong>of</strong> one visit to <strong>the</strong> territory.<br />
2 Territories surveyed to protocol as outl<strong>in</strong>ed <strong>in</strong> L<strong>in</strong>t et al. (1999)<br />
3 A territory was considered <strong>in</strong>habited if one owl was detected dur<strong>in</strong>g <strong>the</strong> survey period, March-<br />
August<br />
4 Hybrid territories are those <strong>in</strong>habited by a pair composed <strong>of</strong> a Spotted and a Barred owl or by a<br />
<strong>spotted</strong> owl/barred owl hybrid
Table 3. Reproductive <strong>in</strong>dices <strong>of</strong> Spotted <strong>owls</strong> on <strong>the</strong> Cle Elum Study Area, Okanogan-Wenatchee<br />
National Forest, Wash<strong>in</strong>gton, 1989-2012.<br />
24<br />
Fecundity <strong>of</strong> female <strong>owls</strong> 1<br />
Mean brood size <strong>of</strong> successful<br />
nests 2<br />
Year n mean se n mean se<br />
1989 11 0.77 0.12 9 1.89 0.11<br />
1990 31 0.66 0.08 23 1.78 0.09<br />
1991 47 0.45 0.07 25 1.68 0.11<br />
1992 49 0.81 0.06 42 1.88 0.09<br />
1993 46 0.11 0.04 6 1.67 0.21<br />
1994 46 0.75 0.08 32 2.16 0.11<br />
1995 41 0.40 0.07 21 1.57 0.11<br />
1996 35 0.76 0.07 30 1.77 0.09<br />
1997 33 0.06 0.04 3 1.33 0.33<br />
1998 36 0.72 0.09 27 1.93 0.13<br />
1999 27 0.30 0.08 10 1.60 0.16<br />
2000 31 0.52 0.08 20 1.60 0.11<br />
2001 27 0.48 0.09 16 1.63 0.13<br />
2002 19 0.37 0.11 9 1.78 0.15<br />
2003 22 0.66 0.10 16 1.81 0.14<br />
2004 23 0.48 0.10 13 1.69 0.13<br />
2005 20 0.50 0.11 11 1.82 0.12<br />
2006 15 0.57 0.12 10 1.70 0.15<br />
2007 17 0.44 0.11 9 1.67 0.17<br />
2008 10 0.45 0.16 5 1.80 0.20<br />
2009 10 0.55 0.16 6 1.83 0.17<br />
2010 8 0.75 0.16 6 2.00 0.00<br />
2011 10 0.55 0.16 6 1.83 0.17<br />
2012 6 0.58 0.16 5 1.40 0.24<br />
Total 620 0.52 0.02 360 1.79 0.03<br />
1 Sample size (n) <strong>in</strong>cludes those females checked for reproductive status by<br />
August 31. Fecundity is <strong>the</strong> number <strong>of</strong> females fledged per female, assum<strong>in</strong>g a<br />
50:50 sex ratio.<br />
2 Mean brood size <strong>of</strong> nests that produced at least 1 young, and where <strong>the</strong> number<br />
<strong>of</strong> fledged young was determ<strong>in</strong>ed by August 31
Table 4. Reproductive <strong>in</strong>dices <strong>of</strong> Spotted <strong>owls</strong> on <strong>the</strong> Cle Elum Study Area, Okanogan-Wenatchee<br />
National Forest, Wash<strong>in</strong>gton, 1989-2012.<br />
proportion (π) <strong>of</strong> females that nested 1<br />
proportion (π) <strong>of</strong> nest<strong>in</strong>g<br />
females that fledged young 2<br />
proportion (π ) <strong>of</strong> all females<br />
that fledged young 3<br />
year n π 95% CI 4 n π 95% CI 4 n π 95% CI 4<br />
1989 8 0.88 0.47 - 1.00 7 1.00 0.59 - 1.00 11 0.82 0.48 - 0.98<br />
1990 20 0.90 0.68 - 0.99 17 0.94 0.71 - 1.00 31 0.74 0.55 - 0.88<br />
1991 34 0.65 0.46 - 0.80 22 0.82 0.60 - 0.95 47 0.53 0.38 - 0.68<br />
1992 47 1.00 0.92 - 1.00 43 0.88 0.75 - 0.96 49 0.86 0.73 - 0.94<br />
1993 41 0.17 0.07 - 0.32 7 0.86 0.42 - 1.00 46 0.13 0.05 - 0.26<br />
1994 40 0.93 0.80 - 0.98 37 0.78 0.62 - 0.90 46 0.70 0.54 - 0.82<br />
1995 35 0.66 0.48 - 0.81 23 0.87 0.66 - 0.97 41 0.51 0.35 - 0.67<br />
1996 34 0.97 0.85 - 1.00 33 0.91 0.76 - 0.98 35 0.86 0.70 - 0.95<br />
1997 27 0.15 0.04 - 0.34 4 0.75 0.19 - 0.99 33 0.09 0.02 - 0.24<br />
1998 34 0.91 0.76 - 0.98 31 0.84 0.66 - 0.95 36 0.75 0.58 - 0.88<br />
1999 20 0.60 0.36 - 0.81 12 0.75 0.43 - 0.95 27 0.37 0.19 - 0.58<br />
2000 27 0.81 0.62 - 0.94 22 0.91 0.71 - 0.99 31 0.65 0.45 - 0.81<br />
2001 23 0.74 0.52 - 0.90 17 0.82 0.57 - 0.96 27 0.59 0.39 - 0.78<br />
2002 17 0.59 0.33 - 0.82 10 0.80 0.44 - 0.97 19 0.47 0.24 - 0.71<br />
2003 20 0.95 0.75 - 1.00 18 0.78 0.52 - 0.94 22 0.73 0.50 - 0.89<br />
2004 20 0.75 0.51 - 0.91 15 0.80 0.52 - 0.96 23 0.57 0.34 - 0.77<br />
2005 19 0.58 0.34 - 0.80 11 0.91 0.59 - 1.00 20 0.55 0.32 - 0.77<br />
2006 13 0.92 0.64 - 1.00 12 0.67 0.35 - 0.90 15 0.67 0.38 - 0.88<br />
2007 16 0.63 0.35 - 0.84 10 0.90 0.55 - 1.00 17 0.53 0.28 - 0.77<br />
2008 6 0.83 0.36 - 1.00 5 0.80 0.28 - 0.99 10 0.50 0.19 - 0.81<br />
2009 6 0.83 0.36 - 1.00 5 1.00 0.48 - 1.00 10 0.60 0.26 0.88<br />
2010 5 1.00 0.48 - 1.00 5 0.80 0.28 - 0.99 8 0.75 0.35 - 0.97<br />
2011 5 0.80 0.28 - 0.99 4 0.75 0.19 - 0.99 10 0.60 0.26 - 0.88<br />
2012 4 1.00 0.40 - 1.00 4 1.0 0.40 - 1.00 6 0.83 0.36 - 0.99<br />
Total 521 0.73 0.69 - 0.77 374 0.85 0.81 - 0.88 620 0.58 0.54 - 0.62<br />
1 Sample size (n) <strong>in</strong>cludes females that were checked for nest<strong>in</strong>g status before June 15<br />
2 Sample size (n) <strong>in</strong>cludes nest<strong>in</strong>g females that were checked for reproductive status by August 31<br />
3 Sample size (n) <strong>in</strong>cludes all females that were checked for reproductive status by August 31. The sample size for this<br />
<strong>in</strong>dex is commonly larger than o<strong>the</strong>r <strong>in</strong>dices because we <strong>of</strong>ten cannot make <strong>the</strong> required visits to determ<strong>in</strong>e nest<strong>in</strong>g<br />
status before <strong>the</strong> June15 cut<strong>of</strong>f due to limited access or low response rates for non-nest<strong>in</strong>g females.<br />
4 Exact confidence limits for <strong>the</strong> b<strong>in</strong>omial proportion us<strong>in</strong>g <strong>the</strong> F distribution, Collett (1991)<br />
25