Demographic characteristics of northern spotted owls in the Eastern ...
Demographic characteristics of northern spotted owls in the Eastern ...
Demographic characteristics of northern spotted owls in the Eastern ...

You also want an ePaper? Increase the reach of your titles
YUMPU automatically turns print PDFs into web optimized ePapers that Google loves.
8<br />
Barred <strong>owls</strong> and Spotted Owls<br />
The range <strong>of</strong> <strong>the</strong> Barred Owl now overlaps<br />
<strong>the</strong> range <strong>of</strong> <strong>the</strong> Nor<strong>the</strong>rn Spotted Owl,<br />
and <strong>the</strong> potential for <strong>the</strong> Barred Owl to<br />
negatively affect <strong>the</strong> Spotted Owl<br />
population has been a concern for many<br />
years (Taylor and Forsman 1976,<br />
Courtney et al. 2006). Kelly et al. (2003)<br />
found that apparent occupancy and<br />
reproduction <strong>of</strong> Spotted Owls were lower<br />
when Barred <strong>owls</strong> were detected nearby.<br />
Thus, monitor<strong>in</strong>g <strong>the</strong> number <strong>of</strong> <strong>in</strong>habited<br />
Barred Owl territories is an important<br />
<strong>in</strong>dex to measure <strong>the</strong> effect <strong>of</strong> Barred <strong>owls</strong><br />
on Spotted Owl population trends (Olson<br />
et al. 2005)<br />
General Study Area<br />
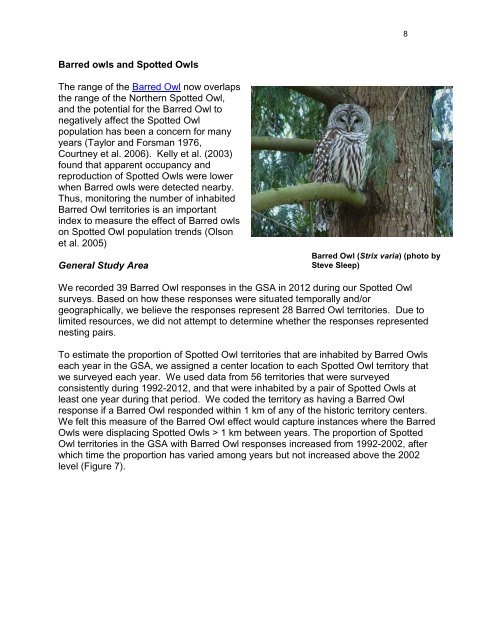
Barred Owl (Strix varia) (photo by<br />
Steve Sleep)<br />
We recorded 39 Barred Owl responses <strong>in</strong> <strong>the</strong> GSA <strong>in</strong> 2012 dur<strong>in</strong>g our Spotted Owl<br />
surveys. Based on how <strong>the</strong>se responses were situated temporally and/or<br />
geographically, we believe <strong>the</strong> responses represent 28 Barred Owl territories. Due to<br />
limited resources, we did not attempt to determ<strong>in</strong>e whe<strong>the</strong>r <strong>the</strong> responses represented<br />
nest<strong>in</strong>g pairs.<br />
To estimate <strong>the</strong> proportion <strong>of</strong> Spotted Owl territories that are <strong>in</strong>habited by Barred Owls<br />
each year <strong>in</strong> <strong>the</strong> GSA, we assigned a center location to each Spotted Owl territory that<br />
we surveyed each year. We used data from 56 territories that were surveyed<br />
consistently dur<strong>in</strong>g 1992-2012, and that were <strong>in</strong>habited by a pair <strong>of</strong> Spotted Owls at<br />
least one year dur<strong>in</strong>g that period. We coded <strong>the</strong> territory as hav<strong>in</strong>g a Barred Owl<br />
response if a Barred Owl responded with<strong>in</strong> 1 km <strong>of</strong> any <strong>of</strong> <strong>the</strong> historic territory centers.<br />
We felt this measure <strong>of</strong> <strong>the</strong> Barred Owl effect would capture <strong>in</strong>stances where <strong>the</strong> Barred<br />
Owls were displac<strong>in</strong>g Spotted Owls > 1 km between years. The proportion <strong>of</strong> Spotted<br />
Owl territories <strong>in</strong> <strong>the</strong> GSA with Barred Owl responses <strong>in</strong>creased from 1992-2002, after<br />
which time <strong>the</strong> proportion has varied among years but not <strong>in</strong>creased above <strong>the</strong> 2002<br />
level (Figure 7).