Scientific Visualizations: Bridge-Building between ... - Mario Petrucci
Scientific Visualizations: Bridge-Building between ... - Mario Petrucci
Scientific Visualizations: Bridge-Building between ... - Mario Petrucci

Create successful ePaper yourself
Turn your PDF publications into a flip-book with our unique Google optimized e-Paper software.
SCIENTIFIC VISUALIZATIONS<br />
289<br />
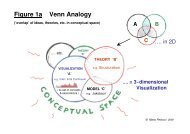
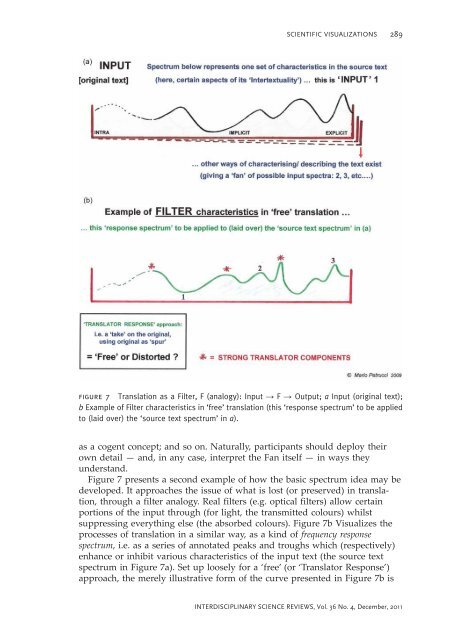
figure 7 Translation as a Filter, F (analogy): Input → F → Output; a Input (original text);<br />
b Example of Filter characteristics in ‘free’ translation (this ‘response spectrum’ to be applied<br />
to (laid over) the ‘source text spectrum’ in a).<br />
as a cogent concept; and so on. Naturally, participants should deploy their<br />
own detail — and, in any case, interpret the Fan itself — in ways they<br />
understand.<br />
Figure 7 presents a second example of how the basic spectrum idea may be<br />
developed. It approaches the issue of what is lost (or preserved) in translation,<br />
through a filter analogy. Real filters (e.g. optical filters) allow certain<br />
portions of the input through (for light, the transmitted colours) whilst<br />
suppressing everything else (the absorbed colours). Figure 7b Visualizes the<br />
processes of translation in a similar way, as a kind of frequency response<br />
spectrum, i.e. as a series of annotated peaks and troughs which (respectively)<br />
enhance or inhibit various characteristics of the input text (the source text<br />
spectrum in Figure 7a). Set up loosely for a ‘free’ (or ‘Translator Response’)<br />
approach, the merely illustrative form of the curve presented in Figure 7b is<br />
INTERDISCIPLINARY SCIENCE REVIEWS, Vol. 36 No. 4, December, 2011