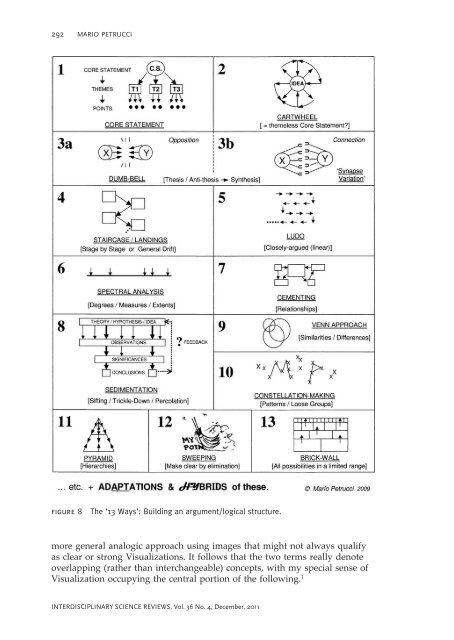
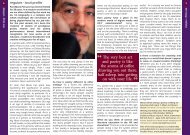
SCIENTIFIC VISUALIZATIONS 291 formulated quite differently from what is shown, and the specific nature and location of the proposed peaks and troughs is not to be agonized over. These curves are not reproducible fingerprints like the absorption spectra of gases or the emission spectra of stars; nor should the common perception of filters as purely mechanistic lead to any general conclusion that translation is merely a mechanical procedure (though computerized translations may indeed qualify). The deeper function of these analogies is to provide sites for initial understanding and study rather than any theoretical or experimental closure; once they have served their purpose, move on. My final example (Figure 8) has more to do with study skills than literary studies, but I include it here for its aesthetic power and downright usefulness. This chart provides an accessible, productive framework in which to discuss possible structures for all manner of oral and written work. True, only some of the ‘Ways’ draw on genuine <strong>Visualizations</strong> taken from science and mathematics, while others may seem closer to cartoons, making it a kind of hybrid resource. Nevertheless, The 13 Ways — generated and refined in a 4-year study of student essays and presentations, initiated during a Royal Literary Fund Fellowship at Oxford Brookes University — became an invaluable and flexible tool for students and staff there, forming part of a thriving study skills module in the Department of English Studies. The chart can be downloaded (with supporting notes on its application in class) via the public section of the Royal Literary Fund’s website (<strong>Petrucci</strong> 2005). What counts here, once more, is not any definitive or exhaustive quality in the chart, but what it achieves in practice. I am thinking, for example, of that precious clarity <strong>between</strong> tutor and overseas student when either of them can point to one of these images and make herself finally, completely, understood. Three clarifications I must address three tricky issues somewhat skirted around in previous sections, deferred until now so that the reader could first broadly grasp the concept (and some trial examples) of Visualization. • The distinction <strong>between</strong> Visualization and visual analogy. • The distinction <strong>between</strong> diagram and Visualization. • The use of text (titles, annotations, captions, etc.) within <strong>Visualizations</strong>. Taking these in order: to what extent are my terms ‘Visualization’ and ‘visual analogy’ analogous? To answer that, I must revisit my earlier observation that the pilot <strong>Visualizations</strong> in this paper have ‘the inbuilt character both of an analogy and of a scientific Visualization’. I somewhat circumvented there the subtlety that, strictly speaking, a Visualization is a representation of a situation, while a visual analogy is a representing object applied <strong>between</strong> situations (i.e. from source to target). Thus, a Visualization is not necessarily an analogy. A strange magnetic field pattern, for instance, does not automatically (or obviously) stand for anything else: it may be wielded elsewhere, as an analogy, but only if fit for that purpose. Likewise, some visual analogies are merely pictorial or whimsical, lacking the structural rigour of a good Visualization — I therefore tend to reserve the phrase ‘visual analogy’ for a INTERDISCIPLINARY SCIENCE REVIEWS, Vol. 36 No. 4, December, 2011
292 MARIO PETRUCCI figure 8 The ‘13 Ways’: <strong>Building</strong> an argument/logical structure. more general analogic approach using images that might not always qualify as clear or strong <strong>Visualizations</strong>. It follows that the two terms really denote overlapping (rather than interchangeable) concepts, with my special sense of Visualization occupying the central portion of the following. 1 INTERDISCIPLINARY SCIENCE REVIEWS, Vol. 36 No. 4, December, 2011