Validation of the Student Engagement Instrument - PsychWiki
Validation of the Student Engagement Instrument - PsychWiki
Validation of the Student Engagement Instrument - PsychWiki

You also want an ePaper? Increase the reach of your titles
YUMPU automatically turns print PDFs into web optimized ePapers that Google loves.
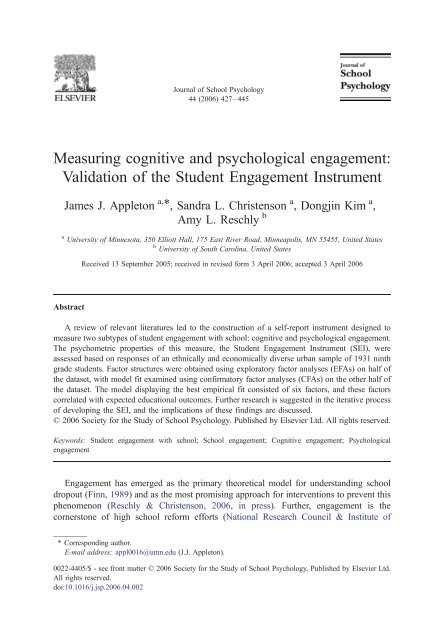
Journal <strong>of</strong> School Psychology44 (2006) 427–445Measuring cognitive and psychological engagement:<strong>Validation</strong> <strong>of</strong> <strong>the</strong> <strong>Student</strong> <strong>Engagement</strong> <strong>Instrument</strong>James J. Appleton a, *, Sandra L. Christenson a , Dongjin Kim a ,Amy L. Reschly ba University <strong>of</strong> Minnesota, 350 Elliott Hall, 175 East River Road, Minneapolis, MN 55455, United Statesb University <strong>of</strong> South Carolina, United StatesReceived 13 September 2005; received in revised form 3 April 2006; accepted 3 April 2006AbstractA review <strong>of</strong> relevant literatures led to <strong>the</strong> construction <strong>of</strong> a self-report instrument designed tomeasure two subtypes <strong>of</strong> student engagement with school: cognitive and psychological engagement.The psychometric properties <strong>of</strong> this measure, <strong>the</strong> <strong>Student</strong> <strong>Engagement</strong> <strong>Instrument</strong> (SEI), wereassessed based on responses <strong>of</strong> an ethnically and economically diverse urban sample <strong>of</strong> 1931 ninthgrade students. Factor structures were obtained using exploratory factor analyses (EFAs) on half <strong>of</strong><strong>the</strong> dataset, with model fit examined using confirmatory factor analyses (CFAs) on <strong>the</strong> o<strong>the</strong>r half <strong>of</strong><strong>the</strong> dataset. The model displaying <strong>the</strong> best empirical fit consisted <strong>of</strong> six factors, and <strong>the</strong>se factorscorrelated with expected educational outcomes. Fur<strong>the</strong>r research is suggested in <strong>the</strong> iterative process<strong>of</strong> developing <strong>the</strong> SEI, and <strong>the</strong> implications <strong>of</strong> <strong>the</strong>se findings are discussed.D 2006 Society for <strong>the</strong> Study <strong>of</strong> School Psychology. Published by Elsevier Ltd. All rights reserved.Keywords: <strong>Student</strong> engagement with school; School engagement; Cognitive engagement; Psychologicalengagement<strong>Engagement</strong> has emerged as <strong>the</strong> primary <strong>the</strong>oretical model for understanding schooldropout (Finn, 1989) and as <strong>the</strong> most promising approach for interventions to prevent thisphenomenon (Reschly & Christenson, 2006, in press). Fur<strong>the</strong>r, engagement is <strong>the</strong>cornerstone <strong>of</strong> high school reform efforts (National Research Council & Institute <strong>of</strong>* Corresponding author.E-mail address: appl0016@umn.edu (J.J. Appleton).0022-4405/$ - see front matter D 2006 Society for <strong>the</strong> Study <strong>of</strong> School Psychology. Published by Elsevier Ltd.All rights reserved.doi:10.1016/j.jsp.2006.04.002
428J.J. Appleton et al. / Journal <strong>of</strong> School Psychology 44 (2006) 427–445Medicine, 2004) and has been described as a potential bmeta-constructQ in <strong>the</strong> field <strong>of</strong>education (Fredericks, Blumenfeld, & Paris, 2004), bringing toge<strong>the</strong>r many separate lines<strong>of</strong> research under one conceptual model.Although interest in engagement has increased exponentially in recent years, itsdistinction from motivation remains subject to debate. As one conceptualization, motivationhas been thought <strong>of</strong> in terms <strong>of</strong> <strong>the</strong> direction, intensity, and quality <strong>of</strong> one’s energies (Maehr& Meyer, 1997), answering <strong>the</strong> question <strong>of</strong> bwhyQ for a given behavior. In this regard,motivation is related to underlying psychological processes, including autonomy (e.g.,Grolnick & Ryan, 1987; Skinner, Wellborn, & Connell, 1990), belonging (e.g., Goodenow,1993a, 1993b; Goodenow & Grady, 1993), and competence (e.g., Schunk, 1991). Incontrast, engagement is described as benergy in action, <strong>the</strong> connection between person andactivityQ (Russell, Ainley, & Frydenberg, 2005, p. 1). <strong>Engagement</strong> thus reflects a person’sactive involvement in a task or activity (Reeve, Jang, Carrell, Jeon, & Barch, 2004). Toillustrate this distinction as it pertains to reading tasks, motivational aspects include (a)perceptions <strong>of</strong> reading competency, (b) <strong>the</strong> perceived value <strong>of</strong> reading in order to obtainlarger goals (e.g., better grades, parent/teacher praise), and (c) <strong>the</strong> perceived ability tosucceed at <strong>the</strong> reading task, among o<strong>the</strong>rs (Guthrie & Wigfield, 2000). <strong>Engagement</strong> aspectsinclude <strong>the</strong> number <strong>of</strong> words that were read or <strong>the</strong> amount <strong>of</strong> text that was comprehendedwith deeper processing <strong>of</strong> <strong>the</strong> content. This conceptualization suggests that motivation andengagement are separate but not orthogonal (Connell & Wellborn, 1991; Furrer & Skinner,2003; Skinner & Belmont, 1993). That is, one can be motivated but not actively engage in atask. Motivation is thus necessary, but not sufficient for engagement.Although motivation is central to understanding engagement, <strong>the</strong> latter is a constructworthy <strong>of</strong> study in its own right. Klem and Connell (2004) argued that <strong>the</strong>re is strongempirical support for <strong>the</strong> connection between engagement, achievement and schoolbehavior across levels <strong>of</strong> economic and social advantage and disadvantage. Furrer,Skinner, Marchand, and Kindermann (2006) also noted that engagement may be vitalwithin a motivational framework as it interacts cyclically with contextual variables;resultant academic, behavioral, and social outcomes, <strong>the</strong>n, are <strong>the</strong> products <strong>of</strong> <strong>the</strong>secontext-influenced changes in engagement. In addition, <strong>the</strong> construct <strong>of</strong> engagementcaptures <strong>the</strong> gradual process by which students disconnect from school (Finn, 1989).Consistent with <strong>the</strong> understanding that dropping out <strong>of</strong> school is not an instantaneousevent, but ra<strong>the</strong>r a process that occurs over time, engagement provides a means both forunderstanding and intervening when early signs <strong>of</strong> students’ disconnection with schooland learning are noted. Finally, engagement calls for a focus on alterable variables,including those that address underlying psychological processes, to help increase schoolcompletion rates (Connell, Halpern-Felsher, Clifford, Crichlow, & Usinger, 1995; Doll,Hess, & Ochoa, 2001) and to reform high school experiences to help foster students’achievement motivation (National Research Council & Institute <strong>of</strong> Medicine, 2004).Conceptualizing cognitive and psychological engagement<strong>Engagement</strong> is typically described as having multiple components. In Finn’s (1989)model, engagement is comprised <strong>of</strong> behavioral (participation in class and school) and
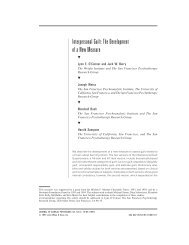
J.J. Appleton et al. / Journal <strong>of</strong> School Psychology 44 (2006) 427–445 429affective components (school identification, belonging, valuing learning). Similardefinitions have also been <strong>of</strong>fered by Newmann, Wehlage, and Lamborn (1992) andMarks (2000). Two recent reviews <strong>of</strong> this literature, however, concluded that engagementwas comprised <strong>of</strong> three subtypes: behavioral (e.g., positive conduct, effort, participation),cognitive (e.g., self-regulation, learning goals, investment in learning), and emotional oraffective (e.g., interest, belonging, positive attitude about learning) (Fredericks et al., 2004;Jimerson, Campos, & Greif, 2003).Based on <strong>the</strong> <strong>the</strong>oretical work <strong>of</strong> Finn (1989), Connell (Connell, 1990; Connell &Wellborn, 1991) and McPartland (1994) as well as implementation <strong>of</strong> <strong>the</strong> Check &Connect 1 intervention model over 13 years in varied school settings, we have proposedand refined a taxonomy, or organizing heuristic, not only for understanding student levels<strong>of</strong> engagement, but for recognizing <strong>the</strong> goodness-<strong>of</strong>-fit between <strong>the</strong> student, <strong>the</strong> learningenvironment and factors that influence <strong>the</strong> fit (Christenson & Anderson, 2002; Reschly &Christenson, 2006, in press). Qualitative comments from students who received <strong>the</strong> Check& Connect intervention during high school (Sinclair, Christenson, & Thurlow, 2005)influenced our own conceptualization <strong>of</strong> engagement. In our taxonomy, engagement isviewed as a multi-dimensional construct comprised <strong>of</strong> four subtypes: academic,behavioral, cognitive, and psychological. There are multiple indicators for each subtype.For example, academic engagement consists <strong>of</strong> variables such as time on task, creditsearned toward graduation, and homework completion, while attendance, suspensions,voluntary classroom participation, and extra-curricular participation are indicators <strong>of</strong>behavioral engagement. Cognitive and psychological engagement includes less observable,more internal indicators, such as self-regulation, relevance <strong>of</strong> schoolwork to futureendeavors, value <strong>of</strong> learning, and personal goals and autonomy (for cognitiveengagement), and feelings <strong>of</strong> identification or belonging, and relationships with teachersand peers (for psychological engagement). Our proposed taxonomy is a useful heuristic,but given <strong>the</strong> myriad <strong>of</strong> indicators comprising <strong>the</strong> engagement subtypes and <strong>the</strong> diversity<strong>of</strong> contexts that <strong>the</strong>y include (e.g., adults at school, family, community, peers), we contendthat <strong>the</strong> emergence <strong>of</strong> a single factor comprising each subtype is highly improbable. Whatis more likely are indicators underlying each subtype that are consistent with importantcontexts (e.g., relationships with adults at school, support from family members, peersupport). Fig. 1 depicts <strong>the</strong> four subtypes, <strong>the</strong> contexts influencing <strong>the</strong>m, and examples <strong>of</strong><strong>the</strong>ir respective indicators.The majority <strong>of</strong> research has focused on <strong>the</strong> more observable indicators that are relatedto academic and behavioral engagement. Although less research has focused on cognitiveand psychological indicators <strong>of</strong> engagement (in comparison to academic and behavioralindicators), <strong>the</strong>re is evidence to suggest <strong>the</strong>ir importance to school performance. Forexample, a robust relationship has been found between cognitive engagement and bothpersonal goal orientation and investment in learning (Greene & Miller, 1996; Greene,Miller, Crowson, Duke, & Akey, 2004; Pokay & Blumenfeld, 1990), which in turn hasbeen associated with academic achievement (Miller, Greene, Montalvo, Ravindran, &Nichols, 1996). Similarly, psychological engagement has been associated with adaptive1 More information may be found at http://ici.umn.edu/checkandconnect/.
430J.J. Appleton et al. / Journal <strong>of</strong> School Psychology 44 (2006) 427–445CONTEXT STUDENT ENGAGEMENT OUTCOMESFamily Academic AcademicAcademic and motivationalsupport for learningGoals and expectationsMonitoring/supervisionLearning resources in <strong>the</strong>homePeersEducational expectationsShared common school valuesAttendanceAcademic beliefs and effortsPeers' aspiration for learningSchool• Time on task• Credit hours toward graduation• Homework completionBehavioral• Attendance• Classroom participation(voluntary)• Extracurricular participation• Extra credit optionsCognitive• Self-regulation• Relevance <strong>of</strong> school to futureaspirations• Value <strong>of</strong> learning (goal setting)• Strategizing• Grades• Performance onstandardized tests• Passing Basic SkillsTests• GraduationSocial• Social awareness• Relationship Skillswith peers and adultsEmotionalSchool climateInstructional programming andlearning activitiesMental health supportClear and appropriate teacherexpectationsGoal structure (task vs ability)Teacher-student relationshipsPsychological• Belonging• Identification with school• School membership• Self-awareness <strong>of</strong>feelings• Emotion regulation• Conflict resolutionskillsFig. 1. <strong>Engagement</strong> subtypes, indicators and outcomes.school behaviors, including task persistence, participation, and attendance (Goodenow,1993a). In general, students who feel connected to and cared for by <strong>the</strong>ir teachers reportautonomous reasons for engaging in positive school-related behaviors (Ryan, Stiller, &Lynch, 1994). Given <strong>the</strong>se findings, it is necessary to move beyond indicators <strong>of</strong> academicand behavioral engagement to understanding <strong>the</strong> underlying cognitive and psychologicalneeds <strong>of</strong> students (see National Research Council & Institute <strong>of</strong> Medicine, 2004, p. 212 asfur<strong>the</strong>r support).Difficulties measuring cognitive and psychological engagement<strong>Engagement</strong> is a burgeoning construct; however, limitations have been noted whenmeasuring cognitive and psychological engagement. For example, <strong>the</strong> same scale items are<strong>of</strong>ten used to represent different subtypes <strong>of</strong> engagement across studies (Jimerson et al.,2003) and subtypes have been examined in isolation (Finn & Cox, 1992), precludingcomparison levels <strong>of</strong> different subtypes with <strong>the</strong> same participants. Also, survey items areat times extracted from larger, nationally representative databases and subtypes are formedfrom <strong>the</strong>se studies retroactively (e.g., Reschly & Christenson, in press). This proceduredoes not provide clarity in <strong>the</strong> definition <strong>of</strong> <strong>the</strong> construct <strong>of</strong> engagement or its subtypes.Fur<strong>the</strong>r, items/subtypes drawn retroactively from larger studies run <strong>the</strong> risk <strong>of</strong> not having astrong <strong>the</strong>oretical or conceptual framework. Moreover, <strong>the</strong> construct <strong>of</strong> engagement ingeneral, and <strong>the</strong> identification <strong>of</strong> subtypes in particular, represents an amalgamation <strong>of</strong>
432J.J. Appleton et al. / Journal <strong>of</strong> School Psychology 44 (2006) 427–445<strong>the</strong>se data were available, 61.4% were eligible for free or reduced lunch and 7.6% receivedspecial education services.As recommended by Seaman (2001), Chi-square tests were used primarily, andCramer’s V 2 secondarily, to examine differences between participants who completed <strong>the</strong>instrument and those who were selected but did not complete <strong>the</strong> scale. Between-groupChi-square tests indicated no differences for gender ( p = .673) or home language( p =.054). Significant Chi-square values and small V 2 values (.015–.031) were obtainedfor special education service status and ethnicity (with fewer students receiving specialeducation services and fewer students <strong>of</strong> African-American, Hispanic, and NativeAmerican descent completing scales). A significant and slightly more substantiverelationship (V 2 =.156, p b.001) was noted for free or reduced lunch status. These resultssuggest that <strong>the</strong> selected students who completed <strong>the</strong> SEI differed somewhat from thosewho were selected, but that <strong>the</strong>se differences were substantive only on <strong>the</strong> free and reducedlunch variable.<strong>Instrument</strong> constructionThe <strong>Student</strong> <strong>Engagement</strong> <strong>Instrument</strong> (SEI) (Appleton & Christenson, 2004) wasdeveloped from a review <strong>of</strong> <strong>the</strong> relevant literatures using computerized databases (e.g.,Education Full Text, ERIC, and PsycINFO) and hand searches from reference lists forselected articles. Terms including engagement, belonging, identification with school, selfregulation,academic engagement, behavioral engagement, cognitive engagement, andpsychological engagement were used in <strong>the</strong> literature search. Scale construction involvedcreating a detailed scale blueprint that captured <strong>the</strong> broad conceptualizations <strong>of</strong> cognitiveand psychological engagement discussed in <strong>the</strong> literature. These conceptualizations werega<strong>the</strong>red from empirical studies as well as by reviewing existing scales that were closelyrelated to engagement. Probes (broad queries) and items (specifically phrased questions)were subsequently created to construct a preliminary scale. Following <strong>the</strong> construction <strong>of</strong> <strong>the</strong>initial scale, <strong>the</strong> researchers continued to monitor <strong>the</strong> literature, refining or adding items asrelevant research and <strong>the</strong>ory suggested. The literature that was consulted when constructingitems for <strong>the</strong> SEI is noted in <strong>the</strong> References section or listed in <strong>the</strong> Fur<strong>the</strong>r Reading section.The SEI was initially piloted with 31 ethnically diverse eighth grade students randomlyselected from four homerooms in a school from a different district (with demographiccharacteristics similar to <strong>the</strong> district for <strong>the</strong> current study). Eighth-grade ra<strong>the</strong>r than 9thgrade students were selected, as <strong>the</strong>y were thought to be closer in age (late in springsemester) to fall 9th graders (<strong>the</strong> sample for <strong>the</strong> main study) than late spring 9th graders.These students examined <strong>the</strong> scale in two separate groups and provided feedback on <strong>the</strong>clarity, understanding and perceived relevancy <strong>of</strong> <strong>the</strong> items. This feedback led to semanticand structural changes and, on occasion, completely reworded items. The responses <strong>of</strong><strong>the</strong>se students were used solely to refine <strong>the</strong> SEI and were not included in <strong>the</strong> resultsdescribed in <strong>the</strong> next section.The full version <strong>of</strong> <strong>the</strong> SEI contained 30 items intended to measure student levels <strong>of</strong>cognitive engagement (e.g., perceived relevance <strong>of</strong> school) and 26 items intended toexamine psychological engagement (e.g., perceived connection with o<strong>the</strong>rs at school) from<strong>the</strong> perspective <strong>of</strong> <strong>the</strong> student. Six reverse-keyed items were intermittently positioned
J.J. Appleton et al. / Journal <strong>of</strong> School Psychology 44 (2006) 427–445 433throughout <strong>the</strong> scale to reduce response acquiescence. All items were scored via a fourpointLikert-type rating (1=strongly agree, 2=agree, 3=disagree, and 4=stronglydisagree). All items were coded (and reversed items were recoded) so that higher scoresindicated higher levels <strong>of</strong> engagement.District variablesData on additional variables were obtained from self-report and from <strong>the</strong> schooldistrict’s research department database. These variables consisted <strong>of</strong> gender, ethnicity, freeor reduced lunch status, special education status, documented suspensions, and NorthwestAchievement Levels Test (NALT) results for both reading and ma<strong>the</strong>matics. NALT resultswere provided in <strong>the</strong> form <strong>of</strong> normal curve equivalents (NCEs), with a mean <strong>of</strong> 50 andstandard deviation <strong>of</strong> 21.06.Data collection proceduresResearchers administered <strong>the</strong> scale to all students in each randomly selected generaleducation classroom. To avoid singling out individual students while ensuring acontinuum <strong>of</strong> student perspectives, passive ra<strong>the</strong>r than active consent was used, whichwas granted by <strong>the</strong> school district. Steps were taken to control response acquiescence andcareless responding. Specifically, and in addition to reverse-keying some items, studentswere closely monitored by teachers and scale administrators and informed <strong>of</strong> <strong>the</strong> purposes<strong>of</strong> <strong>the</strong> SEI, <strong>the</strong> impact <strong>the</strong>ir input may have in district policy, <strong>the</strong> value <strong>of</strong> <strong>the</strong>ir honestopinions regardless <strong>of</strong> <strong>the</strong>ir content, and <strong>the</strong> ensured anonymity <strong>of</strong> <strong>the</strong>ir responses. Thematrix containing all student responses also was examined for suspect patterns.The SEI was orally administered to control for <strong>the</strong> differing reading abilities <strong>of</strong>students. Researchers created and adhered to a standardized protocol to ensure similarprocedures during each administration. <strong>Student</strong>s not completing <strong>the</strong> scale were ei<strong>the</strong>runable to be located, absent from <strong>the</strong> class period, had parents/guardians who refused toconsent, or refused to give <strong>the</strong>ir own assent.The completed scales were subsequently scanned into a SPSS data file and examinedfor missing data. Any SEIs missing five or more data points were located and inspected.Any simple corrections (e.g., <strong>the</strong> scale was completed but done so in pen ra<strong>the</strong>r than <strong>the</strong>proper type <strong>of</strong> pencil) were made. Some <strong>of</strong> <strong>the</strong>se inspections revealed situations wherestudents had provided more than one answer to an item. Since most <strong>of</strong> <strong>the</strong>se involvedseemingly irreconcilable answers (e.g., bagreeQ and bdisagreeQ) and systematicallyadjusting only those items located in <strong>the</strong> verification process might introduce bias, <strong>the</strong>seresponses were coded as missing. Additionally, 10% <strong>of</strong> <strong>the</strong> scales were checked against <strong>the</strong>data set to verify proper scanning; no errors were found.Analysis logic and proceduresWe followed scale development methods involving initial construction <strong>of</strong> itemsaccording to emerging <strong>the</strong>ory, followed by exploratory factor analyses (EFAs) with arandomly selected half <strong>of</strong> <strong>the</strong> dataset to explore <strong>the</strong> underlying factor structure.
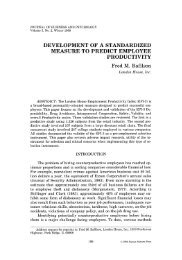
434J.J. Appleton et al. / Journal <strong>of</strong> School Psychology 44 (2006) 427–445Missing response patterns were first examined, and we found no evidence <strong>of</strong> systematicreasons for, or patterns in <strong>the</strong> missing responses. Second, <strong>the</strong> median values <strong>of</strong> <strong>the</strong>respective items were used to replace <strong>the</strong> missing responses. Of 108,136 expectedresponses in <strong>the</strong> dataset (1931 participants *56 items), 609 responses were replaced. Thereplaced values represented 609/108,136 or 0.006 <strong>of</strong> <strong>the</strong> response data, less than 1%.Polychoric correlations (Olsson, 1979) were first used to index <strong>the</strong> association betweenitems since <strong>the</strong>y were variables scored with multiple discrete categories. The MicroFACT(Waller, 2001) program was <strong>the</strong>n used to conduct <strong>the</strong> factor analyses, which were based on<strong>the</strong> polychoric matrices. Principal axis factoring was applied to extract <strong>the</strong> factors. Someresearchers (Cliff, 1988; Floyd & Widaman, 1995; Zwick & Velicer, 1986) have expressedconcern over using beigenvalues greater than 1.0Q as <strong>the</strong> sole criterion for determining <strong>the</strong>number <strong>of</strong> factors to retain and have recommended <strong>the</strong> use <strong>of</strong> scree plots. Therefore, screeplots were used in addition to eigenvalues to determine <strong>the</strong> number <strong>of</strong> factors to retain. Oncea range <strong>of</strong> factor models was determined (i.e., <strong>the</strong> scree plots and eigenvalues determined <strong>the</strong>most plausible models), separate EFAs were conducted that forced <strong>the</strong> items onto <strong>the</strong> number<strong>of</strong> factors for a particular model. The goal <strong>of</strong> this method was to refine or optimize eachmodel. During this process items that loaded less than .40 were removed (Netemeyer,Bearden, & Sharma, 2003). For each iteration, <strong>the</strong> Promax rotation method was used. Thefirst half <strong>of</strong> <strong>the</strong> dataset was used to establish plausible factor models.Following <strong>the</strong> EFA procedures, <strong>the</strong> fit <strong>of</strong> <strong>the</strong>se plausible models was examined usingconfirmatory factor analyses (CFAs). The o<strong>the</strong>r half <strong>of</strong> <strong>the</strong> dataset was used for <strong>the</strong>seanalyses. Model bfitQ was based on a variety <strong>of</strong> fit indices. Specifically, <strong>the</strong> Chi-square testwas used, although this test <strong>of</strong>ten rejects models based on large samples. To address thislimitation, <strong>the</strong> Chi-square to degrees <strong>of</strong> freedom ratio was also used. In general, v 2 /dfratios up to 5 have been used as general brules <strong>of</strong> thumbQ to establish reasonable fit (Marsh& Hocevar, 1985). Fur<strong>the</strong>r, <strong>the</strong> Comparative Fit Index (CFI), which is less sensitive tolarge samples, <strong>the</strong> Tucker–Lewis Index (TLI), which also has shown robustness to samplesize (Marsh, Balla, & McDonald, 1994), and <strong>the</strong> root mean square error <strong>of</strong> approximation(RMSEA) were also employed. The CFI ranges from 0 to 1 with <strong>the</strong> conventional valuefor acceptable model fit at .90 or greater (Garson, 2006). For <strong>the</strong> TLI, values less than .90indicate that <strong>the</strong> model could be substantially improved (Marsh et al., 1994) and thosegreater than .95 indicate well-fitting models (Hu & Bentler, 1999). Browne and Cudek’s(1992) criteria for interpreting RMSEA suggest that values less than .05 indicate closemodel fit, values between .05 and .08 indicate reasonable fit, those between .08 and .10indicate mediocre fit, and values greater than .10 indicate unacceptable fit. Finally, because<strong>the</strong> analyses compared models that were nested, differences in v 2 tests can be used tocompare goodness-<strong>of</strong>-fit between models.ResultsExploratory factor analysesPreliminary examinations <strong>of</strong> <strong>the</strong> polychoric correlations between items for <strong>the</strong> firstrandomly sampled half <strong>of</strong> <strong>the</strong> data set revealed three items that had inter-item correlations
J.J. Appleton et al. / Journal <strong>of</strong> School Psychology 44 (2006) 427–445 4354.54Eigenvalue3.532.521.510.5014710131619222528313437404346Eigenvalue4952Factor NumberFig. 2. EFA scree plot with factor 1 removed.less than .10. These items were removed from fur<strong>the</strong>r analyses. The remaining 53 itemswere <strong>the</strong>n submitted to an EFA using principal axis factoring. The resulting belbowQ in <strong>the</strong>scree plot indicated that between four and six factors should be retained (see Fig. 2).Additionally, an examination <strong>of</strong> <strong>the</strong> eigenvalues greater than one supported this decision,with <strong>the</strong> first six factors well above 1.0 (16.15, 3.83, 2.69, 2.13, 1.61, and 1.50,respectively) while <strong>the</strong> remaining factors approached <strong>the</strong> 1.0 criterion and <strong>the</strong> distancebetween <strong>the</strong>m was incrementally less (1.23, 1.17, 1.08, and 1.01). Given <strong>the</strong>se results, wedecided to conduct fur<strong>the</strong>r EFAs with <strong>the</strong> four, five and six-factor models as <strong>the</strong> mostplausible. The separate EFAs used similar procedures to those involved in <strong>the</strong> initial EFA,with <strong>the</strong> additional requirement that items load on factors at .40 or higher. The process wasiterative, with each model undergoing EFAs until all items loaded at .40 or higher(Netemeyer et al., 2003).The refined four- and five-factor models with named factors and items that loaded oneach cognitive engagement (CE) or psychological engagement (PE) subtype appear below.The items comprising <strong>the</strong> six-factor model, listed in order <strong>of</strong> <strong>the</strong> strength <strong>of</strong> <strong>the</strong>ir factorloadings are depicted in Table 1.! The four-factor model consisted <strong>of</strong> <strong>the</strong> following factors: Control and Relevance <strong>of</strong>School Work (CE) (13, 10, 14, 17, 12, 15, 16, 27, 28, 36 2 , 18), Teacher–<strong>Student</strong>Relationships (PE) (3, 2, 4, 6, 5, 7, 9, 8), Peer Support for Learning (PE) (19, 20, 21, 24,22, 23, 45 2 ), and Commitment to and Control over Learning (CE) (34, 35, 33, 26, 51 2 ).! The five-factor model consisted <strong>of</strong> <strong>the</strong> first five factors specified in <strong>the</strong> six-factor model,with <strong>the</strong> same order <strong>of</strong> factor loadings.2 Item Texts: bSchoolwork is important to completeQ, bI feel like a part <strong>of</strong> my schoolQ (Goodenow, 1993a,1993b), and bMost <strong>of</strong> <strong>the</strong> time I am capable <strong>of</strong> doing <strong>the</strong> work that school subjects require <strong>of</strong> meQ were alldropped in <strong>the</strong> six-factor solution.
436J.J. Appleton et al. / Journal <strong>of</strong> School Psychology 44 (2006) 427–445Table 1Items comprising <strong>the</strong> six-factor model a,bItem ComponentItem textPE 1 c CE 2 d PE 3 e CE 4 f PE 5 g CE 6 h1 0.795 0.143 0.074 0.156 0.063 0.026 Overall, adults at my school treat students fairly.2 0.767 0.118 0.056 0.052 0.044 0.006 Adults at my school listen to <strong>the</strong> students.3 0.762 0.040 0.008 0.082 0.085 0.058 At my school, teachers care about students.4 0.721 0.057 0.053 0.063 0.099 0.060 My teachers are <strong>the</strong>re for me when I need <strong>the</strong>m.5 0.710 0.061 0.053 0.166 0.065 0.000 The school rules are fair.6 0.676 0.031 0.006 0.081 0.010 0.005 Overall, my teachers are open and honestwith me.7 0.568 0.092 0.102 0.021 0.074 0.042 I enjoy talking to <strong>the</strong> teachers here.8 0.486 0.058 0.259 0.026 0.065 0.063 I feel safe at school.9 0.465 0.198 0.092 0.113 0.083 0.009 Most teachers at my school are interested in meas a person, not just as a student.10 0.072 0.691 0.013 0.126 0.115 0.045 The tests in my classes do a good job <strong>of</strong>measuring what I’m able to do.11 0.074 0.683 0.079 0.027 0.073 0.042 Most <strong>of</strong> what is important to know you learnin school.12 0.020 0.648 0.122 0.034 0.168 0.012 The grades in my classes do a good job <strong>of</strong>measuring what I’m able to do.13 0.053 0.601 0.125 0.205 0.066 0.025 What I’m learning in my classes will beimportant in my future.14 0.009 0.588 0.011 0.040 0.054 0.077 After finishing my schoolwork I check it overto see if it’s correct.15 0.021 0.549 0.090 0.040 0.142 0.032 When I do schoolwork I check to see whe<strong>the</strong>rI understand what I’m doing.16 0.114 0.524 0.022 0.079 0.018 0.047 Learning is fun because I get better atsomething.17 0.064 0.492 0.043 0.265 0.073 0.039 When I do well in school it’s because I work hard.18 0.020 0.451 0.135 0.077 0.061 0.072 I feel like I have a say about what happens tome at school.19 0.094 0.069 0.831 0.033 0.086 0.002 O<strong>the</strong>r students at school care about me.20 0.150 0.051 0.759 0.068 0.049 0.041 <strong>Student</strong>s at my school are <strong>the</strong>re for me whenI need <strong>the</strong>m.21 i 0.056 0.115 0.744 0.065 0.042 0.042 O<strong>the</strong>r students here like me <strong>the</strong> way I am.22 0.015 0.020 0.678 0.119 0.015 0.010 I enjoy talking to <strong>the</strong> students here.23 0.169 0.085 0.625 0.007 0.059 0.022 <strong>Student</strong>s here respect what I have to say.24 0.244 0.034 0.619 0.165 0.224 0.009 I have some friends at school.25 0.057 0.129 0.068 0.889 0.021 0.024 I plan to continue my education followinghigh school.26 0.066 0.082 0.010 0.795 0.016 0.061 Going to school after high school is important.27 0.080 0.306 0.050 0.653 0.013 0.008 School is important for achieving my future goals.28 0.032 0.222 0.060 0.571 0.009 0.034 My education will create many futureopportunities for me.29 0.057 0.264 0.146 0.443 0.030 0.002 I am hopeful about my future.30 0.025 0.058 0.027 0.048 0.828 0.018 My family/guardian(s) are <strong>the</strong>re for me whenI need <strong>the</strong>m.31 0.075 0.008 0.001 0.005 0.797 0.011 When I have problems at school myfamily/guardian(s) are willing to help me.32 0.104 0.061 0.002 0.076 0.624 0.068 When something good happens at school, myfamily/guardian(s) want to know about it.
J.J. Appleton et al. / Journal <strong>of</strong> School Psychology 44 (2006) 427–445 437Table 1 (continued)Item ComponentItem textPE 1 c CE 2 d PE 3 e CE 4 f PE 5 g CE 6 h33 0.018 0.033 0.005 0.252 0.479 0.096 My family/guardian(s) want me to keep tryingwhen things are tough at school.34 0.043 0.054 0.007 0.012 0.016 0.835 I’ll learn, but only if my family/guardian(s) giveme a reward. (Reversed)35 0.074 0.017 0.002 0.033 0.008 0.802 I’ll learn, but only if <strong>the</strong> teacher gives me areward. (Reversed)a The four- and five-factor models are specified in <strong>the</strong> text.b Items are renumbered from <strong>the</strong>ir original format for clearer presentation.c Teacher–<strong>Student</strong> Relationships (Psychological <strong>Engagement</strong>).d Control and Relevance <strong>of</strong> School Work (Cognitive <strong>Engagement</strong>).e Peer Support for Learning (Psychological <strong>Engagement</strong>).f Future Aspirations and Goals (Cognitive <strong>Engagement</strong>).g Family Support for Learning (Psychological <strong>Engagement</strong>).h Extrinsic Motivation (Cognitive <strong>Engagement</strong>).i From Goodenow (1993a).! Finally, <strong>the</strong> six-factor model included an additional two items (34 and 35) that initiallyloaded on <strong>the</strong> Commitment to and Control over Learning factor in <strong>the</strong> four-factorsolution. These items were given <strong>the</strong> label Extrinsic Motivation (CE).Confirmatory factor analysesFour-, five- and six-factor models were subjected to CFAs using <strong>the</strong> remaining half <strong>of</strong><strong>the</strong> dataset. Results <strong>of</strong> <strong>the</strong> Chi-square test, v 2 /df ratio, Dv 2 , CFI, TLI, and RMSEA arereported in Table 2. The Chi-square values for <strong>the</strong> four- (v 2 = 3520.508, df =428,p b.0001), five- (v 2 =2576.336, df =485, p b.0001), and six- (v 2 =2780.047, df =545,p b.0001) factor models were significant, which is a common result when using <strong>the</strong> Chisquarestatistic with large samples. To adjust for sample size, v 2 /df ratios were computed,resulting in a ratio <strong>of</strong> 8.23 for <strong>the</strong> four-, 5.31 for <strong>the</strong> five-, and 5.10 for <strong>the</strong> six-factormodel. The ratios for <strong>the</strong> five- and six-factor models neared <strong>the</strong> ratio range <strong>of</strong> acceptable fit(Marsh & Hocevar, 1985), while <strong>the</strong> four-factor model differed substantially. The CFIvalues suggest that all three models attain <strong>the</strong> value <strong>of</strong> N.90 typically used for acceptingmodels (Garson, 2006). Never<strong>the</strong>less, <strong>the</strong> values for <strong>the</strong> five- and six-factor models fit Huand Bentler’s (1999) criterion for model fit (TLIN.95) while <strong>the</strong> four-factor model did not.The values <strong>of</strong> <strong>the</strong> five- and six-factor models for RMSEA also fit Browne and Cudek’sTable 2Fit indices for <strong>the</strong> modelsModel v 2 df v 2 /df CFI TLI RMSEA Dv 2 p1. Four-factor 3520.508*** 428 8.23 .941 .936 .0872. Five-factor 2576.336*** 485 5.31 .967 .964 .067 944.17*** b.0013. Six-factor 2780.047*** 545 5.10 .966 .963 .065 203.71*** b.001CFI=Comparative Fit Index, TLI=Tucker–Lewis Index, RMSEA=Root-Mean-Square Error <strong>of</strong> Approximation.***p b.001.
438J.J. Appleton et al. / Journal <strong>of</strong> School Psychology 44 (2006) 427–445(1992) criteria for adequate fit (between .05 and .08) while <strong>the</strong> four-factor model did not.In general, results suggested that <strong>the</strong> five- and six-factor models fit <strong>the</strong> data better than <strong>the</strong>four-factor model.In order to determine <strong>the</strong> best fit between <strong>the</strong> five- and six-factor models, <strong>the</strong> changestatistics were consulted. The Chi-square difference test was significant (Dv 2 =.203.71,df =60,p b.001) suggesting <strong>the</strong> importance <strong>of</strong> <strong>the</strong> sixth factor. Coefficient alphas also werecomputed for each <strong>of</strong> <strong>the</strong> factors in <strong>the</strong> six-factor model, to determine how well <strong>the</strong> itemson <strong>the</strong> sixth-factor (in particular) hung toge<strong>the</strong>r. The reliability <strong>of</strong> items comprising eachfactor (and <strong>the</strong>ir corresponding label) was as follows: Factor 1 (Teacher–<strong>Student</strong>Relationships, r a =.88), Factor 2 (Control and Relevance <strong>of</strong> School Work, r a =.80),Factor 3 (Peer Support for Learning, r a =.82), Factor 4 (Future Aspirations and Goals,r a =.78), Factor 5 (Family Support for Learning, r a =.76), and Factor 6 (ExtrinsicMotivation, r a =.72).In summary, items pertaining to <strong>the</strong> sixth-factor (i.e., extrinsic motivation) did not havesignificant cross-loadings on <strong>the</strong> o<strong>the</strong>r SEI factors. Fur<strong>the</strong>r, both <strong>the</strong> v 2 /df ratio and <strong>the</strong>Dv 2 also supported evidence for a sixth factor. Finally, <strong>the</strong> internal consistency <strong>of</strong> <strong>the</strong> sixthfactor yielded a respectable value <strong>of</strong> .72, despite containing only two items. For <strong>the</strong>sereasons, <strong>the</strong> six-factor model was considered <strong>the</strong> best <strong>of</strong> all models examined.Based on <strong>the</strong> entire sample, bivariate correlations were conducted between summedscores <strong>of</strong> <strong>the</strong> items comprising each SEI factor and <strong>the</strong> outcome variables <strong>of</strong> grade pointaverage (GPA) and whe<strong>the</strong>r or not students had been suspended (1=yes, 0=no).Between 1,741 and 1,734 participants had NALT reading and math achievement scores,which were correlated with normal curve equivalent 3 (NCE) scores. These results arereported in Table 3, but care should be taken in interpreting relationships with factors fourand five as <strong>the</strong> distributions <strong>of</strong> <strong>the</strong> summed scores <strong>of</strong> items on <strong>the</strong>se factors werenegatively skewed.Results supported both <strong>the</strong> convergent and discriminant validity <strong>of</strong> <strong>the</strong> six-factorstructure. The factors <strong>of</strong> <strong>Student</strong>–Teacher Relationships, Peer Support for Learning, FutureAspirations and Goals, Family Support for Learning, and Extrinsic Motivation (i.e., factors1, 3–6) each correlated with some academic variables in <strong>the</strong> expected positive direction(i.e., GPA, reading and math achievement) and o<strong>the</strong>r variables in <strong>the</strong> expected negativedirection (i.e., suspensions). Fur<strong>the</strong>r, <strong>the</strong> engagement factors related to each o<strong>the</strong>r asexpected, although <strong>the</strong> extrinsic motivation factor yielded a slightly lower relationshipwith <strong>the</strong> o<strong>the</strong>r SEI factors. The relationship between <strong>the</strong> control/relevance factor (factor 2),GPA and suspension was positive but small, and this factor was negatively related toachievement test scores.DiscussionMeasurement <strong>of</strong> student cognitive and psychological engagement is central toimproving <strong>the</strong> learning outcomes <strong>of</strong> students, especially for those at high risk <strong>of</strong>3 Normal curve equivalent scores are useful in this case because <strong>the</strong>y represent achievement in equal-intervalunits.
J.J. Appleton et al. / Journal <strong>of</strong> School Psychology 44 (2006) 427–445 439Table 3Correlations between factors and outcomesTSR(PE)C/R(CE)Peer(PE)Asp(CE)Family(PE)Ext Motiv(CE)GPASuspY/NNALTR-nceTeacher–<strong>Student</strong> –Relationships (PE)Control/Relevance (CE) .471 –Peer Support (PE) .443 .322 –Aspirations (CE) .353 .506 .284 –Family Support (PE) .389 .462 .344 .469 –Extrinsic Motivation (CE) .158 .182 .073 .285 .199 –GPA .239 .001 .086 .253 .058 .192 –Suspension (Y/N) .201 .032 .062 .131 .009 .075 .492 –NALT Reading Normal .171 .287 .075 .135 .032 .161 .576 .321 –Curve Equivalent(R-nce) ScoreNALT Math NormalCurve Equivalent(R-nce) Score.162 .249 .079 .141 .009 .136 .598 .306 .823 –NALTM-nceeducational failure. Accurate measurement informs interventions that can be targeted toimprove student levels <strong>of</strong> <strong>the</strong>se subtypes, and in doing so improve deep processing <strong>of</strong>schoolwork, commitment to education, persistence in <strong>the</strong> face <strong>of</strong> challenge, and fulfillment<strong>of</strong> <strong>the</strong> fundamental needs <strong>of</strong> autonomy, belonging, and competence (Baumeister & Leary,1995; Osterman, 2000; Ryan, 1995; Ryan & Deci, 2000). Effort devoted to <strong>the</strong>se outcomeswill help to ensure that students leave secondary schools as competent and committedlearners ra<strong>the</strong>r than disenchanted casualties.This study examined <strong>the</strong> psychometric properties <strong>of</strong> <strong>the</strong> <strong>Student</strong> <strong>Engagement</strong><strong>Instrument</strong> (SEI), which was designed to measure <strong>the</strong> less overt subtypes <strong>of</strong> studentengagement: cognitive and psychological engagement. Factors conceptualized asunderlying cognitive and psychological engagement (e.g., family support for learning,teacher–student relationships) were supported by exploratory methods using one half <strong>of</strong><strong>the</strong> sample, and confirmed using <strong>the</strong> second half <strong>of</strong> <strong>the</strong> sample. We now turn to anexplanation <strong>of</strong> <strong>the</strong>se findings, including <strong>the</strong> limitations <strong>of</strong> this study, suggestions for futureresearch on engagement, and potential implications <strong>of</strong> <strong>the</strong>se findings for practicing schoolpsychologists.Although both <strong>the</strong> five- and six-factor models revealed an adequate fit (as determinedby <strong>the</strong> fit indices), <strong>the</strong> v 2 /df ratio, Dv 2 value, and internal consistency estimates providedsupport for a six-factor model <strong>of</strong> engagement (Teacher–<strong>Student</strong> Relationships, Control andRelevance <strong>of</strong> Schoolwork, Peer Support for Learning, Future Aspirations and Goals,Family Support for Learning, and Extrinsic Motivation). As noted previously, <strong>the</strong> study <strong>of</strong>engagement is relatively new and alternative perspectives regarding <strong>the</strong> number and type<strong>of</strong> domains that comprise <strong>the</strong> engagement construct are expected (see Fredericks et al.,2004; Jimerson et al., 2003). Our model extends <strong>the</strong> engagement literature by providingempirical support for a self-report scale, based on previous <strong>the</strong>ory (e.g., Finn, 1989;Connell & Wellborn, 1991) as well as our own ongoing work with youth (e.g., Sinclair etal., 2005) that assesses multiple components <strong>of</strong> cognitive and psychological engagement.
440J.J. Appleton et al. / Journal <strong>of</strong> School Psychology 44 (2006) 427–445Statistical support for <strong>the</strong> validity <strong>of</strong> <strong>the</strong> SEI was found in numerous ways. Forexample, analyses <strong>of</strong> items comprising each SEI factor revealed little cross-loading,suggesting that each factor assesses unique variance attributed to a cognitive orpsychological engagement subtype. Fur<strong>the</strong>r, SEI inter-correlations were positive andmoderate at best, suggesting that each factor measured an adequate degree <strong>of</strong> cognitive orpsychological engagement that was not measured by ano<strong>the</strong>r factor. Finally, <strong>the</strong>relationship between <strong>the</strong> SEI factors and various school indicators were in <strong>the</strong> expecteddirection, although <strong>the</strong> degree <strong>of</strong> variance shared between extrinsic motivation and <strong>the</strong>o<strong>the</strong>r SEI factors was somewhat lower, particularly with respect to peer support.Never<strong>the</strong>less, such findings are also consistent with previous research suggesting <strong>the</strong>importance <strong>of</strong> intrinsic (but not extrinsic) motivation on positive peer relationships (seePittman, Boggiano, & Main, 1992). Positive relationships were noted between most SEIfactors and academic indicators such as GPA and reading and math scores, while negativerelationships were noted between most <strong>of</strong> <strong>the</strong> SEI factors and school suspension.There were some exceptions to this larger pattern <strong>of</strong> findings, however. For example, <strong>the</strong>SEI control/relevance factor was negatively correlated with reading and math scores, andyielded very low correlations with GPA and school suspension. There are some potentialexplanations for <strong>the</strong>se particular findings. For example, students may be astute at detectingwork that is not relevant to larger goals, such as doing well in schoolwork. Thus, <strong>the</strong> minimalcorrelation between control/relevance and GPA would be expected. Fur<strong>the</strong>r, in comparisonto classroom tests, where positive results may be associated with expected and anticipatedmaterial, standardized tests such as <strong>the</strong> NALT are not based on specific classroom curricula.Thus, <strong>the</strong> negative correlations between standardized reading and math scores and this SEIfactor may indicate that students cannot anticipate items on such tests (which would indicateloss <strong>of</strong> control), or perceive that <strong>the</strong> items do not accurately reflect <strong>the</strong>ir actual schoollearning. Ei<strong>the</strong>r one <strong>of</strong> <strong>the</strong>se hypo<strong>the</strong>ses would correspond to <strong>the</strong> negative correlationsreported in this study. Finally, <strong>the</strong> positive but very low correlation between control/relevance and school suspension may be a methodological artifact; we coded <strong>the</strong> suspensionvariable to include any students who had ever received a suspension, regardless <strong>of</strong> <strong>the</strong>number <strong>of</strong> suspensions <strong>the</strong>y had. The extremely small correlation between <strong>the</strong>se twovariables could very well be an artifact <strong>of</strong> this method. Future studies should considercreating multiple categories <strong>of</strong> school suspension to determine <strong>the</strong> veracity <strong>of</strong> this finding.Future directions for researchTo properly frame this study, it is important to remember that instrument development isan iterative process. Our examination <strong>of</strong> a large and diverse dataset has advanced <strong>the</strong> effort tocreate a psychometrically sound scale for measuring cognitive and psychologicalengagement, but also raised important issues for future research to consider. For example,our study provides promising support for a six-factor scale that assesses specific cognitiveand psychological subtypes related to student engagement. Never<strong>the</strong>less, any initial scaleconstruction and validation is contingent on <strong>the</strong> sample from which <strong>the</strong> data are derived. Inthis regard, our sample was quite diverse (e.g., over 90 languages are spoken in <strong>the</strong> district)and included a high percentage <strong>of</strong> students receiving free or reduced lunch. Additionally, oursample consisted solely <strong>of</strong> 9th grade students, and was conducted only in an urban setting.
J.J. Appleton et al. / Journal <strong>of</strong> School Psychology 44 (2006) 427–445 441Given <strong>the</strong>se unique characteristics, data obtained from younger and older youth across multipleenvironments (suburban and urban locales) are clearly necessary to provide fur<strong>the</strong>r empiricalsupport for <strong>the</strong> validity <strong>of</strong><strong>the</strong>SEI,aswellas<strong>the</strong>generalization <strong>of</strong> <strong>the</strong> current findings.Fur<strong>the</strong>r, although we labeled <strong>the</strong> sixth factor as bextrinsic motivationQ, it was onlycomprised <strong>of</strong> two items, with both items being reverse-keyed. Given that researchers havedebated <strong>the</strong> meaning <strong>of</strong> such items in scale development (Chang, 1995), <strong>the</strong> validity <strong>of</strong> thisfactor should be examined in future studies. This recommendation is particularly salientconsidering <strong>the</strong> low relationships with <strong>the</strong> academic variables (e.g., GPA, standardizedreading scores) found in this study with respect to some SEI factors. Although we speculatedon some reasons for <strong>the</strong>se findings, fur<strong>the</strong>r empirical studies are necessary to determine <strong>the</strong>iraccuracy. The SEI also was specifically designed to assess cognitive and psychologicalengagement. The relationship <strong>of</strong> <strong>the</strong>se engagement subtypes to academic and behavioralengagement is necessary to fur<strong>the</strong>r <strong>the</strong> nomo<strong>the</strong>tic understanding <strong>of</strong> engagement.Also, previous efforts to measure aspects <strong>of</strong> engagement have focused on specifictasks, classes, or subjects (e.g., Marks, 2000). This scale attempts to measure a moregeneralized sense <strong>of</strong> engagement with school. Researchers have speculated on <strong>the</strong>thresholds <strong>of</strong> engagement necessary for specific outcomes (e.g., Jimerson et al., 2003),yet whe<strong>the</strong>r specific or generalized engagement is more closely linked to importantoutcomes or whe<strong>the</strong>r <strong>the</strong>y interact is an issue for future research to resolve. Finally, <strong>the</strong>SEI was developed for use with middle and high school students in mind, butengagement is equally relevant for elementary students. Given findings regarding earlystudent disengagement (Barrington & Hendricks, 1989; Lehr, Sinclair, & Christenson,2004), research to create a developmentally appropriate measure for elementary studentsis important.Implications for school psychologistsTrained to understand learning and <strong>the</strong> educational context, school psychologists are in aunique position to consult and affect student outcomes using findings from <strong>the</strong> nexus <strong>of</strong>educational and psychological research. The construct <strong>of</strong> engagement is positioned in thatnexus (Skinner & Belmont, 1993). The multidimensional engagement construct represents aconceptual call away from a strict dependence on monitoring student time-on-task andattendance to <strong>the</strong> inclusion <strong>of</strong> important underlying variables such as sense <strong>of</strong> autonomy,belonging, competence and <strong>the</strong> extent to which <strong>the</strong> context provides <strong>the</strong> nutriments forfulfillment <strong>of</strong> <strong>the</strong>se needs (Ryan & Deci, 2000).Moreover, <strong>the</strong> factor structure proposed in this study provides six specific paths tointervention, based on student outcomes in <strong>the</strong> areas <strong>of</strong> teacher–student relationships,control and relevance <strong>of</strong> schoolwork, peer support for learning, future aspirations andgoals, family support for learning, and extrinsic motivation. This six-factor model mayenable practitioners to consult <strong>the</strong> relevant intervention research in <strong>the</strong>se areas and provide<strong>the</strong> remediation needed.In sum, <strong>the</strong> iterative process <strong>of</strong> scale development for an instrument to validly measureboth cognitive and psychological engagement is delineated in this study. Much has beenaccomplished, yet much remains to fully utilize <strong>the</strong> potential <strong>of</strong> <strong>the</strong> student engagementconstruct.
442J.J. Appleton et al. / Journal <strong>of</strong> School Psychology 44 (2006) 427–445AcknowledgementsThe authors wish to express <strong>the</strong>ir appreciation for <strong>the</strong> methodological and statisticalconsultation received from Drs. Michael Harwell and Michael Rodriguez, <strong>the</strong> school districtsupport for <strong>the</strong> research, and <strong>the</strong> assistance with scale administration received from NicoleBottsford-Miller, Christopher Buckley, Deanna Spanjers, Erika Taylor, and Patrick Varro.References* ,+Appleton, J. J., & Christenson, S. L. (2004). Scale description and references for <strong>the</strong> <strong>Student</strong> <strong>Engagement</strong><strong>Instrument</strong>. Unpublished manuscript.Barrington, B. L., & Hendricks, B. (1989). Differentiating characteristics <strong>of</strong> high school graduates, dropouts, andnongraduates. Journal <strong>of</strong> Educational Research, 89(6), 309–319.Baumeister, R. F., & Leary, M. R. (1995). The need to belong: Desire for interpersonal attachments as afundamental human motivation. Psychological Bulletin, 117, 497–529.Bronfenbrenner, U. (1992). Ecological systems <strong>the</strong>ory. In R. Vasta (Ed.), Annals <strong>of</strong> child development. Six<strong>the</strong>ories <strong>of</strong> child development: Revised formulations and current issues (pp. 187–249). London7 JessicaKingsley.Browne, M. W., & Cudeck, R. (1992). Alternative ways <strong>of</strong> assessing model fit. Sociological Methods andResearch, 21(2), 230–258.Cadwallander, T. W., Farmer, T. W., Cairns, B. D., Leung, M. C., Clemmer, J. T., Gut, D. M., et al. (2002). Thesocial relations <strong>of</strong> rural African American early adolescents and proximal impact <strong>of</strong> <strong>the</strong> school engagementproject. Journal <strong>of</strong> School Psychology, 40(3), 239–258.Chang, L. (1995). Connotatively consistent and reversed connotatively inconsistent items are not fully equivalent:Generalizability study. Educational and Psychological Measurement, 55, 991–997.Christenson, S. L., & Anderson, A. R. (2002). Commentary: The centrality <strong>of</strong> <strong>the</strong> learning context for students’academic enabler skills. School Psychology Review, 31(3), 378–393.Cliff, N. (1988). The eigenvalues-greater-than-one rule and <strong>the</strong> reliability <strong>of</strong> components. Psychological Bulletin,103(2), 276–279.Connell, J. P. (1990). Context, self, and action: A motivational analysis <strong>of</strong> self-system processes across <strong>the</strong> lifespan. In D. Cicchetti, & M. Beeghly (Eds.), The self in transition: Infancy to childhood. The John D. andCa<strong>the</strong>rine T. MacArthur foundation series on mental health and development (pp. 61–97). Chicago, IL7 TheUniversity <strong>of</strong> Chicago Press.Connell, J. P., Halpern-Felsher, B. L., Clifford, E., Crichlow, W., & Usinger, P. (1995). Hanging in <strong>the</strong>re:Behavioral, psychological, and contextual factors affecting whe<strong>the</strong>r African American adolescents stay inhigh school. Journal <strong>of</strong> Adolescent Research, 10(1), 41–63.+ Connell, J. P., & Wellborn, J. G. (1991). Competence, autonomy, and relatedness: A motivational analysis <strong>of</strong>self-system processes. In M. R. Gunnar, & L. A. Sroufe (Eds.), Self Processes and Development, vol. 23.Hillsdale, NJ7 Lawrence Erlbaum Assoc.Doll, B., Hess, R., & Ochoa, S. H. (2001). Contemporary psychological perspectives on school completion[Special issue]. School Psychology Quarterly, 16(4).Finn, J. D. (1989). Withdrawing from school. Review <strong>of</strong> Educational Research, 59, 117–142.Finn, J. D., & Cox, D. (1992). Participation and withdrawal among fourth-grade pupils. American EducationalResearch Journal, 29(1), 141–162.Floyd, C. (1997). Achieving despite <strong>the</strong> odds: A study <strong>of</strong> resilience among a group <strong>of</strong> African American highschool seniors. Journal <strong>of</strong> Negro Education, 65(2), 181–189.* Reference marked with an b*Q indicate studies utilized for scale construction.+ References marked with a b+Q indicate studies used both for scale construction and in this paper.
J.J. Appleton et al. / Journal <strong>of</strong> School Psychology 44 (2006) 427–445 443Floyd, F. L., & Widaman, K. F. (1995). Factor analysis in <strong>the</strong> development and refinement <strong>of</strong> clinical assessmentinstruments. Psychological Assessment, 7(3), 286–299.+ Fredericks, J. A., Blumenfeld, P. C., & Paris, A. H. (2004). School engagement: Potential <strong>of</strong> <strong>the</strong> concept, state <strong>of</strong><strong>the</strong> evidence. Review <strong>of</strong> Educational Research, 74, 59–109.Furrer, C., & Skinner, E. (2003). Sense <strong>of</strong> relatedness as a factor in children’s academic engagement andperformance. Journal <strong>of</strong> Educational Psychology, 95(1), 148–162.Furrer, C. J., Skinner, E., Marchand, G., & Kindermann, T. A. (2006, March). <strong>Engagement</strong> vs. disaffection ascentral constructs in <strong>the</strong> dynamics <strong>of</strong> motivational development. Paper presented at <strong>the</strong> Annual Meeting <strong>of</strong> <strong>the</strong>Society for Research on Adolescence, San Francisco, CA.Garson, G. D. (2006). Quantitative research in public administration: Structural equation modeling. Retrieved onJanuary 21, 2006 from: http://www2.chass.ncsu.edu/garson/pa765/structur.htm+ Goodenow, C. (1993a). The psychological sense <strong>of</strong> school membership among adolescents: Scale developmentand educational correlates. Psychology in <strong>the</strong> Schools, 30, 79–90.Goodenow, C. (1993b). Classroom belonging among early adolescent students: Relationship to motivation andachievement. Journal <strong>of</strong> Early Adolescence, 13(1), 21–43.Goodenow, C., & Grady, K. E. (1993). The relationship <strong>of</strong> school belonging and friends’ values to academicmotivation among urban adolescent students. Journal <strong>of</strong> Experimental Education, 62(1), 60–71.Greene, B. A., & Miller, R. B. (1996). Influences on course performance: Goals, perceived ability, and selfregulation.Contemporary Educational Psychology, 21, 181–192.Greene, B. A., Miller, R. B., Crowson, H. M., Duke, B. L., & Akey, K. L. (2004). Predicting high schoolstudents’ cognitive engagement and achievement: Contributions <strong>of</strong> classroom perceptions and motivation.Contemporary Educational Psychology, 29, 462–482.Grolnick, W. S., & Ryan, R. M. (1987). Autonomy in children’s learning: An experimental and individualdifference investigation. Journal <strong>of</strong> Personality and Social Psychology, 52(3), 890–898.Guthrie, J. T., & Wigfield, A. (2000). <strong>Engagement</strong> and motivation in reading. In M. L. Kamil, P. B. Mosenthal,P. D. Pearson, & R. Barr (Eds.), Handbook <strong>of</strong> reading research, (3rd. ed., pp. 403–422). New York7 Longman.Hu, L., & Bentler, P. M. (1999). Cut<strong>of</strong>f criteria for fit indexes in covariance structure analysis: Conventionalcriteria versus new alternatives. Structural Equation Modeling, 6(1), 1 – 55.+Jimerson, S. R., Campos, E., & Greif, J. L. (2003). Toward and understanding <strong>of</strong> definitions and measures <strong>of</strong>school engagement and related terms. California School Psychologist, 8, 7–27.Klem, A. M., & Connell, J. P. (2004). Relationships matter: Linking teacher support to student engagement andachievement. Journal <strong>of</strong> School Health, 74(7), 262–273.Lehr, C. A., Sinclair, M. F., & Christenson, S. L. (2004). Addressing student engagement and truancy preventionduring <strong>the</strong> elementary years: A replication study <strong>of</strong> <strong>the</strong> Check and Connect model. Journal <strong>of</strong> Education for<strong>Student</strong>s Placed at Risk, 9(3), 279–301.Maehr, M. L., & Meyer, H. A. (1997). Understanding motivation and schooling: Where we’ve been, where weare, and where we need to go. Educational Psychology Review, 9(4), 371–408.Marks, H. M. (2000). <strong>Student</strong> engagement in instructional activity: Patterns in <strong>the</strong> elementary, middle, and highschool years. American Educational Research Journal, 37(1), 153–184.Marsh, H. W., Balla, J. R., & McDonald, R. P. (1994). Goodness-<strong>of</strong>-fit indexes in confirmatory factor analysis:The effect <strong>of</strong> sample size. Psychological Bulletin, 103(3), 391–410.Marsh, H. W., & Hocevar, D. (1985). Application <strong>of</strong> confirmatory factor analysis to <strong>the</strong> study <strong>of</strong> self-concept:First- and higher order factor models and <strong>the</strong>ir invariance across groups. Psychological Bulletin, 97(3),562–582.+ McPartland, J. M. (1994). Dropout prevention in <strong>the</strong>ory and practice. In R. J. Rossi (Ed.), Schools and studentsat risk: context and framework for positive change (pp. 255–276). New York7 Teachers College.Miller, R. B., Greene, B. A., Montalvo, G. P., Ravindran, B., & Nichols, J. D. (1996). <strong>Engagement</strong> in academicwork: The role <strong>of</strong> learning goals, future consequences, pleasing o<strong>the</strong>rs, and perceived ability. ContemporaryEducational Psychology, 21, 388–422.National Research Council and <strong>the</strong> Institute <strong>of</strong> Medicine. (2004). Engaging schools: Fostering high schoolstudents’ motivation to learn. Washington, DC7 The National Academies Press.Netemeyer, R., Bearden, W., & Sharma, S. (2003). Scaling procedures: Issues and applications. Thousand Oaks,CA7 Sage.
444J.J. Appleton et al. / Journal <strong>of</strong> School Psychology 44 (2006) 427–445+ Newmann, F. M., Wehlage, G. G., & Lamborn, S. D. (1992). The significance and sources <strong>of</strong> studentengagement. In F. M. Newmann (Ed.), <strong>Student</strong> engagement and achievement in American secondary schools(pp. 11–39). New York7 Teachers College Press.Olsson, U. (1979). Maximum likelihood estimation <strong>of</strong> <strong>the</strong> polychoric correlation coefficient. Psychometrika,44(4), 443–460.Osterman, K. (2000). <strong>Student</strong>s’ need for belongingness in <strong>the</strong> school community. Review <strong>of</strong> EducationalResearch, 70(3), 323–367.Pittman, T. S., Boggiano, A. K., & Main, D. S. (1992). Intrinsic and extrinsic motivational orientations in peerinteractions. In A. K. Boggiano, & T. S. Pittman (Eds.), Achievement and motivation: A social–developmentalperspective (pp. 37–53). New York7 Cambridge University Press.Pokay, P., & Blumenfeld, P. C. (1990). Predicting achievement early and late in <strong>the</strong> semester: The role <strong>of</strong>motivation and use <strong>of</strong> learning strategies. Journal <strong>of</strong> Educational Psychology, 82, 41–50.Reeve, J., Jang, H., Carrell, D., Jeon, S., & Barch, J. (2004). Enhancing students’ engagement by increasingteachers’ autonomy support. Motivation and Emotion, 28(2), 147–169.Reschly, A., & Christenson, S. L. (2006). School completion. In G. Bear, & K. Minke (Eds.), Children’s Needs-III: Development, Prevention, and Intervention. Washington DC7 National Association <strong>of</strong> SchoolPsychologists.Reschly, A., & Christenson, S. L. (in press). Research leading to a predictive model <strong>of</strong> dropout and completionamong students with mild disabilities and <strong>the</strong> role <strong>of</strong> student engagement. Remedial and Special Education.Russell, V. J., Ainley, M., & Frydenberg, E. (2005). Schooling issues digest: <strong>Student</strong> motivation and engagement.Retrieved on November 9, 2005 from: http://www.dest.gov.au/sectors/school_education/publications_resources/schooling_issues_digest/schooling_issues_digest_motivation_engagement.htmRyan, R. M. (1995). Psychological needs and <strong>the</strong> facilitation <strong>of</strong> integrative processes. Journal <strong>of</strong> Personality, 63,397–427.Ryan, R. M., & Deci, E. L. (2000). Self-determination <strong>the</strong>ory and <strong>the</strong> facilitation <strong>of</strong> intrinsic motivation, socialdevelopment, and well-being. American Psychologist, 55(1), 68–78.Ryan, R. M., Stiller, J., & Lynch, J. H. (1994). Representations <strong>of</strong> relationships to teachers, parents, and friends aspredictors <strong>of</strong> academic motivation and self-esteem. Journal <strong>of</strong> Early Adolescence, 14, 226–249.Schunk, D. H. (1991). Self-efficacy and academic motivation. Educational Psychologist, 26, 207–231.Seaman, M. A. (2001). Categorical data. Retrieved on March 30, 2006 from: http://edpsych.ed.sc.edu/seaman/edrm711/questions/categorical.htmSinclair, M. F., Christenson, S. L., & Thurlow, M. L. (2005). Promoting school completion <strong>of</strong> urban secondaryyouth with emotional or behavior disabilities. Exceptional Children, 71(4), 465–482.Skinner, E. A., & Belmont, M. J. (1993). Motivation in <strong>the</strong> classroom: Reciprocal effects <strong>of</strong> teacher behavior andstudent engagement across <strong>the</strong> school year. Journal <strong>of</strong> Educational Psychology, 85, 571–581.Skinner, E. A., Wellborn, J. G., & Connell, J. P. (1990). What it takes to do well in school and whe<strong>the</strong>r I’ve got it:A process model <strong>of</strong> perceived control and children’s engagement and achievement in school. Journal <strong>of</strong>Educational Psychology, 82(1), 22–32.Waller, N. G. (2001). MicroFACT 2.0: A microcomputer factor analysis program for ordered polytomous data andmainframe size problems [Computer s<strong>of</strong>tware and manual]. St. Paul, MN7 Assessment Systems Corporation.*Worrell, F. C., & Hale, R. L. (2001). The relationship <strong>of</strong> hope in <strong>the</strong> future and perceived school climate toschool completion. School Psychology Quarterly, 16(4), 370–388.Zwick, W. R., & Velicer, W. F. (1986). Comparison <strong>of</strong> five rules for determining <strong>the</strong> number <strong>of</strong> components toretain. Psychological Bulletin, 99(3), 432–442.Fur<strong>the</strong>r readingAnderman, E. M., & Anderman, L. H. (1999). Social predictors <strong>of</strong> changes in students’ achievement goalorientations. Contemporary Educational Psychology, 25, 21–37.Audas, R., & Willms, J. D. (2001). <strong>Engagement</strong> and dropping out <strong>of</strong> school: A life course perspective. HumanResources Development Canada. Retrieved on November 5, 2004 from: http://www.hrdc.gc.ca/sp-ps/arb-gra/publications/research/2001docs/W-01-1-10/e/W-01-1-10_E_0.shtml
J.J. Appleton et al. / Journal <strong>of</strong> School Psychology 44 (2006) 427–445 445Baker, J. A., Derrer, R. D., Davis, S. M., Dinklage-Travis, H. E., Linder, D. S., & Nicholson, M. D. (2001). Theflip side <strong>of</strong> <strong>the</strong> coin: Understanding <strong>the</strong> school’s contribution to dropout and completion. School PsychologyQuarterly, 16(4), 406–426.Brendtro, L. K., Brokenleg, M., & Van Bockern, S. (1990). Reclaiming youth at risk: Our hope for <strong>the</strong> future.Bloomington, IN7 National Educational Service.Epstein, J. L., & McPartland, J. M. (1976). The concept and measurement <strong>of</strong> <strong>the</strong> quality <strong>of</strong> school life. AmericanEducational Research Journal, 13, 15–30.Finn, J. D. (1993). School engagement and students at risk. Washington, DC7 National Center for EducationStatistics.Finn, J. D. (1998). Parental engagement that makes a difference. Educational Leadership, 55(8), 20–24.Gold, M., & Mann, D. W. (1984). Expelled to a friendlier place: A study <strong>of</strong> effective alternative schools. AnnArbor7 University <strong>of</strong> Michigan Press.Hess, R. S., & Copeland, E. P. (2001). <strong>Student</strong>s’ stress, coping strategies, and school completion: A longitudinalperspective. School Psychology Quarterly, 16(4), 389–405.Huebner, E. S., & McCullough, G. (2000). Correlates <strong>of</strong> school satisfaction among adolescents. Journal <strong>of</strong>Educational Research, 93(5), 331–335.Keedy, J. L., & Drmacich, D. (1991, November). Giving voice and empowerment to student engagement: Aschool-based interactive curriculum. Paper presented at <strong>the</strong> National Conference on School Restructuring,Atlanta, GA. (ERIC Document Reproduction Service No. ED 356516).Linnenbrink, E. A., & Pintrich, P. R. (2002). Motivation as an enabler for academic success. School PsychologyReview, 31(3), 313–327.Mosher, R., & McGowan, B. (1985). Assessing student engagement in secondary schools: Alternativeconceptions, strategies <strong>of</strong> assessing, and instruments. Massachusetts: U.S. (ERIC Document ReproductionService No. ED272812).Natriello, G. (1984). Problems in <strong>the</strong> evaluation <strong>of</strong> students and student disengagement from secondary schools.Journal <strong>of</strong> Research and Development in Education, 17(4), 14–24.Nor<strong>the</strong>ast and Islands Regional Educational Laboratory at Brown University (2001). <strong>Student</strong>-centered highschools: Helping schools adapt to <strong>the</strong> learning needs <strong>of</strong> adolescents. Perspectives on Policy and Practice(OERI) (pp. 1 –12).Osterman, K. F. (1998, April). <strong>Student</strong> community within <strong>the</strong> school context: A research syn<strong>the</strong>sis. Paperpresented at <strong>the</strong> Annual Meeting <strong>of</strong> <strong>the</strong> American Educational Research Association, San Diego, CA. (ERICDocument Reproduction Service No. ED 425519).Rutter, M. (1983). School effects on pupil progress: Research findings and policy implications. ChildDevelopment, 54, 1 –29.Sirin, S., & Jackson, L. R. (2001). Examining school engagement <strong>of</strong> African American adolescents. U.S.Department <strong>of</strong> Education. ED 454 318.Snyder, T. T. (2000). <strong>Student</strong>s experience being in school: <strong>Student</strong> responses to factors associated with motivationto achieve. Unpublished Dissertation.Sprinthall, M. A., & Collins, W. A. (1984). Adolescent psychology: A developmental view. Reading, MA7Addison-Wesley.Voelkl, K. E. (1996). Measuring students identification with school. Educational and PsychologicalMeasurement, 56, 760–770.Wentzel, K. R., & Watkins, D. E. (2002). Peer relationships and collaborative learning as contexts for academicenablers. School Psychology Review, 31(3), 366–377.Willems, E. P. (1967). Sense <strong>of</strong> obligation to high school activities as related to school size and marginality <strong>of</strong>students. Child Development, 38, 1247–1260.Willms, J. D. (2003). <strong>Student</strong> <strong>Engagement</strong> at School: A sense <strong>of</strong> belonging and participation. OECD: Programmefor International <strong>Student</strong> Assessment. Retrieved August 11, 2005 from: http://www.pisa.oecd.org/document/4/0,2340,en_32252351_32236159_33668932_1_1_1_1,00.html