World production and consumption of ceramic tiles - Infotile
World production and consumption of ceramic tiles - Infotile
World production and consumption of ceramic tiles - Infotile

You also want an ePaper? Increase the reach of your titles
YUMPU automatically turns print PDFs into web optimized ePapers that Google loves.
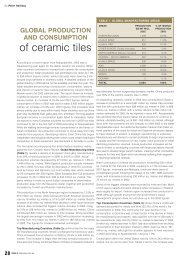
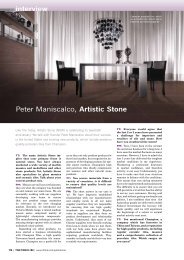
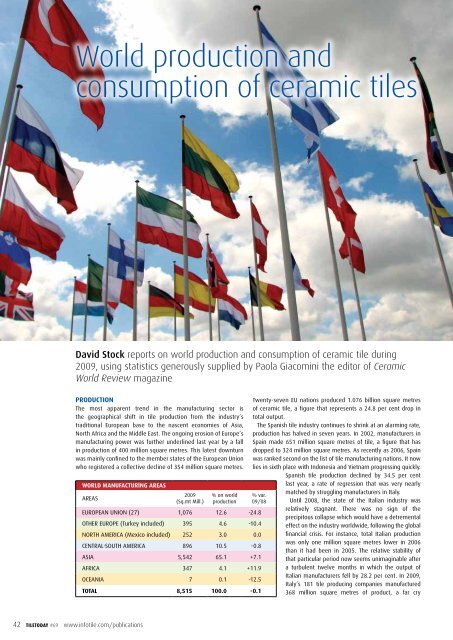
<strong>World</strong> <strong>production</strong> <strong>and</strong><strong>consumption</strong> <strong>of</strong> <strong>ceramic</strong> <strong>tiles</strong>David Stock reports on world <strong>production</strong> <strong>and</strong> <strong>consumption</strong> <strong>of</strong> <strong>ceramic</strong> tile during2009, using statistics generously supplied by Paola Giacomini the editor <strong>of</strong> Ceramic<strong>World</strong> Review magazinePRODUCTIONThe most apparent trend in the manufacturing sector isthe geographical shift in tile <strong>production</strong> from the industry’straditional European base to the nascent economies <strong>of</strong> Asia,North Africa <strong>and</strong> the Middle East. The ongoing erosion <strong>of</strong> Europe’smanufacturing power was further underlined last year by a fallin <strong>production</strong> <strong>of</strong> 400 million square metres. This latest downturnwas mainly confined to the member states <strong>of</strong> the European Unionwho registered a collective decline <strong>of</strong> 354 million square metres.WORLD MANUFACTURlNG AREASAREAS2009(Sq.mt Mill.)% on world<strong>production</strong>Twenty-seven EU nations produced 1.076 billion square metres<strong>of</strong> <strong>ceramic</strong> tile, a figure that represents a 24.8 per cent drop intotal output.The Spanish tile industry continues to shrink at an alarming rate,<strong>production</strong> has halved in seven years. In 2002, manufacturers inSpain made 651 million square metres <strong>of</strong> tile, a figure that hasdropped to 324 million square metres. As recently as 2006, Spainwas ranked second on the list <strong>of</strong> tile manufacturing nations. It nowlies in sixth place with Indonesia <strong>and</strong> Vietnam progressing quickly.Spanish tile <strong>production</strong> declined by 34.5 per centlast year, a rate <strong>of</strong> regression that was very nearly% var.09/08EUROPEAN UNION (27) 1,076 12.6 -24.8OTHER EUROPE (Turkey included) 395 4.6 -10.4NORTH AMERICA (Mexico included) 252 3.0 0.0CENTRAL·SOUTH AMERICA 896 10.5 -0.8ASIA 5,542 65.1 +7.1AFRICA 347 4.1 +11.9OCEANIA 7 0.1 -12.5TOTAL 8,515 100.0 -0.1matched by struggling manufacturers in Italy.Until 2008, the state <strong>of</strong> the Italian industry wasrelatively stagnant. There was no sign <strong>of</strong> theprecipitous collapse which would have a detrementaleffect on the industry worldwide, following the globalfinancial crisis. For instance, total Italian <strong>production</strong>was only one million square metres lower in 2006than it had been in 2005. The relative stability <strong>of</strong>that particular period now seems unimaginable aftera turbulent twelve months in which the output <strong>of</strong>Italian manufacturers fell by 28.2 per cent. In 2009,Italy’s 181 tile producing companies manufactured368 million square metres <strong>of</strong> product, a far cry42 TILEToDAY #69 www.infotile.com/publications
from the 570 million square metres <strong>of</strong> five years ago. Spain <strong>and</strong>Italy currently manufacture a mere eight per cent <strong>of</strong> the world’s<strong>ceramic</strong> tile.The third significant slump in the European Union took placein Germany where tile <strong>production</strong> decreased by 13.6 per cent.Elsewhere, Pol<strong>and</strong> <strong>and</strong> Portugal experienced identical downturns<strong>of</strong> 5.1 per cent. Outside the EU, Europe’s manufacturing woeswere limited <strong>and</strong> less severe. In those countries, tile <strong>production</strong>declined by 10.4 per cent, from 441 to 395 million squaremetres. This was almost entirely attributable to the diminishedcapabilities <strong>of</strong> Russian <strong>and</strong> Turkish manufacturers.Russia’s lapse in productivity was the more serious <strong>of</strong> the two,coming after several years <strong>of</strong> steady <strong>and</strong> impressive growth. Theworld’s largest nation made 117 million square metres <strong>of</strong> tile, anannual total that denotes a drop in <strong>production</strong> <strong>of</strong> 20.4 per cent.In contrast, Turkey’s manufacturing output <strong>of</strong> 205 million squareTOP MANUFACTURING COUNTRIES2005COUNTRY(Sq.m Mill.)2006(Sq.m Mill.)2007(Sq.m Mill.)2008(Sq.m Mill.)2009(Sq.m Mill.)% on 2009world<strong>production</strong>% var.09/081. CHINA 2,500 3,000 3,200 3,400 3,600 42.3 5.92. BRAZIL 568 594 637 713 715 8.4 0.23. INDIA 298 340 385 390 490 5.8 25.64. ITALY 570 569 559 513 368 4.3 -28.25. IRAN 190 210 250 320 350 4.1 9.46. SPAIN 609 608 585 495 324 3.8 -34.57. VIETNAM 176 199 254 270 295 3.5 9.38. INDONESIA 175 170 235 275 278 3.3 1.29. TURKEY 261 265 260 225 205 2.4 -8.910. EGYPT 112 122 140 160 200 2.3 25.011. MEXICO 196 210 215 205 200 2.3 -2.412. THAILAND 138 139 130 130 128 1.5 -1.513. RUSSIA 100 115 135 147 117 1.4 -20.414. POLAND 108 110 112 118 112 1.3 -5.115. MALAYSIA 71 75 75 85 90 1.1 5.916. UAE 68 75 76 77 77 0.9 0.017. PORTUGAL 72 74 74 74 70 0.8 -5.118. ARGENTINA 48 54 60 60 56 0.7 -6.719. SAUDI ARABIA 20 22 34 40 55 0.6 37.520. MOROCCO 44 47 50 51 54 0.6 4.921. GERMANY 62 64 67 59 51 0.6 -13.622. COLOMBIA 40 44 48 50 50 0.6 0.023. USA 61 58 51 45 50 0.6 10.424. UKRAINE 20 21 27 39 44 0.5 12.825. SOUTH KOREA 46 44 42 39 42 0.5 9.626. SOUTH AFRICA 33 37 38 38 32 0.4 -15.827. TAIWAN 53 53 50 40 32 0.4 -20.028. SYRIA 19 19 19 28 31 0.4 10.729. ALGERIA 28 28 28 28 30 0.4 7.130. VENEZUELA 26 28 30 32 30 0.4 -6.3TOTAL 6,713 7,395 7,866 8,145 8,176 96.0 0.4WORLD TOTAL 7,077 7,760 8,252 8,495 8,515 100.0 -0.1In 2009, the 30 major manufacturing countries covered 96.0% <strong>of</strong> world <strong>production</strong>WORLD CONSUMPTION AREASAREAS2009(Sq.mt Mill.)% on world<strong>consumption</strong>% var.09/08EUROPEAN UNION (27) 991 11.7 -18.8OTHER EUROPE (Turkey included) 418 4.9 -11.1NORTH AMERICA (Mexico included) 360 4.3 -10.9CENTRAL·SOUTH AMERICA 909 10.7 +1.0ASIA 5,273 62.3 +8.2AFRICA 472 5.6 +10.0OCEANIA 37 0.4 -14.0TOTAL 8,460 100.0 +1.3WORLD EXPORTING AREASAREAS2009(Sq.mt Mill.)% on world<strong>consumption</strong>% var.09/08EUROPEAN UNION (27) 660 7.8 -19.3OTHER EUROPE (Turkey included) 96 1.1 -25.0NORTH AMERICA (Mexico included) 56 0.7 -16.4CENTRAL·SOUTH AMERICA 92 1.1 -20.7ASIA 797 9.4 +5.8AFRICA 33 0.4 -8.3OCEANIA 1 0.0 –TOTAL 1,735 20.5 -9.644 TILEToDAY #69 www.infotile.com/publications
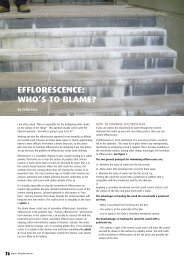
metres represented something <strong>of</strong> an improvement, howevertenuous, on the performance <strong>of</strong> the previous year. This is due tothe decline in 2009 (8.9 per cent) being not nearly as severe asthe 13.5 per cent fall endured in 2008. A cause for celebrationin non-EU Europe is the ongoing expansion <strong>of</strong> Ukraine’s tileindustry. Ceramic tile <strong>production</strong> in the former Soviet state hasmore than doubled since 2006 with 44 million square metres <strong>of</strong>tile manufactured during the course <strong>of</strong> last year. This progress hasmade Ukraine Europe’s eighth largest tile producer.In 2009, Asia (including the Middle East) furthered its influencein the <strong>production</strong> sector, accounting for 65.1 per cent <strong>of</strong> all <strong>ceramic</strong>tile output. Asian manufacturers increased their productivity bymore than seven per cent, ultimately making 5.542 billion squaremetres <strong>of</strong> tile in the calendar year. China once again confirmed itsstatus as the world’s leading tile producer, with its vast industrialbase creating 3.6 billion square metres <strong>of</strong> product.It is astonishing to think that China alone is responsible for nearlytwo-thirds <strong>of</strong> Asia’s tile <strong>production</strong> <strong>and</strong> 42.3 per cent <strong>of</strong> the tileindustry’s global output. A discernable pattern is emerging inChina’s <strong>production</strong> habits as the quantity <strong>of</strong> <strong>tiles</strong> produced in thePeople’s Republic has increased by 200 million square metres ineach <strong>of</strong> the last three years. India’s manufacturing sector exp<strong>and</strong>edrapidly, conclusively making amends for the underwhelmingprogress <strong>of</strong> 2008. Tile <strong>production</strong> rose by a quarter, reaching anall-time high <strong>of</strong> 490 million square metres. As the world’s thirdlargest manufacturer <strong>and</strong> consumer <strong>of</strong> <strong>ceramic</strong> tile, India has atelling effect on the industry’s performance,despite the fact that few <strong>of</strong> its products areexported or used overseas.Manufacturing growth was also recordedin Iran <strong>and</strong> Vietnam, two <strong>of</strong> Asia’s mostreliable <strong>and</strong> promising tile producers. Iranhas doubled its tile <strong>production</strong> in the pastfive years, during which time Vietnamhas developed at an even quicker rate. In2009, the countries sustained similar rates<strong>of</strong> growth; 9.3 per cent in Vietnam <strong>and</strong> 9.4per cent in Iran. Although these statisticsare undeniably impressive, they pale incomparison to the recent expansion <strong>of</strong> theINTERNATIONAL TRADE 2009(on Total <strong>World</strong> Consumption)ImportExport20.5%manufacturing sector in Saudi Arabia. Tile <strong>production</strong> in the oilrichstate totalled 55 million square metres last year, following aremarkable 37.5 per cent upsurge in annual productivity.Elsewhere in the Middle East, <strong>production</strong> stalled in the UnitedArab Emirates at 77 million square metres, whilst an emergentSyrian industry grew for a second year in succession. There wereminor variations in Asia-Pacific nations such as Indonesia <strong>and</strong>Thail<strong>and</strong>, <strong>and</strong> a 5.9 per cent increase in Malaysian output. SouthKorea reported an upturn in <strong>production</strong> for the first time in years,but the same cannot be said <strong>of</strong> the Taiwanese industry which onceagain declined.Production in North America remained the same (252million square metres) despite a 10.4 per cent increase in U.S.manufacturing. The renewal <strong>of</strong> America’s <strong>production</strong> sector was tosome extent futile, as any improvements in the United States werequickly cancelled out in neighbouring Mexico. Mexican output fellby 2.4 per cent, or five million square metres, thus nullifying thegreater efforts <strong>and</strong> improved productivity <strong>of</strong> their counterparts inAmerica. In total, Mexico created 200 million square metres <strong>of</strong>tile, while U.S. manufacturers saw their output rise from 45 to 50million square metres.Tile manufacturing in Central <strong>and</strong> South America is principallybased in Argentina, Colombia, <strong>and</strong> most importantly <strong>of</strong> all, Brazil.The region produced 896 million square metres in 2009, fallingjust short <strong>of</strong> the regional record set the year before. This minorsetback occurred because <strong>of</strong> similar downturns in Argentine <strong>and</strong>Venezuelan <strong>production</strong>. In Colombia, manufacturers sustainedtheir level <strong>of</strong> output, making 50 million square metres <strong>of</strong> tile. Tile<strong>production</strong> in Brazil finally slowed after three years <strong>of</strong> unremittinggrowth. Nevertheless, the nation’s manufacturers succeededin improving on their 2008 performance, producing 715 millionsquare metres <strong>of</strong> tile, an amount bettered only by China.The greatest progress was made in Africa, specifically the north <strong>of</strong>the continent, where <strong>production</strong> increased most notably in Egypt <strong>and</strong>Morocco. Egypt has doubled its manufacturing output in the last fiveyears, reaching 200 million square metres in 2009. The tile industryhas almost certainly benefited from a series <strong>of</strong> economic reformsthat have encouraged the development <strong>of</strong> a more diversified <strong>and</strong>liberalised economy. Egyptians produce, consume <strong>and</strong> export more<strong>tiles</strong> than any other African people. Morocco <strong>and</strong> Algeria haveunfailing tile industries that advanced steadily in 2009. Another year<strong>of</strong> growth saw Moroccan tile <strong>production</strong> climb to 54 million squaremetres, whilst Algeria finally surpassed the 28 million square metresit had produced in the preceding five years. From a local perspective,Oceania produced seven million square metres <strong>of</strong> tile.CONSUMPTIONThe last two years have seen a remarkable convergence betweentile <strong>production</strong> <strong>and</strong> <strong>consumption</strong>. In 2004, the gap between thetwo was as high as 370 million square metres. By 2009, this figurehad fallen to only 55 million square metres, with manufacturers<strong>and</strong> suppliers mindful <strong>of</strong> adding to existing warehouse stocks.Domestic Sales79.5%As <strong>production</strong> slumped by the smallest <strong>of</strong>margins, worldwide <strong>consumption</strong> rose by1.3 per cent to an all-time high <strong>of</strong> 8.46billion square metres.The geographical breakdown <strong>of</strong> <strong>production</strong><strong>and</strong> <strong>consumption</strong> highlights several recurrentthemes, such as the growing dominance <strong>of</strong>Asia, the increasing significance <strong>of</strong> Central<strong>and</strong> South America, <strong>and</strong> the inexorabledecline <strong>of</strong> Europe, chiefly those nations inthe European Union, where <strong>consumption</strong>fell by 18.8 per cent. Tile <strong>consumption</strong> in theEU amounted to 991 million square metres,with every sizeable market reporting adownturn in sales. Europe’s three representatives in the top ten <strong>of</strong>the 2008 <strong>consumption</strong> list were ousted unceremoniously by nationsin Africa, North America <strong>and</strong> the Middle East.The biggest slump was recorded in Spain where tile sales droppedby 34.9 per cent. In 2007, the Spanish public purchased 314 millionsquare metre <strong>of</strong> tile, a quantity which has since halved. Italian<strong>consumption</strong> has abated as well, but to a far lesser degree, fallingby 16.8 per cent to 146 million square metres. The popularity <strong>of</strong>tile has diminished in Britain, where a previously settled consumermarket has shrunk by a third in only two years. Further losses werereported in France <strong>and</strong> Germany with <strong>consumption</strong> dwindling inthose larger markets by 11.5 <strong>and</strong> 4.8 per cent. Germans used less<strong>ceramic</strong> tile for the fifth consecutive year – 106 million squaremetres – while sales in France declined after a recovery had takenin 2007 <strong>and</strong> 2008.Polish tile <strong>consumption</strong> dropped below 100 million squaremetres for the first time since the nation joined the EuropeanUnion in May 2004. The downturn in sales in non-EU Europe,which measured 11.1 per cent, was largely confined to Russia <strong>and</strong>Ukraine. Russian buyers purchased 139 million square metres assales decreased by 27.3 per cent. Ukrainian <strong>consumption</strong> fell by18.8 per cent, bringing to an end a three year period <strong>of</strong> massivemarket expansion. Turkish sales rebounded impressively after twoyears <strong>of</strong> decline.Unsurprisingly, the continent that produces the most <strong>ceramic</strong>tile is also the industry’s leading consumer market. In total, the46 TILEToDAY #69 www.infotile.com/publications
nations <strong>of</strong> Asia consumed 5.273 billion square metres <strong>of</strong> tile,a truly staggering amount that equates to 62.3 per cent <strong>of</strong> theworld’s <strong>ceramic</strong> tile purchases. The continent almost monopolisesthe top consumers list, claiming five <strong>of</strong> the highest six positions.China inevitably sits atop the rankings having used 3.03 billionsquare metres <strong>of</strong> product last year. The nation increased its tile<strong>consumption</strong> by 7.1 per cent <strong>and</strong> currently accounts for more thana third <strong>of</strong> global tile sales.Dem<strong>and</strong> for <strong>ceramic</strong> tile soared in India where local buyerspurchased 494 million square metres <strong>of</strong> product. Malaysia enjoyedthe greatest market growth as local tile <strong>consumption</strong> jumped by38 per cent. Tile <strong>consumption</strong> in the Middle East was centred inIran <strong>and</strong> Saudi Arabia, rising by over 11 per cent in the former<strong>and</strong> 22.1 per cent in the latter. In the United Arab Emirates, <strong>tiles</strong>ales plummeted by 19.8 per cent, eventually stalling at 77million square metres. Indonesia climbed to fourth spot on the<strong>consumption</strong> table after three years <strong>of</strong> rampant expansion. TheVietnamese market improved as well with sales totalling 240million square metres. Other changes in <strong>consumption</strong> were lessremarkable, such as the negligible improvement in South Korea<strong>and</strong> the slight regression in Thail<strong>and</strong>. The burgeoning Filipinomarket also continues to grow.In North America, the decline in tile <strong>consumption</strong> continuedat a marginally slower rate as sales figures dropped by 10.9 percent. Tile buyers in the United States purchased 169 million squaremetres <strong>of</strong> product, six million square metres more than consumersin Mexico. The slump in America was more precipitous, measuring14.2 per cent as opposed to the 7.2 per cent downturn in Mexican<strong>consumption</strong>. Including Canada, the region used 360 millionsquare metres <strong>of</strong> tile.Tile <strong>consumption</strong> in Central <strong>and</strong> South America rose by 1 percent which was mainly due to the rapid expansion <strong>of</strong> the BrazilianTOP CONSUMPTION COUNTRIESCOUNTRY2005(Sq.m Mill.)2006(Sq.m Mill.)2007(Sq.m Mill.)2008(Sq.m Mill.)2009(Sq.m Mill.)% on 2009world<strong>consumption</strong>% var.09/081. CHINA 2,050 2,450 2,700 2,830 3,030 35.8 7.12. BRAZIL 443 484 535 605 645 7.6 6.53. INDIA 303 350 397 403 494 5.8 22.64. INDONESIA 155 148 178 262 297 3.5 13.45. IRAN 153 182 236 265 295 3.5 11.36. VIETNAM 120 145 210 220 240 2.8 9.17. EGYPT 93 103 105 140 180 2.1 28.68. USA 303 308 249 197 169 2.0 -14.29. SAUDI ARABIA 90 100 110 136 166 2.0 22.110. MEXICO 161 164 173 176 163 1.9 -7.211. SPAIN 303 319 314 240 156 1.8 -34.912. ITALY 192 199 199 176 146 1.7 -16.813. RUSSIA 131 151 176 191 139 1.6 -27.314. TURKEY 169 179 161 129 138 1.6 6.515. THAILAND 120 121 120 120 117 1.4 -2.516. FRANCE 130 120 129 128 113 1.3 -11.517. GERMANY 132 128 124 112 106 1.3 -4.818. SOUTH KOREA 94 99 110 99 99 1.2 0.519. POLAND 101 102 100 103 93 1.1 -10.120. UAE 70 80 81 96 77 0.9 -19.821. MALAYSIA 52 45 53 50 69 0.8 38.022. MOROCCO 49 52 56 60 66 0.8 9.223. ARGENTINA 44 48 55 59 55 0.7 -6.824. COLOMBIA 44 48 53 54 53 0.6 -1.925. GREAT BRITAIN 72 75 75 66 50 0.6 -23.726. PORTUGAL 51 47 48 50 48 0.6 -2.827. UKRAINE 29 33 47 59 48 0.6 -18.628. SOUTH AFRICA 44 48 50 50 43 0.5 -14.029. ALGERIA 33 34 35 37 40 0.5 8.130. PHILIPPINES 30 33 37 38 40 0.5 5.3TOTAL 5,762 6,456 6,914 7,150 7,374 87.2 3.1WORLD TOTAL 6,750 7,420 8,060 8,350 8,460 100.0 1.3In 2009, the 30 major consuming countries covered 87.2% <strong>of</strong> world <strong>consumption</strong>48 TILEToDAY #69 www.infotile.com/publications
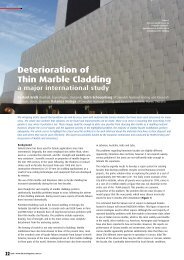
market. In 2009, the people <strong>of</strong> Brazilconsumed 645 million square metresor 7.6 per cent <strong>of</strong> the world’s <strong>ceramic</strong>tile. This outst<strong>and</strong>ing performance wastempered by disappointing sales inthe Argentine <strong>and</strong> Colombian markets.Both countries returned to 2007levels <strong>of</strong> <strong>consumption</strong> with sales inArgentina falling from 59 to 55 millionsquare metres. Consumer dem<strong>and</strong>in Colombia dropped from 54 to 53million square metres.Use <strong>of</strong> tile in Africa is concentrated infour countries; Egypt, Morocco, SouthAfrica <strong>and</strong> Algeria. Egypt, alone, isresponsible for 38 per cent <strong>of</strong> Africa’stile <strong>consumption</strong> with 180 millionsquare metres <strong>of</strong> product purchasedthere in 2009. Moroccans consumed66 million square metres <strong>of</strong> tile assales increased by 9.2 per cent. InSouth Africa, consumer dem<strong>and</strong> fellby 14 per cent as sales <strong>of</strong> <strong>ceramic</strong>tile dipped below their 2005 level.Conversely, the Algerian marketcontinued to grow with tile sales risingto 40 million square metres.In Oceania, <strong>consumption</strong> fell by 14per cent, totalling 37 million squaremetres.EXPORTSIn 2009, the hardest hit area <strong>of</strong> the<strong>ceramic</strong> tile industry was the imports<strong>and</strong> exports sector. In stark contrast to the year’s <strong>production</strong> <strong>and</strong><strong>consumption</strong> statistics, which altered only marginally, there wasa considerable drop in the quantity <strong>of</strong> tile that was made in onecountry <strong>and</strong> purchased in another. As each year passes, imports/exports are falling as a percentage <strong>of</strong> global <strong>consumption</strong>, a trendITALY: TOP EXPORT MARKETSCOUNTRY2008 2009(Sq.m Mill.) (Sq.m Mill.)1 FRANCE 56.9 49.72 GERMANY 41.3 39.63 USA 40.8 27.34 GREECE 18.7 12.55 AUSTRIA 10.4 9.96 BELGIUM+LUX 10.4 9.27 CANADA 8.5 7.48 SWITZERLAND 7.8 7.49 UK 8.7 6.510 NETHERLANDS 6.5 5.411 CROATIA 6.3 5.112 SAUDI ARABIA 6.8 4.913 ROMANIA 5.8 4.514 SWEDEN 5.1 4.415 HUNGARY 6.0 4.316 POLAND 5.5 3.717 RUSSIA 6.3 3.518 SLOVENIA 4.1 3.219 DENMARK 4.5 3.120 ISRAEL 2.9 3.121 CZECH REP. 3.5 3.022 FINLAND 3.5 2.723 SPAIN 4.7 2.624 BULGARIA NA 2.025 AUSTRALIA 3.0 2.0Source: Confindustria Ceramicawhich suggests most nations arebecoming increasingly self-reliant inproducing <strong>and</strong> consuming their own<strong>ceramic</strong> tile. This is evidenced by thefact that four-fifths <strong>of</strong> the world’s<strong>ceramic</strong> tile is now consumed in itscountry <strong>of</strong> origin. Exports declined inevery region, except Asia, with thebiggest downturns recorded in non-EUEurope <strong>and</strong> Central <strong>and</strong> South America.Of the 27 EU member states, Italy<strong>and</strong> Spain were the worst affectedwith their exports tumbling by 23 <strong>and</strong>20.9 per cent, respectively. In spite<strong>of</strong> these difficulties, the two nationsremain second <strong>and</strong> third on the list <strong>of</strong>exporters; Italy exported 281 millionsquare metres <strong>of</strong> tile, whilst 235million square metres left the shores<strong>of</strong> Spain. German exports fell afterthree years <strong>of</strong> growth (from 28 to 23million square metres) <strong>and</strong> Portugalsuffered an uncustomary setbackafter a lengthy period <strong>of</strong> stability.The continued expansion <strong>of</strong> Pol<strong>and</strong>’sexport sector is the EU’s biggesttriumph as dem<strong>and</strong> for Polish <strong>tiles</strong>increased for the fifth consecutiveyear, reaching 35 million squaremetres. Exports from the EuropeanUnion totalled 660 million squaremetres, an amount surpassed onlyby Asia. The hardships endured in theexport sector were most apparent innon-EU Europe, particularly Turkey, where exports slumped by 26.8per cent.Central <strong>and</strong> South America saw their combined exports decreaseby 20.7 per cent, a significant relapse that amplified difficultiesfrom the previous year. In keeping with regional statistics regardingTOP EXPORTING COUNTRIES2005COUNTRY(Sq.m Mill.)2006(Sq.m Mill.)2007(Sq.m Mill.)2008(Sq.m Mill.)2009(Sq.m Mill.)% on 2009world<strong>consumption</strong>% on 2009worldexports1 CHINA 342 450 500 570 584 6.9 33.7 2.52 ITALY 390 396 379 355 281 3.3 16.2 -20.93 SPAIN 341 336 333 306 235 2.8 13.6 -23.04 TURKEY 97 93 104 92 67 0.8 3.9 -26.85 BRAZIL 114 115 102 81 61 0.7 3.5 -25.46 MEXICO 46 55 56 62 51 0.6 2.9 -18.37 IRAN 14 19 17 27 40 0.5 2.3 48.98 THAILAND 25 27 25 25 36 0.4 2.1 44.09 POLAND 19 21 30 34 35 0.4 2.0 3.210 PORTUGAL 34 36 37 37 32 0.4 1.9 -12.111 UAE 25 32 38 34 31 0.4 1.8 -8.812 VIETNAM 12 15 25 25 28 0.3 1.6 12.013 EGYPT 16 17 22 23 23 0.3 1.3 0.014 MALAYSIA 18 22 18 23 23 0.3 1.3 0.015 GERMANY 21 24 26 28 23 0.3 1.3 -17.1TOTAL 1,514 1,657 1,712 1,722 1,550 18.3 89.4 -9.9WORLD TOTAL 1,715 1,865 1,910 1,919 1,735 20.5 100.0 -9.6In 2009 the 15 major exporting countries represented 89.9% <strong>of</strong> total exports <strong>and</strong> 18.3% <strong>of</strong> total world <strong>consumption</strong>.% var09/0850 TILEToDAY #69 www.infotile.com/publications
<strong>production</strong> <strong>and</strong> <strong>consumption</strong>, the Brazilian industry, whichaccounts for two-thirds <strong>of</strong> Central <strong>and</strong> South American exports, hasthe greatest influence. Unfortunately, exports from Brazil declinedfor the third year in a row from 81 to 61 million square metres.The only nation in North America to export a sizeable quantity <strong>of</strong>tile is Mexico. After four remarkable years, in which the country’sexports nearly doubled, overseas interest in Mexican tile droppedby 18.3 per cent. This unwelcome regression was made all themore damaging by the negligible presence <strong>of</strong> U.S. exports, whichfailed to exceed five million square metres.Tile exports from Asia rose by 5.8 per cent to a record 797 millionsquare metres. China’s export growth slowed considerably but thenation still managed to ship 73.7 per cent (584 million squaremetres) <strong>of</strong> the continent’s annual exports. The absence <strong>of</strong> anysubstantial growth in China was counterbalanced by a dramaticescalation in Iranian <strong>and</strong> Thai exports. International sales <strong>of</strong>Iranian <strong>tiles</strong> have risen fourfold in the last five years with exportsincreasing to 40 million square metres after an upsurge <strong>of</strong> 48.9per cent in 2009. Thail<strong>and</strong> exported more than a quarter <strong>of</strong> the<strong>tiles</strong> it manufactured (36 <strong>of</strong> 128 million square metres) as foreigndem<strong>and</strong> for the country’s products soared by 44 per cent.Malaysia exported the same amount <strong>of</strong> <strong>tiles</strong> as in 2008 whilstVietnam increased it overseas share by a further 12 per cent. Theregion’s worst performer was the United Arab Emirates whereexports slumped for the second year running. Egypt, Africa’s majortile exporter, replicated its performance from the previous year butwas unable to prevent a continent-wide downturn <strong>of</strong> 8.3 per cent.Elsewhere, Oceania exported only one million square metres <strong>of</strong> tile.ImportsDespite a significant decline in <strong>consumption</strong>, the United Statesremains the world’s biggest <strong>ceramic</strong> tile importer. In 2009, thecountry consumed 124 million square metres <strong>of</strong> foreign madeproduct, which mostly arrived from China, Mexico <strong>and</strong> Italy.Although this figure appears impressive in isolation, it unfortunatelypoints to a severe contraction <strong>of</strong> the U.S. import market whichbegan in 2007. America’s northern neighbour, Canada, imported27 million square metres <strong>of</strong> tile last year.In certain parts <strong>of</strong> Europe, imported tile sales declined rapidly.Huge downturns were recorded in Romania <strong>and</strong> Greece whereimports plummeted by 33 <strong>and</strong> 36.4 per cent. The worst affectedmarket was Russia where imports decreased by 44.8 percent. Other nations that acquired much smaller quantities <strong>of</strong>tile from overseas were Italy, France <strong>and</strong> Great Britain, whereimports have slumped by 36 per cent since 2007. Germany hassteadily reduced its imports over a number <strong>of</strong> years, from 106million square metres in 2004 to just 78 million square metreslast year. In Belgium <strong>and</strong> Luxembourg, consumer dem<strong>and</strong> forforeign made <strong>tiles</strong> differed only slightly, falling from 26 to 25million square metres.Tile imports in the Middle East varied greatly from one nationto the next. Rising sales in Iraq <strong>and</strong> Saudi Arabia were counteredby diminishing returns in Kuwait <strong>and</strong> the United Arab Emirates.Israeli imports were unchanged from 2008, totalling 30 millionsquare metres. Asia’s second most receptive market shrank by15.4 per cent as sales to South Korea slumped to 55 millionsquare metres. Promising growth was observed in the Filipino<strong>and</strong> Thai markets with the countries importing a combined total<strong>of</strong> 49 million square metres.Nigeria purchases more <strong>tiles</strong> from overseas than any otherAfrican nation. In 2009, imports to the West African countrytotalled 29 million square metres. Australia remains the mostlucrative market in Oceania despite a 15.9 per cent drop in importslast year. The people <strong>of</strong> Australia consumed 28 million squaremetres <strong>of</strong> imported tile, the majority <strong>of</strong> which was manufacturedin China.TOP IMPORTING COUNTRIESCOUNTRY 2005(Sq.m Mill.)2006(Sq.m Mill.)2007(Sq.m Mill.)2008(Sq.m Mill.)2009(Sq.m Mill.)% on 2009national<strong>consumption</strong>%o n 2009worldimports1 USA 245 254 202 157 124 73.3 7.1 -20.92 SAUDI ARABIA 80 89 77 99 116 69.9 6.7 17.23 FRANCE 110 110 110 112 101 89.0 5.8 -10.24 GERMANY 90 87 83 80 78 73.4 4.5 -2.55 SOUTH KOREA 51 54 66 59 55 55.1 3.2 -7.86 UAE 35 51 43 55 45 58.4 2.6 -17.47 GREAT BRITAIN 64 66 67 58 43 86.0 2.5 -25.98 IRAQ 2 3 10 23 40 100.0 2.3 76.09 ISRAEL 29 26 30 30 30 90.9 1.7 0.010 RUSSIA 35 42 47 54 30 21.5 1.7 -44.811 GREECE 42 43 51 44 30 79.7 1.7 -33.012 NIGERIA 19 27 22 30 29 100.0 1.7 -3.313 THAILAND 22 20 22 25 28 23.9 1.6 12.014 AUSTRALIA 32 31 34 33 28 79.7 1.6 -15.915 CANADA 32 33 35 30 27 97.8 1.6 -10.016 BELGIUM + LUX. 22 23 28 26 25 97.3 1.5 -3.117 ROMANIA 27 28 33 35 22 62.9 1.3 -36.418 PHILIPPINES 9 15 15 16 21 52.5 1.2 35.519 KUWAIT 19 18 16 23 19 96.5 1.1 -16.120 ITALY 22 28 31 25 19 13.0 1.1 -23.4TOTAL 985 1,043 1,020 1,012 910 60.5 52.4 -9.5WORLD TOTAL 1,715 1,855 1,910 1,919 1,735 20.5 100.0 -9.6In 2009 Imports <strong>of</strong> the 20 major importing countries represented 52.4% <strong>of</strong> total imports <strong>and</strong> 10.8% <strong>of</strong> total world <strong>consumption</strong>.% var.09/0852 TILEToDAY #69 www.infotile.com/publications