Dear Author, Here are the proofs of your article. ⢠You can submit ...
Dear Author, Here are the proofs of your article. ⢠You can submit ...
Dear Author, Here are the proofs of your article. ⢠You can submit ...
- No tags were found...

Create successful ePaper yourself
Turn your PDF publications into a flip-book with our unique Google optimized e-Paper software.
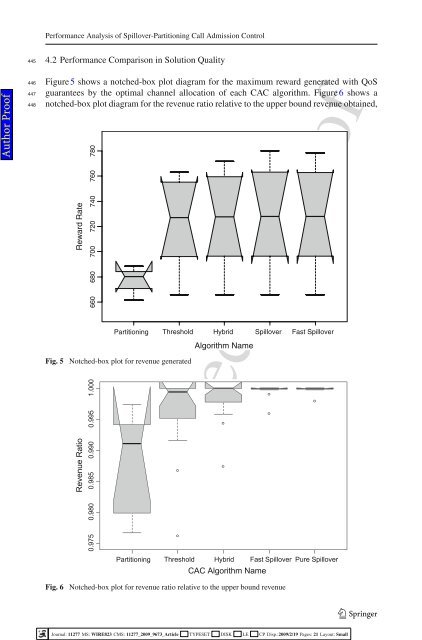
Performance Analysis <strong>of</strong> Spillover-Partitioning Call Admission Control4454.2 Performance Comparison in Solution Quality<strong>Author</strong> Pro<strong>of</strong>446447448Figure 5 shows a notched-box plot diagram for <strong>the</strong> maximum reward generated with QoSguarantees by <strong>the</strong> optimal channel allocation <strong>of</strong> each CAC algorithm. Figure 6 shows anotched-box plot diagram for <strong>the</strong> revenue ratio relative to <strong>the</strong> upper bound revenue obtained,Reward Rate660 680 700 720 740 760 780Partitioning Threshold Hybrid Spillover Fast SpilloverFig. 5 Notched-box plot for revenue generatedRevenue Ratio0.975 0.980 0.985 0.990 0.995 1.000Algorithm Nameuncorrected pro<strong>of</strong>Partitioning Threshold Hybrid Fast Spillover Pure SpilloverCAC Algorithm NameFig. 6 Notched-box plot for revenue ratio relative to <strong>the</strong> upper bound revenue123Journal: 11277 MS: WIRE823 CMS: 11277_2009_9673_Article TYPESET DISK LE CP Disp.:2009/2/19 Pages: 21 Layout: Small