Defect detection on hardwood logs using high resolution three ...
Defect detection on hardwood logs using high resolution three ...
Defect detection on hardwood logs using high resolution three ...
- No tags were found...

Create successful ePaper yourself
Turn your PDF publications into a flip-book with our unique Google optimized e-Paper software.
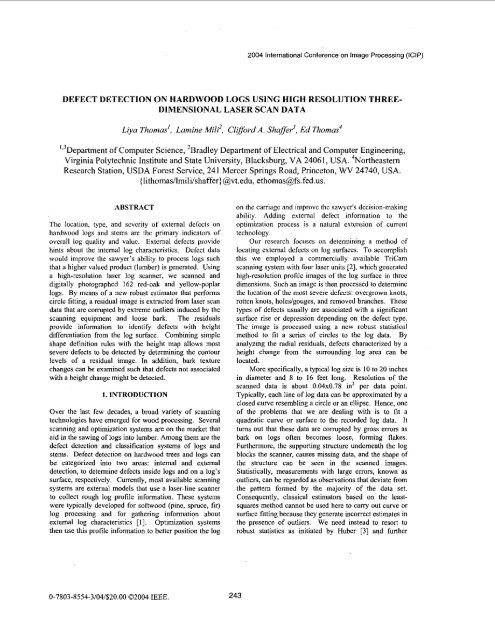
2004 Internati<strong>on</strong>al C<strong>on</strong>ference <strong>on</strong> Image Processing (ICIP)DEFECT DETECTION ON HARDWOOD LOGS USING HIGH RESOLUTION THREE-DIMENSIONAL LASER SCAN DATALiya Thomas'. Lumine Mili', Cl@ord A. Shuffer3, Ed Thomas4'.3Department of Computer Science, 'Bradley Department of Electrical and Computer Engineering,Virginia Polytechnic Institute and State University, Blacksburg, VA 24061, USA. 4NortheastemResearch Stati<strong>on</strong>, USDA Forest Service, 241 Mercer Springs Road, Princet<strong>on</strong>, W V 24740, USA.{ lithomas/lmili/shaffer} @vt.edu, ethomas@fs.fed.us.ABSTRACTThe locati<strong>on</strong>, type, and sevcrity of external defccts <strong>on</strong><strong>hardwood</strong> <strong>logs</strong> and stems are the primary indicators ofovcrdll log quality and valuc. External defects providehints about the intcmal log charactcristics. <str<strong>on</strong>g>Defect</str<strong>on</strong>g> datawould improve the sawyer's ability to process <strong>logs</strong> suchthat a <strong>high</strong>er valued product (lumber) is generated. Usinga <strong>high</strong>-resoluti<strong>on</strong> laser log scanner, we scanncd anddigitally photographed 162 red-oak and yellow-poplar<strong>logs</strong>. By means of a new robust estimator that performscircle fitting, a residual image is extracted from laser scandata that are corrupted by extreme outliers induced by thescanning equipment and loose bark. The residualsprovide informati<strong>on</strong> to identify defects with heightdifferentiati<strong>on</strong> from the log surface. Combining simplcshape definiti<strong>on</strong> rules with the height map allows mostsevere defects to be detected by determining the c<strong>on</strong>tourlevels of a residual image. In. additi<strong>on</strong>, bark texturechanges can be examined such that defects not associatedwith a height change might he detected.1. INTRODUCTIONOver the last few decades, a broad variety of scanningtechnologies have emerged for wood processing. Severalscanning and optimizati<strong>on</strong> systems are <strong>on</strong> the market thataid in the sawing of <strong>logs</strong> into lumber. Am<strong>on</strong>g them are thedefect <str<strong>on</strong>g>detecti<strong>on</strong></str<strong>on</strong>g> and classificati<strong>on</strong> systems of <strong>logs</strong> andstems. <str<strong>on</strong>g>Defect</str<strong>on</strong>g> <str<strong>on</strong>g>detecti<strong>on</strong></str<strong>on</strong>g> <strong>on</strong> <strong>hardwood</strong> trees and <strong>logs</strong> canbe categorized into two areas: internal and external<str<strong>on</strong>g>detecti<strong>on</strong></str<strong>on</strong>g>, to determine defects inside <strong>logs</strong> and <strong>on</strong> a log'ssurface, respectively. Currently, most available scanningsystems are external models that use a laser-line scannerto collect rough log profile informati<strong>on</strong>. These systemswere typically developed for softwood (pine, spruce, fir)log processing and for gathering informati<strong>on</strong> aboutexternal log characteristics [l]. Optimizati<strong>on</strong> systemsthen use this profile informati<strong>on</strong> to better positi<strong>on</strong> the log<strong>on</strong> the carriagc and improvc thc sawyer's decisi<strong>on</strong>-makingability. Adding exlemal defect informati<strong>on</strong> to theoptimizati<strong>on</strong> process is a natural extcnsi<strong>on</strong> of currenttechnology.Our rcsearch foocuscs <strong>on</strong> determining a method oflocating external defects <strong>on</strong> log surfaces. To accomplishthis we employed a commercially available TriCamscanning system with four laser units [Z], which gcncrated<strong>high</strong>-rcsoluti<strong>on</strong> profilc images of the log surface io <strong>three</strong>dimensi<strong>on</strong>s. Such an image is then processed to determinethe locati<strong>on</strong> of the most severe defects: overgrown knots,rotten knots, holedgouges, and removed branches. Thesetypes of defects usually are associated with a significantsurface rise or depressi<strong>on</strong> depending <strong>on</strong> the dcfect type.The image is processed <strong>using</strong> a new robust statisticalmethod to fit a series of circles to the log data. Byanalyzing the radial residuals, defects characterized by aheight change from the surrounding log area can belocated.More specifically, a typical log size is 10 to 20 inchesin diameter and 8 to 16 feet l<strong>on</strong>g. Resoluti<strong>on</strong> of thescanned data is about 0.04x0.78 inz per data point.Typically, each line of log data can be approximated by aclosed curve resembling a circle or an ellipse. Hence, <strong>on</strong>eof the problems that we are dealing with is to tit aquadratic curve or surface to the recorded log data. Ittums out that these data are corrupted by gross errors asbark <strong>on</strong> <strong>logs</strong> often becomes loose, forming flakes.Furthermore, the supporting structure underneath the logblocks the scanner, causes missing data, and the shape ofthe structure can he seen in the scanned images.Statistically, measurements with large errors, known asoutliers, can be regarded as observati<strong>on</strong>s that deviate fromthe pattern formed by the majority of the data set.C<strong>on</strong>sequently, classical estimators based <strong>on</strong> the leastsquaresmethod cannot he used here to carry out curve orsurface fitting because they generate incorrect estimates inthe presence of outliers. We need instead to resort torobust statistics as initiated by Huber [3] and further0-7803-8554-3/04/$20.00 02004 IEEE243
developed by Hampcl et al. [4]. Based <strong>on</strong> this theoreticalframework, we dcveloped a new generalized M-estimatorto tit circles to log data, which is able to downweight alltypes of outlicrs, hence bounding their influence <strong>on</strong> theestimates. Thesc fitted circles allow us to extractresiduals, dctcrmine c<strong>on</strong>tour levels, and finally detect andidentify log defects. Let us stress that the c<strong>on</strong>tour levelsrevealcd themselves as a powerful tool for shaping thetopology of the log surface and thereby, allowing us topinpoint any atypical elcvati<strong>on</strong> or depressi<strong>on</strong> <strong>on</strong> the <strong>logs</strong>urface by means of appropriate statistical methods. As afuture work, pattern recogniti<strong>on</strong> methods will be carriedout for defect identificati<strong>on</strong> and classificati<strong>on</strong> <strong>on</strong>ce thetax<strong>on</strong>omy of the defects has been completed.The paper is organized as follows. Secti<strong>on</strong> 2describes the robust fitting procedures for estimating <strong>logs</strong>hape. Sccti<strong>on</strong> 3 characterizcs several severe externaldefects <strong>on</strong> <strong>hardwood</strong> <strong>logs</strong>. Sccti<strong>on</strong> 4 presents examples ofrcsults that we have obtaincd to illustratc the potential ofthis approach in dctccting surface dcfccts. Finally Secti<strong>on</strong>5 c<strong>on</strong>tains c<strong>on</strong>cluding remarks and future work.under the log. As evidenced from Fig. 1, the classicalleast-squarcs estimator failed to provide a good fit fromsuch corrupted data set. Obviously, a robust estimatorthat suppresses the outlicrs is needed here.The n<strong>on</strong>linear form of thc circlc equati<strong>on</strong> promptedus to develop a new robust estimati<strong>on</strong> method that is anoutgrowth of the <strong>on</strong>e proposed by Mili et al. [6]. It is ageneralized M-estimator (GM-estimator) that fits an<strong>on</strong>linear rcgrcssi<strong>on</strong> model of the circle given bywhere e = [pl, p?, pi]' is the parameter vector c<strong>on</strong>tainingthe center coordinaies (pi. p2) and the radius pi of thecircle and where &=[xl, xJT is the two-dimensi<strong>on</strong>almeasurcmcnt vector c<strong>on</strong>taining the data in a cross secti<strong>on</strong>from the scanner. The robustness of this GM-estimatorstcms from the fact that it not <strong>on</strong>ly bounds the influenceof the model errors, e, but also of the errors innicasurements, ~=[ql, qd'. This is achieved byminimizing an objective functi<strong>on</strong> exprcsscd as2. LOG IMAGE PROCESSINGSevere extemal defects that corresp<strong>on</strong>d to rises ordepressi<strong>on</strong>s <strong>on</strong> the log surface can be observed from the<strong>three</strong>-dimensi<strong>on</strong>al log surface image. This suggests thatwe may extract the height change <strong>on</strong> the log surface fromits 3-D image to determine the defect locati<strong>on</strong>. We applyrobust statistics techniques to fit quadratic CUNCS to crosssecti<strong>on</strong>s in the presence of a <strong>high</strong> noise level in the logdata, and a new generalized M-estimator was developed.Orthog<strong>on</strong>al distances between fitted cwes and the <strong>logs</strong>urface data, or radial residuals, are estimated, whichreflects height change from the surrounding log area.<str<strong>on</strong>g>Defect</str<strong>on</strong>g>s characterized by surface rises or depressi<strong>on</strong>scould thus be located.whcrc2.1. Circle Fitting and Outlier Suppressi<strong>on</strong>Since <strong>logs</strong> are natural objects that are approximatelycircular or elliptical al<strong>on</strong>g the cross secti<strong>on</strong>s, weexperimented with fitting circles and ellipses to the logdata, which all together form a reference surface, orvinual log, needed for defect <str<strong>on</strong>g>detecti<strong>on</strong></str<strong>on</strong>g>. 2-D quadraticcurve fining is a problem in n<strong>on</strong>linear regressi<strong>on</strong> [SI. Oneof the main problems that we had to overcome is thepresence of extreme outliers and missing data in the logdata cross-secti<strong>on</strong>s. See Fig. 1 for such an example.Missing data are due to the blockage of the log by thesupporting structure while extreme outliers are irrelevantdata caused by both dangling loose bark and the scanningsystem, duplicate data generated by scanner calibrati<strong>on</strong>errors and unwanted data from the supporting structureFigure 1 -A log data cross-secti<strong>on</strong> with outliers markedand with a fitted circle obtained by means of the newrobust GM- estimator displayed in c<strong>on</strong>tinuous line.Shown also is the least squares fit in dashed line.244
4. SIMULATION RESULTSUsing the gray-level image, shown in Figure 2, we cangenerate a c<strong>on</strong>tour plot (Fig. 4), where it is possible todisccm the areas c<strong>on</strong>taining likely defects based <strong>on</strong> heightinformati<strong>on</strong> al<strong>on</strong>e. We developed an algorithm to generatercctangles that enclose arcas with c<strong>on</strong>tour curves at the<strong>high</strong>est level. The arcas are selected dcpending <strong>on</strong> theirsizcs. Our simulati<strong>on</strong> showcd that the majority of themost protruding or depressing dcfccts with a diameter atIcast 3.5 inches is largely detected. However, therectangles as in Fig. 4 often enclosc a porti<strong>on</strong>, e.g., acomer, of the cxtemal defect. Further analysis is requiredto correctly map the exact dcfect area.circle fitting, the resulting residual images from ellipsefitting, however detailed, arc noisier. Cylinder fittinggives a coarse hut smooth picture; circlc fitting providesmore details, but introduces certain types of noise; andcllipse-fitting presents the most-detailed residual image,however noise level is the <strong>high</strong>est as well.The generati<strong>on</strong> and initial processing of the residualimage is not the final step of this work. At this point, <strong>on</strong>lylog unrolling and height analyses methods have beenexamined. Currently we are dcvcloping an algorithm thatdetermines whether an area of interest c<strong>on</strong>tains a sawnknot, by locating the approximately straight line segmentin a cross-sccti<strong>on</strong>. Texture analysis methods will also heinvestigated to dctcct defects without a significant heightchange, which are not detected <strong>using</strong> the c<strong>on</strong>tour method.Further, a preliminary study was c<strong>on</strong>ducted to extractfeatures of external defect types from randomly chosendefect samplcs. These features will bc used to train arobust clustering and classificati<strong>on</strong> system for the defectclassificati<strong>on</strong>.6. REFERENCESFigure 4-A porti<strong>on</strong> of a c<strong>on</strong>tour plot generated from thcgray-scale residual image tn Figure 2. The warmer thccolor, the <strong>high</strong>er level the c<strong>on</strong>tour. The rectangle framesthe <strong>high</strong>est c<strong>on</strong>tour which encloses the defect.<str<strong>on</strong>g>Defect</str<strong>on</strong>g>s with little surface variati<strong>on</strong> are not covered inthe <strong>high</strong>est or lowest c<strong>on</strong>tour curves and thus cannot beenclosed in the rectangles. Such defects include smallovergrown knots and sound knots, and severe or mediumdistorti<strong>on</strong>s. In general these are less severe than big knotsor dcep cracks <strong>on</strong> log surface.5. CONCLUSION AND FUTURE WORKThis paper describes our approach to detecting surfacedefects in <strong>hardwood</strong> <strong>logs</strong>. Robust estimati<strong>on</strong> and filteringtechniques are well suited to this applicati<strong>on</strong>. The currentprograms can process an entire log-data sample that mayc<strong>on</strong>tain large amounts of missing data and severeabnormal data (outliers) due to the nature of datacollccti<strong>on</strong>. The robust methods and procedures in theseprograms apply comm<strong>on</strong> heuristics to remove outliers.The original log data are processed and transformed into asharper and cleaner representati<strong>on</strong> of the entire log. Thequality of the gray-level image lays a solid foundati<strong>on</strong> forthe remaining defect-<str<strong>on</strong>g>detecti<strong>on</strong></str<strong>on</strong>g> process. C<strong>on</strong>tour levels ofthe residuals make it possible for further narrowing downthe potential defect areas.We may analyze residual images generated fromcircle-, ellipse, and cylinder- fining methods and combinethe results to help better identify defects. Compared to[I] M. Sams<strong>on</strong>, “Method for assessing the effect of knots in thec<strong>on</strong>versi<strong>on</strong> of <strong>logs</strong> into stmctllral lumber,” Wood and FiberScience, Vol. 25, No. 3, pp. 298-304, 1993.[2] Perceptr<strong>on</strong>, Forest Products Divisi<strong>on</strong>, “Mill Wide Scanningand Optimizati<strong>on</strong>,” Perceptr<strong>on</strong> Inc., Farmingt<strong>on</strong> Hills, MI,1999.htto://~.usnr.comluerceutro~Droducts.htm.[3] P. 1. Huber. Robust Statistics. John Wiley, 1981.[4] F.R. Hampel, E.M. R<strong>on</strong>chcni, P.J. Rousseeuw, and W.A.Stahel. Robust Slatislics: The approach Bused <strong>on</strong> InjlocnceFuncti<strong>on</strong>s. John Wiley, 1986.[5] W. Gander, G.H Golub, and’R. Strebcl, “Fitting of circlesand ellipses-least squares soluti<strong>on</strong>,” Tech. Rep. 217,lnsitiut fur Eisenschafiliches Rechnen, ETH Zurich,Switzerland, url: A~:~/fi~.inf.ethz.chldoc/tech-~~uo~~2~~/ ,1994.[6] L. Mili, M.G. Cheniae, N.S. Vichare, and P.J. Rousseeuw,“Robust State Estimati<strong>on</strong> Based <strong>on</strong> Projecti<strong>on</strong> Statistics,”IEEE Trans. <strong>on</strong> Power Systems, Vol. 1 1. No. 2, pp. , 1996.[7] R.M. Haralick and L. Shapiro. Computer and Robol Visi<strong>on</strong>,Volume 2. Addis<strong>on</strong>-Wesley. 1992.[SI Y. Leedan and P. Meer, “Heteroscedastic Regressi<strong>on</strong> inComputer Visi<strong>on</strong>: Problems with Bilinear C<strong>on</strong>straint,” Int.Joumal of Computer Visi<strong>on</strong>, Vol. 37, pp. 127-150, 2000.246