SUGI 26: A SAS/IML(r) Macro for Goodness-of-Fit Testing in Logistic ...
SUGI 26: A SAS/IML(r) Macro for Goodness-of-Fit Testing in Logistic ...
SUGI 26: A SAS/IML(r) Macro for Goodness-of-Fit Testing in Logistic ...

Create successful ePaper yourself
Turn your PDF publications into a flip-book with our unique Google optimized e-Paper software.
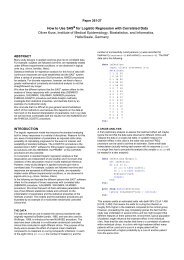
Statistics, Data Analysis, and Data M<strong>in</strong><strong>in</strong>gPaper <strong>26</strong>5-<strong>26</strong>A <strong>SAS</strong>/<strong>IML</strong> ® <strong>Macro</strong> <strong>for</strong> <strong>Goodness</strong>-<strong>of</strong>-<strong>Fit</strong> <strong>Test<strong>in</strong>g</strong> <strong>in</strong> <strong>Logistic</strong> Regression Models withSparse DataOliver Kuss, Institute <strong>of</strong> Medical Epidemiology, Biometry and In<strong>for</strong>matics,Halle/Saale, GermanyABSTRACTThe logistic regression model has become the standard analyz<strong>in</strong>gtool <strong>for</strong> b<strong>in</strong>ary responses <strong>in</strong> a variety <strong>of</strong> discipl<strong>in</strong>es. Methods <strong>for</strong>assess<strong>in</strong>g goodness-<strong>of</strong>-fit, however, are less developed and thisis especially pronounced <strong>in</strong> calculat<strong>in</strong>g goodness-<strong>of</strong>-fit tests withsparse data, when the standard tests (deviance and Pearsontest) behave unsatisfactorily.In our paper we show two solutions to the problem that areimplemented <strong>in</strong> the LOGISTIC procedure <strong>in</strong> <strong>SAS</strong> ® s<strong>of</strong>tware, and<strong>in</strong>troduce five additional test<strong>in</strong>g procedures from the statisticalliterature. By means <strong>of</strong> a simulation study we show that theseadditional tests are valid <strong>in</strong>struments <strong>for</strong> assess<strong>in</strong>g goodness-<strong>of</strong>fit<strong>in</strong> logistic regression models, even with sparse data. F<strong>in</strong>ally,we present the <strong>SAS</strong>/<strong>IML</strong> macro %GOFLOGIT which allowscalculation <strong>of</strong> the <strong>in</strong>troduced tests and illustrate the macro with anexample from occupational epidemiology on hand eczema <strong>in</strong>hairdressers.this would be the case if there are cont<strong>in</strong>uous or many covariates.In extreme cases each <strong>in</strong>dividual observation has its own riskpr<strong>of</strong>ile or pattern <strong>of</strong> covariates. In this case <strong>of</strong> sparseness, which<strong>in</strong> our view is more the rule than the exception <strong>in</strong> today’s datasets, the deviance and the Pearson test no longer have a chisquaredistribution under the null hypothesis and so no longer arevalid measures <strong>of</strong> model fit. Note that this is just an extension <strong>of</strong>the familiar problem <strong>of</strong> small cell counts <strong>in</strong> cont<strong>in</strong>gency tables.In the follow<strong>in</strong>g, we state the problem with some moremathematical rigor, show two possibilities to circumvent theproblem with PROC LOGISTIC, give five additional test<strong>in</strong>gprocedures from the statistical literature and present some resultsfrom a simulation study which demonstrate that these additionaltests are valid goodness-<strong>of</strong>-fit tests <strong>for</strong> logistic regression models,even with sparse data. F<strong>in</strong>ally, we present the <strong>SAS</strong>/<strong>IML</strong> macro%GOFLOGIT that allows the calculation <strong>of</strong> this new proceduresand illustrate the macro with an example from occupationalepidemiology on hand eczema <strong>in</strong> hairdressers.INTRODUCTIONThe logistic regression model has become the standard analyz<strong>in</strong>gtool <strong>for</strong> b<strong>in</strong>ary responses <strong>in</strong> a variety <strong>of</strong> discipl<strong>in</strong>es. This hasmany reasons: ease <strong>of</strong> <strong>in</strong>terpretation <strong>of</strong> parameters as adjustedodds ratios, possibility <strong>of</strong> calculat<strong>in</strong>g prognoses <strong>for</strong> the event <strong>of</strong><strong>in</strong>terest, and availability <strong>of</strong> standard s<strong>of</strong>tware. The LOGISTICprocedure is the standard tool <strong>in</strong> <strong>SAS</strong> s<strong>of</strong>tware <strong>for</strong> fitt<strong>in</strong>g logisticregression models, but solutions with the GENMOD, the PROBITor the CATMOD procedure are also possible.Methods <strong>for</strong> assess<strong>in</strong>g goodness-<strong>of</strong>-fit, however, are lessdeveloped, which may be due to the relative youth and theenhanced mathematical complexity <strong>of</strong> the logistic regressionmodel, compared to, <strong>for</strong> example, the l<strong>in</strong>ear regression model.In pr<strong>in</strong>ciple, there are two different approaches to assess<strong>in</strong>ggoodness-<strong>of</strong>-fit <strong>in</strong> logistic regression models. The first, known asresidual analysis, <strong>in</strong>vestigates the model on the level <strong>of</strong> <strong>in</strong>dividualobservations and looks <strong>for</strong> those observations which are notadequately described by the model or which are highly <strong>in</strong>fluentialon the model fit. Among the different <strong>SAS</strong> procedures <strong>for</strong> logisticregression PROC LOGISTIC <strong>of</strong>fers the most extensivepossibilities <strong>for</strong> residual analysis: the INFLUENCE option <strong>in</strong> theMODEL statement supplies a number <strong>of</strong> <strong>in</strong>fluence and outlierdiagnostics, and the IPLOTS option provides the correspond<strong>in</strong>gplots.The second approach to goodness-<strong>of</strong>-fit on which we will focusseeks to comb<strong>in</strong>e the <strong>in</strong><strong>for</strong>mation on the amount <strong>of</strong> lack-<strong>of</strong>-fit <strong>in</strong> as<strong>in</strong>gle number. Statistical tests, so called goodness-<strong>of</strong>-fit-tests,are then per<strong>for</strong>med to judge if the observed lack-<strong>of</strong>-fit isstatistically significant or due to random chance. There are twostandard procedures, the deviance and the Pearson test, andthese are rout<strong>in</strong>ely provided by PROC GENMOD and PROCPROBIT and optionally by PROC LOGISTIC (use theSCALE=none option <strong>in</strong> the MODEL statement).These tests, however, have a serious problem with sparse data,where “sparse data” means, that <strong>for</strong> every pattern <strong>of</strong> covariatevalues we have only a small number <strong>of</strong> observations. In general,GOODNESS-OF-FIT TESTS IN LOGISTICREGRESSION WITH SPARSE DATATHE MODELLet y i be the response with y i ~ b<strong>in</strong>omial(m i, π i). The modelequation is logit(π i)=x iβ, i=1,...,N, where β=(β 0,..., β p)’ is a vector<strong>of</strong> regression parameters correspond<strong>in</strong>g to a vector <strong>of</strong> p+1covariates x i=(1, x i1,...,x ip). Estimates <strong>of</strong> the β j are usuallycalculated by maximum likelihood and we get estimates <strong>of</strong> the π iby plugg<strong>in</strong>g the ^β j <strong>in</strong>to the model equation.Note that we consider grouped observations where two <strong>in</strong>dividualobservations with the same covariate pattern belong to the samegroup. Translated <strong>in</strong>to PROC LOGISTIC language this meansthat we consider the model to be specified <strong>in</strong> theevents/trials syntax where events counts the number <strong>of</strong>events (y i) and trials counts the number <strong>of</strong> <strong>in</strong>dividualobservations (m i) <strong>in</strong> a specific covariate pattern.STANDARD GOODNESS-OF-FIT TESTSTo assess goodness-<strong>of</strong>-fit <strong>in</strong> logistic regression one <strong>in</strong> generalcalculates the Pearson statisticor the devianceX2=N⎛ y ⎞iD = 2∑y log⎜ +1 ˆ⎟ii ⎝ miπi ⎠N2( yi− m ˆiπi)∑m ˆ π ( 1 ˆ π )i= 1 i i−( m − y )Both rely on the pr<strong>in</strong>ciple <strong>of</strong> compar<strong>in</strong>g observed (y i) to predicted(m i^π i) values and should be large if the model does not fit the datawell. To judge statistical significance they are usually comparedto a χ 2 N-p-1-distribution. The validity <strong>of</strong> this distribution, however,relies on the assumption <strong>of</strong> large m i, and both tests showunsatisfactory behaviour with sparse data, that is, small m i. It canbe shown (McCullagh and Nelder, 1986) that D degenerates toi⎛ m − ylog⎜⎝ mi⎞⎟⎠i i( 1−ˆ π ) ⎟ .i i= i
Statistics, Data Analysis, and Data M<strong>in</strong><strong>in</strong>gOsius, G. and Rojek, D. (1992), “Normal <strong>Goodness</strong>-<strong>of</strong>-<strong>Fit</strong> Tests<strong>for</strong> Mult<strong>in</strong>omial Models With Large Degrees <strong>of</strong> Freedom,” Journal<strong>of</strong> the American Statistical Association, 87, 1145-1152.<strong>SAS</strong> Institute Inc. (1988), <strong>SAS</strong>/<strong>IML</strong> Users’s Guide, Release6.03 Edition, Cary, NC: <strong>SAS</strong> Institute Inc.So, Y. (1993), “A Tutorial on <strong>Logistic</strong> Regression,” Proceed<strong>in</strong>gs <strong>of</strong>the Eighteenth Annual <strong>SAS</strong> Users Group InternationalConference, 18, 1290-1295.White, H. (1982), “Maximum Likelihood Estimation <strong>of</strong>Misspecified Models,” Econometrica, 50, 1-25.CONTACT INFORMATIONThe %GOFLOGIT macro is available on request from the author.Contact him at:Oliver KussInstitute <strong>of</strong> Medical Epidemiology, Biometry and In<strong>for</strong>matics06097 Halle/Saale, GermanyPhone: +49-345-5573582Fax: +49-345-5573580Email:Oliver.Kuss@mediz<strong>in</strong>.uni-halle.deWWW: http://imebmi.mediz<strong>in</strong>.uni-halle.de/5