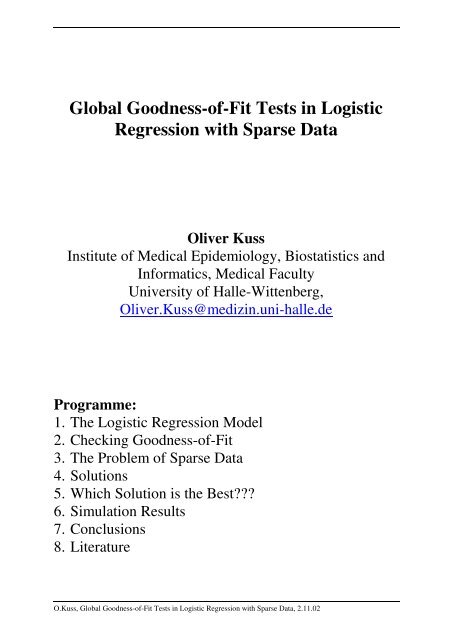
Global Goodness-of-Fit Tests in Logistic Regression with Sparse Data
Global Goodness-of-Fit Tests in Logistic Regression with Sparse Data
Global Goodness-of-Fit Tests in Logistic Regression with Sparse Data

Create successful ePaper yourself
Turn your PDF publications into a flip-book with our unique Google optimized e-Paper software.
<strong>Data</strong>:Response1 01 Y 1 m 1 -Y 1 m 1Covariate 2 Y 2 m 2 -Y 2 m 2Pattern : : : :N Y N m N -Y N m NExample:Cont<strong>in</strong>uous covariate(s): N=M (m i ≡1)Response1 01 1 0 1Covariate 2 0 1 1Pattern : : : :N 1 0 1Model equation:πlogi = 1−πi <strong>with</strong> β j = (β 0 ,..., β p ) vector <strong>of</strong> regression parameters.Estimate parameters β j via ML.pj=0xijβjO.Kuss, <strong>Global</strong> <strong>Goodness</strong>-<strong>of</strong>-<strong>Fit</strong> <strong>Tests</strong> <strong>in</strong> <strong>Logistic</strong> <strong>Regression</strong> <strong>with</strong> <strong>Sparse</strong> <strong>Data</strong>, 2.11.02
なりすまし・ 偽 造送 信受 信敵完 全 性 を 脅 かすなりすましにはユーザ 認 証 , 偽 造 にはメッセージ 認 証5
3. The Problem <strong>of</strong> <strong>Sparse</strong> <strong>Data</strong>The χ 2 -limit<strong>in</strong>g distribution is only valid for large m i(N fixed, m i →∝ for all i)Unrealistic <strong>with</strong> a large number <strong>of</strong> covariates or <strong>with</strong>cont<strong>in</strong>uous covariatesA disaster:In the extreme case <strong>of</strong> m i ≡1 D degenerates toN π iD = 2 πiln + ln( 1− πi ) 1− π ,i = 1is <strong>in</strong>dependent <strong>of</strong> the y i , and conta<strong>in</strong>s absolutely no<strong>in</strong>formation about the model fit.Not much better, for X 2 there is: X 2 ≈NiO.Kuss, <strong>Global</strong> <strong>Goodness</strong>-<strong>of</strong>-<strong>Fit</strong> <strong>Tests</strong> <strong>in</strong> <strong>Logistic</strong> <strong>Regression</strong> <strong>with</strong> <strong>Sparse</strong> <strong>Data</strong>, 2.11.02
The problem is well-known, ...- The X 2 and D goodness-<strong>of</strong>-fit statistics do not haveapproximate chi-squared distributions when appliedto logistic regression models <strong>with</strong> a cont<strong>in</strong>uouscovariate, unless there are many observations at eachlevel <strong>of</strong> the covariate. (Agresti, 1990)- Neither X 2 nor D is appropriate <strong>in</strong> the many stratastandard asymptotic model, because under this modelthere is no χ 2 -limit<strong>in</strong>g distribution. (Santner/Duffy,1989)- Thus, p-values calculated for X 2 and D when M ≈N,us<strong>in</strong>g the χ 2 -distribution, are <strong>in</strong>correct.(Hosmer/Lemeshow, 1989)- The effect <strong>of</strong> sparseness is noticed ma<strong>in</strong>ly on D andX 2 , which fail to have the properties required forgoodness-<strong>of</strong>-fit statistics. (McCullagh/Nelder, 1989)O.Kuss, <strong>Global</strong> <strong>Goodness</strong>-<strong>of</strong>-<strong>Fit</strong> <strong>Tests</strong> <strong>in</strong> <strong>Logistic</strong> <strong>Regression</strong> <strong>with</strong> <strong>Sparse</strong> <strong>Data</strong>, 2.11.02
... but what is the solution???- In pr<strong>in</strong>ciple it would seem preferable to accept thefailure <strong>of</strong> the chi-square limit and to use a moreaccurate approximation to the null distribution<strong>with</strong>out accumulat<strong>in</strong>g cells. (Lloyd, 1999)- Thus, to analyze lack <strong>of</strong> fit when explanatoryvariables are cont<strong>in</strong>uous, we apply goodness-<strong>of</strong>-fitstatistics and related residual measures by group<strong>in</strong>gobserved and fitted values for a partition <strong>of</strong> the space<strong>of</strong> explanatory variable values. (Agresti, 1989)- It is good statistical practice, however, not to rely oneither D or X 2 as an absolute measure <strong>of</strong> goodness <strong>of</strong>fit <strong>in</strong> these circumstances. It is much better to look forspecific deviations from the model <strong>of</strong> a type that iseasily understood scientifically. (McCullagh/Nelder,1989)O.Kuss, <strong>Global</strong> <strong>Goodness</strong>-<strong>of</strong>-<strong>Fit</strong> <strong>Tests</strong> <strong>in</strong> <strong>Logistic</strong> <strong>Regression</strong> <strong>with</strong> <strong>Sparse</strong> <strong>Data</strong>, 2.11.02
4. Solutions4.1 Modify limit<strong>in</strong>g distribution- X 2 , D are asymptotically normal under n, m i →∝(Osius/Rojek, 1992; McCullagh, 1986)4.2 Group<strong>in</strong>g observations- Hosmer-Lemeshow test (Hosmer/Lemeshow, 1980)Maybe the standard test <strong>with</strong> sparse data nowadays,but it has some deficiencies (Hosmer et al, 1997,Bertol<strong>in</strong>i et al., 2000)4.3 Use other tests statistics- X 2 F (Farr<strong>in</strong>gton, 1996)X 2 F = X 2 +Ni = 1Approximate moments:ˆt<strong>with</strong> Q X ( X ) t WX XTest:−m πi( 1 − 2πˆi)( ) ( y − )im ˆiπiˆ 1 − πˆN( X | ˆ β ) = N − p −1+ˆ π ( 1−ˆ π )i2EFi iQˆiii=1N2 p + 1mi−1Var( XF| ˆ β ) = 21− N i=1 mi−1= ˆ , Wˆdiag( m iˆ π (1 ˆi−πi))ZF= .2FVar2E( X ˆF| β )2( X | ˆ β ) 1/ 2is standard normal under the hypothesisProblem: For m i ≡,1 we have X 2 F =N=X−FiO.Kuss, <strong>Global</strong> <strong>Goodness</strong>-<strong>of</strong>-<strong>Fit</strong> <strong>Tests</strong> <strong>in</strong> <strong>Logistic</strong> <strong>Regression</strong> <strong>with</strong> <strong>Sparse</strong> <strong>Data</strong>, 2.11.02
- IM-Test (White, 1982; Orme, 1988)Information matrix equation:2 ∂ L − E = ∂β∂β′ ∂L∂LE ∂β∂β′ Estimate both matrices, summation <strong>of</strong> the ma<strong>in</strong>diagnonal elements yields the ((p+1)×1) vectordˆM= i = 1( y i− πˆ)( 1 − 2 ˆ π i) z ii<strong>with</strong>z = (1, x , x )i2i1,2iptTest:IM =1 t −1Mdˆis χ 2 -distributed <strong>with</strong> (p+1) dfandVˆ* t * * t * −1* t *[ Z ( I − X ( X X ) X ) Z ]ˆ 1V = ,M*X = ˆ πi( 1−ˆ πi)X ,Zˆ( 1−ˆ π )(1− 2 ˆ π Z*= πi ii) ,dˆZ as the matrix <strong>with</strong> the zi as rows.O.Kuss, <strong>Global</strong> <strong>Goodness</strong>-<strong>of</strong>-<strong>Fit</strong> <strong>Tests</strong> <strong>in</strong> <strong>Logistic</strong> <strong>Regression</strong> <strong>with</strong> <strong>Sparse</strong> <strong>Data</strong>, 2.11.02
- R C (Copas, 1986, Hosmer et al., 1997)RC=M( yi− m ˆiπi)i=1Summation <strong>of</strong> the raw Pearson residualsAsymptotical moments:VarRˆCM−i=1ˆ πEt<strong>with</strong> Q X ( X ) t WX XiR CM− ˆ πii=12( 1−ˆ π ) = 0it( 1−ˆ π ) = ( 1−2 ˆ π ) ( Wˆ−WQWˆ ˆ ˆ ) ( 1−2 ˆ π )i−1= ˆ , Wˆdiag( m iˆ π (1 ˆi−πi))= .Test:ZCRC−=VarRC−Mi=1Mi=1ˆ πiˆ π( 1−ˆ π )ii( 1−ˆ π )is standard normal under the hypothesisi1/ 2O.Kuss, <strong>Global</strong> <strong>Goodness</strong>-<strong>of</strong>-<strong>Fit</strong> <strong>Tests</strong> <strong>in</strong> <strong>Logistic</strong> <strong>Regression</strong> <strong>with</strong> <strong>Sparse</strong> <strong>Data</strong>, 2.11.02
Example:Occupational hand eczema <strong>in</strong> haidresser apprentices,M=574 (340 „successes“),Several covariates (p=6): genetical disposition, workhazards, confounders,N=334,Distribution <strong>of</strong> the m i :m i Frequency1 205 (61%)2 68 (20%)3 35 (11%)>3 26 (8%)Assess<strong>in</strong>g goodness-<strong>of</strong>-fit:p-valueX 2 0,053D 0,012X 2 O 0,044X 2 M 0,031HL-Test 0,451X 2 F 0,408IM-Test 0,365R C 0,062Who is right???O.Kuss, <strong>Global</strong> <strong>Goodness</strong>-<strong>of</strong>-<strong>Fit</strong> <strong>Tests</strong> <strong>in</strong> <strong>Logistic</strong> <strong>Regression</strong> <strong>with</strong> <strong>Sparse</strong> <strong>Data</strong>, 2.11.02
5. Which Solution is the Best???Up to now there is only one large, systematic<strong>in</strong>vestigation <strong>of</strong> global goodness-<strong>of</strong>-fit tests <strong>in</strong> logisticregresssion (Hosmer et al., 1997)Results:R C and X 2 M were "w<strong>in</strong>ners"But some need <strong>of</strong> supplement:- Add new tests- Vary<strong>in</strong>g m iO.Kuss, <strong>Global</strong> <strong>Goodness</strong>-<strong>of</strong>-<strong>Fit</strong> <strong>Tests</strong> <strong>in</strong> <strong>Logistic</strong> <strong>Regression</strong> <strong>with</strong> <strong>Sparse</strong> <strong>Data</strong>, 2.11.02
6. Simulation Results6.1. Null hypothesisS<strong>in</strong>gle cont<strong>in</strong>uous covariate x 1 <strong>with</strong> x 1 ∼N(0,1),β 0 =0, β 1 =0,693, M=500, 1000 runs, α=0,05m i ≡1 m i ≡2 m i ≡1-10 m i ≡10X 2 0,000 0,010 0,002 0,046D 1,000 0,977 0,585 0,114X 2 O 0,061 0,043 0,040 0,041X 2 M 0,063 0,052 0,045 0,052HL test 0,055 0,051 0,054 0,052X 2 F 0,000 0,051 0,055 0,062IM test 0,057 0,049 0,045 0,049R C 0,053 0,052 0,046 0,051Three cont<strong>in</strong>uous covariates x i <strong>with</strong> x i iid N(0,1),β 0 =0, β 1 =0.693, β 2 =0.405, β 3 =0.223,M=500, 1000 runs,α=0,05m i ≡1 m i ≡2 m i ≡1-10 m i ≡10X 2 0,000 0,001 0,009 0,043D 1,000 0,959 0,866 0,118X 2 O 0,074 0,039 0,042 0,026X 2 M 0,078 0,052 0,059 0,057HL-Test 0,049 0,049 0,052 0,042X 2 F 0,000 0,052 0,058 0,058IM-Test 0,051 0,049 0,058 0,051R C 0,058 0,046 0,048 0,049O.Kuss, <strong>Global</strong> <strong>Goodness</strong>-<strong>of</strong>-<strong>Fit</strong> <strong>Tests</strong> <strong>in</strong> <strong>Logistic</strong> <strong>Regression</strong> <strong>with</strong> <strong>Sparse</strong> <strong>Data</strong>, 2.11.02
6.2. Alternative hypothesisOverdispersionCont<strong>in</strong>uous covariate x 1 <strong>with</strong> x 1 ∼U(-6,6), β 0 =0,β 1 =0.405,Misspecification: β 0 random, E(β 0 )=0, Var(β 0 )=0.323,M=500, 1000 runs, α=0,05m i ≡1 m i ≡2 m i ≡1-10 M i ≡10X 2 O 0,045 0,211 0,201 0,645X 2 M 0,047 0,230 0,230 0,694HL-Test 0,046 0,052 0,121 0,231X 2 F 0,000 0,232 0,464 0,699IM-Test 0,043 0,040 0,086 0,123R C 0,045 0,053 0,061 0,107Misspecified L<strong>in</strong>k FunctionCont<strong>in</strong>uous covariate x 1 <strong>with</strong> x 1 ∼U(-6,6),Misspecification: log(-log(1-π i ))=0.405x 1M=500, 1000 runs, α=0,05m i ≡1 m i ≡2 m i ≡1-10 M i ≡10X 2 O 0,000 0,001 0,000 0,025X 2 M 0,000 0,001 0,000 0,037HL-Test 0,200 0,197 0,204 0,195X 2 F 0,000 0,067 0,059 0,126IM-Test 0,541 0,545 0,527 0,517R C 0,275 0,277 0,289 0,267O.Kuss, <strong>Global</strong> <strong>Goodness</strong>-<strong>of</strong>-<strong>Fit</strong> <strong>Tests</strong> <strong>in</strong> <strong>Logistic</strong> <strong>Regression</strong> <strong>with</strong> <strong>Sparse</strong> <strong>Data</strong>, 2.11.02
Back to the example:p-Wert p*-WertX 2 0,053 0,391D 0,012 0,033X 2 O 0,044 0,511X 2 M 0,031 0,458HL-Test 0,451 0,299X 2 F 0,408 0,427IM-Test 0,365 0,873R C 0,062 0,734Pearson residuals, hairdresser data(N=334)Pearson residuals6,005,004,003,002,001,000,000 0,2 0,4 0,6 0,8 1Estimated probabilityO.Kuss, <strong>Global</strong> <strong>Goodness</strong>-<strong>of</strong>-<strong>Fit</strong> <strong>Tests</strong> <strong>in</strong> <strong>Logistic</strong> <strong>Regression</strong> <strong>with</strong> <strong>Sparse</strong> <strong>Data</strong>, 2.11.02
7. Conclusion- X 2 and D are no valid goodness-<strong>of</strong>-fit tests <strong>in</strong> logisticregression <strong>with</strong> sparse data.- There are alternatives to this test, even the Hosmer-Lemeshow test can be outperformed, calculation <strong>of</strong>these is straightforward.- However, for extreme sparseness (m i ≡1) and smallsample size the alternative tests have low power→ <strong>Global</strong> goodness-<strong>of</strong>-fit are a valuable tool, but asound analysis <strong>of</strong> lack-<strong>of</strong>-fit should not beconsidered as adequate after calculat<strong>in</strong>g a s<strong>in</strong>glegoodness-<strong>of</strong>-fit statistic.The fundamental dilemma rema<strong>in</strong>s:A non-significant result <strong>of</strong> a goodness-<strong>of</strong>-fit test doesn'ttell you that your model is correct.S<strong>of</strong>tware:SAS/IML macro %GOFLOGITWrite to Oliver.Kuss@mediz<strong>in</strong>.uni-halle.deO.Kuss, <strong>Global</strong> <strong>Goodness</strong>-<strong>of</strong>-<strong>Fit</strong> <strong>Tests</strong> <strong>in</strong> <strong>Logistic</strong> <strong>Regression</strong> <strong>with</strong> <strong>Sparse</strong> <strong>Data</strong>, 2.11.02
8. Literature- Agresti A. Categorical data analysis. John Wiley & Sons, 1990.- Bertol<strong>in</strong>i G et al. One model, several results: the paradox <strong>of</strong> theHosmer-Lemeshow goodness-<strong>of</strong>-fit test for the logistic regressionmodel. J Epidem Biostat, 5:251-253, 2000.- Copas JB. Unweighted Sum <strong>of</strong> Squares Test for Proportions. ApplStatist, 38:71-80, 1989.- Farr<strong>in</strong>gton CP. On Assess<strong>in</strong>g <strong>Goodness</strong> <strong>of</strong> <strong>Fit</strong> <strong>of</strong> GeneralizedL<strong>in</strong>ear Models to <strong>Sparse</strong> <strong>Data</strong>. J R Statist Soc B, 58:349-360, 1996.- Hosmer DW, Lemeshow S. <strong>Goodness</strong> <strong>of</strong> fit tests for the multiplelogistic regression model. Commun Statist - Theor Meth, 9:1043-1069, 1980.- Hosmer DW, Lemeshow S. Applied logistic regression. John Wiley& Sons, 1989.- Hosmer DW, Taber S, Lemeshow S. The Importance <strong>of</strong> Assess<strong>in</strong>gthe <strong>Fit</strong> <strong>of</strong> <strong>Logistic</strong> <strong>Regression</strong> Models: A Case Study. Am J PublicHealth, 81:1630-1635, 1991.- Hosmer DW et al. A comparison <strong>of</strong> goodness-<strong>of</strong>-fit tests for thelogistic regression model. SiM, 16:965-980, 1997.- Lloyd CJ. Statistical Analysis <strong>of</strong> Categorical <strong>Data</strong>. John Wiley &Sons, 1999.- McCullagh P. On the Asymptotic Distribution <strong>of</strong> Pearson´s Statistic<strong>in</strong> L<strong>in</strong>ear Exponential-Family Models. International StatisticalReview, 53:61-67, 1985.- McCullagh P, Nelder JA. Generalized L<strong>in</strong>ear Models. Chapman &Hall, 1989.- Osius G, Rojek D. Normal <strong>Goodness</strong>-<strong>of</strong>-<strong>Fit</strong> <strong>Tests</strong> for Mult<strong>in</strong>omialModels With Large Degrees <strong>of</strong> Freedom. JASA, 87:1145-1152,1992.- Orme C. The calculation <strong>of</strong> the <strong>in</strong>formation matrix test for b<strong>in</strong>arydata models. The Manchester School, 54:370-376, 1988.- Pregibon D. <strong>Goodness</strong> <strong>of</strong> l<strong>in</strong>k tests for generalized l<strong>in</strong>ear models.Applied Statistics, 29:15-24, 1980.- Santner TJ, Duffy DE. The statistical analysis <strong>of</strong> discrete data.Spr<strong>in</strong>ger, 1989.- White H. Maximum Likelihood Estimation <strong>of</strong> Misspecified Models.Econometrica, 50:1-25, 1982.O.Kuss, <strong>Global</strong> <strong>Goodness</strong>-<strong>of</strong>-<strong>Fit</strong> <strong>Tests</strong> <strong>in</strong> <strong>Logistic</strong> <strong>Regression</strong> <strong>with</strong> <strong>Sparse</strong> <strong>Data</strong>, 2.11.02