SUGI 26: A SAS/IML(r) Macro for Goodness-of-Fit Testing in Logistic ...
SUGI 26: A SAS/IML(r) Macro for Goodness-of-Fit Testing in Logistic ...
SUGI 26: A SAS/IML(r) Macro for Goodness-of-Fit Testing in Logistic ...
You also want an ePaper? Increase the reach of your titles
YUMPU automatically turns print PDFs into web optimized ePapers that Google loves.
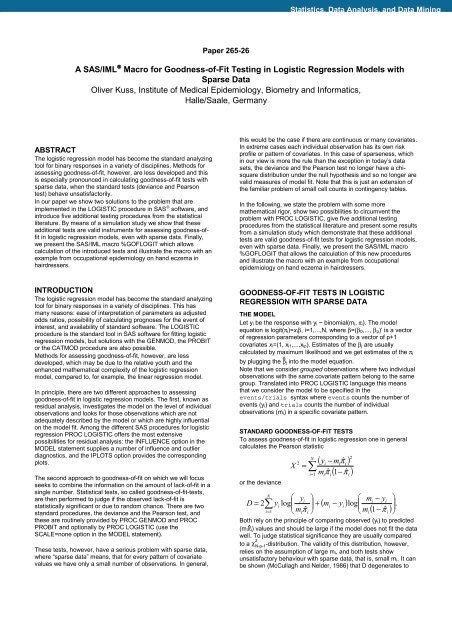
Statistics, Data Analysis, and Data M<strong>in</strong><strong>in</strong>gPaper <strong>26</strong>5-<strong>26</strong>A <strong>SAS</strong>/<strong>IML</strong> ® <strong>Macro</strong> <strong>for</strong> <strong>Goodness</strong>-<strong>of</strong>-<strong>Fit</strong> <strong>Test<strong>in</strong>g</strong> <strong>in</strong> <strong>Logistic</strong> Regression Models withSparse DataOliver Kuss, Institute <strong>of</strong> Medical Epidemiology, Biometry and In<strong>for</strong>matics,Halle/Saale, GermanyABSTRACTThe logistic regression model has become the standard analyz<strong>in</strong>gtool <strong>for</strong> b<strong>in</strong>ary responses <strong>in</strong> a variety <strong>of</strong> discipl<strong>in</strong>es. Methods <strong>for</strong>assess<strong>in</strong>g goodness-<strong>of</strong>-fit, however, are less developed and thisis especially pronounced <strong>in</strong> calculat<strong>in</strong>g goodness-<strong>of</strong>-fit tests withsparse data, when the standard tests (deviance and Pearsontest) behave unsatisfactorily.In our paper we show two solutions to the problem that areimplemented <strong>in</strong> the LOGISTIC procedure <strong>in</strong> <strong>SAS</strong> ® s<strong>of</strong>tware, and<strong>in</strong>troduce five additional test<strong>in</strong>g procedures from the statisticalliterature. By means <strong>of</strong> a simulation study we show that theseadditional tests are valid <strong>in</strong>struments <strong>for</strong> assess<strong>in</strong>g goodness-<strong>of</strong>fit<strong>in</strong> logistic regression models, even with sparse data. F<strong>in</strong>ally,we present the <strong>SAS</strong>/<strong>IML</strong> macro %GOFLOGIT which allowscalculation <strong>of</strong> the <strong>in</strong>troduced tests and illustrate the macro with anexample from occupational epidemiology on hand eczema <strong>in</strong>hairdressers.this would be the case if there are cont<strong>in</strong>uous or many covariates.In extreme cases each <strong>in</strong>dividual observation has its own riskpr<strong>of</strong>ile or pattern <strong>of</strong> covariates. In this case <strong>of</strong> sparseness, which<strong>in</strong> our view is more the rule than the exception <strong>in</strong> today’s datasets, the deviance and the Pearson test no longer have a chisquaredistribution under the null hypothesis and so no longer arevalid measures <strong>of</strong> model fit. Note that this is just an extension <strong>of</strong>the familiar problem <strong>of</strong> small cell counts <strong>in</strong> cont<strong>in</strong>gency tables.In the follow<strong>in</strong>g, we state the problem with some moremathematical rigor, show two possibilities to circumvent theproblem with PROC LOGISTIC, give five additional test<strong>in</strong>gprocedures from the statistical literature and present some resultsfrom a simulation study which demonstrate that these additionaltests are valid goodness-<strong>of</strong>-fit tests <strong>for</strong> logistic regression models,even with sparse data. F<strong>in</strong>ally, we present the <strong>SAS</strong>/<strong>IML</strong> macro%GOFLOGIT that allows the calculation <strong>of</strong> this new proceduresand illustrate the macro with an example from occupationalepidemiology on hand eczema <strong>in</strong> hairdressers.INTRODUCTIONThe logistic regression model has become the standard analyz<strong>in</strong>gtool <strong>for</strong> b<strong>in</strong>ary responses <strong>in</strong> a variety <strong>of</strong> discipl<strong>in</strong>es. This hasmany reasons: ease <strong>of</strong> <strong>in</strong>terpretation <strong>of</strong> parameters as adjustedodds ratios, possibility <strong>of</strong> calculat<strong>in</strong>g prognoses <strong>for</strong> the event <strong>of</strong><strong>in</strong>terest, and availability <strong>of</strong> standard s<strong>of</strong>tware. The LOGISTICprocedure is the standard tool <strong>in</strong> <strong>SAS</strong> s<strong>of</strong>tware <strong>for</strong> fitt<strong>in</strong>g logisticregression models, but solutions with the GENMOD, the PROBITor the CATMOD procedure are also possible.Methods <strong>for</strong> assess<strong>in</strong>g goodness-<strong>of</strong>-fit, however, are lessdeveloped, which may be due to the relative youth and theenhanced mathematical complexity <strong>of</strong> the logistic regressionmodel, compared to, <strong>for</strong> example, the l<strong>in</strong>ear regression model.In pr<strong>in</strong>ciple, there are two different approaches to assess<strong>in</strong>ggoodness-<strong>of</strong>-fit <strong>in</strong> logistic regression models. The first, known asresidual analysis, <strong>in</strong>vestigates the model on the level <strong>of</strong> <strong>in</strong>dividualobservations and looks <strong>for</strong> those observations which are notadequately described by the model or which are highly <strong>in</strong>fluentialon the model fit. Among the different <strong>SAS</strong> procedures <strong>for</strong> logisticregression PROC LOGISTIC <strong>of</strong>fers the most extensivepossibilities <strong>for</strong> residual analysis: the INFLUENCE option <strong>in</strong> theMODEL statement supplies a number <strong>of</strong> <strong>in</strong>fluence and outlierdiagnostics, and the IPLOTS option provides the correspond<strong>in</strong>gplots.The second approach to goodness-<strong>of</strong>-fit on which we will focusseeks to comb<strong>in</strong>e the <strong>in</strong><strong>for</strong>mation on the amount <strong>of</strong> lack-<strong>of</strong>-fit <strong>in</strong> as<strong>in</strong>gle number. Statistical tests, so called goodness-<strong>of</strong>-fit-tests,are then per<strong>for</strong>med to judge if the observed lack-<strong>of</strong>-fit isstatistically significant or due to random chance. There are twostandard procedures, the deviance and the Pearson test, andthese are rout<strong>in</strong>ely provided by PROC GENMOD and PROCPROBIT and optionally by PROC LOGISTIC (use theSCALE=none option <strong>in</strong> the MODEL statement).These tests, however, have a serious problem with sparse data,where “sparse data” means, that <strong>for</strong> every pattern <strong>of</strong> covariatevalues we have only a small number <strong>of</strong> observations. In general,GOODNESS-OF-FIT TESTS IN LOGISTICREGRESSION WITH SPARSE DATATHE MODELLet y i be the response with y i ~ b<strong>in</strong>omial(m i, π i). The modelequation is logit(π i)=x iβ, i=1,...,N, where β=(β 0,..., β p)’ is a vector<strong>of</strong> regression parameters correspond<strong>in</strong>g to a vector <strong>of</strong> p+1covariates x i=(1, x i1,...,x ip). Estimates <strong>of</strong> the β j are usuallycalculated by maximum likelihood and we get estimates <strong>of</strong> the π iby plugg<strong>in</strong>g the ^β j <strong>in</strong>to the model equation.Note that we consider grouped observations where two <strong>in</strong>dividualobservations with the same covariate pattern belong to the samegroup. Translated <strong>in</strong>to PROC LOGISTIC language this meansthat we consider the model to be specified <strong>in</strong> theevents/trials syntax where events counts the number <strong>of</strong>events (y i) and trials counts the number <strong>of</strong> <strong>in</strong>dividualobservations (m i) <strong>in</strong> a specific covariate pattern.STANDARD GOODNESS-OF-FIT TESTSTo assess goodness-<strong>of</strong>-fit <strong>in</strong> logistic regression one <strong>in</strong> generalcalculates the Pearson statisticor the devianceX2=N⎛ y ⎞iD = 2∑y log⎜ +1 ˆ⎟ii ⎝ miπi ⎠N2( yi− m ˆiπi)∑m ˆ π ( 1 ˆ π )i= 1 i i−( m − y )Both rely on the pr<strong>in</strong>ciple <strong>of</strong> compar<strong>in</strong>g observed (y i) to predicted(m i^π i) values and should be large if the model does not fit the datawell. To judge statistical significance they are usually comparedto a χ 2 N-p-1-distribution. The validity <strong>of</strong> this distribution, however,relies on the assumption <strong>of</strong> large m i, and both tests showunsatisfactory behaviour with sparse data, that is, small m i. It canbe shown (McCullagh and Nelder, 1986) that D degenerates toi⎛ m − ylog⎜⎝ mi⎞⎟⎠i i( 1−ˆ π ) ⎟ .i i= i
Statistics, Data Analysis, and Data M<strong>in</strong><strong>in</strong>gOsius, G. and Rojek, D. (1992), “Normal <strong>Goodness</strong>-<strong>of</strong>-<strong>Fit</strong> Tests<strong>for</strong> Mult<strong>in</strong>omial Models With Large Degrees <strong>of</strong> Freedom,” Journal<strong>of</strong> the American Statistical Association, 87, 1145-1152.<strong>SAS</strong> Institute Inc. (1988), <strong>SAS</strong>/<strong>IML</strong> Users’s Guide, Release6.03 Edition, Cary, NC: <strong>SAS</strong> Institute Inc.So, Y. (1993), “A Tutorial on <strong>Logistic</strong> Regression,” Proceed<strong>in</strong>gs <strong>of</strong>the Eighteenth Annual <strong>SAS</strong> Users Group InternationalConference, 18, 1290-1295.White, H. (1982), “Maximum Likelihood Estimation <strong>of</strong>Misspecified Models,” Econometrica, 50, 1-25.CONTACT INFORMATIONThe %GOFLOGIT macro is available on request from the author.Contact him at:Oliver KussInstitute <strong>of</strong> Medical Epidemiology, Biometry and In<strong>for</strong>matics06097 Halle/Saale, GermanyPhone: +49-345-5573582Fax: +49-345-5573580Email:Oliver.Kuss@mediz<strong>in</strong>.uni-halle.deWWW: http://imebmi.mediz<strong>in</strong>.uni-halle.de/5


