taste and smell perception among sewage treatment and landfill ...
taste and smell perception among sewage treatment and landfill ...
taste and smell perception among sewage treatment and landfill ...

You also want an ePaper? Increase the reach of your titles
YUMPU automatically turns print PDFs into web optimized ePapers that Google loves.
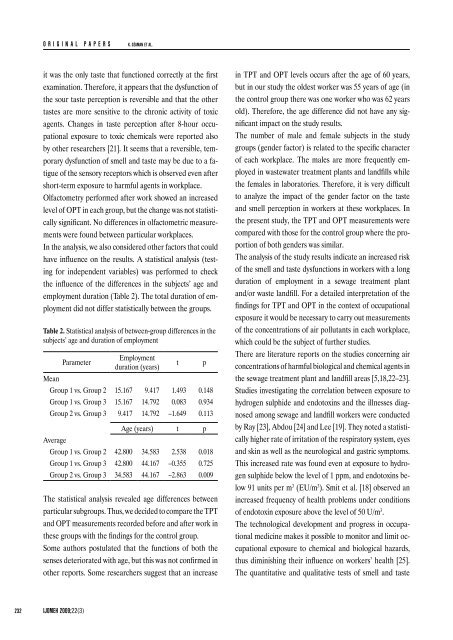
ORIGINAL PAPERSK. DŻAMAN ET AL.it was the only <strong>taste</strong> that functioned correctly at the firstexamination. Therefore, it appears that the dysfunction ofthe sour <strong>taste</strong> <strong>perception</strong> is reversible <strong>and</strong> that the other<strong>taste</strong>s are more sensitive to the chronic activity of toxicagents. Changes in <strong>taste</strong> <strong>perception</strong> after 8-hour occupationalexposure to toxic chemicals were reported alsoby other researchers [21]. It seems that a reversible, temporarydysfunction of <strong>smell</strong> <strong>and</strong> <strong>taste</strong> may be due to a fatigueof the sensory receptors which is observed even aftershort-term exposure to harmful agents in workplace.Olfactometry performed after work showed an increasedlevel of OPT in each group, but the change was not statisticallysignificant. No differences in olfactometric measurementswere found between particular workplaces.In the analysis, we also considered other factors that couldhave influence on the results. A statistical analysis (testingfor independent variables) was performed to checkthe influence of the differences in the subjects’ age <strong>and</strong>employment duration (Table 2). The total duration of employmentdid not differ statistically between the groups.Table 2. Statistical analysis of between-group differences in thesubjects’ age <strong>and</strong> duration of employmentMeanParameterEmploymentduration (years)Group 1 vs. Group 2 15.167 9.417 1.493 0.148Group 1 vs. Group 3 15.167 14.792 0.083 0.934Group 2 vs. Group 3 9.417 14.792 –1.649 0.113AverageAge (years) t pGroup 1 vs. Group 2 42.800 34.583 2.538 0.018Group 1 vs. Group 3 42.800 44.167 –0.355 0.725Group 2 vs. Group 3 34.583 44.167 –2.863 0.009The statistical analysis revealed age differences betweenparticular subgroups. Thus, we decided to compare the TPT<strong>and</strong> OPT measurements recorded before <strong>and</strong> after work inthese groups with the findings for the control group.Some authors postulated that the functions of both thesenses deteriorated with age, but this was not confirmed inother reports. Some researchers suggest that an increasetpin TPT <strong>and</strong> OPT levels occurs after the age of 60 years,but in our study the oldest worker was 55 years of age (inthe control group there was one worker who was 62 yearsold). Therefore, the age difference did not have any significantimpact on the study results.The number of male <strong>and</strong> female subjects in the studygroups (gender factor) is related to the specific characterof each workplace. The males are more frequently employedin wastewater <strong>treatment</strong> plants <strong>and</strong> l<strong>and</strong>fills whilethe females in laboratories. Therefore, it is very difficultto analyze the impact of the gender factor on the <strong>taste</strong><strong>and</strong> <strong>smell</strong> <strong>perception</strong> in workers at these workplaces. Inthe present study, the TPT <strong>and</strong> OPT measurements werecompared with those for the control group where the proportionof both genders was similar.The analysis of the study results indicate an increased riskof the <strong>smell</strong> <strong>and</strong> <strong>taste</strong> dysfunctions in workers with a longduration of employment in a <strong>sewage</strong> <strong>treatment</strong> plant<strong>and</strong>/or waste l<strong>and</strong>fill. For a detailed interpretation of thefindings for TPT <strong>and</strong> OPT in the context of occupationalexposure it would be necessary to carry out measurementsof the concentrations of air pollutants in each workplace,which could be the subject of further studies.There are literature reports on the studies concerning airconcentrations of harmful biological <strong>and</strong> chemical agents inthe <strong>sewage</strong> <strong>treatment</strong> plant <strong>and</strong> l<strong>and</strong>fill areas [5,18,22–23].Studies investigating the correlation between exposure tohydrogen sulphide <strong>and</strong> endotoxins <strong>and</strong> the illnesses diagnosed<strong>among</strong> <strong>sewage</strong> <strong>and</strong> l<strong>and</strong>fill workers were conductedby Ray [23], Abdou [24] <strong>and</strong> Lee [19]. They noted a statisticallyhigher rate of irritation of the respiratory system, eyes<strong>and</strong> skin as well as the neurological <strong>and</strong> gastric symptoms.This increased rate was found even at exposure to hydrogensulphide below the level of 1 ppm, <strong>and</strong> endotoxins below91 units per m 3 (EU/m 3 ). Smit et al. [18] observed anincreased frequency of health problems under conditionsof endotoxin exposure above the level of 50 U/m 3 .The technological development <strong>and</strong> progress in occupationalmedicine makes it possible to monitor <strong>and</strong> limit occupationalexposure to chemical <strong>and</strong> biological hazards,thus diminishing their influence on workers’ health [25].The quantitative <strong>and</strong> qualitative tests of <strong>smell</strong> <strong>and</strong> <strong>taste</strong>232IJOMEH 2009;22(3)