Annexes Annexes - Institute for World Forestry
Annexes Annexes - Institute for World Forestry
Annexes Annexes - Institute for World Forestry

Create successful ePaper yourself
Turn your PDF publications into a flip-book with our unique Google optimized e-Paper software.
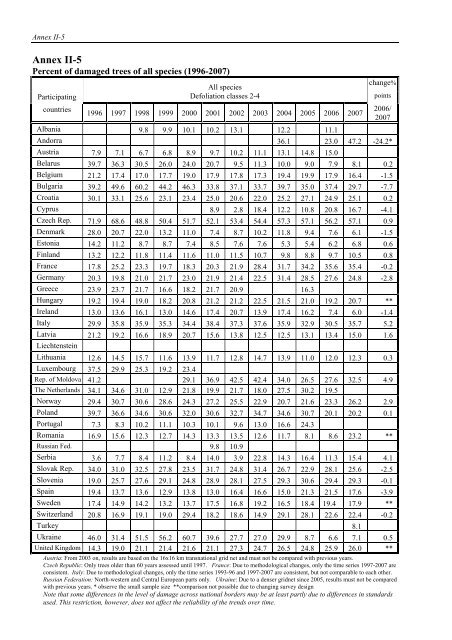
Annex II-5Annex II-5Percent of damaged trees of all species (1996-2007)All specieschange%Participating Defoliation classes 2-4 pointscountries1996 1997 1998 1999 2000 2001 2002 2003 2004 2005 2006 2007Albania 9.8 9.9 10.1 10.2 13.1 12.2 11.12006/2007Andorra 36.1 23.0 47.2 -24.2*Austria 7.9 7.1 6.7 6.8 8.9 9.7 10.2 11.1 13.1 14.8 15.0Belarus 39.7 36.3 30.5 26.0 24.0 20.7 9.5 11.3 10.0 9.0 7.9 8.1 0.2Belgium 21.2 17.4 17.0 17.7 19.0 17.9 17.8 17.3 19.4 19.9 17.9 16.4 -1.5Bulgaria 39.2 49.6 60.2 44.2 46.3 33.8 37.1 33.7 39.7 35.0 37.4 29.7 -7.7Croatia 30.1 33.1 25.6 23.1 23.4 25.0 20.6 22.0 25.2 27.1 24.9 25.1 0.2Cyprus 8.9 2.8 18.4 12.2 10.8 20.8 16.7 -4.1Czech Rep. 71.9 68.6 48.8 50.4 51.7 52.1 53.4 54.4 57.3 57.1 56.2 57.1 0.9Denmark 28.0 20.7 22.0 13.2 11.0 7.4 8.7 10.2 11.8 9.4 7.6 6.1 -1.5Estonia 14.2 11.2 8.7 8.7 7.4 8.5 7.6 7.6 5.3 5.4 6.2 6.8 0.6Finland 13.2 12.2 11.8 11.4 11.6 11.0 11.5 10.7 9.8 8.8 9.7 10.5 0.8France 17.8 25.2 23.3 19.7 18.3 20.3 21.9 28.4 31.7 34.2 35.6 35.4 -0.2Germany 20.3 19.8 21.0 21.7 23.0 21.9 21.4 22.5 31.4 28.5 27.6 24.8 -2.8Greece 23.9 23.7 21.7 16.6 18.2 21.7 20.9 16.3Hungary 19.2 19.4 19.0 18.2 20.8 21.2 21.2 22.5 21.5 21.0 19.2 20.7 **Ireland 13.0 13.6 16.1 13.0 14.6 17.4 20.7 13.9 17.4 16.2 7.4 6.0 -1.4Italy 29.9 35.8 35.9 35.3 34.4 38.4 37.3 37.6 35.9 32.9 30.5 35.7 5.2Latvia 21.2 19.2 16.6 18.9 20.7 15.6 13.8 12.5 12.5 13.1 13.4 15.0 1.6LiechtensteinLithuania 12.6 14.5 15.7 11.6 13.9 11.7 12.8 14.7 13.9 11.0 12.0 12.3 0.3Luxembourg 37.5 29.9 25.3 19.2 23.4Rep. of Moldova 41.2 29.1 36.9 42.5 42.4 34.0 26.5 27.6 32.5 4.9The Netherlands 34.1 34.6 31.0 12.9 21.8 19.9 21.7 18.0 27.5 30.2 19.5Norway 29.4 30.7 30.6 28.6 24.3 27.2 25.5 22.9 20.7 21.6 23.3 26.2 2.9Poland 39.7 36.6 34.6 30.6 32.0 30.6 32.7 34.7 34.6 30.7 20.1 20.2 0.1Portugal 7.3 8.3 10.2 11.1 10.3 10.1 9.6 13.0 16.6 24.3Romania 16.9 15.6 12.3 12.7 14.3 13.3 13.5 12.6 11.7 8.1 8.6 23.2 **Russian Fed. 9.8 10.9Serbia 3.6 7.7 8.4 11.2 8.4 14.0 3.9 22.8 14.3 16.4 11.3 15.4 4.1Slovak Rep. 34.0 31.0 32.5 27.8 23.5 31.7 24.8 31.4 26.7 22.9 28.1 25.6 -2.5Slovenia 19.0 25.7 27.6 29.1 24.8 28.9 28.1 27.5 29.3 30.6 29.4 29.3 -0.1Spain 19.4 13.7 13.6 12.9 13.8 13.0 16.4 16.6 15.0 21.3 21.5 17.6 -3.9Sweden 17.4 14.9 14.2 13.2 13.7 17.5 16.8 19.2 16.5 18.4 19.4 17.9 **Switzerland 20.8 16.9 19.1 19.0 29.4 18.2 18.6 14.9 29.1 28.1 22.6 22.4 -0.2Turkey 8.1Ukraine 46.0 31.4 51.5 56.2 60.7 39.6 27.7 27.0 29.9 8.7 6.6 7.1 0.5United Kingdom 14.3 19.0 21.1 21.4 21.6 21.1 27.3 24.7 26.5 24.8 25.9 26.0 **Austria: From 2003 on, results are based on the 16x16 km transnational grid net and must not be compared with previous years.Czech Republic: Only trees older than 60 years assessed until 1997. France: Due to methodological changes, only the time series 1997-2007 areconsistent. Italy: Due to methodological changes, only the time series 1993-96 and 1997-2007 are consistent, but not comparable to each other.Russian Federation: North-western and Central European parts only. Ukraine: Due to a denser gridnet since 2005, results must not be comparedwith previous years. * observe the small sample size **comparison not possible due to changing survey designNote that some differences in the level of damage across national borders may be at least partly due to differences in standardsused. This restriction, however, does not affect the reliability of the trends over time.