Annexes Annexes - Institute for World Forestry
Annexes Annexes - Institute for World Forestry
Annexes Annexes - Institute for World Forestry

Create successful ePaper yourself
Turn your PDF publications into a flip-book with our unique Google optimized e-Paper software.
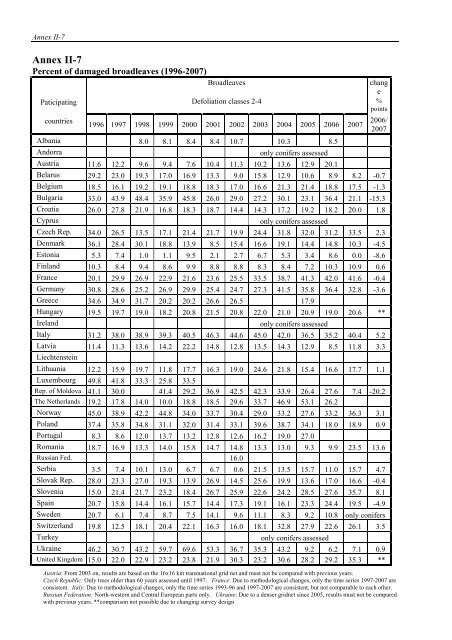
Annex II-7Annex II-7Percent of damaged broadleaves (1996-2007)BroadleaveschangePaticipating Defoliation classes 2-4 %pointscountries1996 1997 1998 1999 2000 2001 2002 2003 2004 2005 2006 2007Albania 8.0 8.1 8.4 8.4 10.7 10.3 8.5Andorraonly conifers assessedAustria 11.6 12.2 9.6 9.4 7.6 10.4 11.3 10.2 13.6 12.9 20.1Belarus 29.2 23.0 19.3 17.0 16.9 13.3 9.0 15.8 12.9 10.6 8.9 8.2 -0.7Belgium 18.5 16.1 19.2 19.1 18.8 18.3 17.0 16.6 21.3 21.4 18.8 17.5 -1.3Bulgaria 33.0 43.9 48.4 35.9 45.8 26.0 29.0 27.2 30.1 23.1 36.4 21.1 -15.3Croatia 26.0 27.8 21.9 16.8 18.3 18.7 14.4 14.3 17.2 19.2 18.2 20.0 1.8Cyprusonly conifers assessedCzech Rep. 34.0 26.5 13.5 17.1 21.4 21.7 19.9 24.4 31.8 32.0 31.2 33.5 2.3Denmark 36.1 28.4 30.1 18.8 13.9 8.5 15.4 16.6 19.1 14.4 14.8 10.3 -4.5Estonia 5.3 7.4 1.0 1.1 9.5 2.1 2.7 6.7 5.3 3.4 8.6 0.0 -8.6Finland 10.3 8.4 9.4 8.6 9.9 8.8 8.8 8.3 8.4 7.2 10.3 10.9 0.6France 20.1 29.9 26.9 22.9 21.6 23.6 25.5 33.5 38.7 41.3 42.0 41.6 -0.4Germany 30.8 28.6 25.2 26.9 29.9 25.4 24.7 27.3 41.5 35.8 36.4 32.8 -3.6Greece 34.6 34.9 31.7 20.2 20.2 26.6 26.5 17.9Hungary 19.5 19.7 19.0 18.2 20.8 21.5 20.8 22.0 21.0 20.9 19.0 20.6 **Irelandonly conifers assessedItaly 31.2 38.0 38.9 39.3 40.5 46.3 44.6 45.0 42.0 36.5 35.2 40.4 5.2Latvia 11.4 11.3 13.6 14.2 22.2 14.8 12.8 13.5 14.3 12.9 8.5 11.8 3.3LiechtensteinLithuania 12.2 15.9 19.7 11.8 17.7 16.3 19.0 24.6 21.8 15.4 16.6 17.7 1.1Luxembourg 49.8 41.8 33.3 25.8 33.5Rep. of Moldova 41.1 30.0 41.4 29.2 36.9 42.5 42.3 33.9 26.4 27.6 7.4 -20.2The Netherlands 19.2 17.8 14.0 10.0 18.8 18.5 29.6 33.7 46.9 53.1 26.2Norway 45.0 38.9 42.2 44.8 34.0 33.7 30.4 29.0 33.2 27.6 33.2 36.3 3.1Poland 37.4 35.8 34.8 31.1 32.0 31.4 33.1 39.6 38.7 34.1 18.0 18.9 0.9Portugal 8.3 8.6 12.0 13.7 13.2 12.8 12.6 16.2 19.0 27.0Romania 18.7 16.9 13.3 14.0 15.8 14.7 14.8 13.3 13.0 9.3 9.9 23.5 13.6Russian Fed. 16.0Serbia 3.5 7.4 10.1 13.0 6.7 6.7 0.6 21.5 13.5 15.7 11.0 15.7 4.7Slovak Rep. 28.0 23.3 27.0 19.3 13.9 26.9 14.5 25.6 19.9 13.6 17.0 16.6 -0.4Slovenia 15.0 21.4 21.7 23.2 18.4 26.7 25.9 22.6 24.2 28.5 27.6 35.7 8.1Spain 20.7 15.8 14.4 16.1 15.7 14.4 17.3 19.1 16.1 23.3 24.4 19.5 -4.9Sweden 20.7 6.1 7.4 8.7 7.5 14.1 9.6 11.1 8.3 9.2 10.8 only conifersSwitzerland 19.8 12.5 18.1 20.4 22.1 16.3 16.0 18.1 32.8 27.9 22.6 26.1 3.5Turkeyonly conifers assessedUkraine 46.2 30.7 43.2 59.7 69.6 53.3 36.7 35.3 43.2 9.2 6.2 7.1 0.9United Kingdom 15.0 22.0 22.9 23.2 23.8 21.9 30.3 23.2 30.6 28.2 29.2 35.3 **2006/2007Austria: From 2003 on, results are based on the 16x16 km transnational grid net and must not be compared with previous years.Czech Republic: Only trees older than 60 years assessed until 1997. France: Due to methodological changes, only the time series 1997-2007 areconsistent. Italy: Due to methodological changes, only the time series 1993-96 and 1997-2007 are consistent, but not comparable to each other.Russian Federation: North-western and Central European parts only. Ukraine: Due to a denser gridnet since 2005, results must not be comparedwith previous years. **comparison not possible due to changing survey design