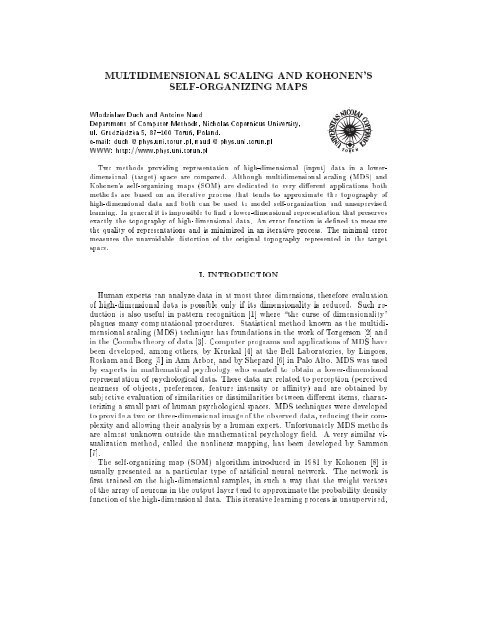
multidimensional scaling and kohonen's self-organizing maps
multidimensional scaling and kohonen's self-organizing maps
multidimensional scaling and kohonen's self-organizing maps

Create successful ePaper yourself
Turn your PDF publications into a flip-book with our unique Google optimized e-Paper software.
MULTIDIMENSIONAL SCALING AND KOHONEN'SSELF-ORGANIZING MAPSW lodzis law Duch <strong>and</strong> Antoine NaudDepartment of Computer Methods, Nicholas Copernicus University,ul. Grudziadzka 5, 87{100 Torun, Pol<strong>and</strong>.e-mail: duch @ phys.uni.torun.pl, naud @ phys.uni.torun.plWWW: http://www.phys.uni.torun.plTwo methods providing representation of high-dimensional (input) data in a lowerdimensional(target) space are compared. Although <strong>multidimensional</strong> <strong>scaling</strong> (MDS) <strong>and</strong>Kohonen's <strong>self</strong>-<strong>organizing</strong> <strong>maps</strong> (SOM) are dedicated to very dierent applications bothmethods are based on an iterative process that tends to approximate the topography ofhigh-dimensional data <strong>and</strong> both can be used to model <strong>self</strong>-organization <strong>and</strong> unsupervisedlearning. In general it is impossible to nd a lower-dimensional representation that preservesexactly the topography of high-dimensional data. An error function is dened to measurethe quality of representations <strong>and</strong> is minimized in an iterative process. The minimal errormeasures the unavoidable distortion of the original topography represented in the targetspace.I. INTRODUCTIONHuman experts can analyze data in at most three dimensions, therefore evaluationof high-dimensional data is possible only if its dimensionality is reduced. Such reductionis also useful in pattern recognition [1] where \the curse of dimensionality"plagues many computational procedures. Statistical method known as the <strong>multidimensional</strong><strong>scaling</strong> (MDS) technique has foundations in the workofTorgerson [2] <strong>and</strong>in the Coombs theory of data [3]. Computer programs <strong>and</strong> applications of MDS havebeen developed, among others, by Kruskal [4] at the Bell Laboratories, by Lingoes,Roskam <strong>and</strong> Borg [5] in Ann Arbor, <strong>and</strong> by Shepard [6] in Palo Alto. MDS was usedby experts in mathematical psychology who wanted to obtain a lower-dimensionalrepresentation of psychological data. These data are related to perception (perceivednearness of objects, preferences, feature intensity oranity) <strong>and</strong> are obtained bysubjective evaluation of similarities or dissimilarities between dierent items, characterizinga small part of human psychological spaces. MDS techniques were developedto provide a two or three-dimensional image of the observed data, reducing their complexity<strong>and</strong> allowing their analysis by ahuman expert. Unfortunately MDS methodsare almost unknown outside the mathematical psychology eld. A very similar visualizationmethod, called the nonlinear mapping, has been developed by Sammon[7].The <strong>self</strong>-<strong>organizing</strong> map (SOM) algorithm introduced in 1981 by Kohonen [8] isusually presented as a particular type of articial neural network. The network isrst trained on the high-dimensional samples, in such away that the weight vectorsof the array of neurons in the output layer tend to approximate the probability densityfunction of the high-dimensional data. This iterative learning process is unsupervised,
Only the neurons within the neighborhood h ci (t) are moved near to X(t). Thelearning rate (t) 2 [0 1] decreases monotonically with time, (t) <strong>and</strong>r(t) are neighborhoodradiuses decreasing also monotonically. Although one-dimensional Kohonen<strong>maps</strong> have been analyzed in some details little is known about the <strong>self</strong>-organizationprocess in two or three dimensions [9]. The main problem is the lack ofquantitativemeasure to determine what exactly \the good map" is.III. MULTIDIMENSIONAL SCALINGMDS techniques emerged from the need to visualize in a two- or three-dimensionalspace high dimensional objects described by some measure of their similarities ordissimilarities. The problem is to nd the coordinates of points representing themultivariate items in the two or three-dimensional space in such a manner that thelow-dimensional interpoint distances correspond to the dissimilarities of the originalobjects. MDS takes as input a symmetric matrix of the similarities or dissimilaritiesbetween objects, whereas SOM needs absolute coordinates of these objects in thehigh-dimensional space. Note that for the MDS input space does not even need to bea metric space. If a given observation concerns n objects there are n(n;1)=2 distancesbetween these objects. SOM algorithm in the same case needs n N input values,where N is the dimension of the input vectors. If the number of objects n>2N +1Kohonen map uses more information than MDS.Let n be the number of observed objects in the high-dimensional input spaceX 1 X 2 ::: X n , <strong>and</strong> let ij be the observed similarities between objects X i , equivalentto distances ij = kX i ; X j k in metric spaces. Let Y i be the low dimensionaltarget space point representing the input object X i <strong>and</strong> let d ij be the distance betweenY i <strong>and</strong> Y j .Wehave to place the points fY i i=1 ::: ng in the target space insuch away that the distances d ij are as close as possible to the original distances ij .A sum-of-squared error function can be used as a criterion to decide whether a givenconguration of image points is better than another. There are two commonly usedcriterion:- Kruskal's stress: S =sPi>jP(ij ;dij )2i>j 2 ij- Lingoes' alienation coefficient: K =r1; (ijdij )2Pi>jPd 2 ijThe best conguration is found iteratively:0. Dene a starting conguration for the points Y i r<strong>and</strong>omly or by a principalcomponents analysis,While the criterion function signicantly decreases, do:1. Compute the distances d ij .2. Compute the value of the criterion functions S <strong>and</strong> K.3. Find a new conguration of the points Y i by a gradient-descent procedure suchas Kruskal's linear regression or Guttman's rank-image permutation.Looking for quantitative measures of the preservation of topography between thehigh-dimensional input <strong>and</strong> low-dimensional target spaces Duch [11] has introducedthe stress-like measure D 1 = S <strong>and</strong> its quadratic version:
D 2 (Y ) =nXi>j 2 ij ;kXl=1y (l)i! 22; y (l)jwhere y (l)iare components of Y i objects in the k-dimensional target space <strong>and</strong> thereduction in the number of the degrees of freedom going from N dimensions to kdimensions is taken into account by setting all components of Y 0 =0<strong>and</strong>k ; 1 componentsof Y 1 to zero, y (l)1=0l=1::k ; 1. For this measure we may obtain the bestrepresentation by solving a set of non-linear equations [11] instead of minimization:nXj6=iy (m)i 3 Xn ; y (m)j + y (m)ij6=i; y (m)j kXl6=my (l)i 2; y (l)j ;nXj6=i 2 ijy (m)i; y (m)j=0Unfortunately it is as hard to solve this system of nonlinear equations as it is tominimize the stress function.IV. COMPUTATIONAL RESULTSMinimization in MDS is usually done via gradient procedure. Since we are lookingfor a global minimum we have used simulated annealing method for minimization.We have applied SOM <strong>and</strong> MDS algorithms to a number of cases in which the qualityof <strong>maps</strong> could be assessed easily. Due to the lack ofspacewe will present onlytwocases: the data related to semantic <strong>maps</strong> about animals <strong>and</strong> a series of hypercubesin 3-5 dimensions, with cube corners represented in two-dimensional target space.Congurations of points obtained from SOM <strong>and</strong> MDS are compared in gures below.9HORSE876543DUCK21COWDOVELIONTIGERHENCATWOLFDOGFOXEAGLEGOOSE0OWL0 1 2 3 4 5 6 7 8 9GOOSEDUCKDOVEHAWK OWLHENEAGLECATFOXDOGTIGER LIONFIG. 1. The two-dimensional representations of the 13-dimensional semantic data obtainedby SOM (left) with a 10 x 10 neurons map, a training of 10000 cycles, with nalstress of 0.25, <strong>and</strong> the MDS (right) with nal stress of 0.20 after 10 iterations.COWHORSEZEBRAWOLF
56738874436511 22FIG. 2. The two-dimensional representations of the 8 points of the 3D cube obtained bySOM (left) with a 20 x 20 neuron map, a training of 10000 cycles, a nal quantization errorof 0.001 <strong>and</strong> stress 0.321, MDS (right) has the nal stress value 0.246 after 22 iterations.135 10 141613614129191 2154105124 31111328168 7 157 6FIG. 3. The two-dimensional representations of the 16 points of the 4D hypercube obtainedby SOM (left) with a 20 x 20 neurons map, a training of 10000 cycles, quantizationerror of 0.001, stress value 0.327, MDS (right) has the nal stress of 0.312 after 18 iterations.292526 3031 16 322826182231 2719233 7913101415 12112730101426151152118226 27 317 1 4 82419232029 25 17 211391 528321216242084FIG. 4. The two-dimensional representations of the 32 points of the 5D hypercube obtainedby SOM (left) with a 20 x 20 neurons map, a training of 10000 cycles, the stress valueof 0.353 <strong>and</strong> by MDS (right) with a nal stress of 0.333 after 18 iterations.In gures 2-4 all corners of the hypercube that are adjacent toeach other areconnected by lines. All these lines should be short but SOM tries to use all neurons
<strong>and</strong> places many codebook vectors at the boarders, missing the best conguration evenin the 3D case. Perhaps with innitely slow learning (i.e. decreasing the neighborhoodfunction h ci (t) to zero innitely slowly) it would be possible to avoid \freezing" wrongcongurations - 10000 iterations were not sucient to obtain global minimum of thestress function.V. SUMMARY AND CONCLUSIONSTheoretical considerations as well as computational experience shows that MDS isa better approach for visualization of <strong>multidimensional</strong> data than SOM. Multidimensional<strong>scaling</strong> provides a well dened measure of the quality of <strong>maps</strong>, a measure thatmay also be used to compare the quality of dierent Kohonen <strong>maps</strong>. Computationaldem<strong>and</strong>s of the two methods in the learning phase are similar.It is possible to modify the original Kohonen SOM algorithm to take into accountminimization of stress measure. MDS may also be useful in initialization of large SOM<strong>maps</strong> used for classication since minimization of stress adding one additional objectis more computationally dem<strong>and</strong>ing than calculation of output from the Kohonenlayer. Introducing the coordinate mesh in the MDS target space <strong>and</strong> the codebookvectors in each node of this mesh one obtains a combination of the LVQ <strong>and</strong> MDSmethods useful not only in visualization <strong>and</strong> classication but also in approximationproblems (W. Duch <strong>and</strong> A. Naud, work in progress)Acknowledgments Support by the Polish Committee for Scientic Research,grant 8T11F 00308, is gratefully acknowledged.[1] R.O. Duda, P.E. Hart, Pattern classication <strong>and</strong> scene analysis. (Menlo Park, Cal.: J.Wiley 1973)[2] W.S. Torgerson, Multidimensional <strong>scaling</strong>. I. Theory <strong>and</strong> method. Psychometrika, 17(1952) 401-419[3] C.H. Coombs, A theory of data. (New York: J. Wiley 1964)[4] J.B. Kruskal, Nonmetric <strong>multidimensional</strong> <strong>scaling</strong>: a numerical method. Psychometrika29 (1964) 115-129.[5] J.C. Lingoes, E.E. Roskam, I. Borg (Eds.), Geometric representation of relational data.(Ann Arbor: Mathesis Press 1979).[6] R.N. Shepard, The analysis of proximities: <strong>multidimensional</strong> <strong>scaling</strong> with an unknowndistance function. Psychometrika 27 (1962) 125-140.[7] J.W. Sammon Jr., A nonlinear mapping for data structure analysis. IEEE Transactionson Computers C-18 (1969) 401-409.[8] T. Kohonen, The <strong>self</strong>-<strong>organizing</strong> map. Proceedings of the IEEE 78 (1990) 1464-1480.[9] T. Kohonen, Self-<strong>organizing</strong> <strong>maps</strong>. (Heidelberg Berlin, Springer-Verlag 1995).[10] Zupan Jure, Gasteiger Johann, Neural networks for chemists: an introduction (VCH,Weinheim, Germany 1993)[11] W. Duch, Quantitative measures for the <strong>self</strong>-organized topographical mapping. OpenSystems <strong>and</strong> Information Dynamics 2 (1995) 295-302