Business Update, March 1, 2010 - Haynes International, Inc.
Business Update, March 1, 2010 - Haynes International, Inc.
Business Update, March 1, 2010 - Haynes International, Inc.

You also want an ePaper? Increase the reach of your titles
YUMPU automatically turns print PDFs into web optimized ePapers that Google loves.
<strong>Haynes</strong> <strong>International</strong>, <strong>Inc</strong>.Mark ComerfordPresident andChief Executive OfficerMarcel MartinVice President andChief Financial OfficerStacy S. KnapperVice President andGeneral Counsel<strong>March</strong> 1, <strong>2010</strong> 2
OverviewLeader in niche market for high-performance alloys◦ Small, highly technical market place◦ Attractive end markets and geographic diversityOutstanding technical expertise◦ Six new high-performance alloys invented since FY2000◦ Unique focus on R&D and new alloy development◦ Collaborative approach to customer serviceUnique business model, emphasizing customer service◦ Distribution model◦ Value-added processing◦ Long-term customer retention<strong>March</strong> 1, <strong>2010</strong> 3
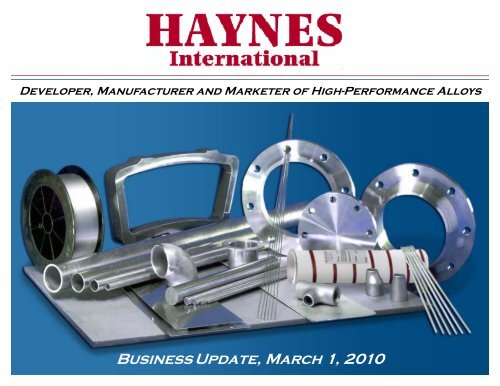
Our products We are a leading, world-wide developer, manufacturer and marketer of highperformancenickel- and cobalt-based alloys used in corrosion and hightemperatureapplications. Revenue by Alloy ApplicationApplication FY2007 FY2008 FY2009HTA 69% 73% 74%CRA 31% 27% 26% Product forms:◦ Sheet (50% of Revenue in FY09)◦ Plate (20% of Revenue in FY09)◦ Forgings◦ Billet◦ Bar◦ Wire◦ Tube<strong>March</strong> 1, <strong>2010</strong>5
Unique business model fosters strong customer retentionFY2009 Net Sales by route to market¹Mill Direct &Service Center Sales 82%1<strong>Inc</strong>ludes sales to distributorsDistribution & SalesAgents 18%Our service centers allow customers tooutsource non-core activities◦ Working capital management◦ Material processing/cuttingThese service centers are critical to our strategy◦ Cultivate closer customer relationships◦ <strong>Inc</strong>rease value-added capabilities (e.g. laser andwater cutting, etc.)◦ Faster response times◦ Facilitate MRO business◦ Create barriers to entry<strong>March</strong> 1, <strong>2010</strong> 6
Exposure to diverse set of markets worldwideGeographic diversity of sales offsets risk of regional downturns◦ Approximately 41% of net revenues are to customers outside of the U.S.◦ <strong>International</strong> sales / growth through strategic positioning of service and sales centersFY2009 net revenues of $438.6 million generated from diverse marketsNet Revenues by RegionNet Revenues by End MarketChina9%Europe26%Other16%Land-based GasUnited StatesTurbines22%59% ChemicalProcessing25%Aerospace37%Other reflects 3% of non-product revenue.<strong>March</strong> 1, <strong>2010</strong> 7
Global presence facilitates superior customer serviceOur locations are well positioned to supply value-added services to both existing andemerging areas of growth◦ Only high-performance alloy manufacturer operating its own service centers with locations in NorthAmerica, Europe and AsiaNorth AmericaOur Facility LocationsEuropeProduction facilitiesKokomo, IndianaService and/or Sales CentersArcadia, LouisianaOpenshaw, EnglandMountain Home, North Carolina Cedex, FranceZurich, SwitzerlandMilan, ItalyOpenshawLebanon &CedexKokomo, INWindsor, CTLa Mirada, CAMountain Home, NCHouston, TX Arcadia, LA.ZurichMilanShanghaiService and/or Sales CentersLebanon, IndianaWindsor, ConnecticutHouston, TexasLa Mirada, CaliforniaChennaiSingaporeAsiaService and/or Sales CentersShanghai, ChinaSingaporeChennai, India<strong>March</strong> 1, <strong>2010</strong> 8
AerospaceCommercial build rates are the primary driver ofOEM demandMRO market provides a base of business which isincreasingiShort-term disruptions◦ Recession◦ Push outs of 787 and A380◦ Effect of global downturn on passenger miles◦ Viability bl of new international airlinesLong-term positive dynamics<strong>Haynes</strong> Annual Revenue and Pounds ShippedCommercial Aircraft Engines in Service$300$200$100$0211.27.7247.3Revenue8.9160.005.9Pounds49.71.728.41.2FY07 FY08 FY09 3mos FY09 3mos FY1020151050Engines in service60,00050,00040,00030,00020,00010,0002009 <strong>2010</strong> 2011 2012 2013 2014 2015 2016 2017Source: FY2009 Form 10-K; FY<strong>2010</strong> First Quarter Form 10-QSource: Airline Monitor – February <strong>2010</strong><strong>March</strong> 1, <strong>2010</strong> 9
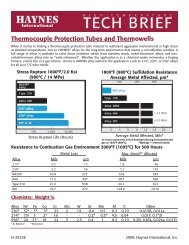
Chemical processing applications and alloysHASTELLOY ® G-30 andG-35 ® alloys forphosphoric acidevaporatorsHASTELLOY ® C-22 ®alloy for centrifugepharmaceuticalprocessingHASTELLOY ® C-2000 ®alloy reactor forpharmaceuticalprocessingHASTELLOY ® B-3 ®and C-276 alloys inacetic acid plant<strong>March</strong> 1, <strong>2010</strong> 12
Land-based gas turbineEmerging markets are fueling demand for increased powergenerationClean air regulations and power demand should spur newbuildsGrowth in microturbines as back-up sources for powergenerationUsed in hospitals, shopping malls, apartments, office buildings,schools, etc.<strong>Inc</strong>reased number of LBGTs use and utilization rates for thoseunits drive MRO businessShort-term uncertainty exists which may affect volume thisyear and possibly next year<strong>Haynes</strong> Annual Revenue and Pounds ShippedNew LBGT BuildsRevenuePoundsMW >125 MW 50-125 MW
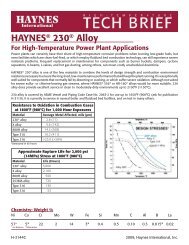
Land-based gas turbine applications and alloysHAYNES ® HR-120 ® and 230 ®alloys for micro-turbinesHAYNES ® 263 alloytransition section forhot gas pathHAYNES ® 230 ® alloy hot gas casingHASTELLOY ® X alloy combustor can<strong>March</strong> 1, <strong>2010</strong> 14
Leader in developing and applying alloys to new applicationsCompetitive AdvantageIndustry leader in developing new high-performance alloys◦ Six new alloys in last ten years – all are patented orpatent-pendingCompany currently has 6 new alloys under developmentNew applications represent significant futurecommercial potential◦ Solar power◦ Fuel cells◦ Automotive diesel turbo-chargers◦ Aerospace/power generation◦ Pharmaceutical◦ Ultra supercritical boilers◦ Nuclear<strong>March</strong> 1, <strong>2010</strong> 15
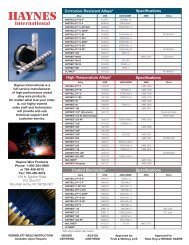
Emerging technologies: applications and alloysHAYNES® 230® alloy selected forsolar power technologies:Molten salt central receiver on leftand Stirling engine generator onright.HAYNES ® 230 ® and 625 alloysselected for solid oxide fuelcell systems above.HAYNES ® 282® alloy is a leading candidate for boilerand steam turbine components in advancedultrasupercritical coal fired power plants above.<strong>March</strong> 1, <strong>2010</strong>16
Financial Overview and Strategy Disciplined growth strategy Significant operating improvements since FY2005 Capital improvements yield substantial benefits Maintain financial strength and flexibility<strong>March</strong> 1, <strong>2010</strong> 18
Financial highlights$ IN MILLIONS FY2007 FY2008 FY2009FY<strong>2010</strong>3 Mos.NET REVENUES $559.8 $637.0 $438.6 $81.0% change from prior year28.9% 13.8% (31.1%) (39.7%)OP. INCOME (LOSS)% change from prior year$108.564.7%$98.9(8.8)%$(60.6) (1)(161.2)%$(2.0)(127.1)%NET INCOME (LOSS) PER DILUTEDSHARE (EPS)% change from prior year$5.8970.3%$5.22(11.4)%$(4.36) (1)(2)(183.5)%$(0.11)(128.9)%CASH FROM OPERATIONS $4.6 $41.3 $120.0 $(0.1)Source: FY2009 Form 10-K; FY<strong>2010</strong> First Quarter Form 10-Q1) <strong>Inc</strong>ludes goodwill write-off of $43.7 million recorded in the second quarter of fiscal 2009.2) Diluted income (loss) EPS excluding the goodwill write-off was $(0.78) per share. Please seeAppendix A for a reconciliation of the differences between this non-GAAP financial measureand the directly comparable financial measure calculated and presented in accordance withGAAP.<strong>March</strong> 1, <strong>2010</strong> 19
Profitability Compression on pricing and volumes has affected profitability◦ Competitive economic environment◦ Reduced absorption of manufacturing costs due to lower volumes Cost cutting measures in FY2009 to adjust to current operating levels◦ 17.5% staffing reductions◦ Specific cost reduction projects throughout operations<strong>March</strong> 1, <strong>2010</strong> 20
Gross Profit Margins30252015 Bus Cycle Decline(2) 1050RestructuringRecessionFY FY FY FY FY FY FY (1) FY FY FY FY FY FY1998 1999 2000 2001 2002 2003 2004 2005 2006 2007 2008 2009 <strong>2010</strong>Gross Profit Margin1) As of August 31, 2004, the effective date of the Company's plan of reorganization under Chapter 11 of the U.S. Bankruptcy Code, theCompany adopted fresh start reporting for its financial statements. Because of the emergence from bankruptcy and adoption of freshstart reporting, the historical financial information for periods after August 31, 2004 is not comparable to periods before September1, 2004. This information was derived from and should be read in conjunction with the “Pro Forma Financial Information” and footnotesthereto included in Item 7 of the Company's Form 10-K for the fiscal year-ended September 30, 2005.2) Gross profit percent excluding “fresh start” inventory charges of $25.4 million.<strong>March</strong> 1, <strong>2010</strong> 21
BacklogBacklog300DollarsPounds10.0lions)Backlog ($ mill$250200150100509.08.07.06.05.04.03.02.01.0s)Pounds (0000Sep-03 Mar-04 Sep-04 Mar-05 Sep-05 Mar-06 Sep-06 Mar-07 Sep-07 Dec-07 Mar-08 Jun-08 Sep-08 Dec-08 Mar-09 Jun-09 Sep-09 Dec-090.0Through FY2009 pricing and volume were down in all our primary markets: aerospace, land-based gasturbines and chemical processingStarting in FY<strong>2010</strong> improving order entry contributed to a slight improvement in backlogImprovements in backlog will ultimately be reflected in high quarterly shipments<strong>March</strong> 1, <strong>2010</strong>22
Positioned for long-term growth Strong balance sheet Company’s markets support long-term growth Strong research and development program Continually improving manufacturing capabilities Global footprint and value-add service centers Substantial available capacity<strong>March</strong> 1, <strong>2010</strong> 23
CashSources of Cash FY2005 to First Quarter FY<strong>2010</strong>At December 31, 2009 the Company had$97.5 million in cash generated primarilyfrom:◦ Cash from operations (approximately $160.6million from September 1, 2004 throughDecember 31, 2009)◦ FY2007 stock offering (approximately $78.9million)Uses of Cash FY<strong>2010</strong> to FY2014Strategic capital initiatives◦ $85.0 millionRegular quarterly dividend of $0.20 initiated◦ $9.7 million on annualized basisFunding of pension obligation◦ $53.2 million net of tax<strong>March</strong> 1, <strong>2010</strong>24
Capital improvements yield substantial benefitsCapital Expenditure ProjectsFiscal Years 2005 through 2009 - $75.8MMProcess Projects $MMMeltingAir MeltESR upgrade$0.97.1Investment has yielded, and willcontinue to yield, substantial benefits◦ Current finished capacity in excess of23.5mm lbs– Sheet finishing capacity increasedfrom 9.0 mm lbs to 14.0mm lbs (1)Hot Rolling Sheet Fin. Op. (1)4-Hi MKW 100 CR4.880 8.0– Titanium tubular capacity increasedby 42% (2)Anneal lines10.7 ◦ <strong>Inc</strong>reased efficiency/improved workingcapital managementTubular (2) Pilger mill 8.0Distribution (3) 50 5.0Wire Processing 2.7Routine 28.6Ttl Total $75.8Fiscal Years <strong>2010</strong> through 2014 - $85.0MMHot Rolling 4-Hi $30.0Process Center Distribution 10.00New Equipment &Upgrades25.0Routine 20.0Total $85.0◦ Reduced operating costs◦ Reduced maintenance costs◦ Improved quality◦ Reduction in unplanned outages◦ Distribution improvements (3)– Service center expansions– Acquisition of Chinese marketingcompany– Value added processing<strong>March</strong> 1, <strong>2010</strong> 25
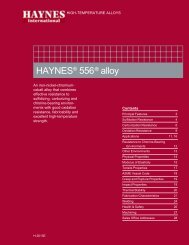
Manufacturing process and capital improvementsBasic StepsProduct FormAll products go through melt and re-meltRound/long products go through forging.This is our hot rolling process for sheetand plate (other than finishing)Product FormThe final process for coils and sheets<strong>March</strong> 1, <strong>2010</strong> 26
SummaryWe are a market leader in the niche high-performance alloy marketWe serve diverse geographic g and end marketsWe have long-term relationships with our broad customer baseOur unique business model facilitates strong customer service and retention◦ Service and sales centers◦ Value-added processing servicesOur development of patent-protected new alloys puts us in the position of market leaderWe continue to make strategic investments to expand product capability and servicesFinancially positioned to meet our challenges successfully and achieve our goal ofenhanced shareholder value<strong>March</strong> 1, <strong>2010</strong> 27
Appendix AReconciliation of Non-GAAP Financial Measures (Unaudited)In accordance with the SEC's Regulation G, the following provides definitions of the non-GAAP financial measures included in this presentation,together with the most directly comparable financial measures calculated in accordance with GAAP, and a reconciliation of the differences betweenthe non-GAAP financial measures disclosed and the most directly comparable financial measures calculated in accordance with GAAP.This non-GAAP financial information should be considered supplemental to, and not as a substitute for, or superior to, financial measures calculated inaccordance with GAAP. However, we believe that non-GAAP reporting, giving effect to the adjustments shown in the reconciliation contained in theattached financial statements, provides meaningful information and therefore we use it to supplement our GAAP guidance. We have chosen to providethis supplemental information to investors, analysts and other interested parties to enable them to perform additional analyses of operating results, toillustrate the results of operations giving effect to the non-GAAP adjustments shown in the reconciliations and to provide an additional measure ofperformance.The Company recorded a non-cash goodwill impairment charge in the second quarter of fiscal 2009. This type of charge has not occurred frequentlyand the Company believes that excluding this charge will provide investors with a basis to compare the Company's core operating results in differentperiods without this variability.Reconciliation of non-GAAP net income:Twelve Months EndedSeptember 30, 2009Net income (loss) excluding non-cash charge for goodwill impairment $ (9,453)Charge for goodwill impairment (43,737)3 Goodwill tax benefit 868Net income (loss) as reported $(52,322)Reconciliation of non-GAAP EPS:Earnings per share excluding non-cash charge for goodwill impairment $(0.78)Charge per share for goodwill impairment (3.65)Goodwill tax benefit 0.07Diluted income (loss) earnings per share $ (4.36)<strong>March</strong> 1, <strong>2010</strong> 28