alabama's working families and the broken promise of economic ...
alabama's working families and the broken promise of economic ...
alabama's working families and the broken promise of economic ...
- No tags were found...

You also want an ePaper? Increase the reach of your titles
YUMPU automatically turns print PDFs into web optimized ePapers that Google loves.
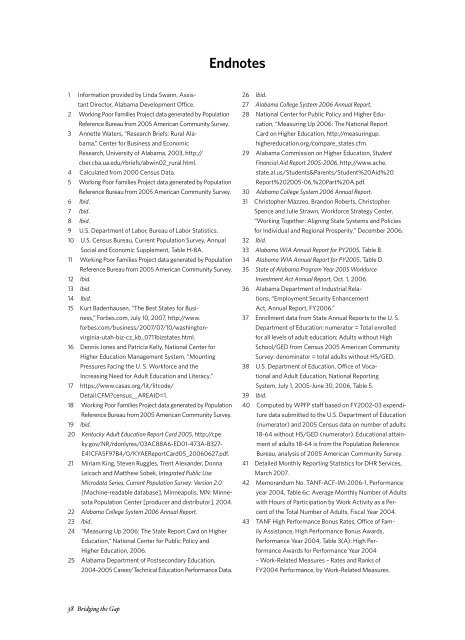
Endnotes1 Information provided by Linda Swann, AssistantDirector, Alabama Development Office.2 Working Poor Families Project data generated by PopulationReference Bureau from 2005 American Community Survey.3 Annette Waters, “Research Briefs: Rural Alabama,”Center for Business <strong>and</strong> EconomicResearch, University <strong>of</strong> Alabama, 2003, http://cber.cba.ua.edu/rbriefs/abwin02_rural.html.4 Calculated from 2000 Census Data.5 Working Poor Families Project data generated by PopulationReference Bureau from 2005 American Community Survey.6 Ibid.7 Ibid.8 Ibid.9 U.S. Department <strong>of</strong> Labor, Bureau <strong>of</strong> Labor Statistics.10 U.S. Census Bureau, Current Population Survey, AnnualSocial <strong>and</strong> Economic Supplement, Table H-8A.11 Working Poor Families Project data generated by PopulationReference Bureau from 2005 American Community Survey.12 Ibid.13 Ibid.14 Ibid.15 Kurt Badenhausen, “The Best States for Business,”Forbes.com, July 10, 2007, http://www.forbes.com/business/2007/07/10/washingtonvirginia-utah-biz-cz_kb_0711bizstates.html.16 Dennis Jones <strong>and</strong> Patricia Kelly, National Center forHigher Education Management System, “MountingPressures Facing <strong>the</strong> U. S. Workforce <strong>and</strong> <strong>the</strong>Increasing Need for Adult Education <strong>and</strong> Literacy.”17 https://www.casas.org/lit/litcode/Detail.CFM?census__AREAID=1.18 Working Poor Families Project data generated by PopulationReference Bureau from 2005 American Community Survey.19 Ibid.20 Kentucky Adult Education Report Card 2005, http://cpe.ky.gov/NR/rdonlyres/03AC88A6-ED01-473A-B327-E41CFA5F97B4/0/KYAEReportCard05_20060627.pdf.21 Miriam King, Steven Ruggles, Trent Alex<strong>and</strong>er, DonnaLeicach <strong>and</strong> Mat<strong>the</strong>w Sobek, Integrated Public UseMicrodata Series, Current Population Survey: Version 2.0[Machine-readable database], Minneapolis, MN: MinnesotaPopulation Center [producer <strong>and</strong> distributor], 2004.22 Alabama College System 2006 Annual Report.23 Ibid.24 “Measuring Up 2006: The State Report Card on HigherEducation,” National Center for Public Policy <strong>and</strong>Higher Education, 2006.25 Alabama Department <strong>of</strong> Postsecondary Education,2004-2005 Career/Technical Education Performance Data.26 Ibid.27 Alabama College System 2006 Annual Report.28 National Center for Public Policy <strong>and</strong> Higher Education,“Measuring Up 2006: The National ReportCard on Higher Education, http://measuringup.highereducation.org/compare_states.cfm.29 Alabama Commission on Higher Education, StudentFinancial Aid Report 2005-2006, http://www.ache.state.al.us/Students&Parents/Student%20Aid%20Report%202005-06,%20Part%20A.pdf.30 Alabama College System 2006 Annual Report.31 Christopher Mazzeo, Br<strong>and</strong>on Roberts, ChristopherSpence <strong>and</strong> Julie Strawn, Workforce Strategy Center,“Working Toge<strong>the</strong>r: Aligning State Systems <strong>and</strong> Policiesfor Individual <strong>and</strong> Regional Prosperity.” December 2006.32 Ibid.33 Alabama WIA Annual Report for PY2005, Table B.34 Alabama WIA Annual Report for PY2005, Table D.35 State <strong>of</strong> Alabama Program Year 2005 WorkforceInvestment Act Annual Report, Oct. 1, 2006.36 Alabama Department <strong>of</strong> Industrial Relations,“Employment Security EnhancementAct, Annual Report, FY2006.”37 Enrollment data from State Annual Reports to <strong>the</strong> U. S.Department <strong>of</strong> Education: numerator = Total enrolledfor all levels <strong>of</strong> adult education; Adults without HighSchool/GED from Census 2005 American CommunitySurvey: denominator = total adults without HS/GED.38 U.S. Department <strong>of</strong> Education, Office <strong>of</strong> Vocational<strong>and</strong> Adult Education, National ReportingSystem, July 1, 2005-June 30, 2006, Table 5.39 Ibid.40 Computed by WPFP staff based on FY2002-03 expendituredata submitted to <strong>the</strong> U.S. Department <strong>of</strong> Education(numerator) <strong>and</strong> 2005 Census data on number <strong>of</strong> adults18-64 without HS/GED (numerator). Educational attainment<strong>of</strong> adults 18-64 is from <strong>the</strong> Population ReferenceBureau, analysis <strong>of</strong> 2005 American Community Survey.41 Detailed Monthly Reporting Statistics for DHR Services,March 2007.42 Memor<strong>and</strong>um No. TANF-ACF-IM-2006-1, Performanceyear 2004, Table 6c: Average Monthly Number <strong>of</strong> Adultswith Hours <strong>of</strong> Participation by Work Activity as a Percent<strong>of</strong> <strong>the</strong> Total Number <strong>of</strong> Adults, Fiscal Year 2004.43 TANF High Performance Bonus Rates, Office <strong>of</strong> FamilyAssistance, High Performance Bonus Awards,Performance Year 2004, Table 3(A): High PerformanceAwards for Performance Year 2004– Work-Related Measures – Rates <strong>and</strong> Ranks <strong>of</strong>FY2004 Performance, by Work-Related Measures.38 Bridging <strong>the</strong> Gap