Forest cover and deforestation in Jamaica - the Forestry Department
Forest cover and deforestation in Jamaica - the Forestry Department
Forest cover and deforestation in Jamaica - the Forestry Department

You also want an ePaper? Increase the reach of your titles
YUMPU automatically turns print PDFs into web optimized ePapers that Google loves.
358 O.B. Evelyn <strong>and</strong> R. Camir<strong>and</strong><br />
<strong>in</strong> Table 5. The difference <strong>in</strong> areas between <strong>the</strong> TNC<br />
(Grossman et al. 1992; Li et al. 2000) <strong>and</strong> <strong>the</strong> FD-TFT<br />
(1999) analyses is what would be expected <strong>and</strong> can be<br />
expla<strong>in</strong>ed by <strong>the</strong> different systems that were used. Theses<br />
differences between <strong>the</strong> total forest area figures are not<br />
significant with only a 3% difference.<br />
The FD-TFT assessment found that, because of <strong>the</strong> size<br />
<strong>and</strong> mounta<strong>in</strong>ous nature of <strong>the</strong> isl<strong>and</strong>, <strong>the</strong> limitations <strong>in</strong><br />
image process<strong>in</strong>g <strong>and</strong> classification techniques of<br />
LANDSAT TM technology (Richards 1986; Schowengerdt<br />
1983), LANDSAT TM could only be used for broad<br />
national forest classification. The more detailed<br />
classification from <strong>the</strong>se broad types, which is needed for<br />
operational <strong>and</strong> forest management plans, require <strong>the</strong> use<br />
of aerial photographs. The classification system that was<br />
developed by <strong>the</strong> FD-TFT, <strong>the</strong> def<strong>in</strong>itions for <strong>the</strong> classes,<br />
<strong>and</strong> how <strong>the</strong>y correspond to both <strong>the</strong> TNC <strong>and</strong> <strong>the</strong> FAO<br />
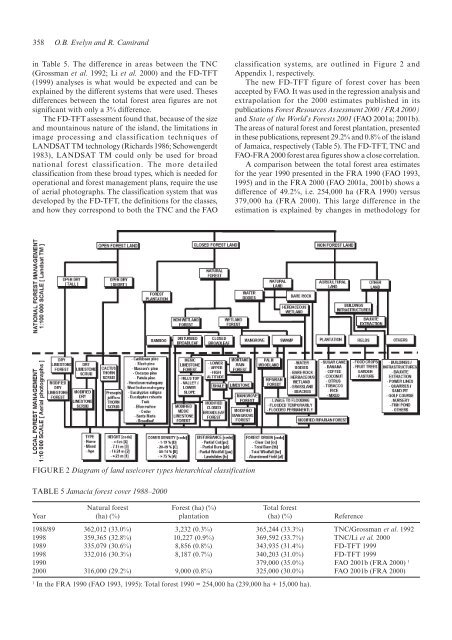
FIGURE 2 Diagram of l<strong>and</strong> use/<strong>cover</strong> types hierarchical classification<br />
TABLE 5 Jamacia forest <strong>cover</strong> 1988–2000<br />
classification systems, are outl<strong>in</strong>ed <strong>in</strong> Figure 2 <strong>and</strong><br />
Appendix 1, respectively.<br />
The new FD-TFT figure of forest <strong>cover</strong> has been<br />
accepted by FAO. It was used <strong>in</strong> <strong>the</strong> regression analysis <strong>and</strong><br />
extrapolation for <strong>the</strong> 2000 estimates published <strong>in</strong> its<br />
publications <strong>Forest</strong> Resources Assessment 2000 (FRA 2000)<br />
<strong>and</strong> State of <strong>the</strong> World’s <strong>Forest</strong>s 2001 (FAO 2001a; 2001b).<br />
The areas of natural forest <strong>and</strong> forest plantation, presented<br />
<strong>in</strong> <strong>the</strong>se publications, represent 29.2% <strong>and</strong> 0.8% of <strong>the</strong> isl<strong>and</strong><br />
of <strong>Jamaica</strong>, respectively (Table 5). The FD-TFT, TNC <strong>and</strong><br />
FAO-FRA 2000 forest area figures show a close correlation.<br />
A comparison between <strong>the</strong> total forest area estimates<br />
for <strong>the</strong> year 1990 presented <strong>in</strong> <strong>the</strong> FRA 1990 (FAO 1993,<br />
1995) <strong>and</strong> <strong>in</strong> <strong>the</strong> FRA 2000 (FAO 2001a, 2001b) shows a<br />
difference of 49.2%, i.e. 254,000 ha (FRA 1990) versus<br />
379,000 ha (FRA 2000). This large difference <strong>in</strong> <strong>the</strong><br />
estimation is expla<strong>in</strong>ed by changes <strong>in</strong> methodology for<br />
Natural forest <strong>Forest</strong> (ha) (%) Total forest<br />
Year (ha) (%) plantation (ha) (%) Reference<br />
1988/89 362,012 (33.0%) 3,232 (0.3%) 365,244 (33.3%) TNC/Grossman et al. 1992<br />
1998 359,365 (32.8%) 10,227 (0.9%) 369,592 (33.7%) TNC/Li et al. 2000<br />
1989 335,079 (30.6%) 8,856 (0.8%) 343,935 (31.4%) FD-TFT 1999<br />
1998 332,016 (30.3%) 8,187 (0.7%) 340,203 (31.0%) FD-TFT 1999<br />
1990 379,000 (35.0%) FAO 2001b (FRA 2000) 1<br />
2000 316,000 (29.2%) 9,000 (0.8%) 325,000 (30.0%) FAO 2001b (FRA 2000)<br />
1 In <strong>the</strong> FRA 1990 (FAO 1993, 1995): Total forest 1990 = 254,000 ha (239,000 ha + 15,000 ha).