Nicola Dickmann: - LIS
Nicola Dickmann: - LIS
Nicola Dickmann: - LIS

Create successful ePaper yourself
Turn your PDF publications into a flip-book with our unique Google optimized e-Paper software.
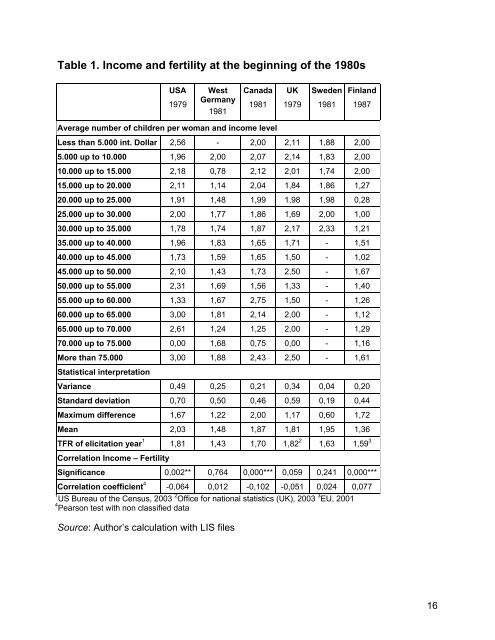
Table 1. Income and fertility at the beginning of the 1980sUSA1979WestGermany1981Canada1981UK1979Sweden1981Finland1987Average number of children per woman and income levelLess than 5.000 int. Dollar 2,56 - 2,00 2,11 1,88 2,005.000 up to 10.000 1,96 2,00 2,07 2,14 1,83 2,0010.000 up to 15.000 2,18 0,78 2,12 2,01 1,74 2,0015.000 up to 20.000 2,11 1,14 2,04 1,84 1,86 1,2720.000 up to 25.000 1,91 1,48 1,99 1,98 1,98 0,2825.000 up to 30.000 2,00 1,77 1,86 1,69 2,00 1,0030.000 up to 35.000 1,78 1,74 1,87 2,17 2,33 1,2135.000 up to 40.000 1,96 1,83 1,65 1,71 - 1,5140.000 up to 45.000 1,73 1,59 1,65 1,50 - 1,0245.000 up to 50.000 2,10 1,43 1,73 2,50 - 1,6750.000 up to 55.000 2,31 1,69 1,56 1,33 - 1,4055.000 up to 60.000 1,33 1,67 2,75 1,50 - 1,2660.000 up to 65.000 3,00 1,81 2,14 2,00 - 1,1265.000 up to 70.000 2,61 1,24 1,25 2,00 - 1,2970.000 up to 75.000 0,00 1,68 0,75 0,00 - 1,16More than 75.000 3,00 1,88 2,43 2,50 - 1,61Statistical interpretationVariance 0,49 0,25 0,21 0,34 0,04 0,20Standard deviation 0,70 0,50 0,46 0,59 0,19 0,44Maximum difference 1,67 1,22 2,00 1,17 0,60 1,72Mean 2,03 1,48 1,87 1,81 1,95 1,36TFR of elicitation year 1 1,81 1,43 1,70 1,82 2 1,63 1,59 3Correlation Income – FertilitySignificance 0,002** 0,764 0,000*** 0,059 0,241 0,000***Correlation coefficient 4 -0,064 0,012 -0,102 -0,051 0,024 0,0771 US Bureau of the Census, 2003 2 Office for national statistics (UK), 2003 3 EU, 20014 Pearson test with non classified dataSource: Author’s calculation with <strong>LIS</strong> files16